an assessment of service quality and resulting customer...
TRANSCRIPT

This work is licensed under a Creative Commons Attribution-NonCommercial 3.0 Unported License
Newcastle University ePrints - eprint.ncl.ac.uk
Ali F, Dey BL, Filieri R. An assessment of service quality and resulting
customer satisfaction in Pakistan International Airlines: Findings from
foreigners and overseas Pakistani customers. International Journal of Quality
& Reliability Management 2015, 32(5), 486-502.
Copyright:
The final version is available from Emerald Group Publishing
DOI link to article:
http://dx.doi.org/10.1108/IJQRM-07-2013-0110
Date deposited:
23/08/2016

1
An Assessment of Service Quality and Resulting Customer Satisfaction in Pakistan
International Airlines: Findings from Foreigners and Overseas Pakistani Customers
Introduction
Due to the fast changing business environment, customer demands and expectations are also
changing, resulting in a situation where many of the service-providing companies - especially
the airlines - have failed to keep their fingers on the pulse of the true needs and wants of their
passengers and still hold outdated views of what airline services are all about (Gustafsson et
al., 1999). Airline companies think of passengers’ needs from their own perspectives and
usually focus on cost reductions to achieve efficient operations; however, this may overlook
the quality of the services provided to their customers (Boland et al., 2002).
Pakistan International Airlines (PIA) was established in 1955 and since then it has
been Pakistan’s only airline. In 1982, the Pakistan Civil Aviation Authority (PCAA) was
created as a regulatory body to govern and align civil aviation activities in the country. The
newly-created CAA faced severe resistance from various professional cadres of PIA, which
resulted in a gradual but certain decline in standards in all areas of airline operations (Deen
and Irshad, 2007). In the early 1990s, the Government of Pakistan adopted an Open Skies
Aviation Policy and signed a memorandum of agreement with a number of countries within
and outside the region. These practices were carried out in great haste, without a real
understanding of the implications of “Open Skies” for Pakistan’s own carriers. PIA suddenly
found itself competing with outside carriers at home. The resultant chaos had a negative
impact on the state of the civil aviation sector of Pakistan in general, and the airline industry
in particular. The airline now has a low market share on these international routes and is also
losing market share on some others (Pirzada, 2011). Rival airlines, such as Fly Emirates on
Middle Eastern, Far Eastern, North African and Australian destinations and Lufthansa and
Dow
nloa
ded
by N
orth
umbr
ia U
nive
rsity
At 0
9:02
25
Mar
ch 2
015
(PT
)

2
British Airways on European and North American routes, are strongly competing with PIA
(Ali, 2010). These airlines are considered to be the market leaders and provide world class
services to their customers, whereas PIA is perceived to be lagging behind in terms of
providing high quality services. An unbiased analysis of the current aviation scene in
Pakistan reveals the harsh fact that foreigners and overseas Pakistanis lack confidence in PIA
in terms of value for money, reliability, etc. (Deen and Arshad, 2007).
There is consensus in the marketing literature that better service quality is a critical
success factor in this era of intense competition (Tsoukatos and Mastrojianni, 2010). Due to
the nature of services, evaluation of service quality has been the subject of many studies
(http://www.ophrd.gov.pk). Service quality’s conceptual and empirical link to customer
satisfaction has turned it into a core marketing instrument (Ahmed et al., 2010). Curiosity
over the measurement of service quality is therefore high and researchers have devoted a
great deal of attention to service quality research (Abdullah et al., 2007). But the service
quality of airlines has not been thoroughly evaluated (Park et al., 2005). As the nature of
services provided by airlines is a little different to other service industries, additional research
is needed to evaluate the service quality of PIA and its effects on customer satisfaction using
appropriate dimensions of service quality. The aim of this study, therefore, is to evaluate the
perceptions of foreigners and overseas Pakistani customers regarding the services provided
by PIA and the resulting customer satisfaction using the AIRQUAL scale. This market
segment is selected based on the argument that foreign nationals and non-resident Pakistanis
show a lack of confidence in PIA (Ali and Dey, 2011; Deen and Arshad, 2007; Khan et al.,
2011; Nawaz et al., 2012).
The present paper has been organised into five sections, starting with the introduction. Section
2 discusses the literature on service quality, its application to airline companies, and the scales
used to measure service quality in the airline industry. Section 3 explains the research
Dow
nloa
ded
by N
orth
umbr
ia U
nive
rsity
At 0
9:02
25
Mar
ch 2
015
(PT
)

3
methodology and Section 4 deals with the survey results. The last section concludes the paper
by discussing the results and the limitations of the study and providing recommendations for
future research.
Literature Review
Service Quality
Service quality is defined as “a function of [the] difference between [the] service expected
and [the] customer's perceptions of the actual service delivered” (Parasuraman et al., 1988,
p.13) and it has received intense research attention in services marketing (Caro and Garcia,
2007; Wu and Ko, 2013). A great deal of attention has been given to its measurement and
conceptualisation (Ali et al., 2013; Amin et al., 2013). An initial conceptualisation of service
quality was discussed by Parasuraman et al. (1985) as a function of the difference between
service expectations and customers’ perceptions of the actual service delivered. They
suggested that customers perceive the relative quality of services by comparing the actual
performance of the firm with their own expectations, shaped by experience, word of mouth
communications, and/or memories (Tsoukatos and Mastrojianni, 2010); this comparison is
referred to as perceived service quality (Parasuraman et al., 1988). In this context, Zeithaml
et al. (1996) posited that better understanding of customers’ expectations is significant in
delivering quality services.
In terms of service quality measurement, Parasuraman et al. (1985) proposed a model
with ten dimensions, including tangibles, reliability, responsiveness, understanding the
customers, access, communication, credibility, security, competence and courtesy. This
model was later modified by Parasuraman et al. (1988) and named the SERVQUAL scale,
which included five dimensions: tangibles, reliability, responsiveness, assurance and
empathy. The SERVQUAL scale has been widely applied by both academics and
practitioners across industries in different countries (Ali et al., 2013; Wu and Ko, 2013). It
Dow
nloa
ded
by N
orth
umbr
ia U
nive
rsity
At 0
9:02
25
Mar
ch 2
015
(PT
)

4
provides a comprehensive measurement scale for perceived service quality and has practical
implications (Ali et al., 2012; Amin et al., 2013; Parasuraman et al., 1994; Angur et al.,
1999). While SERVQUAL has been widely adopted by scholars in the airline industry
(Gilbert and Wong, 2003; Park et al., 2005), it has also been criticised, as it compares
customers’ expectations with customers’ perceptions of the services received (Buttle, 1996;
Cronin and Taylor, 1992; Robledo, 2001). Wu and Ko (2013) also suggested that
SERVQUAL provides a general guideline for service quality assessment in most of the
service contexts; however, its factors ought to be examined and determined in relation to
industry-specific issues. In this regard, Park et al., (2005) postulated that the particular issues
pertaining to the airline industry (e.g., ticketing, luggage allowance, on-board facilities)
would be different from those of other service industries. Various researchers studying the
airline industry observed that in this industry, customers’ expectations are shaped at the
‘moment-of-truth’ by the reservations department of the airline, telephone sales, ticketing,
cabin crew, cabin services, baggage handling, flight schedules and others (Archana and
Subha, 2012; Saha and Theingi, 2009; Nadiri et al., 2008; Ekiz et al., 2006; Prayag, 2007),
and Park et al. (2005) noted that the five-dimension twenty-two-item SERVQUAL scale is
not applicable to the airline industry because it does not consider industry (i.e. airline)
specific aspects of service quality.
Because of the huge criticism of the application of the SERVQUAL scale, several
researchers have used another service quality measurement scale, developed by Cronin and
Taylor (1992), which is known as SEVPERF. This model only considers customers’
perceptions of service provider’s performance to assess service quality (Cronin and Taylor,
1994). This scale has proved to be a better tool to measure service quality in the airline
industry, but it has also been criticised for assessing customer satisfaction related to a specific
transaction (Ostrowski et al., 1993). However, some scholars have also accused SERVPERF
Dow
nloa
ded
by N
orth
umbr
ia U
nive
rsity
At 0
9:02
25
Mar
ch 2
015
(PT
)

5
of being too generic and failing to capture industry-specific dimensions underlying
passengers’ perceptions of quality in the airline industry (Cunningham et al., 2004).
Consequently, a number of scholars have tried to propose models with dimensions of
service quality that are specific to the airline industry (e.g., Gourdin, 1988). For example, a
model presented by Gourdin (1988) categorised airline service quality into three aspects:
price, safety and timeliness. Similarly, Ostrowski et al. (1993) looked at timeliness, food and
beverage quality and comfort of seats in order to evaluate the service quality of airlines.
Truitt and Haynes (1994) used the check-in process, timeliness, cleanliness of seats, food and
beverage quality and customer complaints handling as the dimensions for measuring service
quality, whereas Chang and Yeh (2002) revised the five aspects of service quality presented
by Parasuraman et al. (1988), namely tangibility, reliability, responsiveness, assurance and
empathy. Park et al. (2005) also assessed airline service quality using three dimensions,
namely reliability and customer service, convenience and accessibility, and in-flight service.
A recent study conducted by Namukasa (2013) considered reliability, responsiveness and
discounts as dimensions of pre-flight service quality, tangibles, courtesy, and language skills
as dimensions of in-flight service quality and frequent flyer programs and timeliness as
dimensions of post-flight service quality when assessing service quality in the Ugandan
airline industry. Their findings indicated that pre-flight, in-flight and post-flight services had
a significant effect on passenger satisfaction. Moreover, Wu and Cheng (2013) adopted a
hierarchical structure and classified airline service quality into four primary dimensions,
namely interaction quality, physical environment quality, outcome quality and access quality,
with eleven sub-dimensions, namely conduct, expertise, problem-solving, cleanliness,
comfort, tangibles, safety and security, waiting time, valence, information and convenience.
They found that their measurement scale was psychometrically sound; however, the
theoretical and conceptual basis for understanding the nature of passengers’ perceptions of
Dow
nloa
ded
by N
orth
umbr
ia U
nive
rsity
At 0
9:02
25
Mar
ch 2
015
(PT
)

6
service quality in the airline industry is still in the developmental stage. Therefore, most of
the measurement models are insufficiently comprehensive to capture the service quality
construct in the air transport sector. Some of the key service quality attributes in the airline
industry are summarized in Table 1.
“Insert Table 1 Here”
In this regard, a comprehensive model to assess airline service quality – AIRQUAL –
was presented by Ekiz et al. (2006). This model comprised five distinct dimensions, namely
airline tangibles, terminal tangibles, personnel, empathy and image. This scale was later
validated by Nadiri et al. (2008), who also assessed AIRQUAL’s effects on customer loyalty
in North Cyprus; however, they suggested using this scale in other contexts to validate the
scale and generalise its results. Therefore, this study also adopts the AIRQUAL scale to
assess the service quality of PIA.
Customer Satisfaction
Kotler (2000, p. 36) defined satisfaction as “a person’s feeling of pleasure or disappointment
resulting from comparing a product’s perceived performance (or outcome) in relation to his
or her expectations”. It is a key focus of research in many tourism studies due to its
importance in determining the success and the continued existence of the tourism business
(Gursoy et al., 2007) and the benefits it brings to organizations (Ali and Zhou, 2013; Amin
and Nasharuddin, 2013; Weng and de Run, 2013; Ranaweera and Prabhu, 2003). The
importance of customer satisfaction is derived from the generally accepted philosophy that
for a business to be successful and profitable, it must satisfy its customers (Shin and Elliott,
Dow
nloa
ded
by N
orth
umbr
ia U
nive
rsity
At 0
9:02
25
Mar
ch 2
015
(PT
)

7
2001). Customer satisfaction has been defined as a feeling of the post consumption
experienced by the customers (Westbrook and Oliver, 1991; Um et al., 2006). In contrast to
the cognitive focus of perceptions, customer satisfaction is deemed an affective response to a
product or service (Yuan et al., 2005). Previous research has demonstrated that satisfaction is
strongly associated with re-purchase intentions (Cronin and Taylor, 1992). Customer
satisfaction also serves as an exit barrier, helping a firm to retain its customers (Amin et al.,
2013; Liang and Zhang, 2012). In addition, customer satisfaction also leads to favourable
word-of-mouth, which provides a valuable form of indirect advertising to an organization
(Park et al., 2005). Shin and Elliott (2001) concluded that, through satisfying customers,
organizations could improve profitability by expanding their business and gaining a higher
market share as well as repeat and referral business.
The concept of customer satisfaction and its implications in various industries have
been somewhat elusive due to the complex nature of people’s perceptions and evaluations
(Ali et al., 2012; Amin and Nasharuddin, 2013). For businesses in services industries,
achieving customer satisfaction is far more challenging. For instance, some services are
extremely complex in nature and involve multiple service encounter stages which have
bearings on the level of overall customer satisfaction (Han and Ryu, 2009). In the context of
studies on airlines companies, Archana and Subha (2012) state that airline service quality
dimensions - i.e., in-flight services, in-flight digital services, and airline back-office
operations - are significant predictors of passengers’ satisfaction and that this satisfaction
influences their loyalty and the airline’s image. Similarly, Abdullah et al. (2007) also found a
positive relationship between satisfaction and both future use of the airline and the likelihood
of recommending it to others. Therefore, in the airline industry, passengers’ satisfaction plays
an important role in measuring the quality of services and the likelihood that they will
Dow
nloa
ded
by N
orth
umbr
ia U
nive
rsity
At 0
9:02
25
Mar
ch 2
015
(PT
)

8
continue their relationship with the service providers (Archana and Subha, 2012; Lau et al.,
2011; Abdullah et al., 2007).
Service Quality and Customer Satisfaction
Scholars view service quality as an antecedent of customer satisfaction (Amin et al., 2013;
Parasuraman et al., 1985, 1988; McDougall and Levesque, 2000). In the airline industry,
Saha and Theingi (2009) found a significant relationship between airline service quality and
passenger satisfaction, meaning that the higher the perceived service quality, the higher was
the passenger satisfaction (Lau et al., 2011). On the contrary, when a customer is not
satisfied, he or she is more likely to switch to another airline and to not recommend the
airline to friends or family members (Abdullah et al., 2007).
Despite the general agreement on the definitions of perceived service quality and
satisfaction, their causal relationship is yet to be resolved (Saha and Theingi, 2009). Some
researchers have suggested customer satisfaction to be an antecedent of perceived service
quality (Bolton and Drew, 1991; Bitner, 1990), whereas others consider perceived service
quality as an antecedent of customer satisfaction (Oliver, 1997; Cronin and Taylor, 1992;
Parasuraman et al., 1988). In support of this view, Han et al. (2008) confirmed the antecedent
role of service quality with respect to customer satisfaction in various service industries
(airlines, banks, beauty salons, hospitals, hotels, mobile telephones). This study also adopts
the second school of thought and thus hypothesises that airline service quality significantly
influences passengers’ satisfaction.
This study adopts the AIRQUAL scale developed by Ekiz et al. (2006) to overcome the
psychometrical application problems of the existing service quality scales. This scale has five
distinct dimensions, namely airline tangibles, terminal tangibles, personnel, empathy, and
Dow
nloa
ded
by N
orth
umbr
ia U
nive
rsity
At 0
9:02
25
Mar
ch 2
015
(PT
)

9
image. Based on the literature support for service quality being a strong predictor of customer
satisfaction, the following hypotheses are developed to be tested in this study:
H1: Perceived quality related to airline tangibles will have a significant effect on customer
satisfaction.
H2: Perceived quality related to terminal tangibles will have a significant effect on customer
satisfaction.
H3: Perceived personnel related quality will have a significant effect on customer
satisfaction.
H4: Perceived empathy will have a significant effect on customer satisfaction.
H5: Perceived airline image will have a significant effect on customer satisfaction.
“Insert Figure 1 Here”
Research Methodology
Research Instrument
A survey instrument has been adopted and conducted among foreign and non-resident
customers of PIA. The survey instrument was adopted from Ekiz et al. (2006) and Westbrook
and Oliver (1991). A set of thirty-nine items were used in the questionnaire, comprising six
items for airline tangibles (ATANG), eleven items for terminal tangibles (TTANG), eight
items for personnel (PER), seven items for empathy (EMP), and three items for image (IMG).
Customer satisfaction (CSAT) was measured using four emotion-laden items as proposed by
Westbrook and Oliver (1991). A five-point Likert scale was used to reduce respondents’
frustration and increase response rate and quality, as suggested by Prayag (2007). A pre-test
was carried out to validate the survey instrument, which involved mailing twenty-five
customers who had travelled with PIA over the last twelve months, although only twelve
Dow
nloa
ded
by N
orth
umbr
ia U
nive
rsity
At 0
9:02
25
Mar
ch 2
015
(PT
)

10
questionnaires were returned. Based on the comments from the pilot study, a few minor
changes were made to the structure of the sentences.
Sample Design and Data Collection
The objective of this study is to measure passengers’ evaluation of the service quality of PIA,
focusing on non-resident Pakistanis and foreign nationals. To achieve this objective, the
target population for this study was defined as all passengers having flown with PIA in the
last twelve months. The survey was conducted face-to-face in the waiting lounges of
Manchester Airport and Birmingham Airport in November and December 2012. A self-
administered survey was used to collect the data. A convenience sample was drawn for the
survey. Sampling was conducted by distributing questionnaires to passengers at different
times of the day over an eight-week period. In order to reduce the refusals to participate in the
survey, the researcher contacted the passengers and explained the purpose of the research.
The data was gathered from Pakistan International Airlines passengers, specifically foreign
nationals and non-resident Pakistanis. The reason for selecting these two groups was that they
make up a major proportion of PIA customers on international routes and it is thus important
to know their perceptions. A total of 848 questionnaires were distributed, of which 498
questionnaires were handed back, constituting a response rate of 58%. This response rate is
higher than the previous studies on service quality in the airline industry, which achieved
response rates of between 30% and 50% using similar data collection methods (Prayag,
2007).
Analytical Methods
Dow
nloa
ded
by N
orth
umbr
ia U
nive
rsity
At 0
9:02
25
Mar
ch 2
015
(PT
)
11
The collected data was analysed using SPSS Statistics 20 and AMOS 20. Following the
procedure suggested by Anderson and Gerbing (1988), a measurement model was estimated
before the structural model. A confirmatory factor analysis (CFA) was employed to assess the
measurement model and to test data quality, including reliability and construct validity
checks. Structural equation modelling (SEM) was conducted to assess the overall fit of the
proposed model and test the hypotheses. The reason for using SEM is because it is capable of
estimating a series of inter-relationships among latent constructs simultaneously in a model
while also dealing with the measurement errors in the model (Nachtigall et al., 2003).
Moreover, SEM is an efficient analytical method to handle the Confirmatory Factor Analysis
(CFA) for measurement models, analyse the causal relationships among latent constructs in a
structural model, estimating their variance and covariance, and test the hypotheses in a model
simultaneously (Awang, 2011; Nachtigall et al., 2003).
Data Analysis
The discussion of the research findings begins with a brief demographic profile of
respondents in terms of gender, age, education level, and purpose of visit. Sixty percent of the
respondents were male whereas 40% of them were female. Most of the respondents (55%)
were aged between 21 and 30 years. Regarding the education level, 38% of the respondents
were studying for Masters’ degrees and 29% of them had bachelors’ degrees. Regarding the
purpose of their journeys, about 59% mentioned that they were travelling for education
purposes. The passenger profiles are presented in Table 2. The distribution in terms of
gender, age, education level, and purpose of travel seem reasonable. A non-response analysis
using wave analysis was conducted (Rylander et al., 1995). Responses that were collected in
November, 2012 were grouped as early responses, whereas those collected in December,
2012 were grouped as late responses. An independent t-test was conducted which revealed no
Dow
nloa
ded
by N
orth
umbr
ia U
nive
rsity
At 0
9:02
25
Mar
ch 2
015
(PT
)

12
significant difference between the two groups, i.e., early responses and late responses. Based
on this, it was concluded that the sample did not suffer from non-response bias (Cobanoglu et
al., 2011).
“Insert Table 2 Here”
Common method bias test
The common method bias implies that the covariance among measured items is driven by the
fact that some or all of the responses are collected with the same type of scale (Hair et al.,
2006). To determine the presence of common method variance bias among the study
variables, a Harman’s (1967) one-factor test was performed following the approach outlined
by Podsakoff et al. (2003). All the items of this study were entered into a principal
component analysis with Varimax rotation to see if a single factor emerged from the factor
analysis or one general factor accounted for more than 50% of the co-variation. The results
extracted six dimensions from thirty-nine items and the accumulated variation explained was
31%, and thus this study did not have a serious problem with common method variance.
Measurement Model
The purpose of a measurement model is to describe how well the observed indicators serve as
a measurement instrument for the latent variables (Amin et al., 2013). To assess the
measurement model, a CFA model for airline service quality and customer satisfaction was
constructed using the collected data. Based on the results of the CFA, six items were deleted
because of low factor loadings and low squared multiple correlations. These items were TT3,
TT4, TT6, TT11, P3 and E5. According to Hair et al., (2006), 20% of the items can be
deleted because of low factor loadings. The results of CFA on the remaining items satisfied
the conditions of model fit (χ2 = 902.726, df = 298, p<.001; χ
2/df = 3.02 GFI = 0.91, RMSEA
Dow
nloa
ded
by N
orth
umbr
ia U
nive
rsity
At 0
9:02
25
Mar
ch 2
015
(PT
)

13
= 0.060, and CFI = 0.93). Consequently, this measurement model was used for further
analyses.
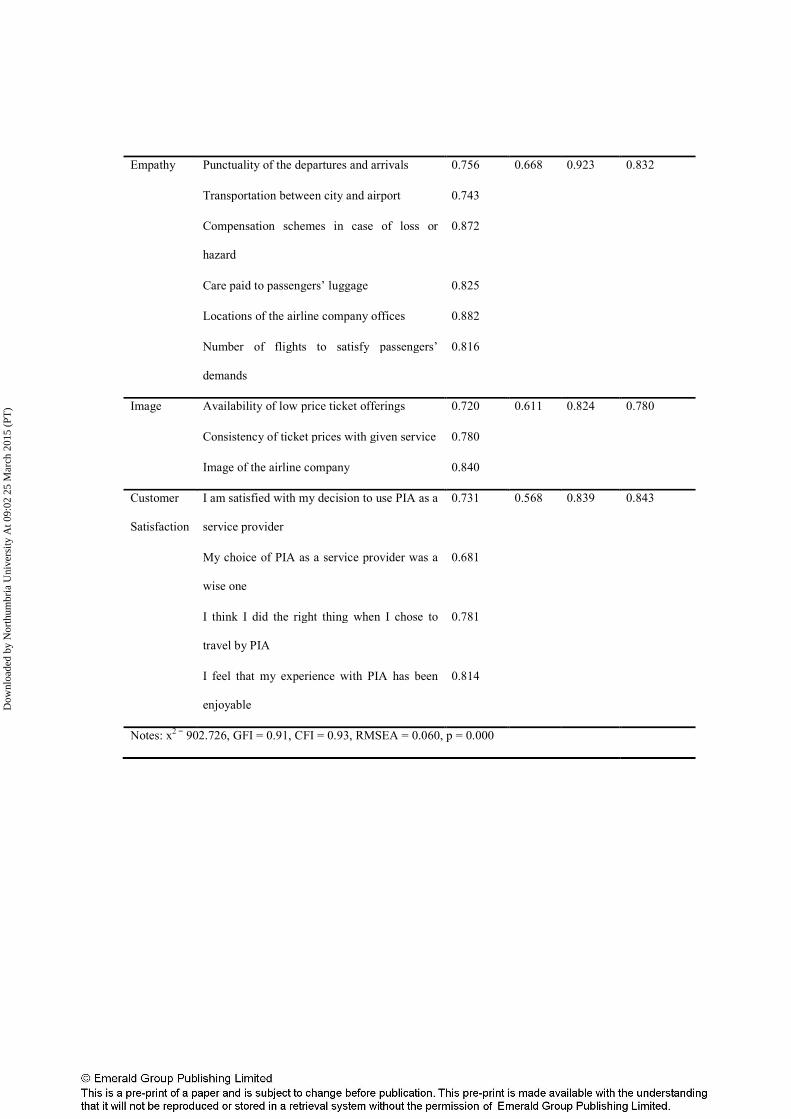
Table 3 shows the results of the CFA for airline service quality and customer
satisfaction for the remaining thirty-three items related to five dimensions of service quality
and customer satisfaction. All standardized factor loadings that emerged were fairly high and
significant, ranging from 0.71 to 0.88 (Hair et al., 2006), which suggests convergence of the
indicators with the appropriate underlying factors (Anderson and Gerbing, 1988). Table 3
also shows the Composite Reliability (CR) and Cronbach’s alpha values, which were well
above the 0.70 level suggested by Nunnally (1978). The average variance extracted (AVE)
values for each construct were also all above 0.50. Overall, these results showed strong
evidence of the uni-dimensionality, reliability, and validity of the measures.
“Insert Table 3 Here”
Discriminant validity of the constructs is shown in Table 4. The diagonal in Table 4
shows that the square root of the AVE between each pair of factors was higher than the
correlation estimated between factors, thus ratifying its discriminant validity (Hair et al.,
2006).
“Insert Table 4 Here”
Structural Model
To estimate the parameters, a structural model of airline service quality and customer
satisfaction was constructed. The aim of constructing a structural model was to test whether
the five dimensions of airline service quality have a significant influence over customer
satisfaction. The results show that chi square is significant (χ² / df = 2.64, ρ = 0.000; GFI =
Dow
nloa
ded
by N
orth
umbr
ia U
nive
rsity
At 0
9:02
25
Mar
ch 2
015
(PT
)

14
0.90, CFI = 0.94l; RMSEA = 0.06). The model had an RMSEA value of 0.06, which is also
within the required range and is considered satisfactory. The structural results of the proposed
model are depicted in Figure 2.
“Insert Figure 2 Here”
The results indicate that airline tangibles (β = 0.608; t-value = 3.998; p = 0.03) and terminal
tangibles (β = 0.411; t-value = 2.366; p = 0.000) exert a significant effect on customer
satisfaction, thus supporting hypotheses 1 and 2. Meanwhile H3 stated that personnel
significantly influence customer satisfaction. The results in Table 4 indicate that personnel
have a significant effect on customer satisfaction (β = 0.500; t-value = 4.603; p = 0.000), and
thus, H3 is supported. Similarly, the findings of this study also support H4, which proposes
the significant influence of empathy on customer satisfaction (β = 0.391; t-value = 2.137; p =
0.02). Lastly, H5 hypothesised that there is a relationship between Image and customer
satisfaction. The results shown in Table 4 support this hypothesis (β = 0.558; t-value = 4.617;
p = 0.000). Table 5 presents a summary of the hypothesis testing.
“Insert Table 5 Here”
Discussion, Implications and Future Research
The service industry is one of the most important sectors these days, especially when
considering service quality as an important tool in enabling organizations to differentiate
themselves in a very challenging environment (Olorunniwo et al., 2006; Ekiz et al., 2006).
This argument also holds true in the airline industry, where deregulations and intense
competition are forcing the service providers to improve their service quality in order to
satisfy their customers (Nadiri et al., 2008), and PIA is no exception. The present study aimed
to assess the service quality of PIA by employing the AIRQUAL scale developed by Ekiz et
Dow
nloa
ded
by N
orth
umbr
ia U
nive
rsity
At 0
9:02
25
Mar
ch 2
015
(PT
)
15
al. (2006) and investigate its effect on passengers’ satisfaction. Based on the fieldwork and
recent government reports, it was found that respondents are complaining about many issues
related to PIA (Pirzada, 2011), which motivated the researchers to replicate such a study. The
results of this study indicated that all of the hypotheses are supported and customer
satisfaction of PIA customers is influenced by all of the service quality dimensions, namely
airline tangibles, terminal tangibles, personnel, empathy and image (Nadiri et al., 2008; Ekiz
et al., 2006). This study contributes to airline service quality literature, as we have provided a
cross-country validation of the AIRQUAL scale, which has been tested with foreign and
overseas Pakistani customers at PIA.
The present study has provided evidence of the fact that improving the tangibility of aircraft
and terminals will lead to improved customer satisfaction. The findings are in line with
previous studies. For example, Prayag (2007) observed that tangibility is the factor that
explains a high percentage of the variance in passengers’ ratings of satisfaction levels with
airline service quality. However, in their study, the service tangibles had a lower predicting
power than did empathy, while in this study, the service tangibles are a stronger predictor of
customer satisfaction. Similarly, Saha and Thiengi (2009) also stated that tangibility, as a
construct of airline service quality, creates satisfaction and fosters positive word-of-mouth.
This study has also shown that a better quality of interaction with personnel will result in
improved customer satisfaction. These findings support the results of previous studies, such
as the work of Saha and Thiengi (2009), who observed the flight attendants and ground staff
were significant contributors to customer satisfaction. Consistent with previous studies, this
research has also provided evidence for the influence of empathy on customer satisfaction
(Cunningham et al., 2002; Prayag, 2007). For example, Prayag (2007) stated that empathy
significantly influences passengers’ satisfaction with airline service quality. Additionally, we
found a significant relationship between brand image and customer satisfaction. This result is
Dow
nloa
ded
by N
orth
umbr
ia U
nive
rsity
At 0
9:02
25
Mar
ch 2
015
(PT
)

16
in line with the findings of Nadiri et al. (2008), who also observed the significant influence of
image on customer satisfaction for the North Cyprus national airline.
In terms of the practical implications of this study for PIA, its efforts to improve the quality
of its services should start with a strategy of service differentiation. Considering the rapid
growth of competition in air transportation from and to Pakistan, the results of this study will
be useful to practitioners by informing them about the most important service quality
dimensions to leverage to improve the quality of transport services at PIA.
The company should be able to create high perceptions using tangible cues such as aircraft’s
exterior and interior appearance and terminal appearance, and should also recruit and train
human resources to provide a personalised service and ensure empathy, which seem to be
highly important to customers. Customers expect personalised service, reliable employees
and personal warmth in the service delivery, and those elements will ultimately make the
customers more satisfied with the service purchased. Moreover, PIA should update their
catering service facilities, as this is one of the major components of service quality in airlines.
Additionally, we recommend efficient technical maintenance of the aircrafts to be done at
regular intervals and effective cargo handling procedures in order to develop the airline’s
image of being safe and reliable.
It should be noted that although the results of the current study shed light on several
important issues, some limitations need to be considered. First, the sample size for this study
was relatively small compared to the target population. A larger sample is needed to further
validate the study. Passengers other than overseas Pakistanis and foreigners should be
surveyed to provide a more holistic picture of service quality at PIA. Sampling techniques
other than convenience sampling should be used in order to get a more representative sample.
Additional studies with other companies in the same industry should be conducted to increase
the opportunity to make comparisons and gain further insights.
Dow
nloa
ded
by N
orth
umbr
ia U
nive
rsity
At 0
9:02
25
Mar
ch 2
015
(PT
)

17
References
Abdullah, K., Manaf, N. H. A., and Noor, K. M. (2007), “Measuring The Service Quality of
Airline Services in Malaysia,” IIUM Journal of Economics and Management, Vol.
15 No. 1, pp. 1-29.
Ahmed, I., Nawaz, M.M., Usman, A., Shaukat, M.Z., Anmed, N., and Rehman, W., (2010),
“A mediation of customer satisfaction relationship between service quality and
repurchase intentions for the telecom sector in Pakistan: A case study of university
students,” African Journal of Business Management, Vol. 4 No. 16, pp. 3457-3462.
Ali, F. and Dey, B. L., (2011), “Is PIA (Pakistan International Airlines) up to the mark? An
assessment of its Service Quality and Resulting Customer Satisfaction”, Germany:
VDM Verlag Dr. Muller Publishing.
Ali, F. and Zhou, Y., (2013), “An Assessment of the Perceived Service Quality: Comparison
of Islamic and Conventional Banks at Pakistan”. International Journal of Innovation
and Business Strategy, Vol. 2 [Online] Avaliable at:
<http://www.ibs.utm.my/ijibs/index.php/ijibs/pages/view/current> [Accessed 20
August 2013]
Ali, F., Khan, A. and Rehman, F., (2012), “An Assessment of the Service Quality Using Gap
Analysis: A Study Conducted at Chitral, Pakistan”. Interdisciplinary Journal of
Contemporary Research in Business, Vol. 4, No. 3, pp. 259-266.
Ali, F., Omar, R., and Amin, M., (2013). “An examination of the relationships between
physical environment, perceived value, image and behavioural Intentions: A SEM
approach towards Malaysian resort hotels”. Journal of Hotel and Tourism
Management, Vol. 27, No. 2, pp. 9-26.
Dow
nloa
ded
by N
orth
umbr
ia U
nive
rsity
At 0
9:02
25
Mar
ch 2
015
(PT
)

18
Amin, M., and Nasharuddin, S. Z. (2013), “Hospital service quality and its effects on patient
satisfaction and behavioural intention,” Clinical Governance: An International
Journal, Vol. 18 No. 3, pp. 238-254.
Amin, M., Yahya, Z., Ismayatim, W.F.A., Nasharuddin, S.Z., and Kassim, E. (2013),
“Service Quality Dimension and Customer Satisfaction: An Empirical Study in the
Malaysian Hotel Industry,” Services Marketing Quarterly, Vol. 34 No. 2, pp. 115-
125.
Anderson, J., and Gerbing, W. (1988), “Structural equation modelling in practice: A review
and recommended two stage approach,” Psychological Bulletin, Vol. 27 No. 1, pp.
5-24.
Angur, M.G., Nataraajan, R, and Jahera, J.S. (1999), “Service Quality in the banking
industry: an assessment in a developing economy,” International Journal of Bank
Marketing, Vol. 17 No. 3, pp. 116-123.
Archana, R., and Subha, M. V. (2012). “A Study on Service Quality and Passenger
Satisfaction on Indian Airlines”, International Journal of Multidisciplinary
Research, Vol. 2 No. 2, pp. 50 – 63.
Awang, Z., (2011), “A handbook on SEM: Structural equation modelling”. (2nd ed.).
Kelantan: Universiti Teknologi MARA
Babbar, S., and Koufteros, X. (2008), “The human element in airline service quality: contact
personnel and the customer”, International Journal of Operations & Production
Management, Vol. 28 No. 9, pp. 804 – 830.
Bitner, M. J. (1990), “Evaluating service encounters–the effects of physical surroundings and
employee response,” Journal of Marketing, Vol. 54 No.2, pp. 69–82.
Boetsch, T., Bieger, T. and Wittmer, A. (2011). A Customer-Value Framework for
Analyzing Airline Services. Transportation Journal, Vol. 50 No. 03, pp. 251-270,
Dow
nloa
ded
by N
orth
umbr
ia U
nive
rsity
At 0
9:02
25
Mar
ch 2
015
(PT
)

19
Boland, D., Morrison, D. and O’Neill, S. (2002), “The future of CRM in the airline industry:
A new paradigm for customer management”, IBM Institute for Business Value.
Bolton, R. N. and Drew, J.H. (1991), “A Multi-Stage Model of Customers' Assessments of
Service Quality and Value”, Journal of Consumer Research, Vol. 17 No. 4, pp. 375-
384.
Buttle, F. (1996), “SERVQUAL: Review, critique, research agenda”. European Journal of
Marketing, Vol. 30 No. 1, pp. 8-32.
Caro, L. M., and García, J. A. M. (2007), “Measuring perceived service quality in urgent
transport service”, Journal of Retailing and Consumer Services, Vol. 14, No.1, pp.
60-72.
Chang, Y.-H. and Yeh, C.-H. (2002), “A survey analysis of service quality for domestic
airlines,” European Journal of Operational Research, Vol. 139 (1), pp. 166-177
Cobanoglu, C., Berezina, K., Kasavana, M. L., and Erdem, M., (2011), “The impact of
technology amenities on hotel guest overall satisfaction”. Journal of Quality
Assurance in Hospitality & Tourism, Vol. 12, No. 4, pp. 272-288.
Cronin Jr, J. J., and Taylor, S. A. (1994), “SERVPERF versus SERVQUAL: Reconciling
performance-based and perceptions-minus-expectations measurement of service
quality,” Journal of Marketing, Vol. 58 No. 1, pp.125-131.
Cronin, J. and Taylor, S.A. (1992), “Measuring service quality: a re-examination and
extension,” Journal of Marketing, Vol. 56, July, pp. 55-67.
Cunningham, L. F., Young, C. E., and Lee, M. (2004), “Perceptions of airline service quality
pre and post 9/11,” Public Works Management & Policy, Vol. 9 No. 1, pp. 10-25.
Deen, H., and Irshad, S. (2007), “Challenges for the Commercial Airline Industry in
Pakistan” Market Forces, Karachi, Pakistan.
Dow
nloa
ded
by N
orth
umbr
ia U
nive
rsity
At 0
9:02
25
Mar
ch 2
015
(PT
)

20
Ekiz, H.E., Hussain, K. and Bavik, A. (2006), “Perceptions of service quality in North
Cyprus national airline”, Tourism and Hospitality Industry 2006 – New Trends in
Tourism and Hospitality Management, Proceedings of 18th Biennial International
Conference, Croatia: Faculty of Tourism and Hospitality Management, Opatija, May
3-5, Vol. 03-05, pp. 778-90.
Fornell, C., and Larcker, D. F., (1981), “Evaluating Structural Equation Models with
Unobservable Variables and Measurement Error”, Journal of Marketing Research,
Vol. 18 No.1, pp. 39–50.
Gilbert, D. and Wong, R.K.C. (2003), “Passenger expectations and airline services: a Hong
Kong based study,” Tourism Management, Vol. 24 No.5, pp. 519–532
Gourdin, K. (1988), “Bringing quality back to commercial travel,” Transportation Journal,
Vol. 27 No.3, pp. 23-29.
Gursoy, D., McCleary, K. W., and Lepsito, L. R. (2007), “Propensity to Complain: Affects of
Personality and Behavioural Factors,” Journal of Hospitality & Tourism Research,
Vol. 31 No.3, pp. 358-386.
Gustafsson, A., Ekdahl, F., and Edvardsson, B. (1999), ”Customer focused service
development in practice: A case study at Scandinavian Airlines System (SAS)”,
International Journal of Service Industry Management, Vol. 10 No.4, pp. 344-358.
Hair, J.F., Black, W.C., Babin, B.J., Anderson, R.E., & Tatham, R.L. (2006). Multivariate
Data Analysis (6th ed.). Upper Saddle River, NJ: Prentice-Hall.
Han, H., and Ryu, K. (2009), “The roles of the physical environment, price perception, and
customer satisfaction in determining customer loyalty in the restaurant
industry”, Journal of Hospitality & Tourism Research, Vol. 33 No. 4, pp. 487-510.
Dow
nloa
ded
by N
orth
umbr
ia U
nive
rsity
At 0
9:02
25
Mar
ch 2
015
(PT
)

21
Han, X., Kwortnik, R., and Wang, C. (2008), “Service Loyalty: An integrated model and
examination across service contexts“, Journal of Service Research, Vol. 11 No.1,
pp. 22-42.
Harman, H., (1967), “Modern Factor Analysis”. Chicago, IL: University of Chicago Press.
Howat, G., Absher, J., Crilley, G., Milne, I. (1996), “Measuring customer service quality in
sports and leisure centers,” Managing Leisure, Vol. 1 No. 2, pp. 77- 89.
Khan, M., Yaqub, M., Faisal, F. and Khan, M., (2011), “Privatization in Emerging Markets:
Pakistan’s Perspective”. Interdisciplinary Journal of Research in Business, Vol. 4,
No. 1, pp. 101-106.
Kotler, P. (2000), Marketing Management, The Millennium Edition, Upper Saddle River, NJ:
Prentice-Hall.Lau, T. C., Kwek, C. L., and Tan, H. P., (2011), “Airline e-Ticketing
Service: How e-Service Quality and Customer Satisfaction Impacted Purchase
Intentions,” International Business Management, Vol. 5 No. 4, pp. 200-208
Liang, R. D., and Zhang, J. S., (2012), “The effect of service interaction orientation on
customer satisfaction and behavioral intention: the moderating effect of dining
frequency,” Asia Pacific Journal of Marketing and Logistics, Vol. 24 No. 1, pp. 153
– 170.
Ling, F.I., Lin, K. and Lu, J.L. (2005), “Difference in service quality of cross-strait airlines
and its effect on passengers’ preferences”, Journal of Eastern Asia Society for
Transportation Studies, Vol. 6, pp. 798-813
Liou, J.J.H.,. & Tzeng. G.H. (2007), “A. non-additive model for evaluating airline service
quality,” Journal of Air Transport Management, Vol. 13 No.3, pp. 131–38
McDougall, G. H. G., Levesque, T., (2000), “Customer satisfaction with services: putting
perceived value into the equation”, Journal of Services Marketing, Vol. 14 No.5, pp.
392 – 410.
Dow
nloa
ded
by N
orth
umbr
ia U
nive
rsity
At 0
9:02
25
Mar
ch 2
015
(PT
)

22
Mustafa, A., Jia-Pei, F., Siaw-Peng, L., & Hamid, H. (2005). “The evaluation of Airline
Service Quality using the Hierarchy process (Ahp)”. International Conference of
Tourism Development, Grand Plaza Parkroyal, Penang, 9-11 January.
Nadiri, H., Hussain, K., Ekiz, E. H., Erdogan, S., (2008), “An investigation on the factors
influencing passengers' loyalty in the North Cyprus national airline”, The TQM
Journal, Vol. 20 No.3, pp. 265 – 280.
Namukasa, J. (2013), “The influence of airline service quality on passenger satisfaction and
loyalty: The case of Uganda airline industry,” The TQM Journal, Vol. 25 No. 5, pp.
520-532.
Nawaz, N., Manzoor, S., Jahanian, A. and Mumtaz, R., (2012), “Factors Underlying the
Failure of Organizations: A Focus on Pakistan International Airlines”. Journal of
Law, Policy and Globalization, Vol. 6, No.1, pp. 1-7.
Nunnally, J. C. (1978). Psychometric Theory. New York, NY: McGraw-Hill.
Nachtigall, C., Kroehne, U., Funke, F., and Steyer, R., (20030, “(Why) Should We Use
SEM? Pros and Cons of Structural Equation Modelling”. Methods of Psychological
Research Online, Vol. 8, No. 2, pp. 1-22
Oliver, R. L. (1997), Satisfaction: A behavioral perspective on the consumer. New York:
McGraw- Hill.
Olorunniwo, F., Hsu, M. K., & Udo, G. J., (2006), “Service quality, customer satisfaction,
and behavioral intentions in the service factory”, Journal of Services Marketing,
Vol. 20 No. 1, pp. 59 – 72.
Ostrowski, P.L., O’Brien T.V., and Gordon, G.L. (1993), “Service quality and customer
loyalty in the commercial airline industry,” Journal of Marketing. Vol. 22 No. 2,pp.
16-24.
Dow
nloa
ded
by N
orth
umbr
ia U
nive
rsity
At 0
9:02
25
Mar
ch 2
015
(PT
)

23
Parasuraman, A., Berry, L.L. and Zeithaml, V.A. (1985), “A conceptual model of service
quality and its implications for future research”, Journal of Marketing, Vol. 49 No.
4, pp. 41-50.
Parasuraman, A., Berry, L.L. and Zeithaml, V.A. (1988), “SERVQUAL: a multiple-item
scale for measuring consumer perceptions of service quality”, Journal of Retailing,
Vol. 4 No. 1, pp. 12-37.
Parasuraman, A., Zeithaml, V.A. and Berry, L.L. (1994), “Alternative scales for measuring
service quality: a comparative assessment based on psychometric and diagnostic
criteria”, Journal of Retailing, Vol. 70 No. 3, pp. 201-29.
Park, J. W., Robertson, R. and Wu, C.-L. (2005), “Investigating the effects of service quality
on airline image and behavioural intentions: Findings from Australian international
air passengers”, Journal of Tourism Studies, Vol. 16 No. 1, pp. 2-11.
Pirzada, A.J. (2011), “Draft: Role of Connectivity in Growth Strategy of Pakistan, Planning
Commission”, Government of Pakistan. Avaliable at: <
www.pc.gov.pk/feg/PDFs/Connectivity_final_report.pd> [Accessed 20 August
2013].
Podsakoff, P. M., MacKenzie, S. B., Lee, J. Y., and Podsakoff, N. P. (2003), “Common
method biases in behavioral research: A critical review of the literature and
recommended remedies”, Journal of Applied Psychology, Vol. 88 No. 5, pp. 879–
903.
Prayag, G. (2007), “Assessing international tourists’ perceptions of service quality at Air
Mauritius,” International Journal of Quality & Reliability Management, Vol. 24 No.
5, pp. 492-514.
Dow
nloa
ded
by N
orth
umbr
ia U
nive
rsity
At 0
9:02
25
Mar
ch 2
015
(PT
)

24
Ranaweera, C., & Prabhu, J. (2003), The influence of satisfaction, trust and switching barriers
on customer retention in a continuous purchasing setting. International Journal of
Service Industry Management, Vol. 14 No. 4, pp. 374-395.
Rust, R.T. and Oliver, R.L. (1994), Service Quality – New Directions in Theory and Practice,
Sage Publications, New York, NY.
Rylander, R. G., Propst, D. B., and McMurtry, T. R. (1995), “Nonresponse and recall biases
in a survey of traveller spending”. Journal of Travel Research, Vol. 33, No. 4, pp.
39–45.
Saha, G.C., and Theingi, (2009), “Service quality, satisfaction, and behavioural intentions: A
study of low-cost airline carriers in Thailand”, Managing Service Quality, Vol. 19
Iss: 3, pp. 350 - 372
Shaw, S. (2007), Airline Marketing and Management, 6th
edition, Ashgate Publishing, UK.
Shin, D. and Elliott, K. (2001), “Measuring customers’ overall satisfaction: a multi-attributes
assessment,” Services Marketing Quarterly, Vol. 22 No. 1, pp. 3-20.
Teichert, T., Shehu, E. & von Wartburg, I. (2008), “Customer segmentation revisited: The
case of the airline industry”, Transportation Research Part A: Policy and Practice,
Vol. 42 No. 1, pp. 227-242.
Tiernan, S., Rhoades, D.L & Waguespack Jr, B. (2008). “Airline Service Quality:
Exploratory analysis of consumer perceptions and operational performance in the
USA and EU”, Managing Service Quality, Vol. 18 No. 3, pp. 212-224.
Truitt, L. and Haynes, R. (1994), “Evaluating service quality and productivity in the regional
airline industry”, Transportation Journal, Vol. 33 No. 4, pp. 21-32
Tsaur, S., Chang, T. & Yen, C. (2002), « The evaluation of airline service quality by fuzzy
MCDM”, Tourism Management, Vol. 23 No. 2, pp. 107-115.
Dow
nloa
ded
by N
orth
umbr
ia U
nive
rsity
At 0
9:02
25
Mar
ch 2
015
(PT
)

25
Tsoukatos, E., and Mastrojianni, E., (2010), “Key determinants of service quality in retail
banking”, EuroMed Journal of Business, Vol. 5 No.1, pp. 85-100.
Um, S., Chon, K., & Ro, Y. (2006),“Antecedents of revisit intention”, Annals of Tourism
Research, Vol. 33 No. 4, pp. 1141-1158.
Weng, J. T., & de Run, E. C. (2013). “Consumers’ personal values and sales promotion
preferences effect on behavioral intention and purchase satisfaction for consumer
product“, Asia Pacific Journal of Marketing and Logistics, Vol. 25 No. 1, pp. 70 -
101.
Westbrook, R. & Oliver, R. (1991), “The dimensionality of consumption emotion patterns
and consumer satisfaction”, Journal of Consumer Research, Vol. 18 No. 1, pp. 84-
91.
Wu, H.C., and Cheng, C.C., (2013), “A hierarchical model of service quality in the airline
industry”, Journal of Hospitality and Tourism Management, Vol. 20, No. 3, pp. 13-
22
Wu, H.C., and Ko, Y.J., 2013, “Assessment of Service Quality in the Hotel Industry”,
Journal of Quality Assurance in Hospitality & Tourism, 14(3), pp. 218-244,
Yuan, J., Cai, L., Morrison, A., & Linton, S. (2005), “An analysis of wine festival attendees'
motivations: A synergy of wine, travel and special events?” Journal of Vacation
Marketing, Vol. 11 No.1, pp. 41-58.
Dow
nloa
ded
by N
orth
umbr
ia U
nive
rsity
At 0
9:02
25
Mar
ch 2
015
(PT
)

Figure 1. Research framework
Dow
nloa
ded
by N
orth
umbr
ia U
nive
rsity
At 0
9:02
25
Mar
ch 2
015
(PT
)

Figure 2: Structural Model Results
Dow
nloa
ded
by N
orth
umbr
ia U
nive
rsity
At 0
9:02
25
Mar
ch 2
015
(PT
)

Table 1: Airline Service Quality Dimensions
No Year Author (s) Dimensions of Service Quality
1 2012 Archana and Subha In-Flight Services, In-Flight Digital Services, Airline Back Office
Operations
2 2011 Boetsch, Bieger and
Wittmer
Airline Brand, Price, Sleep Comfort
3 2009 Saha and Theingi Tangibles, Schedule, Flight Attendants, Ground Staff
4 2008 Teichert, Shehu and
vonWartburg
Flight Schedule, Total Fare, Flexibility, Frequent Flyer
Program, Punctuality, Catering, Ground Services
5 2008 Babbar and Koufteros Level of Concern and Civility, Listening and Understanding,
Individual Attention, Cheerfulness, Friendliness, Courtesy
6 2008 Tiernan, Rhoades and
Waguespack
On-time Performance, Overbooking, Mishandled Baggage, Customer
Complaints
7 2008 Nadiri, Hussain, Ekiz
and Erdogan
Airline Tangibles, Terminal Tangibles, Personnel, Empathy
8 2007 Liou and Tzeng Employees’ Service, Safety and Reliability, On-board Service,
Schedule, On-time Performance, Frequent Flyer Program
9 2007 Shaw Frequency and Timings, Punctuality, Airport Location and Access,
Seat Accessibility/Ticket Flexibility, Frequent Flyer Benefits, Airport
Services, In-flight Services
10 2006 Ekiz, Hussain and
Bavik
Airline Tangibles, Terminal Tangibles, Personnel, Empathy, Image
11 2005 Park, Robertson and
Wu
Reliability and Customer Service, Convenience and Accessibility, In-
Flight Service
12 2002 Tsaur, Chang and Yen Seat Comfort, Safety, Courtesy of Staff
Dow
nloa
ded
by N
orth
umbr
ia U
nive
rsity
At 0
9:02
25
Mar
ch 2
015
(PT
)

Table 2: Passenger Profiles
Attributes Distribution Frequency Percentage
Gender Male 300 60%
Female 198 40%
Age Under 20 Years 58 12%
21-30 Years 274 55%
31-40 Years 84 17%
41-50 Years 40 8%
Above 50 Years 42 8%
Education Level School 44 9%
High School 76 15%
Bachelor’s degree 148 29%
Master’s degree 190 38%
Other 40 8%
Purpose of Visit Business 64 13%
Education 296 59%
Visiting Friends and Family 110 22%
Medical 28 6%
Dow
nloa
ded
by N
orth
umbr
ia U
nive
rsity
At 0
9:02
25
Mar
ch 2
015
(PT
)

Table 3: Validity and Reliability for Constructs
Variables Statements Factor
Loadings
AVE CR Cronbach’s
Alpha
Airline
Tangibles
Aircraft are clean and modern-looking 0.772 0.57 0.888 0.846
Quality of catering served in plane 0.741
Cleanliness of the plane toilets 0.710
Cleanliness of the plane seats 0.726
Comfort of the plane seats 0.822
Quality of air-conditioning in the planes 0.752
Terminal
Tangibles
Cleanliness of the airport toilets 0.734 0.628 0.922 0.864
Number of shops in airport 0.813
Effective air-conditioning in airport 0.802
Effective sign system in airport 0.781
Availability of trolleys in airport 0.774
Reliability of security control system 0.831
Employees’ uniforms are visually appealing 0.807
Personnel Employees’ general attitude 0.790 0.619 0.919 0.882
Whether airline personnel give exact answers
to my questions
0.820
Whether personnel show personnel care
equally to everyone
0.751
Employees have the knowledge to answer
your questions
0.840
Empathy of the airline personnel 0.741
Awareness of airline personnel of their duties 0.726
Error-free reservations and ticketing
transactions
0.832
Dow
nloa
ded
by N
orth
umbr
ia U
nive
rsity
At 0
9:02
25
Mar
ch 2
015
(PT
)
Empathy Punctuality of the departures and arrivals 0.756 0.668
0.923
0.832
Transportation between city and airport 0.743
Compensation schemes in case of loss or
hazard
0.872
Care paid to passengers’ luggage 0.825
Locations of the airline company offices 0.882
Number of flights to satisfy passengers’
demands
0.816
Image Availability of low price ticket offerings 0.720 0.611 0.824 0.780
Consistency of ticket prices with given service 0.780
Image of the airline company 0.840
Customer
Satisfaction
I am satisfied with my decision to use PIA as a
service provider
0.731 0.568 0.839 0.843
My choice of PIA as a service provider was a
wise one
0.681
I think I did the right thing when I chose to
travel by PIA
0.781
I feel that my experience with PIA has been
enjoyable
0.814
Notes: x2 =
902.726, GFI = 0.91, CFI = 0.93, RMSEA = 0.060, p = 0.000
Dow
nloa
ded
by N
orth
umbr
ia U
nive
rsity
At 0
9:02
25
Mar
ch 2
015
(PT
)

Table 4: Discriminant validity
1 2 3 4 5 6
Airline Tangibles 0.754
Terminal Tangibles 0.723 0.792
Personnel 0.667 0.776 0.786
Empathy 0.578 0.766 0.730 0.817
Image 0.499 0.191 0.198 0.412 0.781
Customer Satisfaction 0.474 0.524 0.641 0.578 0.412 0.753
Dow
nloa
ded
by N
orth
umbr
ia U
nive
rsity
At 0
9:02
25
Mar
ch 2
015
(PT
)

Table 5: Results of the structural model
Hypothesized path
Standardized
Coefficients t - value P Decision
H1 Airline
Tangibles →
Customer
Satisfaction 0.608 3.998 0.020 Supported
H2 Terminal
Tangibles →
Customer
Satisfaction 0.411 2.366 0.000 Supported
H3 Personnel → Customer
Satisfaction 0.5 4.603 0.000 Supported
H4 Empathy → Customer
Satisfaction 0.391 2.137 0.030 Supported
H5 Image → Customer
Satisfaction 0.558 4.617 0.000 Supported
Notes: χ² / df = 2.64, ρ = 0.000; GFI = 0.90, CFI = 0.94l; RMSEA = 0.06
Dow
nloa
ded
by N
orth
umbr
ia U
nive
rsity
At 0
9:02
25
Mar
ch 2
015
(PT
)