an analysis of price discrimination mechanisms and retailer profitability
DESCRIPTION
Market ResearchTRANSCRIPT

An Empirical Analysis of Price Discrimination Mechanisms and Retailer ProfitabilityAuthor(s): Romana J. Khan and Dipak C. JainReviewed work(s):Source: Journal of Marketing Research, Vol. 42, No. 4 (Nov., 2005), pp. 516-524Published by: American Marketing AssociationStable URL: http://www.jstor.org/stable/30162400 .
Accessed: 03/02/2013 08:28
Your use of the JSTOR archive indicates your acceptance of the Terms & Conditions of Use, available at .http://www.jstor.org/page/info/about/policies/terms.jsp
.JSTOR is a not-for-profit service that helps scholars, researchers, and students discover, use, and build upon a wide range ofcontent in a trusted digital archive. We use information technology and tools to increase productivity and facilitate new formsof scholarship. For more information about JSTOR, please contact [email protected].
.
American Marketing Association is collaborating with JSTOR to digitize, preserve and extend access toJournal of Marketing Research.
http://www.jstor.org
This content downloaded on Sun, 3 Feb 2013 08:28:19 AMAll use subject to JSTOR Terms and Conditions

ROMANA J. KHAN and DIPAK C. JAIN*
Retailers typically engage in some form of price discrimination to increase profitability. In this article, the authors compare the impact on retailer profitability of two price discrimination mechanisms: quantity dis- counts based on package size (second-degree price discrimination) and store-level pricing or micromarketing (third-degree price discrimination). Whereas the latter has been well addressed in the marketing literature, there is limited empirical research on the use of quantity discounts for price discrimination. Using store-level sales data, the authors estimate a structural demand model, accounting for parameter heterogeneity and price endogeneity. They combine the parameter estimates with a model of retailer pricing to conduct optimal pricing and profitability simulations under several scenarios, ranging from constraining the retailer not to engage in any form of price discrimination to the least restrictive scenario of setting nonlinear price schedules specific to each store. The pricing simulations enable the decomposition of profitability as a result of the dif- ferent forms of price discrimination. Profits are greatest when retailers combine second- and third-degree price discrimination. The authors find that the ability to engage in second-degree price discrimination con- tributes more to retailer profitability than does third-degree price
discrimination.
An Empirical Analysis of Price Discrimination Mechanisms and Retailer Profitability
Setting prices to consumers is one of the most critical decisions for the retailer and a primary driver of retailer profitability. To increase profitability, retailers typically engage in some form of price discrimination. In practice, retailers often vary prices across stores to exploit demand differences between store trading areas, a strategy com- monly referred to as micromarketing or third-degree price discrimination. For example, higher prices are often found in stores that are located in areas with fewer shopping alter- natives (Goodman 2003). Recent studies have addressed the issue of setting optimal retail prices on the basis of observed demographic and competitive factors that can be
*Romana J. Khan is Assistant Professor of Marketing, McCombs School of Business, University of Texas at Austin (e-mail: [email protected]). Dipak C. Jain is Dean, Sandy and Morton Goldman Professor in Entrepreneurial Studies, and Professor of Marketing, Kellogg School of Management, Northwestern University (e-mail: [email protected]). The authors are grateful to Lakshman Krishnamurthi, Karsten Hansen, Michael Mazzeo, and Vishal Singh for their comments on previous drafts of this article. The authors thank the Kilts Center for Marketing, Graduate School of Business, Uni- versity of Chicago, for the use of the Dominck's Finer Foods database. Finally, the authors thank the two anonymous JMR reviewers for their con- structive comments and suggestions. This article is based on an essay from the first author's doctoral dissertation.
linked to demand characteristics (Chintagunta, Dube, and Singh 2003; Montgomery 1997).
Another less obvious way for retailers to price discrimi- nate is to offer quantity discounts based on package size (Cohen 2002; Dolan 1987). In the consumer packaged goods industry, several package sizes are offered in cate- gories such as detergents, beer, paper products, peanut but- ter, and analgesics. The larger sizes of these products, which are identical along all other dimensions (e.g., brand name, ingredients, flavor), are usually offered at a lower per unit price.' When the motivation behind designing a nonlin- ear price schedule is market segmentation, this practice is also known as second-degree price discrimination (Moorthy 1984; Mussa and Rosen 1978).
The focus of this article is on these two mechanisms of price discrimination: micromarketing or store-level pricing (third-degree price discrimination) and quantity discounts based on package size (second-degree price discrimination). Store-level pricing is an effective price discrimination mechanism when observable characteristics provide a sig- nal of consumer price sensitivity and willingness to pay.
1In the grocery industry, there are exceptions in which firms charge quantity premiums so that per unit prices increase with size in categories such as tuna and juices.
© 2005, American Marketing Association Journal of Marketing Research ISSN: 0022-2437 (print), 1547-7193 (electronic) 516 Vol. XLII (November 2005), 516-524
This content downloaded on Sun, 3 Feb 2013 08:28:19 AMAll use subject to JSTOR Terms and Conditions

Price Discrimination Mechanisms and Retailer Profitability 517
However, after consumers enter a store, there remains sig- nificant heterogeneity among customers that the retailer can exploit. Note that though the information necessary to engage in micromarketing (i.e., demographic characteristics of the store's customers) is readily available (e.g., from the Census Bureau), the individual consumer's willingness to pay is unobserved. Because these preferences are unob- served, retailers can offer an array of package sizes, allow- ing consumers to segment themselves by self-selection of their preferred alternative based on their own willingness to pay.
The objective of this article is to decompose the contribu- tion of these two price discrimination mechanisms (i.e., quantity discounting and micromarketing) to retailer prof- itability.2 Under "pure" third-degree price discrimination, prices vary across stores, but per unit prices are the same across package sizes within each store. Under pure second- degree price discrimination, prices are the same across all stores, but per unit prices vary across package sizes. The positive impact on retailer profitability from the "com- bined" strategy (i.e., varying prices across stores and across sizes within each store) has been well documented in the marketing literature. Montgomery (1997) and Chintagunta, Dubd, and Singh (2003) find profit gains between 4% and 16% when the retailer sets store-level nonlinear price schedules. However, they do not distinguish between the two sources of price differences (i.e., across stores and across sizes).
To our knowledge, the only empirical study that specifi- cally explores the use of package size as a price discrimina- tion mechanism in the consumer packaged goods industry is that of Cohen (2002). Cohen studies nonlinear pricing by the manufacturer in the paper towel industry and finds that a substantial portion of the variation in per unit prices across package sizes can be attributed to price discrimination.
Despite the importance of pricing strategy for retailer profitability, there is limited understanding of the relative efficacy of the price discrimination mechanisms available to the retailer. This is an important issue because each mecha- nism is distinguished by both the type of information avail- able to the retailer about consumer preferences and the type of heterogeneity in consumer preferences that is exploited. This is also an important managerial issue because the costs involved with each pricing approach should be weighed against the associated profits. Micromarketing requires store-level pricing systems, which entail considerable time and resources to determine and implement. In contrast, a quantity discount schedule that is uniform across all stores is considerably easier to implement. This article attempts to parse out and measure the gains in profitability from each price discrimination approach.
In general, price differences that cannot be accounted for by cost differences are attributed to price discrimination. However, the retailer may be motivated to offer quantity discounts for reasons other than market segmentation. As Chintagunta (2002) demonstrates, store traffic considera- tions and competition also influence retailer pricing. Quan- tity discounts may serve as acquisition and retention tools
2We do not consider first-degree price discrimination, which involves setting prices according to each person's willingness to pay. In the grocery setting, targeted coupons are one form of this pricing strategy (for an appli- cation, see Rossi, McCulloch, and Allenby 1996).
for high-volume customers who purchase large sizes across categories and make an important contribution to retailer revenue. At some grocery chains, this consideration has lead to the institution of "big deals" aisles, which stock only the largest size in each category. There may also be compet- itive pressures, particularly from mass discounters that offer larger sizes at discounted prices. Special attention may also be given to categories with high volume in the larger sizes. In addition to their importance for store traffic and retailer profitability, these categories may also shape the price image of the store. The combination of these factors may cause the retailer to offer deeper quantity discounts than the price discrimination objective alone necessitates. Although we account for some of these factors in our model develop- ment, we focus on price discrimination as the primary moti- vation for offering quantity discounts.
Our analysis uses data on the over-the-counter (OTC) analgesics category from a large supermarket chain in the Chicago area. The retailer engages in both forms of price discrimination; that is, prices for products vary significantly across stores, and observed retail prices show significant quantity discounts, with the price per tablet decreasing with bottle size. Although the observed quantity discounts may be an indication of second-degree price discrimination by the retailer, they could also be due to cost differences. We demonstrate that a significant proportion of the observed nonlinearity in prices is due to the retailer's pricing decision.
We estimate a category demand model using a random coefficients logit specification. The model allows for het- erogeneity in preferences due to both observed and unob- served factors. We use instruments to control for price endogeneity (Besanko, Gupta, and Jain 1998; Villas-Boas and Winer 1999) due to unobserved factors, such as shelf space and product location. We allow for dynamic promo- tion effects on price sensitivity and promotion response parameters (Foekens, Leeflang, and Wittink 1999). Allow- ing for parameter dynamics accounts for strategic adjust- ments in purchasing behavior (e.g., stockpiling; see Van Heerde, Leeflang, and Wittink 2004) following promotions. We combine parameter estimates from the demand model with a model of retailer category profit maximization to simulate optimal prices and profitability under four pricing policies. Comparing profits across pricing policies enables us to decompose profitability into the different sources of price discrimination and understand the relative importance of each for profits.
We organize the rest of the article as follows: In the next section, we present the demand model. Then, we describe the data and the empirical results from the demand estima- tion. We provide a detailed overview of the retailer's role in setting price and analyze the impact of price discrimination on profitability. Finally, we present our conclusions from the research.
MODEL FORMULATION We model consumer demand using the aggregate mixed
logit model (McFadden and Train 2000), which has been applied in both marketing and economics to estimate demand for differentiated products (e.g., Berry, Levinsohn, and Pakes 1995). The estimation approach allows for parameter heterogeneity and controls for price endogeneity.
We assume that the observed market shares are driven by individual choices. Formally, we assume that consumer i
This content downloaded on Sun, 3 Feb 2013 08:28:19 AMAll use subject to JSTOR Terms and Conditions
518 JOURNAL OF MARKETING RESEARCH, NOVEMBER 2005
chooses either one of J products in the category or the no- purchase option. The probability that consumer i chooses product j at time t from store s is
(1)
0
where i = 1, ..., I; j 1, J; t = 1, T; and s = 1, ..., S. This depends on the characteristics of product j at time t in store s: size (sj); price (pits); an indicator for the presence of a price promotion (dits); an interaction term between price and the presence of a promotion (pits x dits); unobserved (to the researcher) characteristics (its), such as advertising and coupon availability, which may be potentially correlated with price; and parameters representing consumer I's pref- erence for brand j (aii), preference for size (bi), price sensi- tivity (yi), responsiveness to promotions (;), and the impact of promotion on price sensitivity V. We include character- istics of the competitive environment (CEits) of each store to account for variations in the shopping alternatives that con- sumers have for making their purchases. Category demand shifters (DSts) include a seasonal effect and a dummy vari- able to indicate the presence of a pharmacy in a store.
The model allows for dynamic influences of prior promo- tions on price sensitivity (yi) and promotion response (ii) (Foekens, Leeflang, and Wittink 1999). For example, if con- sumers stockpile and increase inventory because of a deep price discount (Hendel and Nevo 2003; Van Heerde, Leeflang, and Wittink 2004), they may be less sensitive to price in subsequent weeks. We allow the price sensitivity parameter to depend on both the depth and the recency of previous price promotions. Similar to Foekens, Leeflang, and Wittink's (1999) approach, we compute a weighted sum of prior price promotions: PRit = ViT , - Pj,t _ v), where pi,t is the regular nonpromoted price, pi,t is the actual price, and v is the weeks of prior price history used to com- pute the measure (v = 8). The price sensitivity parameter is now a function of an overall mean (y) and the dynamic impact of recent price promotions (ypp):
(2) 0
Similarly, we allow promotion response to depend on the duration since previous promotion (wj), with the expecta- tion that the longer the duration since previous promotion, the stronger is the response to the promotion (tw):
(3) 0 We also allow for observed and unobserved heterogene-
ity in the brand preference (ai), size preference A), and price sensitivity (yi) parameters. The preference parameters are competitor variables, and a is the standard deviation of the distribution:
4 0
We measure package size with dummy variables. Thus, for a category with three sizes, we use two dummy vari- ables, sstnall and stage, with the medium size as the base. Intuitively, a consumer who has a strong preference for the large size will likely have a weaker preference for the smaller size, and vice versa. We account for heterogeneity in and correlation between preference for size, 6small and 51arge, as follows:
The inclusion of demographic factors accounts for correla- tion in size preference due to observed factors. Correlation in preferences due to unobserved factors is captured by /, the variance-covariance matrix.
We aggregate the model specified at the individual level to predict market shares at the store level. The general esti- mation approach involves finding the parameters for the individual-level model that produce a predicted market share closest to the observed market share (Berry 1994; Nevo 2000). The next section describes the data and the estimation results.
RESULTS Data
We use data on the OTC analgesics category from the Dominick's Finer Foods chain in the Chicago area over a one-year period. For each store in each week, we observe the number of units sold for each Universal Product Code (UPC), the UPC price, whether it was on price promotion, and the retailer's margin (from which we can compute the wholesale cost). With the transition of prescription-only drugs to OTC nonprescription status (e.g., Advil, Aleve), the analgesics category has gained importance for retailers. Information Resources Inc. reports that in food and mass- market stores, sales of oral analgesics tablets increased 4.5% to $2.73 billion between January 1999 and January 2000. These trends make the analgesics category an impor- tant area for expansion for grocery retailers.
For the model estimation, we use 11 products, consisting of four brands (Tylenol, Advil, Bayer, and Store Brand) and three sizes (25, 50, and 100 tablets).3 The selected UPCs account for 62% of total sales in the category. We provide the descriptive statistics in Table 1.
The market share shows the percentage of bottles sold in each brand size. Tylenol is the market leader, capturing more than 25% of the category volume, and it also has the greatest share in each size group. Notably, no one size appears to be the most popular across all the brands. We compute the price the consumer would pay for 100 tablets in each bottle size. For Tylenol and Bayer, a consumer buy- ing 100 tablets in the smallest size would pay twice as much as a consumer buying 100 tablets in the largest size. Over- all, the retailer offers significant quantity discounts, the magnitude of which declines with size. So, for example, the savings are greater if a customer trades up from 25 to 50 tablets than if he or she trades up from 50 to 100 tablets.
3The store brand has only two sizes with significant market share: medium and large; thus, our model has 11 products rather than 12. Note that we do not include the extra-large size because of its very low share.
(5) 0
This content downloaded on Sun, 3 Feb 2013 08:28:19 AMAll use subject to JSTOR Terms and Conditions

Price Discrimination Mechanisms and Retailer Profitability 519
Table 1 DESCRIPTIVE STATISTICS
Brand Size (Number of Tablets)
Market Share (%)
Price per 100 Tablets
Cost per 100 Tablets
Units Sold on Promotion (%)
Tylenol 25 8.9 14.08 9.04 1 Tylenol 50 11.1 9.98 7.52 10 Tylenol 100 7.6 7.14 5.93 11 Advil 25 7.3 12.08 8.08 10 Advil 50 5.1 10.38 7.4 19 Advil 100 2.2 8.23 6.25 15 Bayer 25 2.5 10.64 7.6 16 Bayer 50 2.0 7.62 5.34 22 Bayer 100 4.9 4.95 3.73 28 Store brand 50 6.2 4.98 1.92 10 Store brand 100 4.2 3.29 1.51 22
The percentage of units sold on promotion indicates that a greater percentage of the larger sizes is sold on promotion than the smallest size.
In addition to sales information, we use data on the demographic characteristics and competitive environment of each store's trading area. We capture the demographic characteristics of the customer population with the follow- ing variables: age60 (percentage of the population that is over the age of 60), ethnic (percentage of the population that is black or Hispanic), HHsize (percentage of house- holds in the store area with five or more members), and homevalue (percentage of houses in the store area valued at more than $150,000). We capture the competitive environ- ment of each store with measures of the distance from the store to different types of competitors: Jewel (the largest supermarket chain in the area), everyday-low-price (EDLP) store, and drugstore. To account for factors that could shift demand, we include an indicator for whether a store has a pharmacy department and a seasonality term for winter months.
There is also cause for concern that some observed vari- ables, particularly price, may be correlated with the unob- served factors (its). The inclusion of the variable Hits as an interaction with price also raises some endogeneity con- cerns because it is likely that there is some serial correlation in sjts. Because we use prior prices to compute PP.its, there will likely be a correlation between PPits and~ts. To account for this endogeneity, we construct an instrument that is a weighted function of prior wholesale price, and we compute this in the same way as PPits. The instrument set also includes wholesale price, package size, and local area demographics.
As we discussed in the "Model Formulation" section, we allow for a no-purchase option to enable category expansion and contraction with changes in the marketing mix. In our data, we observe the number of households that visit each store in each week. From the Information Resources Inc. fact- book, we know that, on average, consumers buy analgesics three times a year. We use this information to compute the share of the outside good, such that not all consumers enter- ing the store on a given week are in the market for analgesics.
Demand Model Results The results of the demand model estimation appear in
Table 2. We group the variables into five sets: brand prefer-
ence, marketing mix, size, demand shifters, and interaction effects. All the brand fixed effects have a negative sign because of the large share of the outside good.4 We find that Tylenol has the greatest mean preference, which is consis- tent with its large category share.
The next set of variables is related to the marketing mix. The coefficient on price (-1.18) is negative, as we expected. The standard deviation of the distribution of this parameter (.49) indicates that after we account for sources of observed heterogeneity, there is significant unobserved heterogeneity in price sensitivity. The promotion variable, which we measured as the proportion of units sold on promotion, indi- cates the presence of a temporary price reduction. Promo- tions increase the likelihood of purchase. The negative coef- ficient on the price and promotion interaction (-.04) indicates that consumers are more price sensitive toward promoted items.
The results show some evidence of parameter dynamics. The interaction of price with the measure of recency and depth of prior promotion has a positive coefficient (.18), indicating that the more recent or deeper a promotion, the less price sensitive are consumers. This may also reflect stockpiling effects because consumers are less responsive to price when they have a high inventory. The interaction of promotion with weeks since previous promotion indicates that promotion effectiveness increases the longer time has elapsed since the previous promotion (.05).
The price interaction parameters show that demographic and competitive variables have a significant impact on price sensitivity. The negative coefficients on the price x age60 (-1.3) and price x HHsize (-3.16) interactions indicate that older people and large households tend to be more price sensitive. The positive coefficient on the price x homevalue interaction (.36) indicates that consumers in affluent areas tend to be less price sensitive. The coefficients on the price and competitor interaction terms, drugstore and EDLP, are positive. Because the competitor variables measure the dis- tance from the store, the interpretation of the positive coef- ficients is that as the distance from a competitor increases, price sensitivity decreases. These results suggest that as the
4Because of space considerations, we report only the brand fixed effects. Parameter estimates of the terms related to observed and unobserved het- erogeneity are available on request.
This content downloaded on Sun, 3 Feb 2013 08:28:19 AMAll use subject to JSTOR Terms and Conditions

520 JOURNAL OF MARKETING RESEARCH, NOVEMBER 2005
Table 2 DEMAND MODEL ESTIMATION RESULTS
Brand Preference Tylenol Advil Bayer Store Tylenol
Marketing Mix Price Price: standard deviation Promotion Price x promotion Price x recency-depth of prior promotion
Promotion x ln(weeks since promotion)
Size Small (25 tablets) Small: standard deviation Large (100 tablets) Large: standard deviation Small large covariance
Demand Shifters Winter Pharmacy
Competitive Effects Distance to drugstore Distance to EDLP Distance to Jewel
Parameter Estimate
Standard Error
-2.59* .38 -3.02* .39 -4.86* .25 -3.59* .22 -2.59* .38
-1.18* .14 .49* .16 .13* .04
-.04* .02
.18* .02
.05* .01
1.02* .17 1.35* .25
-3.42* .14 2.05* .81
-1.04* .41
.22* .01
.04* .01
-.46* .11 .03 .21
-.01 .04
.1
.32 92 .16 .39 .31 1.26 .72 .09 .1
ence for the small size, which may be due to the influence of budget constraints on ethnic households.
We include the presence of an in-store pharmacy and a winter dummy variable as category demand shifters. We find that demand for analgesics is greater during the winter season, which is not surprising. We also find that the pres- ence of a pharmacy increases demand for the analgesics cat- egory. The finding that the presence of a pharmacy, which is primarily for prescription drugs, also has a spillover effect on OTC drugs is good news for the retailer because more supermarkets are adding a pharmacy department to compete with drugstores and mass discounters (Singh 2003). How- ever, this effect is likely overestimated as a result of the endogeneity of the pharmacy location decision because retailers will open pharmacies in areas with a strong demand for medical supplies.
We also include distances to closest competitors as cate- gory demand shifters. We expect that with fewer purchasing venues in an area, the likelihood of not making a purchase will decrease. The negative coefficient on distance to the closest drugstore implies that consumers are more likely to purchase analgesics from the store when there is no drug- store in the area. The coefficients on distance to the closest EDLP store (.03) and Jewel (-.01) supermarket are not sig- nificant and are small compared with the coefficient on the drugstore variable (-.46). Given that the category of our analysis is analgesics, it is not surprising that the distance to the closest drugstore is more important in determining the share of the outside good.
The empirical results reveal the following key insights: 'Preference for size varies significantly as a result of unob-
.35 served factors, which indicates that offering an array of prod-
.14 ucts with different sizes within each brand can be a useful tool
.8 for and differences between con- sorting consumers capturing sumer segments. 'Consumer price sensitivity varies with observed demographic and competitive factors, indicating an opportunity for third- degree price discrimination by setting store-level prices. 'Preference for different sizes also varies as a result of observed demographic factors, signaling an opportunity to combine second- and third-degree price discrimination by varying the quantity discount schedule across stores.
.97 In the next section, we explore the retailer's pricing strategy .7 and use the parameter estimates from the demand model to investigate the contribution of price discrimination to retailer profitability.
-1.30* .70*
-3.16* .36* .90*
-.65 .66*
-.87* .83*
-4.12* -.76 .39*
-.70* 4.40* .57
.35
.14
.8
.1
.32
.92
.16
.39
.31 1.26 .72 .09 .1 .97 .7
Interaction Terms Price x age60 Price x ethnic Price x HHsize Price x homevalue Price x drugstore Price x Jewel Price x EDLP Small x age60 Small x ethnic Small x HHsize Small x homevalue Large x age60 Large x ethnic Large x HHsize Large x homevalue
* = significance.
availability of shopping alternatives increases in an area, price sensitivity also increases.
We measure the size effect variables relative to the base medium size. We find that consumers prefer the small size the most (1.02) and the large size the least (-3.42); this is also consistent with Cohen's (2002) findings for the paper towel category. The standard deviations for the large size (2.05) and for the small size (1.35) preference parameters indicate the presence of heterogeneity in consumer prefer- ences due to unobserved factors. The negative covariance in preferences for small versus large size (-1.04) indicates that a high utility for the small size implies a lower utility for the large size. Areas with a greater proportion of large house- holds have a greater preference for the large size. Notably, areas with a large ethnic population have a greater prefer-
RETAILER PRICING AND PROFITABILITY Evidence of Retailer Price Discrimination
Observed quantity discounts may be due to either the manufacturer's wholesale price or the retailer's pricing strategy. Typically, quantity discounts that cannot be explained by cost differences are attributed to price discrim- ination.5 Because we observe wholesale prices from the manufacturer, we compute the retailer's average margin and
5There could also be other labor or shelving costs associated with differ- ent sizes, especially in bulkier categories or in products that require refrig- eration. However, our assumption of equal costs (except for the manufac- turer price) for different sizes is quite reasonable for the analgesics category we use in this empirical analysis because the physical differences across different sizes are relatively small.
This content downloaded on Sun, 3 Feb 2013 08:28:19 AMAll use subject to JSTOR Terms and Conditions
Price Discrimination Mechanisms and Retailer Profitability 521
Table 3 RETAILER PRICING BEHAVIOR
Brand Number of
Tablets per Bottle Average Margin
per Bottle: p - c ($) Average Markup
per Bottle: (p c)/p (%) NLR (%)
Tylenol 25 1.26 36 Tylenol 50 1.23 25 63 Tylenol 100 1.21 17 55 Advil 25 33 Advil 50 1.49 29 60 Advil 100 1.98 24 52 Bayer 25 .76 29 Bayer 50 1.14 30 25 Bayer 100 1.22 25 32 Store brand 50 1.53 61 Store brand 100 1.77 54 76
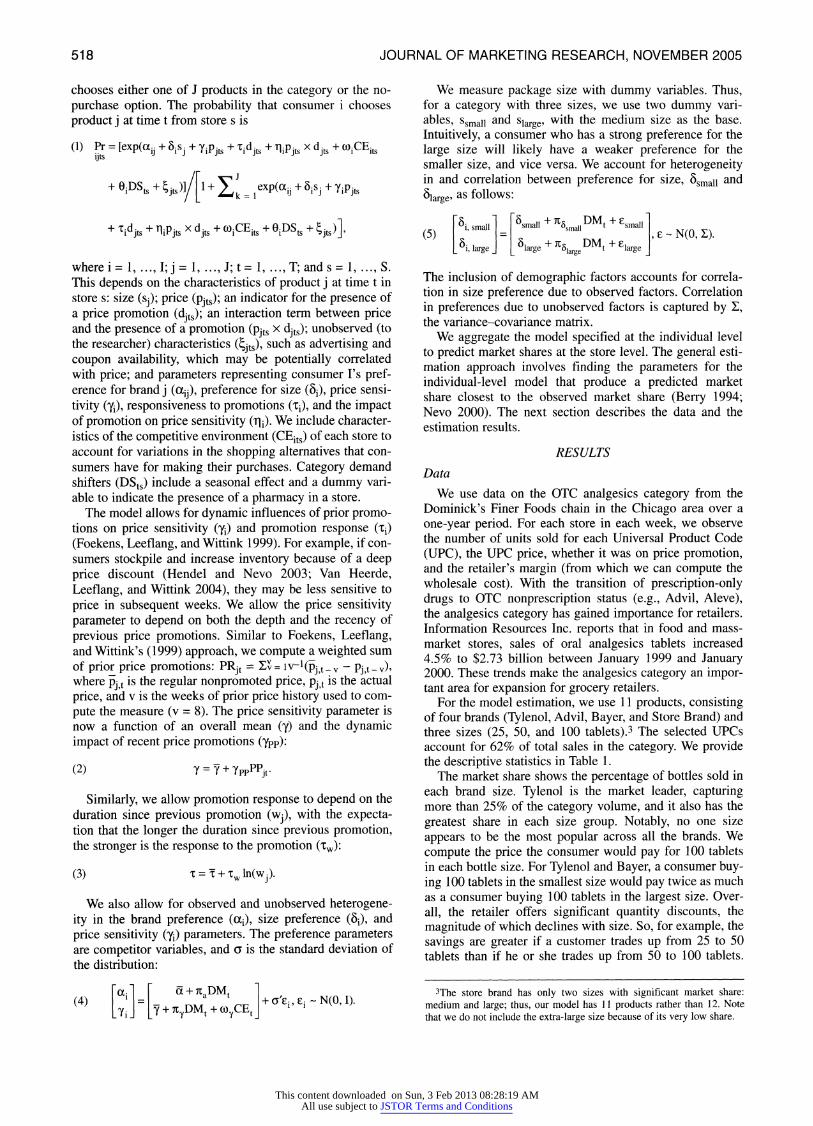
markup per bottle in Table 3. To provide an accurate reflec- tion of the retailer's pricing decision, we compute these numbers using the actual wholesale and retail price per bot- tle rather than price per 100 tablets.
On average, the margin is the greatest for the large size and the least for the small size, and the markup is greater for the smaller sizes. As we discussed previously, strategic considerations beyond price discrimination may cause the retailer to offer quantity discounts. Although we do not demonstrate the absence of other possible explanations for the observed patterns, the evidence indicates that the retailer uses quantity discounts in a strategic manner that is consis- tent with price discrimination. In addition, the variation in margin and markups across products and sizes indicates that the retailer is not following a fixed rule of thumb in setting its price relative to wholesale price.
Assuming that other variable costs are equal across prod- ucts of different sizes, we can precisely account for the pro- portion of the nonlinearity in retail prices that is due to the retailer's pricing decision. We measure the nonlinearity due to the retailer (NLR; Cohen 2002) as the percentage of the nonlinearity in retail prices (P25-P50) that cannot be accounted for by the nonlinearity of wholesale prices (W25- W5o):
(6) 0
Table 4 shows that the percentage of the NLR varies between 25% and 75%. On average, approximately 50% of the observed nonlinearity in retail price is due to the retailer's pricing decision.
An examination of prices across stores reveals that the retailer charges different prices for the same product at dif- ferent stores. For the same data source, Montgomery (1997) and Chintagunta, Dube, and Singh (2003) report the exis- tence of price zones within which the retailer sets prices. For the analgesics category, we find up to three levels of price in any week.6
In some cases, the retailer charges a uniform price across the chain for the smallest size, while varying the price for the larger sizes. In general, it appears that the retailer sets a
6The number of price zones has increased over time. Using data from a later time period, Chintagunta, Dube, and Singh (2003) find up to 16 price zones.
base price and then makes a percentage adjustment from the base to determine pricing in other zones. Although this pat- tern does not hold for every UPC, its prevalence implies that when the retailer varies prices over zones, there may be some fixed adjustment rule involved.
Optimal Pricing and Retailer Profitability Given the evidence that the retailer engages in price dis-
crimination, we decompose the contribution to profitability from each type of price discrimination mechanism.? Using the results of the demand estimation, we simulate optimal prices under several scenarios.
We assume that the retailer sets prices to maximize category-level profits, which is consistent with the assump- tion made in most studies (e.g., Kim, Blattberg, and Rossi 1995; Raju, Sethuraman, and Dhar 1995) and is also in line with the industry trend toward category management. The retailer's costs are the wholesale price paid to the manufac- turer for each product (wi) and a fixed overhead cost (F) of maintaining the category. The retailer's problem is to deter- mine the price of each product in the category in every week to maximize category profits:
(7)
0
Given the wholesale prices and parameter estimates from the demand model in Equation 1, we can solve for the full vector of optimal retail prices (p*), which maximizes Equation 7.
Shifts in the retailer's pricing policy may lead to a response from the competition and strategic adjustments in consumer behavior, and it may have implications for cus- tomer store loyalty. To allay these concerns, previous research has imposed constraints on the optimization prob- lem. Chintagunta, Dube, and Singh (2003) require that opti- mal prices do not decrease consumer welfare. Montgomery (1997) requires that average prices and revenues do not increase. Similarly, we impose the constraint that the share weighted average price does not increase with the suggested optimal prices. For chain-level pricing, we use the observed
?Note that we focus on the short-term objective of price setting and take the array of product offerings as a given. Although the product assortment decision is also an endogenous variable, we believe that these are long- term decisions.
This content downloaded on Sun, 3 Feb 2013 08:28:19 AMAll use subject to JSTOR Terms and Conditions
522 JOURNAL OF MARKETING RESEARCH, NOVEMBER 2005
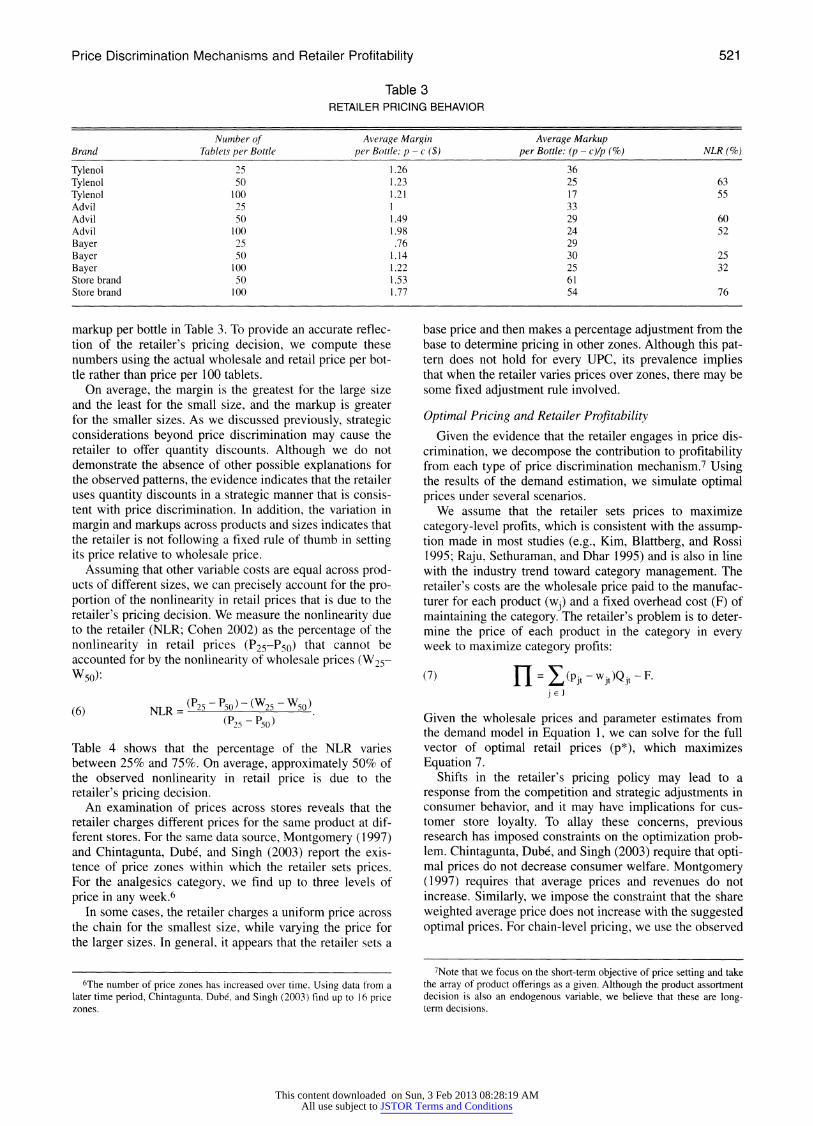
Table 4 IMPACT OF DIFFERENT PRICING POLICIES ON PROFITABILITY
Average Weekly Store Profit in
Thousands of Dollars (Standard Error)
Change in Profits (Standard Deviation) from Switching to (%)
Chain Uniform
Chain Nonlinear Pricing
Store Uniform
Store Nonlinear Pricing
No Price Discrimination Chain uniform 67 (9) 26 (9) 10 (9) 34 (10)
Second Degree Only Chain nonlinear 86 (10) -21 (5) -13 (2) 6 (3)
Third Degree Only Store uniform 73 (10) -9 (2) 15 (2) 21 (5)
Second and Third Degree Store nonlinear 92 (11) -25 (5) -5 (2) -18 (4)
Current Pricing Policy Actual 75 (10) Optimized 87 (11)
share weighted average price at the chain level (pc) to con- strain the optimal share weighted (sj) average price paid:
(8) 0
For the store-level pricing scenarios, we compute the share weighted observed price for each store (ps) and impose the constraint at the store level.
We compute optimal prices and the implied profits under the following pricing scenarios:
.Chain uniform (no price discrimination): The per unit price for each brand is constant across sizes and stores. There are no quantity discounts or variation in prices across stores. .Chain nonlinear (pure second-degree price discrimination): The firm sets a quantity discount schedule that is the same for all stores. ',Store uniform (pure third-degree price discrimination): The firm can vary prices across stores but does not offer quantity discounts. For each store, the firm determines a per unit price, which is the same for all sizes. .Store nonlinear (combined second- and third-degree price dis- crimination): The firm can set quantity discount schedules for each store.
This exercise enables us to decompose profitability into the different sources of price discrimination and understand the relative importance of each for profits. Table 4 shows average weekly profits for the chain under the different pricing scenarios. The differences in profit outcomes are statistically significant at the .05 level and are economically significant. For each scenario, we also report the percentage difference in profits compared with other scenarios. For ref- erence, we also report the actual profits and the expected profits (if the firm were to set optimal prices) under the firm's current pricing policy. Note that expected profits under the firm's current pricing policy are equal to profits from setting a single nonlinear price schedule across the chain, which is consistent with Chintagunta, Dube, and Singh's (2003) approach.
Comparing profits across scenarios shows that there are significant gains from the ability to set nonlinear prices and to vary prices across stores. If a store were to change from
chain-level uniform pricing, the most restrictive policy, to store-level nonlinear pricing, the least restrictive policy, profits would increase by 34%. The decomposition shows that the increase in profits from nonlinear pricing (26%) is significantly greater than the increase from store-level pric- ing (10%). If the firm were to set one chain-level nonlinear price schedule, profits would increase by 26% compared with the chain-level uniform price schedule. Conversely, if the firm were to set uniform store-level prices, profits would increase by 10% compared with chain-level uniform pricing. After the firm has set a chain-level optimal nonlin- ear price schedule, moving from chain-level nonlinear pric- ing to store-level nonlinear pricing increases profits by an additional 6%. Overall, the results reflect the importance of pricing flexibility to the firm's profit. The critical finding of this analysis is that the firm's ability to offer quantity dis- counts based on package size contributes more to its prof- itability than does its ability to vary prices across stores.
CONCLUSION We investigate the impact of price discrimination mecha-
nisms on retailer profitability through a comparison of the contribution to profits from quantity discounts based on package size versus store-level pricing. We find that an opti- mal quantity discount schedule set at the chain level con- tributes more to profitability than does setting store-level prices without quantity discounts. The key insight here is that quantity discounting adequately captures a larger pro- portion of the heterogeneity in demand than does store-level pricing. In practical terms, setting a quantity discount schedule at the chain level leads to a significant increase in profits and is also much easier to implement than setting store-specific prices. The results suggest that managers can focus on the simpler task of setting quantity discount sched- ules to increase profits before investing in store-level pric- ing systems. Although the combination of store-level pric- ing and quantity discounts contributes significant incremental profits, there a many complications involved in implementing store-level pricing.
Note that the relative efficacy of each type of price dis- crimination mechanism depends on the nature of consumer
This content downloaded on Sun, 3 Feb 2013 08:28:19 AMAll use subject to JSTOR Terms and Conditions
Price Discrimination Mechanisms and Retailer Profitability 523
preferences and whether the retailer has information or sig- nals about these preferences. For quantity discounts to serve as an effective price discrimination mechanism, it is impor- tant that people differ in their valuation of additional vol- ume of the product and that the retailer has information on the distribution of willingness to pay. For example, if all consumers have limited consumption of a product in gen- eral, using quantity discounts based on package size will not be an effective segmentation mechanism.
The effectiveness of third-degree price discrimination depends on whether the observed characteristics used for segmentation concurrently segment consumers on the basis of their willingness to pay. Attempts to relate preference and price sensitivity parameters to demographic and com- petitive variables have yielded mixed results. Some research has found evidence of a relationship between price sensitiv- ity and observed demographics (Hoch et al. 1995), which can be exploited for pricing purposes. However, the major- ity of previous research has found demographic characteris- tics to be poorly correlated with preference parameters (Elrod and Winer 1982; Rossi and Allenby 1993). For this reason, it is not surprising that second-degree price discrim- ination outperforms third-degree price discrimination. The combination of second- and third-degree price discrimina- tion will yield greater profits. However, the increase in prof- its will be greater when preferences for size can be related to observed demographic characteristics, allowing retailers to vary the shape of the nonlinear price schedule according to local preferences.
Our research focus is on comparing price discrimination mechanisms rather than on prescribing an approach for determining optimal prices. The retailer's optimal pricing decision also depends on its interaction with the manufac- turer, which also sets a nonlinear price schedule to the retailer. The relative power of the retailer with respect to the manufacturer (Kadiyali, Chintagunta, and Vilcassim 2000) affects the retailer's ability to use quantity discounts for price discrimination and the division of profits from price discrimination. In terms of pricing-decision support, manu- facturers tend to have better resources than retailers, which enables manufacturers to make better pricing decisions. As the manufacturer uses quantity discounts more effectively, the retailer must rely more on store-level pricing as its pri- mary price discrimination mechanism. In addition, we do not account for the variation in pass-through of trade pro- motions (Besanko, Dube, and Gupta 2005), which also depends on the retailer's interaction with the manufacturer. The logical next step is to address these issues with a uni- fied structural framework that accounts for both the supply side and consumer demand.
The assortment of product sizes to offer is also an impor- tant aspect of the retailer's decision. For example, super- market chains do not carry the very large sizes that are available at mass discounters. Because the retailer can use the product assortment as part of the segmentation strategy by varying product selection across stores, it would be worthwhile to investigate how the optimization of product assortment at the store level affects profitability. Israilevich (2004) considers the retailer's product assortment decision in the bath tissue category, accounting for consumer demand and manufacturer payments. He shows that slotting allowances enable the retailer to offer a wider product assortment than would be profitable without the payments.
This result further emphasizes the notion that recommenda- tions for the retailer's optimal behavior should consider the impact of both consumers and manufacturers.
A limitation of this article is that though the consumer demand model allows for dynamics, the retailer pricing model does not. It is likely that if consumers adjust demand strategically, the retailer will also incorporate expectations about future demand changes when it sets current price. This would be better captured by allowing for dynamic retailer pricing, such that the retailer would choose a sequence of optimal prices over time. Although we believe that allowing for dynamic retailer pricing will not have an impact on the substantive results of our research direction- ally, we expect that there will be an impact on the shape of the nonlinear price schedules over time. Appropriately incorporating dynamics in both the consumer demand and the retailer pricing models presents an avenue for further research.
REFERENCES Berry, Steven T. (1994), "Estimating Discrete-Choice Models of
Product Differentiation," Rand Journal of Economics, 25 (2), 242-62.
, James Levinsohn, and Ariel Pakes (1995), "Automobile Prices in Market Equilibrium," Econometrica, 63 (4), 841-90.
Besanko, David, Jean-Pierre Dube, and Sachin Gupta (2005), "Retail Pass-Through on Competing Brands," Marketing Sci- ence, 24 (1), 123-27.
, Sachin Gupta, and Dipak Jain (1998), "Logit Demand Estimation Under Competitive Pricing Behavior: An Equilib- rium Framework," Management Science, 44 (11), 1533-47.
Chintagunta, Pradeep K. (2002), "Investigating Category Pricing Behavior at a Retail Chain," Journal of Marketing Research, 39 (May), 141-54.
, Jean-Pierre Dube, and Vishal Singh (2003), "Balancing Profitability and Customer Welfare in a Supermarket Chain," Quantitative Marketing and Economics, 1 (1), 111-47.
Cohen, Andrew (2002), "Package Size and Price Discrimination in Paper Towels," working paper, Department of Economics, Uni- versity of Virginia.
Dolan, Robert J. (1987), "Quantity Discounts: Managerial Issues and Research Opportunities," Marketing Science, 6 (1), 1-22.
Elrod, Terry and Russell S. Winer (1982), "An Empirical Evalua- tion of Aggregation Approaches for Developing Market Seg- ments," Journal of Marketing, 46 (Fall), 65-74.
Foekens, Eijte W., Peter S.H. Leeflang, and Dick R. Wittink (1999), "Varying Parameter Models to Accommodate Dynamic Promotion Effects," Journal of Econometrics, 89 (1-2), 249-68.
Goodman, Lawrence (2003), "A Rotten Deal," Self Magazine, (December), 136-58.
Hendel, Igal and Aviv Nevo (2003), "The Post-Promotion Dip Puzzle: What Do the Data Have to Say?" Quantitative Market- ing and Economics, 1 (4), 409-424.
Hoch, Stephen J., Byung-Do Kim, Alan L. Montgomery, and Peter E. Rossi (1995), "Determinants of Store-Level Price Elasticity," Journal of Marketing Research, 32 (February), 17-29.
Israilevich, Guillermo (2004), "Assessing Supermarket Product- Line Decisions: The Impact of Slotting Fees," Quantitative Marketing and Economics, 2 (2), 141-67.
Kadiyali, Vrinda, Pradeep Chintagunta, and Naufel Vilcassim (2000), "Manufacturer-Retailer Channel Interactions and Impli- cations for Channel Power: An Empirical Investigation of Pric- ing in a Local Market," Marketing Science, 19 (2), 127-48.
Kim, Byung-Do, Robert C. Blattberg, and Peter E. Rossi (1995), "Modeling the Distribution of Price Sensitivity and Implications for Optimal Retail Pricing," Journal of Business and Economic Statistics, 13 (3), 291-303.
This content downloaded on Sun, 3 Feb 2013 08:28:19 AMAll use subject to JSTOR Terms and Conditions
524 JOURNAL OF MARKETING RESEARCH, NOVEMBER 2005
McFadden, Daniel and Kenneth Train (2000), "Mixed MNL Mod- els for Discrete Response," Journal of Applied Econometrics, 15 (5), 447-70.
Montgomery, Alan L. (1997), "Creating Micro-Marketing Pricing Strategies Using Supermarket Scanner Data," Marketing Sci- ence, 16 (4), 315-37.
Moorthy, K. Sridhar (1984), "Market Segmentation, Self-Selection, and Product Line Design," Marketing Science, 3 (4), 288-307.
Mussa, Michael and Sherwin Rosen (1978), "Monopoly and Product Quality," Journal of Economic Theory, 18 (2), 301-317.
Nevo, Aviv (2000), "A Practitioner's Guide to Estimation of Random-Coefficients Logit Models of Demand," Journal of Economics and Management Strategy, 9 (4), 513-48.
Raju, Jagmohan S., Raj Sethuraman, and Sanjay K. Dhar (1995), "The Introduction and Performance of Store Brands," Manage- ment Science, 41 (6), 957-78.
Rossi, Peter E. and Greg M. Allenby (1993), "A Bayesian Approach to Estimating Household Parameters," Journal of Marketing Research, 30 (May), 171-82.
, Robert E. McCulloch, and Greg M. Allenby (1996), "The Value of Purchase History Data in Target Marketing," Market- ing Science, 15 (4), 321-40.
Singh, Vishal (2003), "Competing with Mass Discounters: Impli- cations for Retailer Pricing," working paper, Graduate School of Industrial Administration, Tepper School of Business, Carnegie Mellon University.
Van Heerde, Harald J., Peter S.H. Leeflang, and Dick R. Wittink (2004), "Decomposing the Sales Promotion Bump with Store Data," Marketing Science, 23 (3), 317-34.
Villas-Boas, J. Miguel and Russell S. Winer (1999), "Endogeneity in Brand Choice Models," Management Science, 45 (10), 1324-38.
This content downloaded on Sun, 3 Feb 2013 08:28:19 AMAll use subject to JSTOR Terms and Conditions