an analysis of performance of private sector life...
TRANSCRIPT

133
AN ANALYSIS OF PERFORMANCE OF PRIVATE SECTOR LIFE INSURANCE
COMPANIES VIS A VIS PUBLIC SECTOR LIFE INSURANCE COMPANIES
An in depth analysis of the various parameters of performance for a Life Insurance
Company were identified and the data was subjected to analysis with the help of
ratios, correlation technique and percentage analysis. The various findings have
been as follows.
SINGLE INSURANCE PREMIUM: Premium collected by Life insurance companies
on individual lives is the single most important factor that determines the success
and performance of a life insurance company. Insurance is a product that is not
bought but is sold. The following table depicts the amount of premium collected in
Crores of rupees by the various life insurance companies, public and private.
Table 7.1Table showing amount of premium in Crores of rupees
INSURER 2005-06 2006-07 2007-08 2008-09 2009-10 2010-11 2011-12 2012-13
LIC 28515.87
56222.56 59996.57 53179.08 71521.90 87021.13 81562.13 76611.50
Bajaj Allianz
2716.77
4301.27 6674.48
4451.10 4451.1 3465.82 2717.31 2987.9
HDFC Standard
1042.65
1648.85 2685.37 2651.11 3257.51 4059.33 3857.47 4436.37
ICICI Prudential
2602.5
5162.13 8034.75 6811.83 6333.92 7862.14 4441.09 4808.02
Reliance 193.56
932.11 2751.05 3513.98 3920.78 3034.94 1809.29 1376.57
SBI Life 827.82
2563.84 4782.94 5386.64 7040.74 7589.58 6531.32 5182.8
Max life 471.36
712.11 1597.83 1842.91 1849.09 2061.39 1901.72 1899.34
Source: Company Annual Reports
The table above clearly shows that the overall growth rate of LIC from the year 2005
up to 2012 has increased by 168%. However the growth rate of HDFC during the
same period is 325%. ICICI Prudential has shown a growth rate of 84%, SBI Life
has shown a phenomenal growth rate of 500%. Reliance has increased by 611%
Bajaj Allianz has shown a growth of 146% within two years, however the growth
subsequently fell to 10% only by 2012-13. Max Life has shown a growth of 300%
during the same period. The average growth of the 6 private life insurance
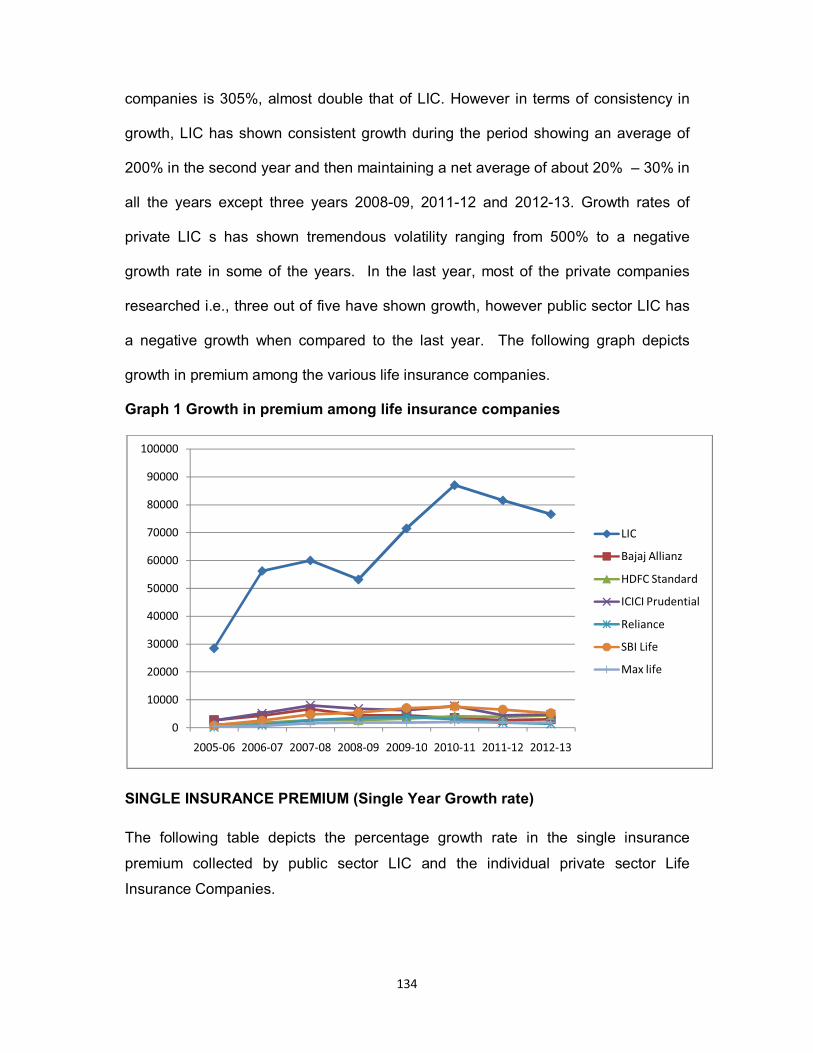
134
companies is 305%, almost double that of LIC. However in terms of consistency in
growth, LIC has shown consistent growth during the period showing an average of
200% in the second year and then maintaining a net average of about 20% – 30% in
all the years except three years 2008-09, 2011-12 and 2012-13. Growth rates of
private LIC s has shown tremendous volatility ranging from 500% to a negative
growth rate in some of the years. In the last year, most of the private companies
researched i.e., three out of five have shown growth, however public sector LIC has
a negative growth when compared to the last year. The following graph depicts
growth in premium among the various life insurance companies.
Graph 1 Growth in premium among life insurance companies
SINGLE INSURANCE PREMIUM (Single Year Growth rate)
The following table depicts the percentage growth rate in the single insurance
premium collected by public sector LIC and the individual private sector Life
Insurance Companies.
0
10000
20000
30000
40000
50000
60000
70000
80000
90000
100000
2005-06 2006-07 2007-08 2008-09 2009-10 2010-11 2011-12 2012-13
LIC
Bajaj Allianz
HDFC Standard
ICICI Prudential
Reliance
SBI Life
Max life
135
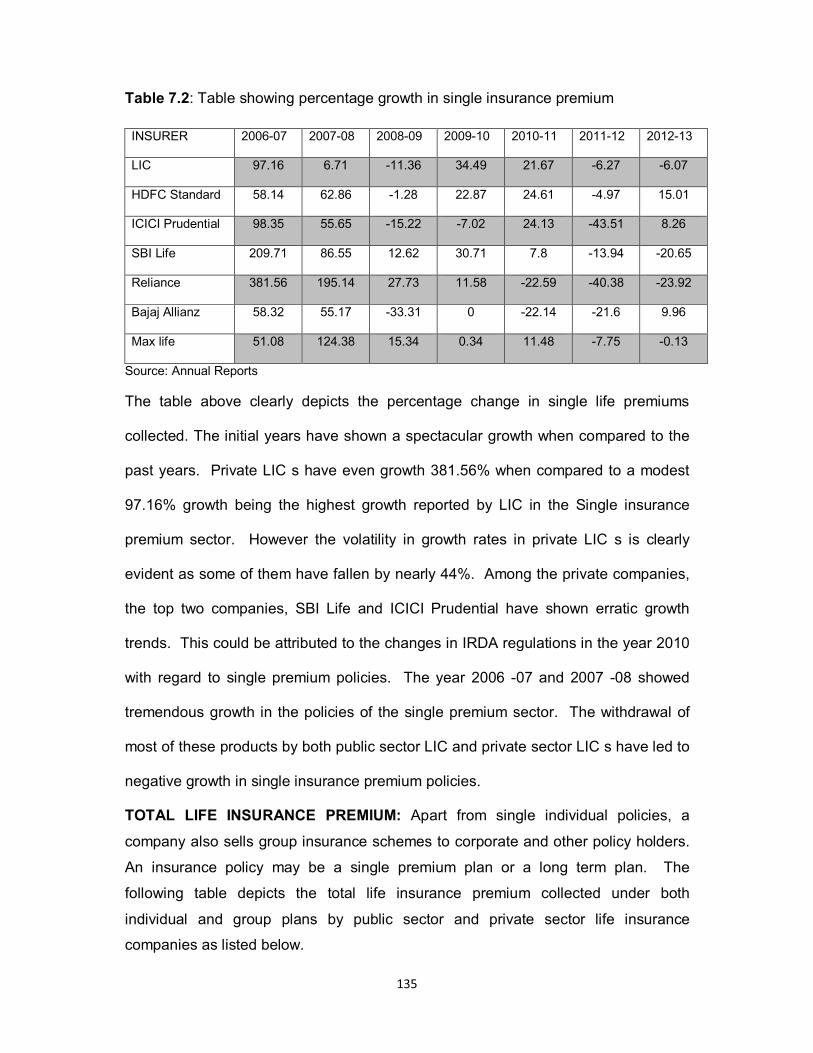
Table 7.2: Table showing percentage growth in single insurance premium
INSURER 2006-07 2007-08 2008-09 2009-10 2010-11 2011-12 2012-13
LIC 97.16
6.71 -11.36 34.49 21.67 -6.27 -6.07
HDFC Standard 58.14
62.86 -1.28 22.87 24.61 -4.97 15.01
ICICI Prudential 98.35
55.65 -15.22 -7.02 24.13 -43.51 8.26
SBI Life 209.71
86.55 12.62 30.71 7.8 -13.94 -20.65
Reliance 381.56
195.14 27.73 11.58 -22.59 -40.38 -23.92
Bajaj Allianz 58.32
55.17 -33.31 0 -22.14 -21.6 9.96
Max life 51.08
124.38 15.34 0.34 11.48 -7.75 -0.13
Source: Annual Reports
The table above clearly depicts the percentage change in single life premiums
collected. The initial years have shown a spectacular growth when compared to the
past years. Private LIC s have even growth 381.56% when compared to a modest
97.16% growth being the highest growth reported by LIC in the Single insurance
premium sector. However the volatility in growth rates in private LIC s is clearly
evident as some of them have fallen by nearly 44%. Among the private companies,
the top two companies, SBI Life and ICICI Prudential have shown erratic growth
trends. This could be attributed to the changes in IRDA regulations in the year 2010
with regard to single premium policies. The year 2006 -07 and 2007 -08 showed
tremendous growth in the policies of the single premium sector. The withdrawal of
most of these products by both public sector LIC and private sector LIC s have led to
negative growth in single insurance premium policies.
TOTAL LIFE INSURANCE PREMIUM: Apart from single individual policies, a
company also sells group insurance schemes to corporate and other policy holders.
An insurance policy may be a single premium plan or a long term plan. The
following table depicts the total life insurance premium collected under both
individual and group plans by public sector and private sector life insurance
companies as listed below.

136
Table 7.3 Total Life Insurance premium collected (Rs. In Crores)
Source: IRDA Annual Reports
INSURER 2005-06 2006-07 2007-08 2008-09 2009-10 2010-11 2011-12 2012-13
LIC 90792.22
127822.84 149789.99 157288.04 186077.31 203473.31 202889.28 208830.58
HDFC Standard
1569.91
2855.87 4858.58 5564.69 7005.10 9004.17 10202.40 11322.68
ICICI Prudential
4261.05
7912.99 13561.08 15385.22 16528.75 17880.63 14021.58 13538.24
SBI Life 1075.32
2928.49 5622.14 7212.10 10104.03 12945.29 13133.74 10450.03
Reliance 224.21
1004.66 3225.44 4932.54 6604.90 6571.15 5497.62 4057.39
Bajaj Allianz
3133.58
5345.24 9725.31 10624.52 11419.71 9609.95 1483.8 6892.7
Max life 788.13
1500.28 2714.60 3857.26 4860.54 6812.63 6390.53 6638.70
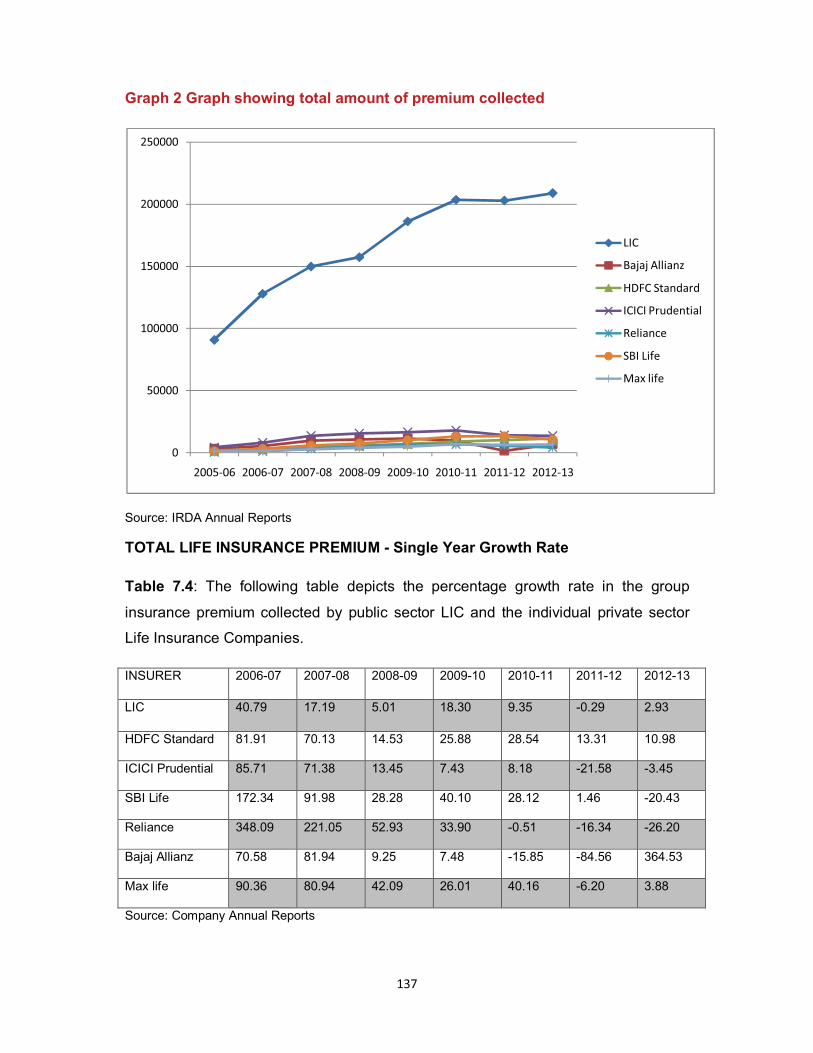
The table above clearly shows that the overall growth rate of LIC from the year 2005
up to 2012 has increased by 130%. However the growth rate of HDFC during the
same period is 621.23%. ICICI Prudential has shown a growth rate of 200%, SBI
Life has shown a phenomenal growth rate of 800%. Reliance has increased by a
whopping 1709%, Bajaj Allianz has shown a modest growth of 119% by 2012-13.
Max Life has shown a growth of 700% during the same period. The average growth
of the 6 private life insurance companies is 690%, five times that of LIC.
However in terms of consistency in growth, LIC has shown consistent growth during
the period showing an average of 200% in the second year and then maintaining a
net average of about 20% – 30% in all the years except three years 2008-09, 2011-
12 and 2012-13.Growth rates of private LIC s has shown tremendous volatility
ranging from 1709% to a negative growth rate in some of the years. In the last year,
most of the private companies researched i.e, three out of five have shown negative
growth, however public sector LIC has a positive growth when compared to the last
year.
The following graph shows the total amount of premium in crores of rupees
137
Graph 2 Graph showing total amount of premium collected
Source: IRDA Annual Reports
TOTAL LIFE INSURANCE PREMIUM - Single Year Growth Rate
Table 7.4: The following table depicts the percentage growth rate in the group
insurance premium collected by public sector LIC and the individual private sector
Life Insurance Companies.
INSURER 2006-07 2007-08 2008-09 2009-10 2010-11 2011-12 2012-13
LIC 40.79
17.19 5.01 18.30 9.35 -0.29 2.93
HDFC Standard 81.91
70.13 14.53 25.88 28.54 13.31 10.98
ICICI Prudential 85.71
71.38 13.45 7.43 8.18 -21.58 -3.45
SBI Life 172.34
91.98 28.28 40.10 28.12 1.46 -20.43
Reliance 348.09
221.05 52.93 33.90 -0.51 -16.34 -26.20
Bajaj Allianz 70.58
81.94 9.25 7.48 -15.85 -84.56 364.53
Max life 90.36
80.94 42.09 26.01 40.16 -6.20 3.88
Source: Company Annual Reports
0
50000
100000
150000
200000
250000
2005-06 2006-07 2007-08 2008-09 2009-10 2010-11 2011-12 2012-13
LIC
Bajaj Allianz
HDFC Standard
ICICI Prudential
Reliance
SBI Life
Max life
138
The table above clearly depicts the percentage change in total life premiums
collected. The initial years have shown a spectacular growth when compared to the
past years. Private LIC s have even growth 348.09% when compared to a modest
40.79% growth being the highest growth reported by LIC in the Single insurance
premium sector. However the volatility in growth rates in private LIC s is clearly
evident as some of them have fallen by nearly 84%. Among the private companies,
the top two companies, SBI Life and ICICI Prudential have shown erratic growth
trends. This could be attributed to the changes in IRDA regulations in the year 2010
with regard to unit linked policies. The year 2006 -07 and 2007 -08 showed
tremendous growth in the policies. The withdrawal of most of the unit linked
products by both public sector LIC and private sector LIC s have led to negative
growth in total life insurance premium.
SETTLEMENT OF DEATH CLAIM: The time taken for settlement of death claims is
also an important determinant of the client relationship strategies and settlement of
maturity and death claims go a long way in building up the image of the company.
The average time taken by an insurance company is about six months. However the
earlier the claim is settled and fewer the claims repudiated increases customer
retention and loyalty for the insurance company.
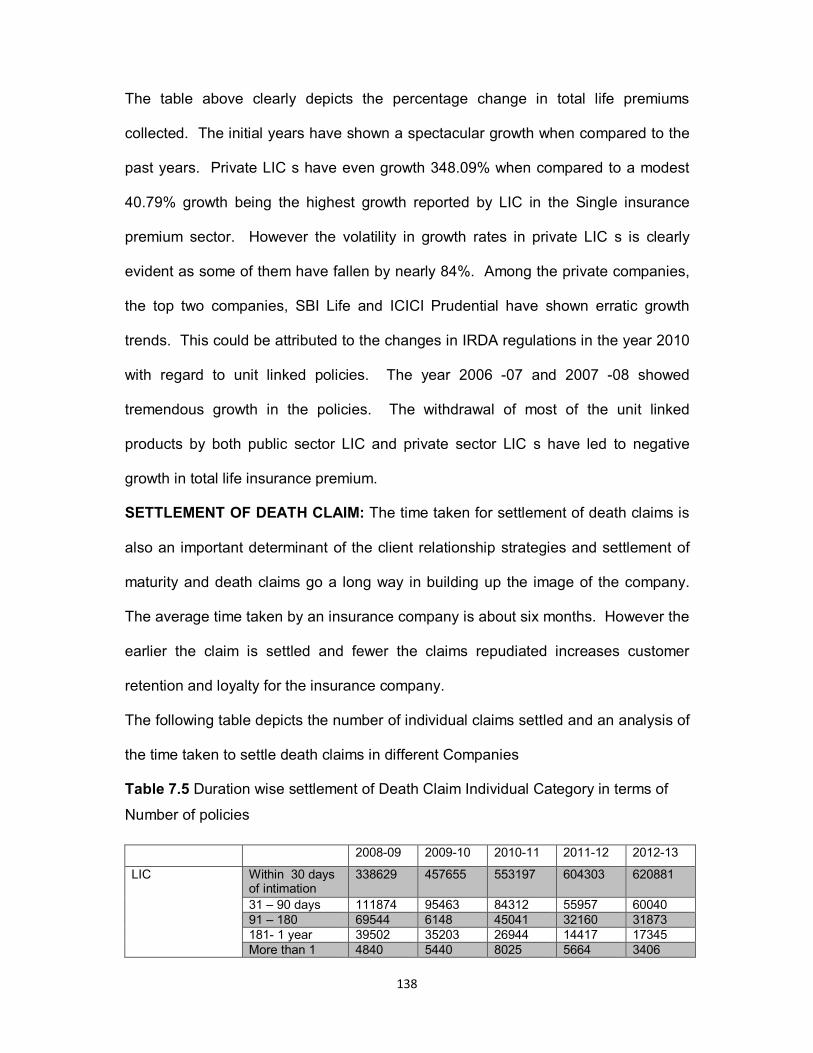
The following table depicts the number of individual claims settled and an analysis of
the time taken to settle death claims in different Companies
Table 7.5 Duration wise settlement of Death Claim Individual Category in terms of
Number of policies
2008-09 2009-10 2010-11 2011-12 2012-13
LIC Within 30 days of intimation
338629 457655 553197 604303 620881
31 – 90 days 111874 95463 84312 55957 60040 91 – 180 69544 6148 45041 32160 31873 181- 1 year 39502 35203 26944 14417 17345 More than 1 4840 5440 8025 5664 3406

139
Year Bajaj Allianz Within 30 days
of intimation 5550 7567 15469 17656 17635
31 – 90 days 3863 9524 6717 6083 5175 91 – 180 889 2964 1388 840 1376 181- 1 year 127 215 345 43 6 More than 1 Year
55 46 61 36 -
HDFC Standard Within 30 days of intimation
1214 1977 3384 4588 5338
31 – 90 days 753 1062 720 345 602 91 – 180 352 314 211 13 48 181- 1 year 190 115 39 4 - More than 1 Year
40 29 15 2 -
ICICI Prudential Within 30 days of intimation
7274 10740 12170 11270 13736
31 – 90 days 1263 2231 1637 2646 362 91 – 180 573 1016 765 292 253 181- 1 year 178 462 280 32 9 More than 1 Year
10 30 308 74 33
Reliance Within 30 days of intimation
3073 6779 10326 10574 13221
31 – 90 days 73 681 2685 6387 4731 91 – 180 30 72 229 387 540 181- 1 year 13 58 5 10 14 More than 1 Year
15 17 9 9 5
SBI Life Within 30 days of intimation
1765 4205 6572 10450 11217
31 – 90 days 965 1443 1528 839 1379 91 – 180 404 294 139 20 71 181- 1 year 108 45 8 10 7 More than 1 Year
20 35 2 9 2
Aviva Within 30 days of intimation
681 1474 1614 1669 1825
31 – 90 days 185 115 219 235 283
91 – 180 102 23 32 33 23
181- 1 year 41 13 16 13 -
More than 1 Year
23 10 25 56 3
Private total Within 30 days of intimation
23308 43368 70246 81949 90182
31 – 90 days 11679 20234 19753 23144 18595
91 – 180 4107 7130 4715 3564 4076
181- 1 year 1290 1254 1117 644 360
More than 1 Year
355 214 572 464 171
Source: IRDA Annual Reports
In the study period of five years LIC s individual claims have increased to 200% and
those of private companies have increased almost five times in all the companies.

140
Right from the beginning the private companies have been very efficient in claim
settlement and almost 90% of the claims have been settled within 30 days of
intimation of the claim.
DURATION WISE SETTLEMENT OF DEATH CLAIM INDIVIDUAL CATEGORY
(NO. OF POLICIES) –Percentage analysis
The table below shows the speed in which individual death claims are settled by
various life insurance companies, both public sector LIC and top private LIC
companies.
Table 7.6 – Table showing Percentage of policies in terms of number of policies by
Life Insurance Companies
2008-09 2009-10 2010-11 2011-12 2012-13
LIC Within 30 days of intimation
60 % 76.29 % 77.1 % 84.81 % 84.64 %
31 – 90 days 19.82 % 15.91 % 11.75 % 7.85 % 8.18 % 91 – 180 12.32 % 1.02 % 6.28 % 4.51 % 4.35 % 181- 1 year 7 % 5.87 % 3.76 % 2.02 % 2.36 % More than 1 Year 0.86 % 0.91 % 1.12 % 0.79 % 0.46 %
HDFC Standard Within 30 days of intimation
47.63 % 56.53 % 77.45 % 92.65 % 89.14 %
31 – 90 days 29.54 % 30.37 % 16.48 % 6.97 % 10.05 % 91 – 180 13.81 % 8.98 % 4.83 % 0.26 % 0.8 % 181- 1 year 7.45 % 3.29 % 0.89 % 0.08 % 0 % More than 1 Year 1.57 % 0.83 % 0.34 % 0.04 % 0 %
ICICI Prudential Within 30 days of intimation
78.23 % 74.18 % 80.28 % 78.73 % 95.44 %
31 – 90 days 13.58 % 15.41 % 10.8 % 18.49 % 2.52 % 91 – 180 6.16 % 7.02 % 5.05 % 2.04 % 1.76 % 181- 1 year 1.91 % 3.19 % 1.85 % 0.22 % 0.06 % More than 1 Year 0.11 % 0.21 % 2.03 % 0.52 % 0.23 %
Source: IRDA Annual Reports
It is evident from the table above that in the year 2008-09 LIC s claim settlement rate
within 30days of intimation was only 60%. However with increase in competition,
LIC became more efficient in settling claims because private companies specialized
in quick settlement of claims. Private companies have consistently showed high
claim settlement rates right through the period of study. It is thus proven that the
claim settlement procedure which was very slow in public sector LIC before the

141
advent of private life insurance companies has now improved due to loss of
monopoly position of LIC. The table below is the continuation of the analysis of the
other private insurance companies’ duration of settlement of claims from the date of
intimation.
Table 7.7 Table showing Percentage of policies in terms of number of policies by
Life Insurance Companies
2008-09 2009-10 2010-11 2011-12 2012-13
SBI Life Within 30 days of intimation
54.11 % 69.83 % 79.67 % 92.25 % 88.49 %
31 – 90 days 29.58 % 23.96 % 18.52 % 7.41 % 10.88 %
91 – 180 12.39 % 4.88 % 1.69 % 0.18 % 0.56 %
181- 1 year 3.31 % 0.75 % 0.1 % 0.09 % 0.06 %
More than 1 Year 0.61 % 0.58 % 0.02 % 0.08 % 0.02 %
Reliance Within 30 days of intimation
95.91 % 89.12 % 77.91 % 60.89 % 71.42 %
31 – 90 days 2.28 % 8.95 % 20.26 % 36.78 % 25.56 %
91 – 180 0.94 % 0.95 % 1.73 % 2.23 % 2.92 %
181- 1 year 0.41 % 0.76 % 0.04 % 0.06 % 0.08 %
More than 1 Year 0.47 % 0.22 % 0.07 % 0.05 % 0.03 %
Bajaj Allianz Within 30 days of intimation
52.94 % 37.25 % 64.51 % 71.6 % 72.9 %
31 – 90 days 36.85 % 46.88 % 28.01 % 24.67 % 21.39 %
91 – 180 8.48 % 14.59 % 5.79 % 3.41 % 5.69 %
181- 1 year 1.21 % 1.06 % 1.44 % 0.17 % 0.02 %
More than 1 Year 0.52 % 0.23 % 0.25 % 0.15 % 0 %
Aviva Within 30 days of intimation
65.99 % 90.15 % 84.68 % 83.2 % 85.52 %
31 – 90 days 17.93 % 7.03 % 11.49 % 11.71 % 13.26 %
91 – 180 9.88 % 1.41 % 1.68 % 1.65 % 1.08 %
181- 1 year 3.97 % 0.8 % 0.84 % 0.65 % 0 %
More than 1 Year 2.23 % 0.61 % 1.31 % 2.79 % 0.14 %
Private total Within 30 days of intimation
57.21 % 60.07 % 72.87 % 74.66 % 79.54 %
31 – 90 days 28.67 % 28.02 % 20.49 % 21.09 % 16.4 %
91 – 180 10.08 % 9.88 % 4.89 % 3.25 % 3.59 %
181- 1 year 3.17 % 1.74 % 1.16 % 0.59 % 0.32 %
More than 1 Year 0.87 % 0.3 % 0.59 % 0.42 % 0.15 %
Source: IRDA Annual Reports
It is evident from the table above that the overall efficiency of settlement of claims
has consistently increased over the past five years among the private companies.
Companies with faster claim settlement rates have a competitive edge over the other
companies and are thus building goodwill by keeping clients’ interest their top most

142
priority. Quick claim settlement is one of the major determinants in customer
satisfaction and determines the length of client’s association with the Life Insurance
companies and reduces the possibility of termination due to lapse of policy.
SETTLEMENT OF DEATH CLAIM – INDIVIDUAL CATEGORY BENEFIT AMOUNT
PAID (Rs. In Crores)
The following table depicts the benefit amount paid and the duration wise settlement
of death claim. Claims of LIC have increased almost twenty five times in terms of
amount in the past five years. Claims on private sector LIC s have also increased
tremendously over the past five years, ranging from five times in case of ICICI and
Reliance and to ten times in case of the other private life insurance companies over
the past five years.
Table 7.8 Table showing Duration wise settlement of Death claim under Individual
category and the benefit amount paid in Crores of rupees
2008-09 2009-10 2010-11 2011-12 2012-13
LIC Within 30 days of intimation
249.02 3340.12 4708.08 5369.01 5634.86
31 – 90 days 828.03 707.6 709.46 606.99 1102.53 91 – 180 504.84 445.83 378.43 360.50 306.56 181- 1 year 291.49 260.93 228.67 150.69 140.21 More than 1 Year 41.72 40.07 68.5 72.32 38.74
HDFC Standard Within 30 days of intimation
8.88 26.95 48.92 81.10 105.65
31 – 90 days 14.53 20.59 20.38 14.88 34.05 91 – 180 8.15 14.43 8.17 0.77 4.23 181- 1 year 5.1 2.38 1.16 0.10 - More than 1 Year 1.17 1.33 1.95 0.12 -
ICICI Prudential Within 30 days of intimation
63.3 165.25 117.85 159.05 262.87
31 – 90 days 22.3 28.01 31.96 42.75 13.95 91 – 180 12.79 15.56 23.81 8.58 14.70 181- 1 year 3.1 8.34 19.63 0.84 0.19 More than 1 Year 0.20 0.87 8.43 1.63 0.79
SBI Life Within 30 days of intimation
21 54.45 94.9 150.83 166.98
31 – 90 days 16.04 28.51 38.8 24.94 45.25 91 – 180 7.61 7.05 4.58 0.69 4.87 181- 1 year 2.03 1.41 0.27 0.21 0.36 More than 1 Year 0.31 1.02 0.29 0.27 0.07
Reliance Within 30 days of intimation
32.24 62.68 78.90 80.18 119.40
31 – 90 days 1.74 12.85 33.97 84.27 73.15 91 – 180 0.59 2.37 6.15 15 14.78 181- 1 year 0.28 1.56 0.24 34 0.33

143
More than 1 Year 0.21 0.15 0.2 0.27 0.21 Bajaj Allianz Within 30 days of
intimation 80.61 93.22 188.009 228.09 226.75
31 – 90 days 73.86 143.85 103.56 100.90 85.28 91 – 180 17.07 50.87 26.52 24.72 37.17 181- 1 year 2.14 5.88 7.65 1019 0.05 More than 1 Year 0.76 1.10 1.02 0.77 -
Aviva Within 30 days of intimation
14.09 21.83 28.25 32.07 49.79
31 – 90 days 4.43 2.5 5.76 17.22 24.95 91 – 180 2.54 0.43 0.95 2.26 5.16 181- 1 year 0.99 0.24 0.25 0.40 - More than 1 Year 0.33 0.37 0.87 1.46 0.07
Private total Within 30 days of intimation
288.94 599.04 927.48 1223.03 1492.11
31 – 90 days 231.33 372.52 391.6 483.38 487.23 91 – 180 83.69 152.31 126.32 114.98 147.62 181- 1 year 23.81 29.14 40.40 16.40 13 More than 1 Year 5.35 5.57 16.30 55.44 7.36
Source: IRDA Annual Reports
On an average claims of private companies have increased five times the amount
paid in five years. The table given below shows the percentage of amount of death
claims and the duration of their settlement in the category of individual claims.
SETTLEMENT OF DEATH CLAIM – INDIVIDUAL CATEGORY BENEFIT AMOUNT
PAID – Percentage Analysis
The following table depicts the benefit amount paid and the duration wise settlement
of death claim in terms of percentage.
Table 7.9 Table showing Duration wise settlement of Death claim in Individual
category in terms of Benefit paid in percentages
2008-09 2009-10 2010-11 2011-12 2012-13 LIC Within 30 days of
intimation 13 % 69.66 % 77.27 % 81.85 % 78.01 %
31 – 90 days 43.24 % 14.76 % 11.64 % 9.25 % 15.26 % 91 – 180 26.36 % 9.3 % 6.21 % 5.5 % 4.24 % 181- 1 year 15.22 % 5.44 % 3.75 % 2.3 % 1.94 % More than 1 Year 2.18 % 0.84 % 1.12 % 1.1 % 0.54 %
HDFC Standard Within 30 days of intimation
23.47 % 41.03 % 60.71 % 83.63 % 73.4 %
31 – 90 days 38.41 % 31.35 % 25.29 % 15.34 % 23.66 % 91 – 180 21.54 % 21.97 % 10.14 % 0.79 % 2.94 % 181- 1 year 13.48 % 3.62 % 1.44 % 0.1 % 0 % More than 1 Year 3.09 % 2.02 % 2.42 % 0.12 % 0 %
ICICI Prudential Within 30 days of 62.25 % 75.79 % 58.43 % 74.72 % 89.87 %

144
intimation
31 – 90 days 21.93 % 12.85 % 15.85 % 20.08 % 4.77 % 91 – 180 12.58 % 7.14 % 11.81 % 4.03 % 5.03 % 181- 1 year 3.05 % 3.83 % 9.73 % 0.39 % 0.06 % More than 1 Year 0.2 % 0.4 % 4.18 % 0.77 % 0.27 %
SBI Life Within 30 days of intimation
44.69 % 58.9 % 68.35 % 85.24 % 76.76 %
31 – 90 days 34.13 % 30.84 % 27.95 % 14.1 % 20.8 % 91 – 180 16.19 % 7.63 % 3.3 % 0.39 % 2.24 % 181- 1 year 4.32 % 1.53 % 0.19 % 0.12 % 0.17 % More than 1 Year 0.66 % 1.1 % 0.21 % 0.15 % 0.03 %
Reliance Within 30 days of intimation
91.96 % 78.73 % 66.05 % 37.52 % 57.44 %
31 – 90 days 4.96 % 16.14 % 28.44 % 39.43 % 35.19 % 91 – 180 1.68 % 2.98 % 5.15 % 7.02 % 7.11 % 181- 1 year 0.8 % 1.96 % 0.2 % 15.91 % 0.16 % More than 1 Year 0.6 % 0.19 % 0.17 % 0.13 % 0.1 %
Bajaj Allianz Within 30 days of intimation
46.21 % 31.61 % 57.54 % 16.61 % 64.92 %
31 – 90 days 42.34 % 48.78 % 31.69 % 7.35 % 24.42 % 91 – 180 9.79 % 17.25 % 8.12 % 1.8 % 10.64 % 181- 1 year 1.23 % 1.99 % 2.34 % 74.19 % 0.01 % More than 1 Year 0.44 % 0.37 % 0.31 % 0.06 % 0 %
Aviva Within 30 days of intimation
62.96 % 86.05 % 78.3 % 60.04 % 62.26 %
31 – 90 days 19.79 % 9.85 % 15.96 % 32.24 % 31.2 % 91 – 180 11.35 % 1.69 % 2.63 % 4.23 % 6.45 % 181- 1 year 4.42 % 0.95 % 0.69 % 0.75 % 0 % More than 1 Year
1.47 % 1.46 % 2.41 % 2.73 % 0.09 %
Private total Within 30 days of intimation
45.64 % 51.7 % 61.75 % 64.6 % 69.49 %
31 – 90 days 36.54 % 32.15 % 26.07 % 25.53 % 22.69 % 91 – 180 13.22 % 13.15 % 8.41 % 6.07 % 6.87 % 181- 1 year 3.76 % 2.52 % 2.69 % 0.87 % 0.61 % More than 1 Year
0.85 % 0.48 % 1.09 % 2.93 % 0.34 %
Source: IRDA Annual Reports
In the case of LIC, it is evident from the table that five years ago only 13% of the
amount paid out as claims happened within the first thirty days of claim intimation.
However on an average during the same period, nearly fifty percent of the claims of
private life insurance companies were settled within thirty days of intimation. This
percentage gradually and consistently increased to nearly seventy per cent in the
year 2012-2013. LIC shows erratic growth in claim settlement percentages.
145
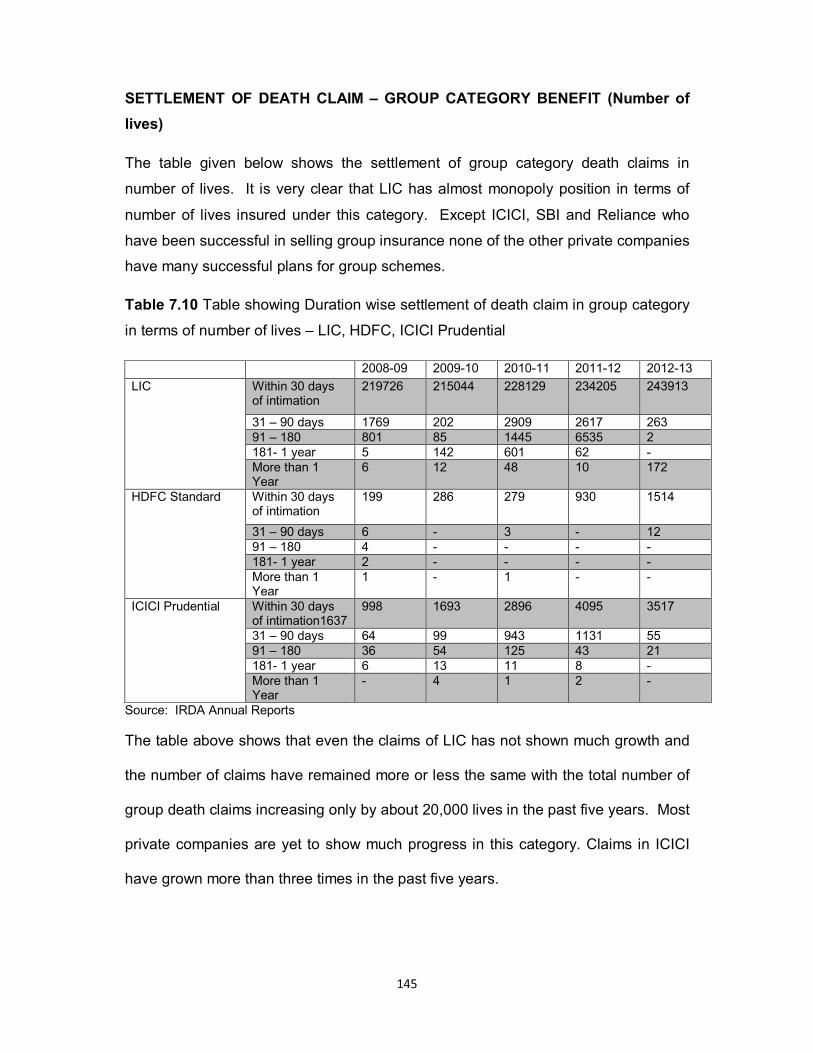
SETTLEMENT OF DEATH CLAIM – GROUP CATEGORY BENEFIT (Number of
lives)
The table given below shows the settlement of group category death claims in
number of lives. It is very clear that LIC has almost monopoly position in terms of
number of lives insured under this category. Except ICICI, SBI and Reliance who
have been successful in selling group insurance none of the other private companies
have many successful plans for group schemes.
Table 7.10 Table showing Duration wise settlement of death claim in group category
in terms of number of lives – LIC, HDFC, ICICI Prudential
2008-09 2009-10 2010-11 2011-12 2012-13
LIC Within 30 days of intimation
219726 215044 228129 234205 243913
31 – 90 days 1769 202 2909 2617 263 91 – 180 801 85 1445 6535 2 181- 1 year 5 142 601 62 - More than 1 Year
6 12 48 10 172
HDFC Standard Within 30 days of intimation
199 286 279 930 1514
31 – 90 days 6 - 3 - 12 91 – 180 4 - - - - 181- 1 year 2 - - - - More than 1 Year
1 - 1 - -
ICICI Prudential Within 30 days of intimation1637
998 1693 2896 4095 3517
31 – 90 days 64 99 943 1131 55 91 – 180 36 54 125 43 21 181- 1 year 6 13 11 8 - More than 1 Year
- 4 1 2 -
Source: IRDA Annual Reports
The table above shows that even the claims of LIC has not shown much growth and
the number of claims have remained more or less the same with the total number of
group death claims increasing only by about 20,000 lives in the past five years. Most
private companies are yet to show much progress in this category. Claims in ICICI
have grown more than three times in the past five years.
146
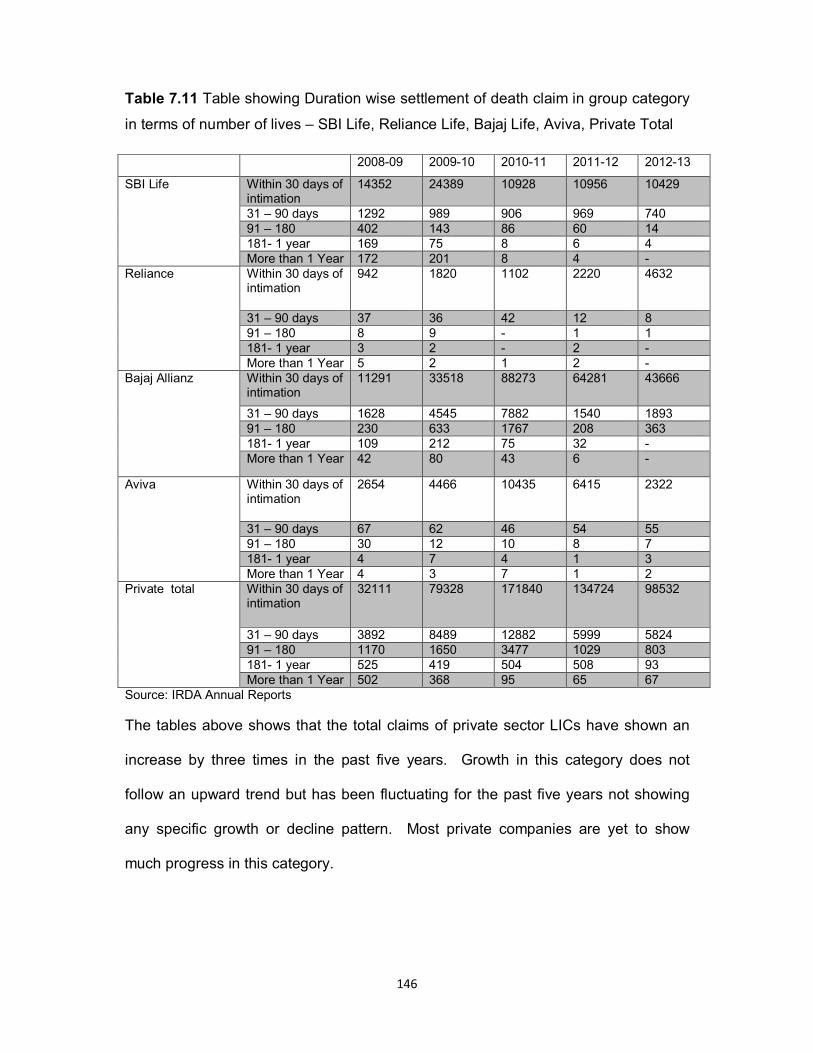
Table 7.11 Table showing Duration wise settlement of death claim in group category
in terms of number of lives – SBI Life, Reliance Life, Bajaj Life, Aviva, Private Total
2008-09 2009-10 2010-11 2011-12 2012-13
SBI Life Within 30 days of intimation
14352 24389 10928 10956 10429
31 – 90 days 1292 989 906 969 740 91 – 180 402 143 86 60 14 181- 1 year 169 75 8 6 4 More than 1 Year 172 201 8 4 -
Reliance Within 30 days of intimation
942 1820 1102 2220 4632
31 – 90 days 37 36 42 12 8 91 – 180 8 9 - 1 1 181- 1 year 3 2 - 2 - More than 1 Year 5 2 1 2 -
Bajaj Allianz Within 30 days of intimation
11291 33518 88273 64281 43666
31 – 90 days 1628 4545 7882 1540 1893 91 – 180 230 633 1767 208 363 181- 1 year 109 212 75 32 - More than 1 Year 42 80 43 6 -
Aviva Within 30 days of intimation
2654 4466 10435 6415 2322
31 – 90 days 67 62 46 54 55 91 – 180 30 12 10 8 7 181- 1 year 4 7 4 1 3 More than 1 Year 4 3 7 1 2
Private total Within 30 days of intimation
32111 79328 171840 134724 98532
31 – 90 days 3892 8489 12882 5999 5824 91 – 180 1170 1650 3477 1029 803 181- 1 year 525 419 504 508 93 More than 1 Year 502 368 95 65 67
Source: IRDA Annual Reports
The tables above shows that the total claims of private sector LICs have shown an
increase by three times in the past five years. Growth in this category does not
follow an upward trend but has been fluctuating for the past five years not showing
any specific growth or decline pattern. Most private companies are yet to show
much progress in this category.

147
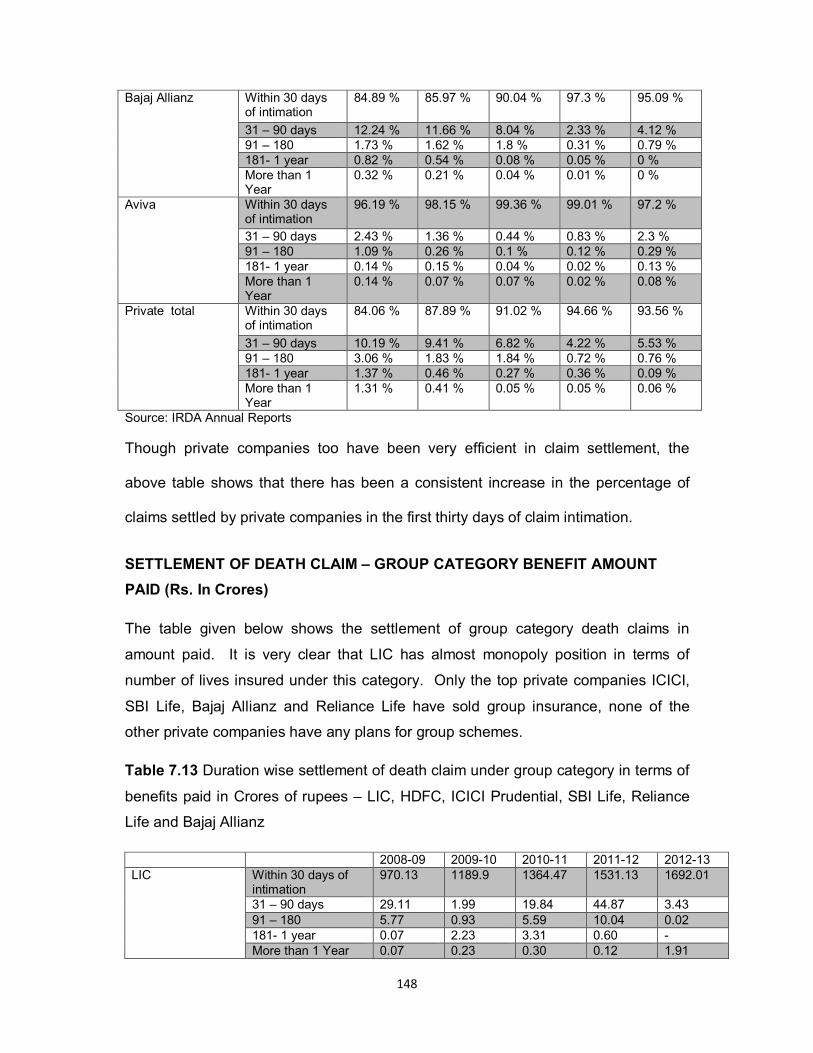
SETTLEMENT OF DEATH CLAIM – GROUP CATEGORY BENEFIT AMOUNT
(number of lives) –Percentage analysis
The table given below the percentage of death claims benefits paid under group
category is clearly depicted. Public sector LIC shows tremendous efficiency in
settlement of group category death claims with nearly hundred percent of the claims
being settled in the first thirty days of intimation. Claim settlement efficiency has
remained constantly good in the case of LIC.
Table 7.12 Duration wise settlement of Death claim under group category on the
basis of number of lives on percentage basis
2008-09 2009-10 2010-11 2011-12 2012-13 LIC Within 30 days
of intimation 98.84 % 99.8 % 97.85 % 96.21 % 99.82 %
31 – 90 days 0.8 % 0.09 % 1.25 % 1.08 % 0.11 % 91 – 180 0.36 % 0.04 % 0.62 % 2.68 % 0 % 181- 1 year 0 % 0.07 % 0.26 % 0.03 % 0 % More than 1 Year
0 % 0.01 % 0.02 % 0 % 0.07 %
HDFC Standard Within 30 days of intimation
93.87 % 100 % 98.59 % 100 % 99.21 %
31 – 90 days 2.83 % 0 % 1.06 % 0 % 0.79 % 91 – 180 1.89 % 0 % 0 % 0 % 0 % 181- 1 year 0.94 % 0 % 0 % 0 % 0 % More than 1 Year
0.47 % 0 % 0.35 % 0 % 0 %
ICICI Prudential Within 30 days of intimation1637
90.4 % 90.87 % 72.84 % 77.57 % 97.88 %
31 – 90 days 5.8 % 5.31 % 23.72 % 21.42 % 1.53 % 91 – 180 3.26 % 2.9 % 3.14 % 0.81 % 0.58 % 181- 1 year 0.54 % 0.7 % 0.28 % 0.15 % 0 % More than 1 Year
0 % 0.21 % 0.03 % 0.04 % 0 %
SBI Life Within 30 days of intimation
87.58 % 94.54 % 91.55 % 91.34 % 93.22 %
31 – 90 days 7.88 % 3.83 % 7.59 % 8.08 % 6.61 % 91 – 180 2.45 % 0.55 % 0.72 % 0.5 % 0.13 % 181- 1 year 1.03 % 0.29 % 0.07 % 0.05 % 0.04 % More than 1 Year
1.05 % 0.78 % 0.07 % 0.03 % 0 %
Reliance Within 30 days of intimation
94.67 % 97.38 % 96.24 % 99.24 % 99.81 %
31 – 90 days 3.72 % 1.93 % 3.67 % 0.54 % 0.17 % 91 – 180 0.8 % 0.48 % 0 % 0.04 % 0.02 % 181- 1 year 0.3 % 0.11 % 0 % 0.09 % 0 % More than 1 Year
0.5 % 0.11 % 0.09 % 0.09 % 0 %
148
Bajaj Allianz Within 30 days of intimation
84.89 % 85.97 % 90.04 % 97.3 % 95.09 %
31 – 90 days 12.24 % 11.66 % 8.04 % 2.33 % 4.12 % 91 – 180 1.73 % 1.62 % 1.8 % 0.31 % 0.79 % 181- 1 year 0.82 % 0.54 % 0.08 % 0.05 % 0 % More than 1 Year
0.32 % 0.21 % 0.04 % 0.01 % 0 %
Aviva Within 30 days of intimation
96.19 % 98.15 % 99.36 % 99.01 % 97.2 %
31 – 90 days 2.43 % 1.36 % 0.44 % 0.83 % 2.3 % 91 – 180 1.09 % 0.26 % 0.1 % 0.12 % 0.29 % 181- 1 year 0.14 % 0.15 % 0.04 % 0.02 % 0.13 % More than 1 Year
0.14 % 0.07 % 0.07 % 0.02 % 0.08 %
Private total Within 30 days of intimation
84.06 % 87.89 % 91.02 % 94.66 % 93.56 %
31 – 90 days 10.19 % 9.41 % 6.82 % 4.22 % 5.53 % 91 – 180 3.06 % 1.83 % 1.84 % 0.72 % 0.76 % 181- 1 year 1.37 % 0.46 % 0.27 % 0.36 % 0.09 % More than 1 Year
1.31 % 0.41 % 0.05 % 0.05 % 0.06 %
Source: IRDA Annual Reports
Though private companies too have been very efficient in claim settlement, the
above table shows that there has been a consistent increase in the percentage of
claims settled by private companies in the first thirty days of claim intimation.
SETTLEMENT OF DEATH CLAIM – GROUP CATEGORY BENEFIT AMOUNT
PAID (Rs. In Crores)
The table given below shows the settlement of group category death claims in
amount paid. It is very clear that LIC has almost monopoly position in terms of
number of lives insured under this category. Only the top private companies ICICI,
SBI Life, Bajaj Allianz and Reliance Life have sold group insurance, none of the
other private companies have any plans for group schemes.
Table 7.13 Duration wise settlement of death claim under group category in terms of
benefits paid in Crores of rupees – LIC, HDFC, ICICI Prudential, SBI Life, Reliance
Life and Bajaj Allianz
2008-09 2009-10 2010-11 2011-12 2012-13 LIC Within 30 days of
intimation 970.13 1189.9 1364.47 1531.13 1692.01
31 – 90 days 29.11 1.99 19.84 44.87 3.43 91 – 180 5.77 0.93 5.59 10.04 0.02 181- 1 year 0.07 2.23 3.31 0.60 - More than 1 Year 0.07 0.23 0.30 0.12 1.91

149
HDFC Standard Within 30 days of intimation
2.22 2.36 2.77 6.44 16.35
31 – 90 days 0.2 - 0.02 - 4.14 91 – 180 0.13 - - - - 181- 1 year 0.12 - - - - More than 1 Year 0.04 - - - -
ICICI Prudential Within 30 days of intimation
17.72 26.51 30.34 42.50 55.33
31 – 90 days 2.91 3.58 11.90 16.40 5.61 91 – 180 1.37 2.4 1.88 0.89 2.05 181- 1 year 0.34 0.55 0.95 0.08 - More than 1 Year - 0.3 - 0.09 -
SBI Life Within 30 days of intimation
111.62 135.74 148.65 171.48 192.02
31 – 90 days 26.26 23.52 24.49 28.43 28.93 91 – 180 6.31 3.72 3.53 3.23 0.93 181- 1 year 3.6 1.35 0.46 0.31 0.30 More than 1 Year 3.87 5.98 1.41 0.91 -
Reliance Within 30 days of intimation
19.59 23.76 24.65 24.63 27.69
31 – 90 days 0.56 1.61 1.71 0.45 0.28 91 – 180 0.27 0.18 0 0.03 0.11 181- 1 year 0.16 0.01 0 0.51 - More than 1 Year 0.1 0.01 0.01 0.01 -
Bajaj Allianz Within 30 days of intimation
37.29 51.65 132.71 138.54 165.02
31 – 90 days 4.67 11.47 14.66 17.10 27.31 91 – 180 1 2.02 2.75 2.50 4.99 181- 1 year 0.5 0.71 0.45 0.13 - More than 1 Year 0.18 0.21 0.16 0.02 -
Source: IRDA Annual Reports
The table above shows that the claims of LIC have shown growth of about 100% in
the last five years. Most private companies are have group claims growth of about
five times in the past five years in terms of amount. Claims in ICICI have grown
more than three times in the past five years.
Table 7.14 Duration wise settlement of death claim under group category in terms of
benefits paid in Crores of rupees – Aviva and Private Total
Aviva Within30 days of intimation
5.7 11.10 25.64 19.52 16.38
31 – 90 days 0.69 0.37 0.1 0.66 1.40 91 – 180 0.06 0.02 0.02 0.44 0.15 181- 1 year 0.02 0.03 0.01 - 0.01 More than 1 Year
0.02 0.01 0.02 0.05 0.05
Private total Within30 days of intimation
227.59 341.29 571.04 668.22 812.12
31 – 90 days 57.86 63.92 74.94 101.58 114.44

150
91 – 180 20.22 18.72 15.30 20.53 21.08 181- 1 year 9.23 5.52 3.30 3.29 1.67 More than 1 Year
7.43 9.63 1.74 1.38 0.37
Source: IRDA Annual Reports
The above table depicts the growth in total claims settled by private companies over
the past five years, the overall amount of claim settled within thirty days having
increased nearly four times in the year 2012-13 when compared to 2008-09
SETTLEMENT OF DEATH CLAIM – GROUP CATEGORY BENEFIT AMOUNT
PAID –Percentage analysis
Table 7.15 Duration wise settlement of death claim under group category in terms of
benefits paid in percentages – LIC, HDFC, ICICI Prudential and SBI Life.
2008-09 2009-10 2010-11 2011-12 2012-13 LIC Within 30 days of
intimation 96.52 % 99.55 % 97.92 % 96.49 % 99.68 %
31 – 90 days 2.9 % 0.17 % 1.42 % 2.83 % 0.2 % 91 – 180 0.57 % 0.08 % 0.4 % 0.63 % 0 %
181- 1 year 0.01 % 0.19 % 0.24 % 0.04 % 0 % More than 1 Year 0.01 % 0.02 % 0.02 % 0.01 % 0.11 %
HDFC Standard Within 30 days of intimation
81.92 % 100 % 99.28 % 100 % 79.8 %
31 – 90 days 7.38 % 0 % 0.72 % 0 % 20.2 % 91 – 180 4.8 % 0 % 0 % 0 % 0 % 181- 1 year 4.43 % 0 % 0 % 0 % 0 % More than 1 Year 1.48 % 0 % 0 % 0 % 0 %
ICICI Prudential Within 30 days of intimation
79.32 % 79.51 % 67.32 % 70.88 % 87.84 %
31 – 90 days 13.03 % 10.74 % 26.4 % 27.35 % 8.91 % 91 – 180 6.13 % 7.2 % 4.17 % 1.48 % 3.25 % 181- 1 year 1.52 % 1.65 % 2.11 % 0.13 % 0 % More than 1 Year 0 % 0.9 % 0 % 0.15 % 0 %
SBI Life Within 30 days of intimation
73.6 % 79.7 % 83.26 % 83.91 % 86.43 %
31 – 90 days 17.32 % 13.81 % 13.72 % 13.91 % 13.02 % 91 – 180 4.16 % 2.18 % 1.98 % 1.58 % 0.42 % 181- 1 year 2.37 % 0.79 % 0.26 % 0.15 % 0.14 % More than 1 Year 2.55 % 3.51 % 0.79 % 0.45 % 0 %
Source: IRDA Annual Reports
The table above shows that LIC has been excellent in quick settlement of claims in
this category with most of the claims being settled within the first thirty days of
intimation. Private companies which are slowly picking up business in this line have
also showed a consistent increase in efficiency with most of the claims being settled

151
within a maximum period of thirty days and the remaining within ninety days. Very
few cases have gone beyond the time duration of six months.
The table below shows that almost all private companies have consistently increased
the efficiency in claim settlement and the private companies total also shows that
there is a 15% increase in the percentage of claims settled within the first thirty days,
with almost all of them being settled within six months.
Table 7.16 Duration wise settlement of death claim under group category in terms of benefits paid in percentages – Reliance, Bajaj Allianz & Aviva Reliance Within 30 days
of intimation 94.73 % 92.92 % 93.48 % 96.1 % 98.61 %
31 – 90 days 2.71 % 6.3 % 6.48 % 1.76 % 1 % 91 – 180 1.31 % 0.7 % 0 % 0.12 % 0.39 % 181- 1 year 0.77 % 0.04 % 0 % 1.99 % 0 % More than 1 Year
0.48 % 0.04 % 0.04 % 0.04 % 0 %
Bajaj Allianz Within 30 days of intimation
85.45 % 78.19 % 88.04 % 87.52 % 83.63 %
31 – 90 days 10.7 % 17.36 % 9.73 % 10.8 % 13.84 % 91 – 180 2.29 % 3.06 % 1.82 % 1.58 % 2.53 % 181- 1 year 1.15 % 1.07 % 0.3 % 0.08 % 0 % More than 1 Year
0.41 % 0.32 % 0.11 % 0.01 % 0 %
Aviva Within 30 days of intimation
87.83 % 96.27 % 99.42 % 94.44 % 91.05 %
31 – 90 days 10.63 % 3.21 % 0.39 % 3.19 % 7.78 % 91 – 180 0.92 % 0.17 % 0.08 % 2.13 % 0.83 % 181- 1 year 0.31 % 0.26 % 0.04 % 0 % 0.06 % More than 1 Year
0.31 % 0.09 % 0.08 % 0.24 % 0.28 %
Private total Within 30 days of intimation
70.61 % 77.73 % 85.7 % 84.05 % 85.52 %
31 – 90 days 17.95 % 14.56 % 11.25 % 12.78 % 12.05 % 91 – 180 6.27 % 4.26 % 2.3 % 2.58 % 2.22 % 181- 1 year 2.86 % 1.26 % 0.5 % 0.41 % 0.18 % More than 1 Year
2.31 % 2.19 % 0.26 % 0.17 % 0.04 %
Source: IRDA Annual Reports
TOTAL NUMBER OF POLICIES AND AMOUNT SETTLED (Individual)
Table 7.17 The table shown below depicts a comparative analysis of policy claims
settled in terms of total number of policies and the total amount paid as claims on
individual policies
152
INSURER 2008-09 2009-10 2010-11 2011-12 2012-13
LIC No. of policies 564389 653909 717529 35724745 36755451
Amount 4165.1 4799.55 6093.14 22033.88 41933.77
HDFC Standard No. of policies 2549 3497 4369 814726 1025739
Amount 37.83 66.58 80.58 2903.31 3294.26
ICICI Prudential No. of policies 9298 14479 15160 1028826 959958
Amount 101.69 128.04 201.68 3049.33 3420.87
SBI Life No. of policies 3262 6022 8249 881550 888670
Amount 64.98 92.44 138.84 3343.30 2800.92
Reliance No. of policies 3204 7797 13254 1093624 762532
Amount 35.06 79.61 119.46 1405.69 1117.24
Bajaj Allianz No. of policies 10484 20316 23980 1052336 730554
Amount 174.42 294.92 326.84 1805.81 1522.70
Aviva No. of policies 1032 1632 1906 180014 140073
Amount 22.38 25.37 36.08 527.71 430.31
Private total No. of policies 40739 72200 96403 8435592 7399173
Amount 633.12 1158.58 1502.10 22033.88 20307.10
Source: IRDA Annual Reports
Policy claims paid by LIC have increased around seven times over the past five
years in terms of amount disbursed and a tenfold increase in the number of policies
settled in terms of individual policies. During this period the total claims paid by all
private companies together has increased about 181 times the amount in the year
2008-09. Among the private companies, Aviva has shown a growth of about 140
times in five years, Bajaj Allianz has shown a growth of 17 times in volume, claims in
HDFC has grown 400 times, Reliance 237 times and SBI Life shows a positive
increase of 272 times the claims paid over a period of five years.
TOTAL NUMBER OF POLICIES AND AMOUNT SETTLED (Individual) Single
Year Growth Rate
Table 7.18 Table showing percentage change in total number of policies settled and
the amount paid
INSURER 2009-10 2010-11 2011-12 2012-13
LIC No. of policies 15.86 9.73 4878.86 2.89 Amount 15.23 26.95 261.62 90.31
153
HDFC Standard No. of policies 37.19 24.94 18547.88 25.90 Amount 76.00 21.03 3503.02 13.47
ICICI Prudential No. of policies 55.72 4.70 6686.45 -6.69 Amount 25.91 57.51 1411.96 12.18
SBI Life No. of policies 84.61 36.98 10586.75 0.81 Amount 42.26 50.19 2308.02 -16.22
Reliance No. of policies 143.35 69.99 8151.28 -30.27 Amount 127.07 50.06 1076.70 -20.52
Bajaj Allianz No. of policies 93.78 18.04 4288.39 -30.58 Amount 69.09 10.82 452.51 -15.68
Aviva No. of policies 58.14 16.79 9344.60 -22.19 Amount 13.36 42.22 1362.61 -18.46
Private total No. of policies 77.23 33.52 8650.34 -12.29 Amount 83.00 29.65 1366.87 -7.84
Source: IRDA Annual Reports
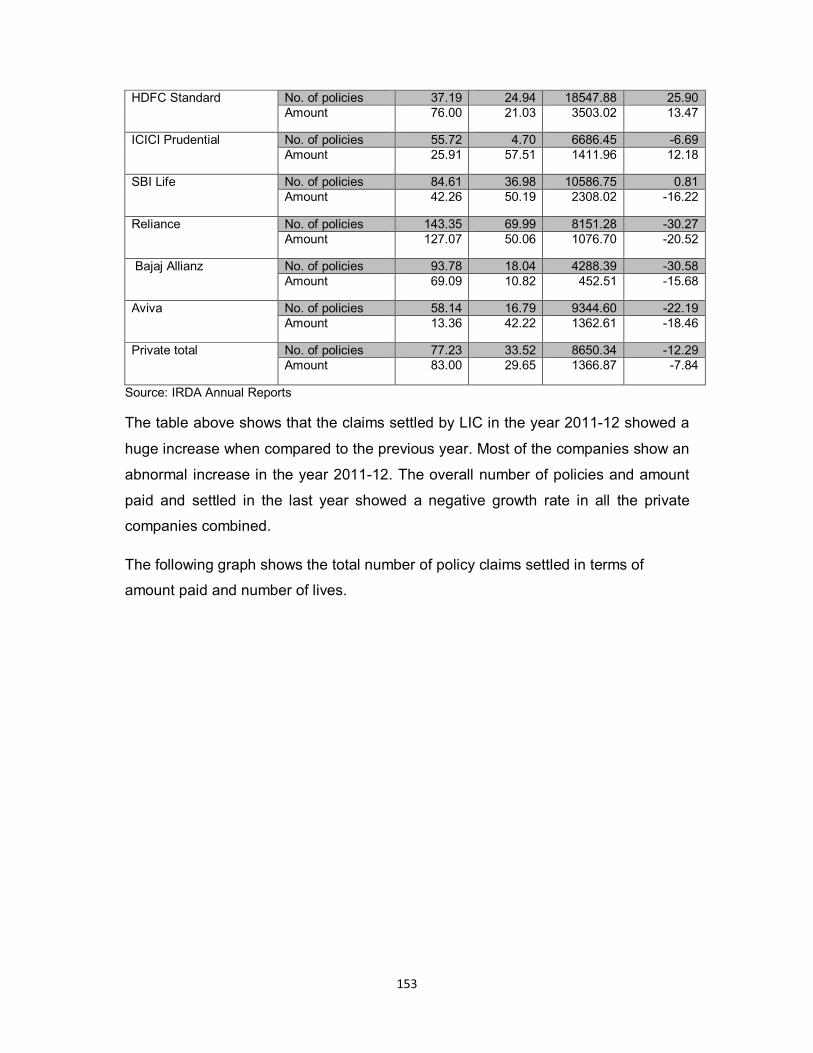
The table above shows that the claims settled by LIC in the year 2011-12 showed a
huge increase when compared to the previous year. Most of the companies show an
abnormal increase in the year 2011-12. The overall number of policies and amount
paid and settled in the last year showed a negative growth rate in all the private
companies combined.
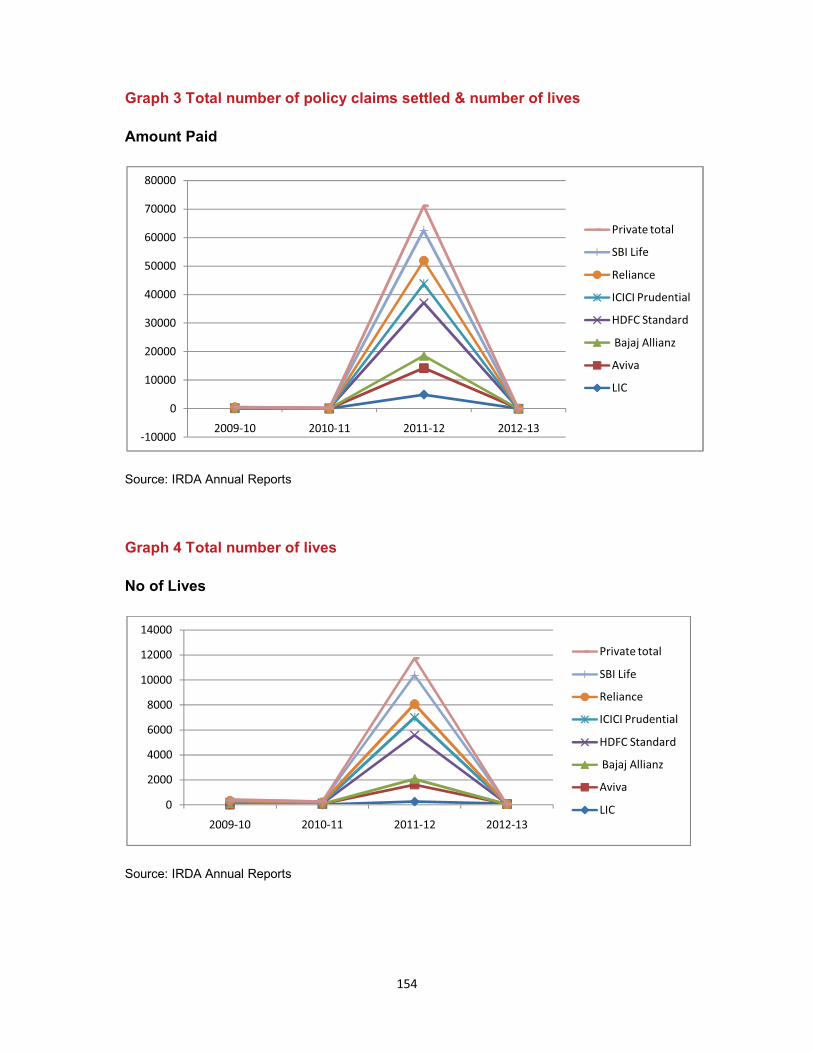
The following graph shows the total number of policy claims settled in terms of
amount paid and number of lives.
154
Graph 3 Total number of policy claims settled & number of lives
Amount Paid
Source: IRDA Annual Reports
Graph 4 Total number of lives
No of Lives
Source: IRDA Annual Reports
-10000
0
10000
20000
30000
40000
50000
60000
70000
80000
2009-10 2010-11 2011-12 2012-13
Private total
SBI Life
Reliance
ICICI Prudential
HDFC Standard
Bajaj Allianz
Aviva
LIC
0
2000
4000
6000
8000
10000
12000
14000
2009-10 2010-11 2011-12 2012-13
Private total
SBI Life
Reliance
ICICI Prudential
HDFC Standard
Bajaj Allianz
Aviva
LIC

155
Table 7.19 TOTAL NUMBER OF POLICIES AND AMOUNT SETTLED (GROUP)
(Rupees in Crores)
INSURER 2008-09 2009-10 2010-11 2011-12 2012-13
LIC No. of policies 222307 215485 233132 243429 245467
Amount 1005.15 1195.28 1393.51 1586.75 1709.08
HDFC Standard No. of policies 212 286 283 930 1526
Amount 2.71 2.36 2.78 6.44 20.49
ICICI Prudential No. of policies 1104 1863 3976 5279 3593
Amount 22.34 33.34 45.06 59.96 63.19
SBI Life No. of policies 16387 15817 11936 11995 11499
Amount 151.63 170.32 178.54 204.66 233.90
Reliance No. of policies 995 1869 1145 2237 4641
Amount 20.61 25.59 26.36 25.62 28.07
Bajaj Allianz No. of policies 13300 38988 28040 66067 45922
Amount 43.64 66.05 150.73 158.29 197.32
Aviva No. of policies 2759 4550 10502 6479 2329
Amount 6.49 11.53 25.79 20.67 17.99
Private total No. of policies 38200 9254 188798 142325 119970
Amount 322.33 439.08 666.31 794.99 1040.34
Source: IRDA Annual Reports
In the group category, there is almost consistent growth in claims paid and settled
amounts in the five year period given above. The overall private sector has shown
an abnormal variation in the number of policies paid and amount claimed in the
period of five years.
Analysis of Operating efficiency – The second determinant of performance of life
insurance companies is an analysis of profit and operating expenses of both private
and public sector Life Insurance Companies. An indepth analysis was made of all
the factors that determine the profitability of an insurance company and the various
factors are presented in the following charts and tables.
PROFIT BEFORE TAXATION AS PER SHAREHOLDERS’ ACCOUNT (IN LAKHS)
The following table is a representation of profits of various insurance companies over
a period of eight years through profit analysis and expense

156
Table 7.20 Table showing profit before taxation in lakhs
INSURER 2005-06 2006-07 2007-08 2008-09 2009-10 2010-11 2011-12 2012-13
LIC 63158
77362 84463 95735 106072 117180 131334 148992
HDFC Standard
-12875
-12556 -24351 -50296 -27518 -9900 27102 45572
ICICI Prudential
-2333
-69167 -154314 -88070 28053 83250 141372 156961
SBI Life 203
384 3475 -2664 27749 37045 55582 62217
Reliance -9840 -31511 76807 108491 28397 12929 3757 38042
Bajaj Allianz -9854
-7170 -21388 -7067 55699 108166 134958 134357
Aviva -14387
-13175 -20249 -49550 -34472 2875 7357 3200
Source: IRDA Annual Reports
The LIC of India due to the its head start and advantageous position of being the first
and only life insurance company since 1956 has been consistently making profits
and in the past eight years its profit has increased more than 200%. There is an
average increase of about 10,000 lakhs every year in premiums collected by LIC.
Among the private companies in the year 2005-06 all private companies surveyed
except SBI Life showed losses. Maximum loss reported was by AVIVA which was
the latest entry to the insurance segment. This is attributed to the fact that almost all
private companies which were still in the initial years of their existence had not yet
reached breakeven point. In the year 2006-07 too all private companies except SBI
Life recorded losses with ICICI Prudential reporting the highest loss which more than
doubled in the year 2007-08. However, Reliance and SBI Life showed profits in the
year 2007-08 and all other companies continued their loss making spree. The year
2008-09 too was not good for the private companies and losses were reported by all
companies except Reliance. SBI Life reported a loss for the first time after four years
however made up with a huge profit in the next year and the dramatic increase
continued up to 2012-13. Almost all the companies had a break even in the year
157
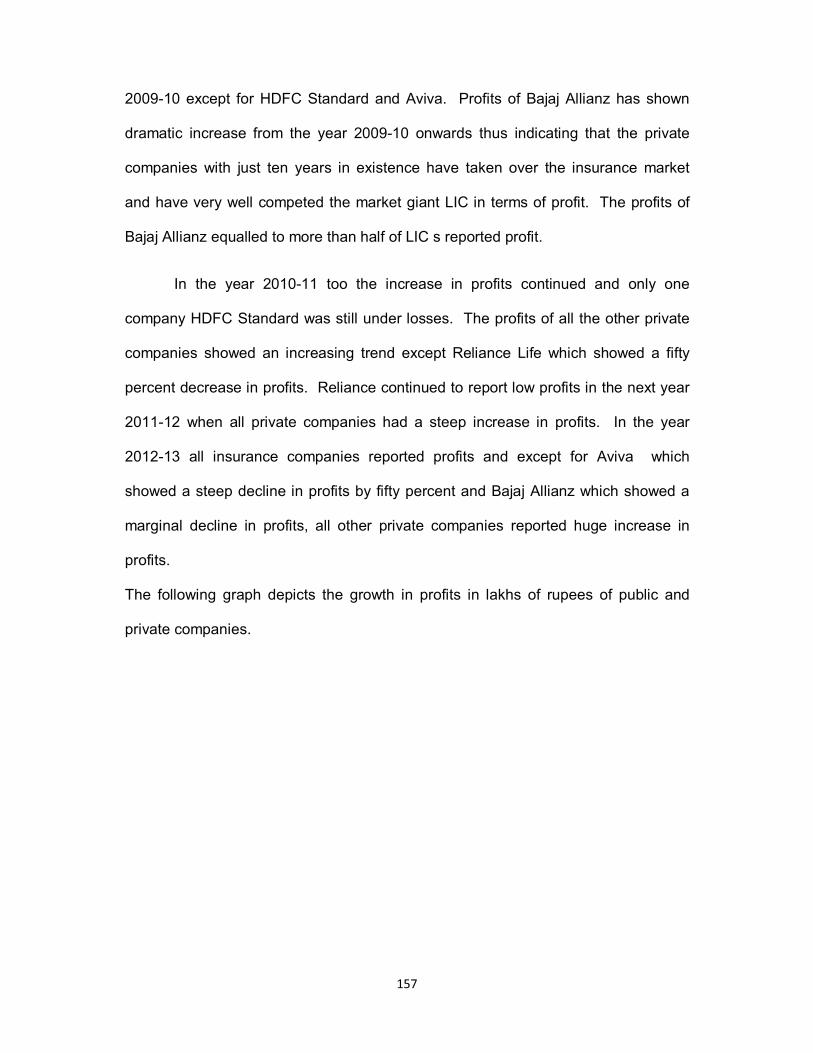
2009-10 except for HDFC Standard and Aviva. Profits of Bajaj Allianz has shown
dramatic increase from the year 2009-10 onwards thus indicating that the private
companies with just ten years in existence have taken over the insurance market
and have very well competed the market giant LIC in terms of profit. The profits of
Bajaj Allianz equalled to more than half of LIC s reported profit.
In the year 2010-11 too the increase in profits continued and only one
company HDFC Standard was still under losses. The profits of all the other private
companies showed an increasing trend except Reliance Life which showed a fifty
percent decrease in profits. Reliance continued to report low profits in the next year
2011-12 when all private companies had a steep increase in profits. In the year
2012-13 all insurance companies reported profits and except for Aviva which
showed a steep decline in profits by fifty percent and Bajaj Allianz which showed a
marginal decline in profits, all other private companies reported huge increase in
profits.
The following graph depicts the growth in profits in lakhs of rupees of public and
private companies.

158
Graph 5 Growth in profits of insurance companies
Source: IRDA Annual Reports
PROFIT BEFORE TAXATION SINGLE YEAR GROWTH RATE
The following table shows the growth rate of profit as per shareholder’s account for
the period of seven years showing rate of increase in profits of both LIC and private
sector life insurance companies
Table 7.21 Table showing profit before taxation – percentage of growth over
previous year
INSURER 2006-07 2007-08 2008-09 2009-10 2010-11 2011-12 2012-13
LIC 22.49 9.18 13.35 10.80 10.47 12.08 13.45
HDFC
Standard
-2.48 93.94 106.55 -45.29 -64.02 -373.76 68.15
ICICI
Prudential
2864.72 123.10 -42.93 -131.85 196.76 69.82 11.03
SBI Life 89.16 804.95 -176.66 -1141.63 33.50 50.04 11.94
Reliance 220.23 -343.75 41.25 -73.83 -54.47 -70.94 912.56
Bajaj Allianz -27.24 198.30 -66.96 -888.16 94.20 24.77 -0.45
Aviva -8.42 53.69 144.70 -30.43 -108.34 155.90 -56.50
Source: IRDA Annual Reports
-200000
-100000
0
100000
200000
300000
400000
500000
600000
700000
2005-06 2006-07 2007-08 2008-09 2009-10 2010-11 2011-12 2012-13
SBI Life
Reliance
ICICI Prudential
HDFC Standard
Bajaj Allianz
Aviva
LIC

159
Table 7.22 Table showing Net profit net profit earned by insurance companies after
tax
INSURER
3/31/2005
3/31/2006 3/31/2007
3/31/2008 3/31/2009 3/31/2010 3/31/2011 3/31/2012 3/31/2013
LIC 70,836.50
63,158.01 77,362.03
84,462.59 95,734.88 106,071.68 117,180.37
131,334.29
148,992.49
HDFC -12,875.72
-12,556.11
-24,350.94
-50,296.31
-27,518.44
-9,900.21
27,101.54
45,147.91
ICICI -18,787.89
-64,890.72
-139,506.27
-77,969.96
25,796.85
80,762.28
138,417.37
149,593.92
SBI 203.16
383.99
3,475.43
3,475.43
27,749.14
37,045.22
55,582.14
62,217.09
Reliance
-76,806.78
-108,491.01
-28,378.84
-12,929.10
37,257.13
38,041.72
BAJAJ (9854) (7170) (21389) (7068) 54229 105704 131120 128564
AVIVA (14387) (13175) (20249) (49505) (34472) 2875 7357 3200
Source: IRDA Annual Reports
POLICY HOLDER’S ACCOUNT SURPLUS
It is mandatory for every life insurance company to transfer 95% of its profits as
bonus to policy holders’ accounts. Policy holders may opt to receive the bonus in
cash or accumulate the bonus for encashment at the time of maturity of policy. The
following table shows the amount of surplus in policy holders’ account.
Table 7.23 Table showing surplus in policy holders accounts in lakhs of rupees
INSURER 2005-
06
2006-
07
2007-
08
2008-
09
2009-
10
2010-
11
2011-
12
2012-
13
LIC 62177 75781 82959 92910 103092 113760 128123 143638
HDFC
Standard
255 339 7038 16664 19094 6698 37292 64211
ICICI
Prudential
1006 13601 32512 21293 129770 60760 133196 144968
SBI Life 0 1 8156 10845 19426 35112 58545 73151
Reliance 0 0 0 1587 8677 9621 37845 44428
Bajaj Allianz 6182 13788 19803 11550 40961 84095 100530 86247
Aviva 46864 75738 133337 111296 320967 208574 20659 26694
Source: IRDA Annual Reports
The table above indicates that policy holders account surplus in LIC has shown a
steady increase over the past seven years. LIC has shown a growth of more than
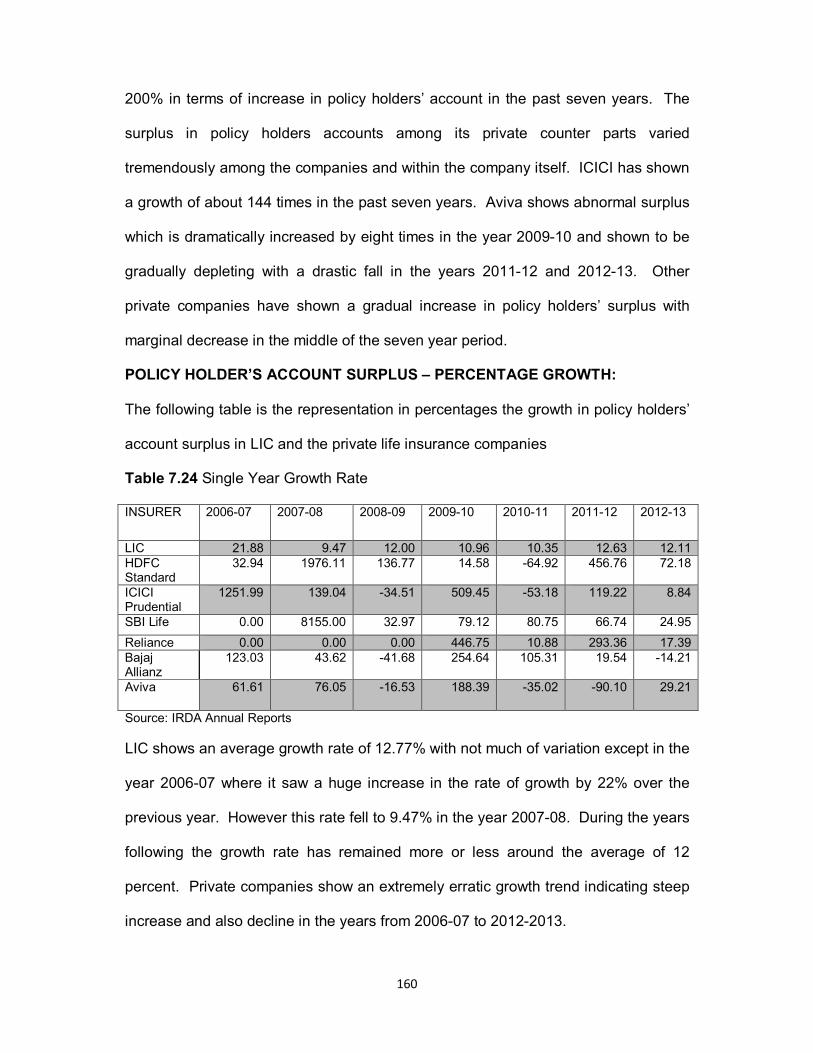
160
200% in terms of increase in policy holders’ account in the past seven years. The
surplus in policy holders accounts among its private counter parts varied
tremendously among the companies and within the company itself. ICICI has shown
a growth of about 144 times in the past seven years. Aviva shows abnormal surplus
which is dramatically increased by eight times in the year 2009-10 and shown to be
gradually depleting with a drastic fall in the years 2011-12 and 2012-13. Other
private companies have shown a gradual increase in policy holders’ surplus with
marginal decrease in the middle of the seven year period.
POLICY HOLDER’S ACCOUNT SURPLUS – PERCENTAGE GROWTH:
The following table is the representation in percentages the growth in policy holders’
account surplus in LIC and the private life insurance companies
Table 7.24 Single Year Growth Rate
INSURER 2006-07 2007-08 2008-09 2009-10 2010-11 2011-12 2012-13
LIC 21.88 9.47 12.00 10.96 10.35 12.63 12.11 HDFC Standard
32.94 1976.11 136.77 14.58 -64.92 456.76 72.18
ICICI Prudential
1251.99 139.04 -34.51 509.45 -53.18 119.22 8.84
SBI Life 0.00 8155.00 32.97 79.12 80.75 66.74 24.95
Reliance 0.00 0.00 0.00 446.75 10.88 293.36 17.39 Bajaj Allianz
123.03 43.62 -41.68 254.64 105.31 19.54 -14.21
Aviva 61.61 76.05 -16.53 188.39 -35.02 -90.10 29.21
Source: IRDA Annual Reports
LIC shows an average growth rate of 12.77% with not much of variation except in the
year 2006-07 where it saw a huge increase in the rate of growth by 22% over the
previous year. However this rate fell to 9.47% in the year 2007-08. During the years
following the growth rate has remained more or less around the average of 12
percent. Private companies show an extremely erratic growth trend indicating steep
increase and also decline in the years from 2006-07 to 2012-2013.

161
PERFORMANCE EVALUATION OF AGENCY MODEL OF INSURANCE
The agency model has always been the most popular mode of selling insurance.
The agency concept involves the recruitment of retired persons, housewives, self-
employed individuals or even students. The life insurance company provides
professional training and gets them to target their acquaintances, friends and
relatives and sell life insurance products. This strategy has always been used by life
insurance companies because of the fact that in India, life insurance is still sold and
not bought. The functioning of the agency model is always the biggest challenge to
an insurance company since this group of people leaves the company without
hesitation. Agents have by far been the most disloyal to the company especially in
the case of private companies. In the recent past Bankassurance has gained a lot of
popularity where in a person is forced to buy an insurance policy when he
approaches the bank for a loan. However the success of a life insurance company is
directly dependent on the training and development and maintaining of its agents.
Insurance companies now have both individual and corporate agents selling policies
on their behalf. The following table indicates the number of individual agents of
various life insurance companies
Table 7.25 Table showing number of individual agents of life insurers
INSURER 2005-06 2006-07
2007-08 2008-09 2009-10 2010-11 2011-12 2012-13 Average
LIC 1052993
1103047
1193744 1344856 1402807 1337064 1278234 1172983 1235716
HDFC Standard
34887 79109 144714 207626 198879 136009 106244 77503 140710
ICICI Prudential
72383 234460 306354 299879 241830 190407 138883 147547
233106
SBI Life 8128 25356 40643 68993 65532 29628 86989 94138 59915
Reliance 19965 95620 184194 149613 195565 189433 150590 124038 158431
Bajaj Allianz
109141 216191 250239 204941 167741 18967 173146 148000 184052
Aviva 10974 29052 35307 30838 32728 23219 19126 17470 27531
Private 370846 890152 1326748 1592579 1575476 1302328 1080651 949774 1298365
Source: IRDA Annual Reports
162
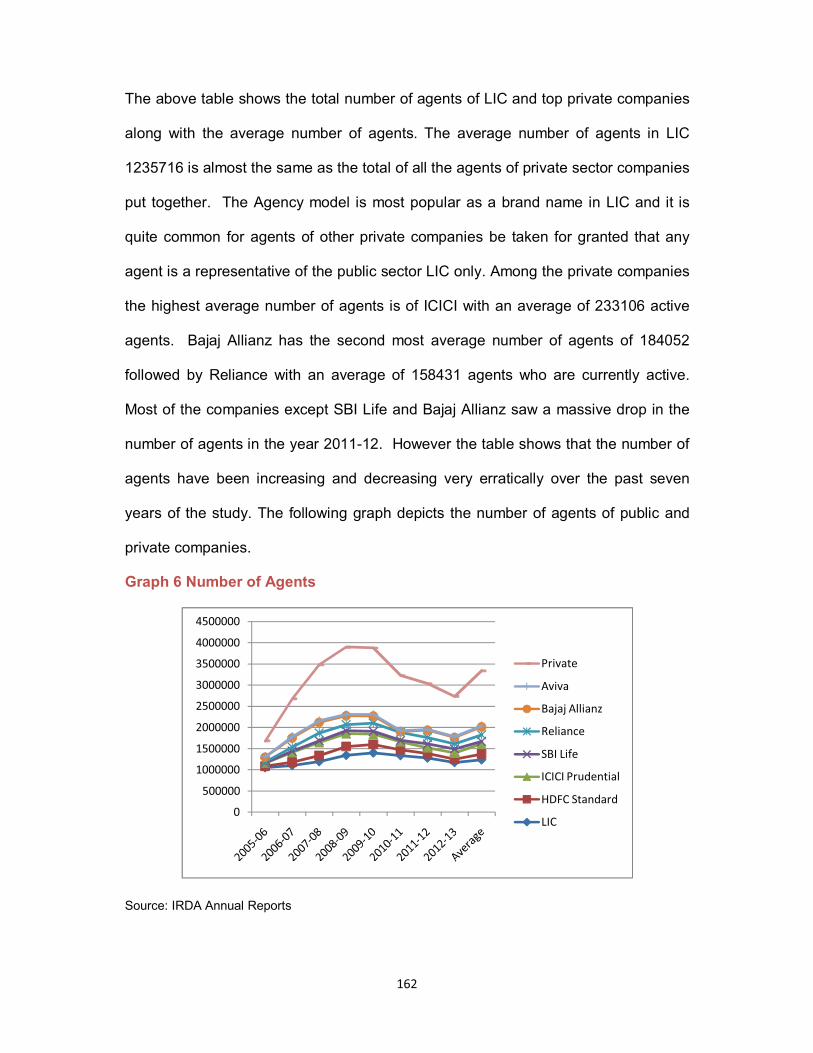
The above table shows the total number of agents of LIC and top private companies
along with the average number of agents. The average number of agents in LIC
1235716 is almost the same as the total of all the agents of private sector companies
put together. The Agency model is most popular as a brand name in LIC and it is
quite common for agents of other private companies be taken for granted that any
agent is a representative of the public sector LIC only. Among the private companies
the highest average number of agents is of ICICI with an average of 233106 active
agents. Bajaj Allianz has the second most average number of agents of 184052
followed by Reliance with an average of 158431 agents who are currently active.
Most of the companies except SBI Life and Bajaj Allianz saw a massive drop in the
number of agents in the year 2011-12. However the table shows that the number of
agents have been increasing and decreasing very erratically over the past seven
years of the study. The following graph depicts the number of agents of public and
private companies.
Graph 6 Number of Agents
Source: IRDA Annual Reports
0
500000
1000000
1500000
2000000
2500000
3000000
3500000
4000000
4500000
Private
Aviva
Bajaj Allianz
Reliance
SBI Life
ICICI Prudential
HDFC Standard
LIC

163
CORPORATE AGENTS
Apart of individual agents, Life insurance companies employ corporate agencies and
banks to sell policies. The policies sold by corporate agents have however not been
as many as those sold by individual agents. However this model is gaining more
popularity in the recent days. The following table states the number of corporate
agents of various life insurance companies.
Table 7.26 Table showing number of corporate agents of life insurance companies
INSURER 2005-06
2006-07
2007-08
2008-09
2009-10
2010-11
2011-12
2012-13
Average
LIC 74 226 345 415 510 295 240 207 330.28
HDFC 15 33 848 371 374 8 8 9 238
ICICI 7 17 46 47 22 15 14 11 25.57
SBI 8 27 23 94 127 100 73 83 76.42
Reliance 4 12 39 126 225 67 45 14 76
Bajaj 26 87 520 682 864 289 26 87 368.71
Aviva 3 5 21 17 15 11 246 210 75.42
Source: IRDA Annual Reports
The table reveals that in spite of the fact that LIC was in existence nearly 58 years,
the concept of corporate agents was one of recent origin. Hence in this segment,
the private companies too are very close in their average number of corporate
agents. Among all life insurance companies, Bajaj Allianz has the highest average
number of corporate agents with 369 followed by LIC with an average of 330 agents.
ICICI has the least number of corporate agents with an average of only 26.
The following table depicts the growth in terms of percentage in the number of
corporate agents of various life insurance companies.

164
Table 7.27 Table showing growth in Number of corporate agents in percentages
INSURER 2006-07 2007-08 2008-09 2009-10 2010-11 2011-12 2012-13 Average
LIC 205.4054 52.65487 20.28986 22.89157 -42.1569 -18.6441 -13.75 32.38 HDFC 120 2469.697 -56.25 0.808625 -97.861 0 12.5 349.84
ICICI 142.8571 170.5882 2.173913 -53.1915 -31.8182 -6.66667 -21.4286 25.30 SBI 237.5 -14.8148 308.6957 35.10638 -21.2598 -27 13.69863 75.98
Reliance 200 225 223.0769 78.57143 -70.2222 -32.8358 -68.8889 79.24
Bajaj 234.6154 497.7011 31.15385 26.68622 -66.5509 -91.0035 234.6154 123.88
Aviva 66.66667 320 -19.0476 -11.7647 -26.6667 2136.364 -14.6341 350.18
Source: IRDA Annual Reports
The table above shows that the highest average growth rate 350% is that of AVIVA
however, it is seen that the pattern of growth of corporate agents in AVIVA is
abnormal and therefore not a correct representation. HDFC also reports average
growth rate of 350% but is highly erratic and cannot be considered as a true and
genuine representation of growth of corporate agents. LIC, ICICI, SBI and Bajaj
report a more realistic growth rate and it is seen that the growth of corporate agents
is much higher in private companies than in LIC. This is indicative of a future trend
among life insurance companies where in they will work towards forming more
corporate partnerships and tie ups for the sale of insurance products.
POLICIES SOLD UNDER THE AGENCY MODEL
The following table shows the average number of policies sold by the agents of LIC
and various private companies.
Table 7.28 Table showing the average number of policies sold by individual
and Corporate Agents
INSURER 2008-09 2009-10 2010-11 2011-12 2012-13
LIC Individual 28 28 26 27 29
Corporate agents 2190 1606 1708 2194 2569
HDFC Standard Individual 4 3 3 3 4
Corporate agents 428 704 1751 47211 56628
ICICI Prudential Individual 4 3 3 2 2
Corporate agents 7723 7413 13195 16328 28843
SBI Life Individual 11 13 8 6 6
Corporate agents 5659 4405 3118 3820 4610

165
Reliance Individual 4 5 4 4 3
Corporate agents 7448 5840 6412 6072 6608
Bajaj Allianz Individual 6 5 4 3 3
Corporate agents 1824 1286 1247 1717 1042
Aviva Individual 7 3 3 3 3
Corporate agents 1211 1667 3870 7067 5870
Private total Individual 6 4 4 3 3
Corporate agents 1857 2289 1976 2533 5064
Source: IRDA Annual Reports
The table depicts that the individual agents of LIC have been most successful in
selling an average of 29 policies which is by far the highest among all insurance
companies. Among the private companies, agents of SBI Life have been the most
successful selling upto an average of 13 policies per agent. In the Corporate agent
sector HDFC far out beats the other companies with a total of 56628 policies sold in
the year 2012-13. The growth in this segment has been only in the last two financial
years in the case of HDFC and also in the case of ICICI Prudential which is next in
line in terms of policies sold by Corporate Agents.
The following graph depicts the number of policies sold by individual and corporate
agents of private and public sector life insurance companies.
Graph 7 Number of policies sold by individual
Source: IRDA Annual Reports
0
10
20
30
40
50
60
70
80
2008-09 2009-10 2010-11 2011-12 2012-13
Private total
SBI Life
Reliance
ICICI Prudential
HDFC Standard
Bajaj Allianz
Aviva
LIC

166
Graph 8 Number of policies sold by Corporate Agents
Source: IRDA Annual Reports
The following table shows the percentage of policies sold by public and private
sector life insurance agents individually and through Corporate agents
Table 7.29 Table showing Average Number of Policies by Individual and Corporate
Agents and percentage growth in the respective segments
INSURER 2009-10 2010-11 2011-12 2012-13 Average
LIC Individual 0 -7.14286 3.846154 7.407407 27.6
Corporate agents -26.6667 6.351183 28.45433 17.09207 2053.4
HDFC Standard Individual -25 0 0 33.33333 3.4
Corporate agents 64.48598 148.7216 2596.231 19.94662 21344.4
ICICI Prudential Individual -25 0 -33.3333 0 2.8
Corporate agents -4.01398 77.99811 23.74384 76.64748 14700.4
SBI Life Individual 18.18182 -38.4615 -25 0 8.8
Corporate agents -22.1594 -29.2168 22.51443 20.68063 4322.4
Reliance Individual 25 -20 0 -25 4
Corporate agents -21.5897 9.794521 -5.30256 8.827404 6476
Bajaj Allianz Individual -16.6667 -20 -25 0 4.2
Corporate agents -29.4956 -3.03266 37.69046 -39.3128 1423.2
0
20000
40000
60000
80000
100000
120000
2008-09 2009-10 2010-11 2011-12 2012-13
Private total
SBI Life
Reliance
ICICI Prudential
HDFC Standard
Bajaj Allianz
Aviva
LIC

167
Aviva Individual -57.1429 0 0 0 3.8
Corporate agents 37.65483 132.1536 82.60982 -16.9379 3937
Private total Individual -33.3333 0 -25 0 4
Corporate agents 23.26333 -13.6741 28.18826 99.92104 2743.8
Source: IRDA Annual Reports
The average of LIC is 28% and in case of private sector the percentage in case of
individual policies is a meagre 4%. However in case of Corporate agents, the private
sector companies far out beat LIC.
Performance of Agents
The following table depicts the policies written by agents of various life insurance
companies
7.30 Table showing number of policies in thousands
INSURER 2005-06
2006-07
2007-08
2008-09
2009-10
2010-11
2011-12
2012-13
LIC 179564 189419 192428 210154 226058 240381 255845 270251 HDFC Standard
590 752 996 1244 1497 1598 1762 1938
ICICI Prudential
173 734 1037 1313 972 1090 1293 1502
SBI Life 352 411 420 489 579 789 1204 1724 Reliance 77 189 220 234 600 1939 2154 2327 Bajaj Allianz
395 511 540 721 941 1820 2283 2507
Aviva 34 51 48 62 62 152 254 317 Private 3545 4746 5740 7533 9007 12839 15430 17605
Source: IRDA Annual Reports
The agents of LIC have consistently been the highest sellers of policies right through
the period. It was found that due to severe competition from the private sector life
insurance companies, LIC reinvented itself, improved training and development of its
employees and agents and also designed new products that were customer centric
to affirm its position as highest policy seller in the industry. Over the period of eight
years, the total growth in the number of policies in LIC was more than 9 crores. The
average growth over the years has been about 1 crore policies.

168
Private companies are far behind in the number of policies sold with the total policies
being only 2% of the policies sold by LIC alone in the year 2005-06. Growth in the
whole private sector has been a little over 1,40,00,00,000 in terms of number of
policies sold with the major growth being shown in Bajaj Allianz.
The following graph depicts the number of policies sold in thousands by insurance
companies.
Graph 9 Number of policies sold
The following table depicts the percentage of growth in policies sold by LIC and other
private companies. The table shows that the rate of growth in LIC has been more or
less consistent with an average growth of about 6% throughout the period of eight
years. However in the overall private sector, there has been an average growth rate
of 26%. The average growth rate of HDFC is 19%, ICICI Prudential has an average
growth rate of a phenomenal 59% over the seven year period. SBI Life has average
growth rate of 27%, Reliance of 81%, being the company with the highest growth
rate, Bajaj Allianz has grown at 32% and Aviva has an average growth rate of 44%.
0
50000
100000
150000
200000
250000
300000
350000
Private
Aviva
Bajaj Allianz
Reliance
SBI Life
ICICI Prudential
HDFC Standard
LIC
169
Table 7.31 Table showing percentage growth in number of policies
INSURER 2006-07 2007-08 2008-09 2009-10 2010-11 2011-12 2012-13
LIC 5.488294 1.588542 9.211757 7.567784 6.335985 6.433121 5.630753
HDFC Standard
27.45763 32.44681 24.8996 20.33762 6.746827 10.26283 9.988649
ICICI Prudential
324.2775 41.28065 26.61524 -25.9711 12.13992 18.62385 16.16396
SBI Life 16.76136 2.189781 16.42857 18.40491 36.26943 52.59823 43.18937
Reliance 145.4545 16.40212 6.363636 156.4103 223.1667 11.08819 8.031569
Bajaj Allianz
29.36709 5.675147 33.51852 30.51318 93.41126 25.43956 9.811651
Aviva 50 -5.88235 29.16667 0 145.1613 67.10526 24.80315
Private 33.8787 20.94395 31.23693 19.56724 42.54469 20.1807 14.09592
Source: IRDA Annual Reports
Table 7.32 PREMIUM RECEIVED AND AGENT COMMISSION (Rupees in Lakhs)
INSURER
2007-08 2008-09 2009-10 2010-11 2011-12 2012-13
LIC
Agent commission
956,809.66
1,003,324.33
1,211,031.28
1,330,867.71
1,403,563.27
1,479,026.03
Premium received
14,978,998.67
15,728,803.85
18,607,731.08
20,347,339.71
20,288,927.84
20,880,357.97
HDFC Standard
Agent commission
47,681.15
52,549.73
42,489.04
35,125.86
20,992.68
12,032.52
Premium received
35,125.86
42,489.04
52,549.73
47,681.15
57,763.94
63,939.56
ICICI Prudential
Agent commission
81,096.83
69,998.95
60,296.78
56,067.59
60,546.87
76,541.68
Premium received
1,356,106.12
1,535,622.08
1,652,875.41
1,788,062.90
1,402,157.80
1,353,823.80
SBI life
Agent commission
40,537.97
46,788.41
66,616.80
67,105.40
51,836.37
51,141.34
Premium received
562,213.72
721,210.32
1,010,402.65
1,291,164.29
1,313,373.84
1,045,003.29
Reliance
Agent commission
40,537.97
46,788.41
66,616.80
67,105.40
51,836.37
51,141.34
Premium received
562,213.72
721,210.32
1,010,402.65
1,291,164.29
1,313,373.84
1,045,003.29
Source: IRDA Annual Reports
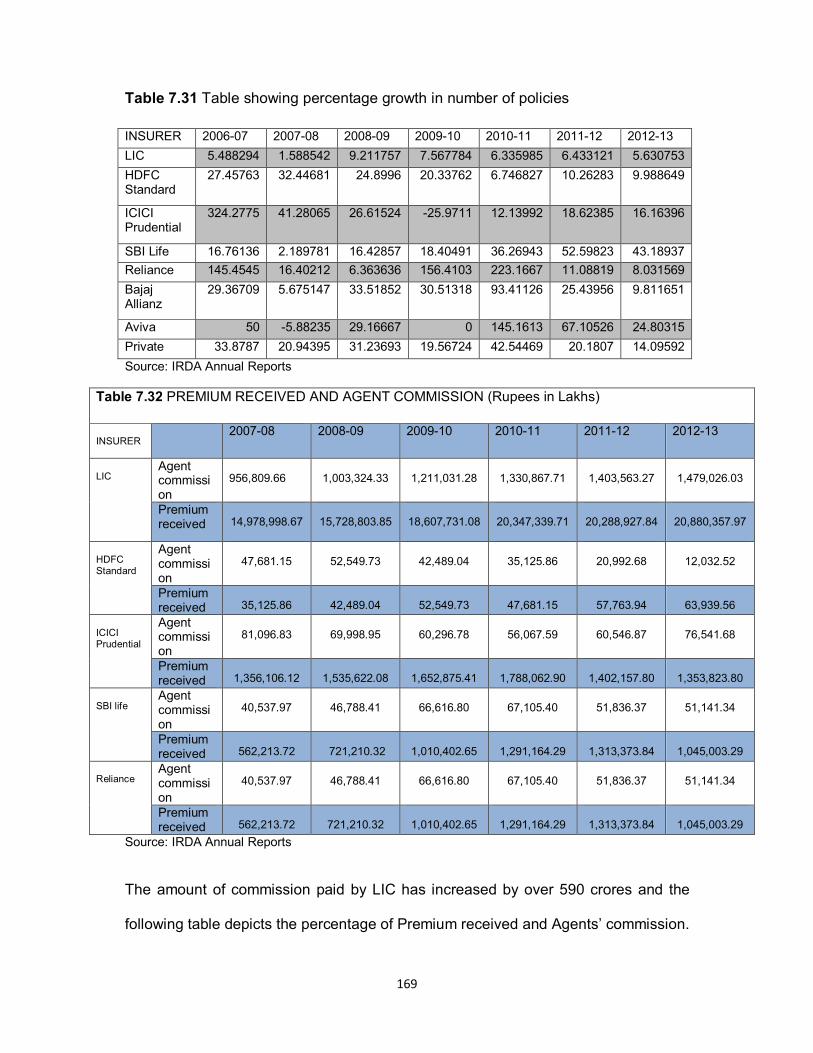
The amount of commission paid by LIC has increased by over 590 crores and the
following table depicts the percentage of Premium received and Agents’ commission.
170
Except for HDFC all companies have almost the same average rate of commission
paid on premium received.
Table 7.33 Table showing Premium Received and Agent commission in percentages
INSURER LIC 15.65515 15.67669 15.36519 15.28878 14.4553 14.11764
HDFC Standard 0.736682 0.808549 1.236783 1.357437 2.751623 5.313896
ICICI Prudential 16.72206 21.93779 27.41233 31.8912 23.15822 17.68741
SBI Life 13.86882 15.41429 15.16738 19.24084 25.33692 20.43363
Reliance 11.69574 8.263472 10.51978 12.76441 13.81194 12.40303
Source: IRDA Annual Reports
The following table shows the Sum assured by the life insurance companies
Table 7.34 Table showing sum assured in Crores [
INSURER 2005-06 2006-07 2007-08 2008-09 2009-10 2010-11 2011-12 2012-13
LIC 1280159 1397568 1485380 1784880 2061034 2435396 2787732 3119331
HDFC Standard
11801 14253 16973 22251 29544 35376 48128 86110
ICICI Prudential
13438 15403 21644 28914 27347 36278 58660 77661
SBI Life 7254 9155 10997 14455 18018 29725 52245 81456
Reliance 1767 3339 4102 6069 8723 22050 30271 34735
Bajaj Allianz 10619 12554 12998 15195 19098 53055 46001 54302
Aviva 201 415 294 828 3146 10198 38757 60902
Private total 94205 116411 135496 177682 212483 344271 517060 723092
Source: IRDA Annual Reports
The above table depicts the sum assured by LIC and private sector life
insurance companies. The total value of sum assured by LIC has increased by more
than 18 lakh Crores. The total increase in sum assured by all private companies
together is 6.29 lakh Crores. Among the private companies, SBI Life has shown the
highest amount of sum assured and the growth over the past seven years amounted
to more than 74, 000 Crores. The following graph depicts the amount of sum
assured.

171
Graph 10 Amount of sum assured
Source: IRDA Annual Reports
The following table shows the percentage of growth in sum assured by all the life
insurance companies
Table 7.35 Table showing Sum Assured in Crores – Percentage growth
INSURER 2006-07 2007-08 2008-09 2009-10 2010-11 2011-12 2012-13 Average LIC 9.171439 6.283201 20.16319 15.47185 18.1638 14.4673 11.89494 14
HDFC Standard
20.7779 19.0837 31.09645 32.77606 19.74005 36.04704 78.91872 34
ICICI Prudential
14.62271 40.51808 33.58899 -5.41952 32.65806 61.69579 32.39175 30
SBI Life 26.20623 20.12015 31.44494 24.64891 64.97391 75.76114 55.91157 43
Reliance 88.96435 22.85115 47.95222 43.73043 152.78 37.28345 14.74679 58
Bajaj Allianz
18.22205 3.536721 16.9026 25.68608 177.804 -13.2956 18.04526 35
Aviva 106.4677 -29.1566 181.6327 279.9517 224.1577 280.0451 57.13807 157
Private total
23.572 16.3945 31.1345 19.58611 62.02284 50.18982 39.84683 35
Source: IRDA Annual Reports
0
500000
1000000
1500000
2000000
2500000
3000000
3500000
4000000
4500000
Private total
Aviva
Bajaj Allianz
Reliance
SBI Life
ICICI Prudential
HDFC Standard
LIC

172
In the above table LIC shows an increase steadily at an average rate of 14% in the
total sum assured. The private companies in total on the other hand have increased
at an average rate of 35% in sum assured
MARKETING OF INSURANCE PRODUCTS
The role of marketing in insurance cannot be overemphasized. Given that the nature
of the product is such that this is a product that is not bought but sold, insurance
companies take pain staking efforts in the P s of marketing, Product, pricing,
promotion, publicity. An insurance product is designed keeping in mind the various
needs of the customer, company’s goal and financial objectives and the general
condition of the economy and financial market and money market conditions. Every
product designed by an insurance company should be mandatorily be approved by
the IRDA. Marketing costs have been an imperative expenditure on the revenues of
the company the companies having to allocate huge amounts to gain new customers
and retain old clients. Client retention in insurance is a big challenge and hence
companies have expended a huge amount on marketing of products. The following
table depicts the amount spent on marketing by the public sector and private sector
life insurance companies.
Table 7.36 Table showing marketing expenses of life insurance companies ( Rs. In Crores) INSURER 2007-08 2008-09 2009-10 2010-11 2011-12 2012-13 Average
LIC 20,253.65
24,389.96
30,496.26
32,459.35
34,921.35
26,460.10
28,163.45
HDFC Standard
11,081.42
40,347.80
27,659.82
33,595.09
3,117.82
2,835.96
19,772.99
ICICI Prudential
3,357.43
11170.44 2,932.21
8,697.92
11,410.92
13,052.43
8,436.89
SBI Life 3,893.69
3684.62 3,000.24
3,622.85
3,927.14
4,686.20
3,802.46
Reliance 19,585.66
25,440.62
49528.78 43647.95 21,657.71
22,897.59
30,459.72
Source: IRDA Annual Reports
In spite of continuous marketing efforts, the average amount spent on marketing by
LIC is second in the industry to Reliance Company spending an average of more

173
than 30,000 Crores on marketing. The change in amount spent on marketing by LIC
has varied only slightly. Where as in private companies, there is a steep incline in
the marketing costs of HDFC in the year 2008-09, however due to severe cost
cutting, the expenditure drastically reduced in 2011-12. SBI Life has consistently
spent a nominal amount on marketing. Though marketing plays an important role,
the study did not reveal any direct correlation between amount spent on marketing
and premiums collected. The following table shows the percentage change in
marketing expenses incurred by life insurance companies.
Table 7.37 Table showing percentage change in marketing expenses
INSURER 2008-09 2009-10 2010-11 2011-12 2012-13
LIC 20.42254 25.03612 6.43715 7.584872 -24.2294
HDFC Standard 264.1032 -31.4465 21.45809 -90.7194 -9.04029
ICICI Prudential 232.7081 -73.7503 196.6336 31.19137 14.38543
SBI Life -5.36946 -18.574 20.75201 8.399188 19.32857
Reliance 29.89412 94.68386 -11.8736 -50.3809 5.72489
Source: IRDA Annual Reports
The above table reveals that there has been a sudden decrease in marketing
expenses incurred by LIC in the year 2012-13. Reliance Company has shown a
wide variation and so has the expenditure incurred by HDFC Standard which shows
a 264% increase in the second year followed by a negative growth in the third year
and fifth year. The following table shows the relationship between the Premium
received as against Marketing expenses of the companies.
Table 7.38 Table showing Premium Received / Marketing Expenses
INSURER 2007-08 2008-09 2009-10 2010-11 2011-12 2012-13 LIC 739.5703 644.8885 610.1644 626.856 580.9892 789.1262
HDFC Standard
3.169798 1.05307 1.899858 1.419289 18.52703 22.546
ICICI Prudential
403.912 137.4719 563.6961 205.5736 122.8786 103.722
SBI Life 144.391 195.7353 336.7739 356.3946 334.4352 222.9959 Reliance 16.46837 19.38844 13.33547 15.05488 25.38412 17.66733 Source: IRDA Annual Reports
174
TRAINING AND DEVELOPMENT
An insurance company expends a lot on training of its sales officers, agency
development managers, development officers, agents and operations staff. This
training ranges from training to qualify for agency licensing examination to product
training and sales closing. Training is an ongoing process in an insurance company
because of the need for the agents to continuously be motivated and active. The
following table shows the amount of training expenses incurred by life insurance
companies
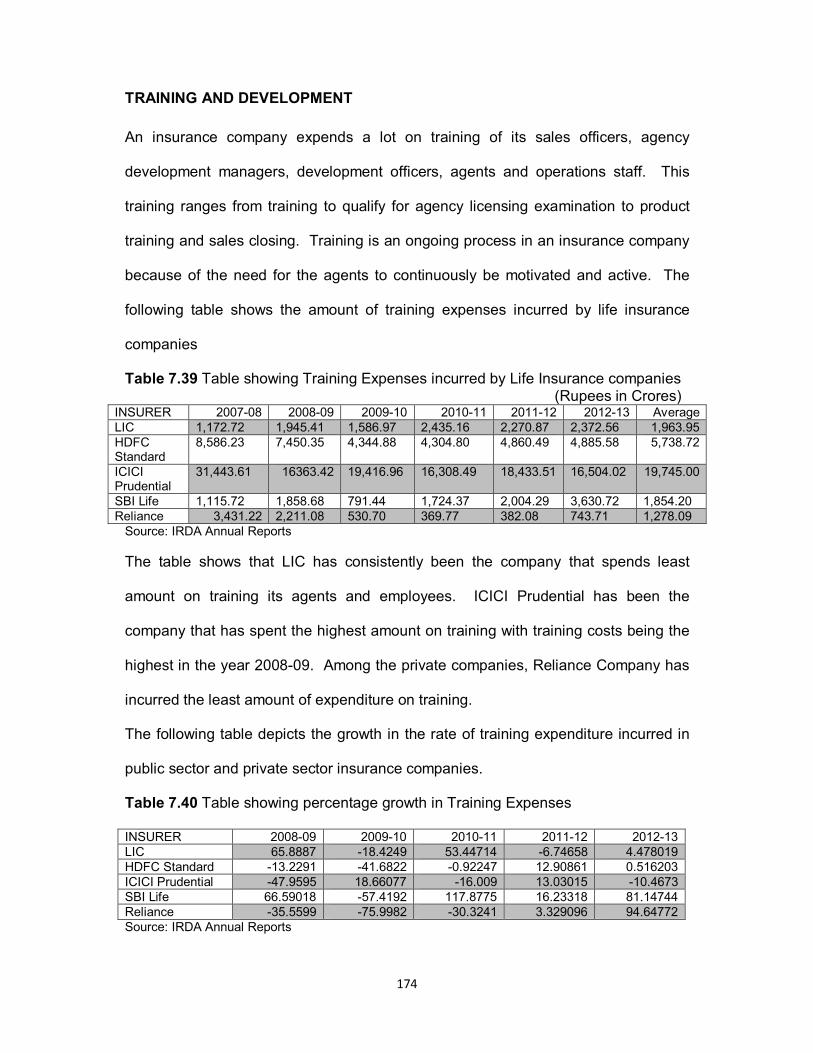
Table 7.39 Table showing Training Expenses incurred by Life Insurance companies (Rupees in Crores)
INSURER 2007-08 2008-09 2009-10 2010-11 2011-12 2012-13 Average LIC 1,172.72 1,945.41 1,586.97 2,435.16 2,270.87 2,372.56 1,963.95 HDFC Standard
8,586.23 7,450.35 4,344.88 4,304.80 4,860.49 4,885.58 5,738.72
ICICI Prudential
31,443.61 16363.42 19,416.96 16,308.49 18,433.51 16,504.02 19,745.00
SBI Life 1,115.72 1,858.68 791.44 1,724.37 2,004.29 3,630.72 1,854.20 Reliance 3,431.22 2,211.08 530.70 369.77 382.08 743.71 1,278.09
Source: IRDA Annual Reports
The table shows that LIC has consistently been the company that spends least
amount on training its agents and employees. ICICI Prudential has been the
company that has spent the highest amount on training with training costs being the
highest in the year 2008-09. Among the private companies, Reliance Company has
incurred the least amount of expenditure on training.
The following table depicts the growth in the rate of training expenditure incurred in
public sector and private sector insurance companies.
Table 7.40 Table showing percentage growth in Training Expenses
INSURER 2008-09 2009-10 2010-11 2011-12 2012-13 LIC 65.8887 -18.4249 53.44714 -6.74658 4.478019 HDFC Standard -13.2291 -41.6822 -0.92247 12.90861 0.516203 ICICI Prudential -47.9595 18.66077 -16.009 13.03015 -10.4673 SBI Life 66.59018 -57.4192 117.8775 16.23318 81.14744 Reliance -35.5599 -75.9982 -30.3241 3.329096 94.64772 Source: IRDA Annual Reports

175
Apart from the first year increase in training expenditure in the year 2008-09, LIC has
increased training expenditure in the year 2010-11 by more than 53%. Private
companies have been very erratic in the amount spent on training with a drastic
increase in one year followed by a decrease in the next year.
The following table shows the relationship between Premium Received and Training
Expenses. It was observed that though training is absolutely essential to sustain
agents and sales managers in the system, there is no direct proportion or correlation
in the amount of expenditure incurred on training to premiums collected.
Table 7.41 Table showing Premium Received / Training Expenses
INSURER 2007-08 2008-09 2009-10 2010-11 2011-12 2012-13 LIC 12772.87 8085.084 11725.32 8355.648 8934.429 8800.771 HDFC Standard
4.090953 5.702959 12.09463 11.07628 11.88439 13.0874
ICICI Prudential
43.12819 93.84481 85.12534 109.64 76.0657 82.02994
SBI Life 503.9022 388.0229 1276.664 748.7745 655.2813 287.8226 Reliance 94.00268 223.0828 1244.563 1777.09 1438.866 543.9477 Source: IRDA Annual Reports
The following table shows the relationship between amount spent on training and
premiums collected
Table 7.42 Table showing Amount spent for training/ premium received
INSURER 2007-08 2008-09 2009-10 2010-11 2011-12 2012-13
LIC 0.00008 0.00012 0.00009 0.00012 0.00011 0.00011 HDFC Standard 0.24444 0.17535 0.08268 0.09028 0.08414 0.07641 ICICI Prudential 0.02319 0.01066 0.01175 0.00912 0.01315 0.01219 SBI Life 0.00198 0.00258 0.00078 0.00134 0.00153 0.00347 Reliance 0.01064 0.00448 0.00080 0.00056 0.00069 0.00184 Source: IRDA Annual Reports
TRAINING EXPENSES / PREMIUM RECEIVED
INSURER 2008-09 2009-10 2010-11 2011-12 2012-13
LIC 1.23684547 0.852855192 1.196795257 1.119265641 0.113628158 HDFC Standard 133.886164 62.02452499 47.80895963 47.61265233 43.14861852
ICICI Prudential 106.558906 117.4738562 91.20758049 131.4652842 121.906688 SBI Life 25.7716892 7.832914194 13.3551586 15.26061883 34.74363231 Reliance 44.8263978 8.034943754 5.627173326 6.949916509 18.38413602
Source: IRDA Annual Reports

176
The following table depicts the Share Capital of Life insurance companies
Table 7.43 Table showing Share capital (in crores)
INSURER 2005-06
2006-07
2007-08 2008-09 2009-10
2010-11 2011-12 2012-13
LIC 5 5 5 5 5 5 100 100 HDFC 620 801.26 1271 1795.82 1968 1994.88 1994.88 19994.88
ICICI 1185 1312.3 1401.11 1427.26 1428.14 1028.46 1428.85 1428.85 SBI 425 500 1000 1000 1000 1000 1000 1000
Reliance 331 664 1147.7 1162.3 1164.65 1165.84 1196.32 1196.32
Bajaj 152.23 150.37 150.71 150.71 150.71 150.71 150.71 150.71
Aviva 458.70 758.2 1004.5 1491.8 1888.8 2004.9 2004.90 2004.90
Private 5887.05 8119.41 12291.42 18249.77 21015 23656.85 24831.92 25418.72
Source: IRDA Annual Reports
The capital structure of private life insurance companies cannot be compared with
LIC since LIC being a Government owned company has the same capital of 5
Crores. However among the private companies, HDFC has the highest amount of
capital. The overall capital structure of all private companies has increased 19531.67
Crores.
The following table shows the percentage increase in share capital
Table 7.44 Table showing change in share capital in percentages
INSURER 2006-07 2007-08 2008-09 2009-10 2010-11 2011-12 2012-13 Average
LIC 0 0 0 0 0 1900 0 28.75
HDFC 29.23548 58.62517 41.2919 9.587821 1.365854 0 902.3099 3805.09
ICICI 10.74262 6.767507 1.866377 0.061657 -27.9861 38.93102 0 1329.996
SBI 17.64706 100 0 0 0 0 0 865.625
Reliance 100.6042 72.84639 1.272109 0.202185 0.102177 2.614424 0 1003.516
Bajaj -1.22184 0.226109 0 0 0 0 0 150.8575
Aviva 65.29322 32.48483 48.5117 26.61215 6.14676 0 0 1452.088
Private 37.91984 51.38317 48.47568 15.15214 12.57126 4.967145 2.363088 17433.77
Source: IRDA Annual Reports
SOLVENCY The solvency of a life insurance company is one of the most important
determinants of customers’ trust and confidence in the company’s ability to pay the

177
amount invested by them along with bonus and interest. The following table depicts
the solvency position of the various life insurance companies
Table 7.45 Table showing Solvency of Life insurance companies
INSURER 2005-06 2006-07
2007-08
2008-09
2009-10
2010-11
2011-12
2012-13
LIC 1.3 1.5 1.52 1.54 1.54 1.54 1.54 1.54
HDFC Standard
2.9 2.05 2.38 2.58 1.80 1.72 1.88 2.17
ICICI Prudential
1.6 1.53 1.74 2.31 2.9 3.27 3.71 3.96
SBI Life 2.9 1.78 3.3 2.92 2.17 2.04 5.34 2.15
Reliance 2 1.62 1.65 2.5 1.86 1.66 3.53 4.29
Bajaj Allianz 2.8 2.45 2.34 2.62 2.68 2.86 5.15 6.34
Aviva 2.8 6.31 4.29 5.91 5.12 5.4 5.15 4.23
Source: IRDA Annual Reports
Except in one or two cases, the solvency ratios of all life insurance companies are
more or less very consistent. The following table shows the percentage change in
solvency rate of insurance companies.
Table 7.46 Table showing percentage change in Solvency rate of insurance
companies
Source: IRDA Annual Reports
INSURER 2006-07 2007-08 2008-09 2009-10 2010-11 2011-12 2012-13 Average
LIC 15.38462 1.333333 1.315789 0 0 0 0 1.5025
HDFC Standard
-29.3103 16.09756 8.403361 -30.2326 -4.444444444
9.302326 15.42553 2.185
ICICI Prudential
-4.375 13.72549 32.75862 25.54113 12.75862069 13.45566 6.738544 2.6275
SBI Life -38.6207 85.39326 -11.5152 -25.6849 -5.99078341 161.7647 -59.7378 2.825
Reliance -19 1.851852 51.51515 -25.6 -10.75268817
112.6506 21.52975 2.38875
Bajaj Allianz
-12.5 -4.4898 11.96581 2.290076 6.71641791 80.06993 23.1068 3.405
Aviva 125.3571 -32.0127 37.76224 -13.3672 5.46875 -4.62963 -17.8641 4.90125

178
INVESTMENT INCOME
The profitability of an insurance company depends heavily on the different avenues
into which the company invests the amount collected from shareholders and policy
holders. The following table shows the income from investment of various life
insurance companies.
Table 7.47 Table showing Income from investment in lakhs of rupees
INSURER 2005-06 2006-07 2007-08 2008-09 2009-10 2010-11 2011-12 2012-13 Average
LIC 9585360 11239509 4277572 5837392 4568239
4004641
8433028
9623399 7196143
HDFC 207761 568603.2 -171931 56451 23224 37786 23255 73894 102380.4
ICIC 832719 465878 -57050 290977 95814 142318 (52921) 586289 288003
SBI Life 300489 592467 -169465 50325 21967 13074 61065 437394 163414.5
Reliance 146236 344097 -101379 -7414 3293 4542 71361 136500 74654.5
Bajaj 391237 993021 -322087 63985 27763 3124 (3943) 302577 181959.6
Aviva 45932 138010 -38925 14726 8490 9921 13525 55208 30860.88
Source: IRDA Annual Reports
It is clear from the table above that the income earned by LIC is the maximum when
compared to all other insurance companies. However it is highly inconsistent; the
income earned in the year 2005-06 is almost the same as the income earned in the
year 2012-13. In the year 2006-07 income shows a sudden increase in income and
the year 2007-08 shows a sudden fall in income. The average income earned by LIC
being 7196143 lakhs. Among the private companies ICICI has earned the highest
revenue with an average of 288003 lakhs and Bajaj follows at second place with
average revenue of 181959.6 lakhs and SBI Life stands third with an average
revenue of 163414.5 lakhs.

179
The following graph depicts the amount of income earned from investments
Graph 11 Investment income
Source: IRDA Annual Reports
The following table depicts the growth rate in Income from investment
Table 7.48 Table showing Growth in Income from investment in percentages
INSURER 2006-07 2007-08 2008-09 2009-10 2010-11 2011-12 2012-13
LIC 17.25704 -61.9416 36.46508 -21.7418
-12.33731423 110.5814 14.11558
HDFC 173.6814 -130.237 -132.834 -58.8599
62.70237685 -38.456 217.7553
ICIC -44.0534 -112.246 -610.039 -67.0716
48.53570459 -137.185 -1207.86
SBI Life 97.16762 128.603- -129.696 -56.3497
-40.48345245 367.0721 616.2761
Reliance 135.3025 -129.462 -92.6868 -
144.416 37.92894018 1471.136 91.28095
Bajaj 153.8157 -132.435 -119.866 -56.6101
-88.74761373 -226.216 -7773.78
Aviva 200.4659 -128.204 -137.832 -42.3469
16.85512367 36.32698 308.1922
Source: IRDA Annual Reports
The above table shows a steep decline in the income of LIC by 62% in the year
2007-08 and the highest growth in LIC is in the year 2011-12 which records a high
growth rate of 110%. Among the private companies, the highest fall in income is in
the year 2008-9 when ICICI reports a fall of 610%. The highest growth rate among
0
2000000
4000000
6000000
8000000
10000000
12000000
14000000
16000000
Aviva
Bajaj
Reliance
SBI Life
ICIC
HDFC
LIC
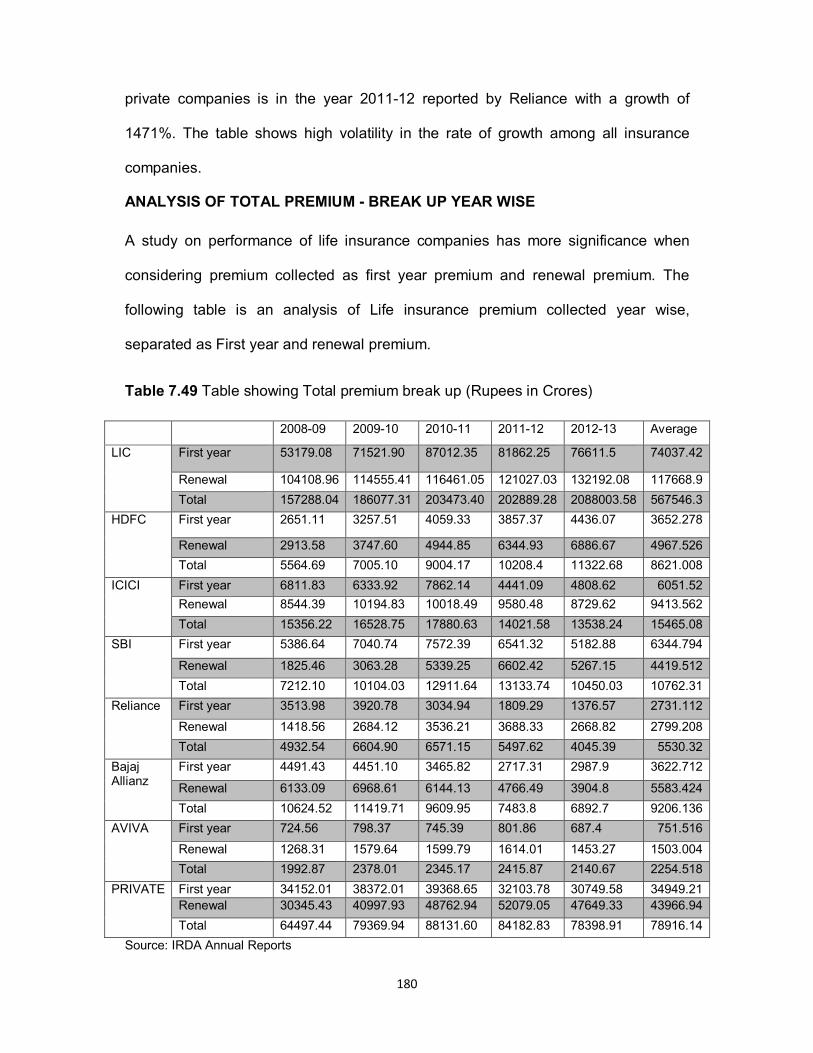
180
private companies is in the year 2011-12 reported by Reliance with a growth of
1471%. The table shows high volatility in the rate of growth among all insurance
companies.
ANALYSIS OF TOTAL PREMIUM - BREAK UP YEAR WISE
A study on performance of life insurance companies has more significance when
considering premium collected as first year premium and renewal premium. The
following table is an analysis of Life insurance premium collected year wise,
separated as First year and renewal premium.
Table 7.49 Table showing Total premium break up (Rupees in Crores)
2008-09 2009-10 2010-11 2011-12 2012-13 Average
LIC First year 53179.08 71521.90 87012.35 81862.25 76611.5 74037.42
Renewal 104108.96 114555.41 116461.05 121027.03 132192.08 117668.9
Total 157288.04 186077.31 203473.40 202889.28 2088003.58 567546.3
HDFC First year 2651.11 3257.51 4059.33 3857.37 4436.07 3652.278
Renewal 2913.58 3747.60 4944.85 6344.93 6886.67 4967.526
Total 5564.69 7005.10 9004.17 10208.4 11322.68 8621.008
ICICI First year 6811.83 6333.92 7862.14 4441.09 4808.62 6051.52
Renewal 8544.39 10194.83 10018.49 9580.48 8729.62 9413.562
Total 15356.22 16528.75 17880.63 14021.58 13538.24 15465.08
SBI First year 5386.64 7040.74 7572.39 6541.32 5182.88 6344.794
Renewal 1825.46 3063.28 5339.25 6602.42 5267.15 4419.512
Total 7212.10 10104.03 12911.64 13133.74 10450.03 10762.31
Reliance First year 3513.98 3920.78 3034.94 1809.29 1376.57 2731.112
Renewal 1418.56 2684.12 3536.21 3688.33 2668.82 2799.208
Total 4932.54 6604.90 6571.15 5497.62 4045.39 5530.32
Bajaj Allianz
First year 4491.43 4451.10 3465.82 2717.31 2987.9 3622.712
Renewal 6133.09 6968.61 6144.13 4766.49 3904.8 5583.424
Total 10624.52 11419.71 9609.95 7483.8 6892.7 9206.136
AVIVA First year 724.56 798.37 745.39 801.86 687.4 751.516
Renewal 1268.31 1579.64 1599.79 1614.01 1453.27 1503.004
Total 1992.87 2378.01 2345.17 2415.87 2140.67 2254.518
PRIVATE First year 34152.01 38372.01 39368.65 32103.78 30749.58 34949.21
Renewal 30345.43 40997.93 48762.94 52079.05 47649.33 43966.94
Total 64497.44 79369.94 88131.60 84182.83 78398.91 78916.14
Source: IRDA Annual Reports

181
The table above reveals that in all quarters LIC leads in premium collection and it
has maintained its lead all through the years. However in the last two years it is seen
that the amount of premium collected by LIC has shown a declining trend though
there has been no major change in IRDA regulations. The growth in first year
premium collection has also been showing a positive growth in most of the private
life insurance companies, however in almost every life insurance company there has
been a decline in first year premium in the years 2011-12 and 2012-13. The growth
in first year premium of LIC over the five year period has been 23432.42 Crores.
Except for SBI Life all the other private life insurance companies show an almost
50% decrease in the first year premium from the year 2008-09 in the year 2012-13.
In the renewal premium category LIC has shown a consistent increase of about
10,000 Crores every year. Among private life insurance companies there has been a
positive in the first two years, however the latter years have shown a drastic fall in
the premium. The general slowdown in the economy and recessionary conditions
has been the major cause for fall in premium collection. The following graph depicts
the amount of premium collected
Graph 12 Premium collected
Source: IRDA Annual Reports
The following table shows the growth in total premiums in percentage over the past
four years.
0
500000
1000000
1500000
2000000
2500000
PRIVATE
SBI
Reliance
ICICI
HDFC
Bajaj Allianz
AVIVA
LIC

182
Table 7.50 Table showing growth in total premium – Break up in percentages
2009-10 2010-11 2011-12 2012-13
LIC First year 34.49255 21.65833 -5.91881 -6.41413
Renewal 10.03415 1.663509 3.920607 9.225253
Total 18.30353 9.348851 -0.28707 9.291345
HDFC First year 22.87344 24.61451 -4.97521 15.00245
Renewal 28.62527 31.94711 28.3139 8.538156
Total 25.88482 28.53735 13.37414 10.91532
ICICI First year -7.01588 24.12755 -43.513 8.275671
Renewal 19.31607 -1.7297 -4.37202 -8.88118
Total 7.635538 8.178961 -21.5823 -3.44712
SBI First year 30.70745 7.551053 -13.6162 -20.7671
Renewal 67.80866 74.29846 23.65819 -20.2239
Total 40.09831 27.78703 1.720153 -20.4337
Reliance First year 11.57662 -22.5935 -40.3847 -23.9166
Renewal 89.21441 31.7456 4.301781 -27.6415
Total 33.90464 -0.51098 -16.337 -26.4156
Bajaj Allianz
First year -0.89793 -22.1357 -21.5969 9.95801
Renewal 13.62315 -11.8313 -22.4221 -18.0781
Total 7.484479 -15.8477 -22.1245 -7.89839
AVIVA First year 10.18687 -6.63602 7.5759 -14.2743
Renewal 24.54684 1.275607 0.888867 -9.95905
Total 19.3259 -1.38099 3.014707 -11.3913
PRIVATE First year 12.35652 2.59731 -18.4534 -4.21819
Renewal 35.10413 18.94001 6.800472 -8.50576
Total 23.05905 11.03902 -4.48054 -6.87066
Source: IRDA Annual Reports
The table above shows that almost all companies report a negative growth in the
year 2012-13. The overall decline in first year premium collected by all private
companies is 4% and in renewal premiums the decline has been 8.5%. The
maximum decline has been reported by Reliance which has had a decline of 40% in
the year 2011-12 and 23% and 27% in the year 2012-13 in the first year and renewal
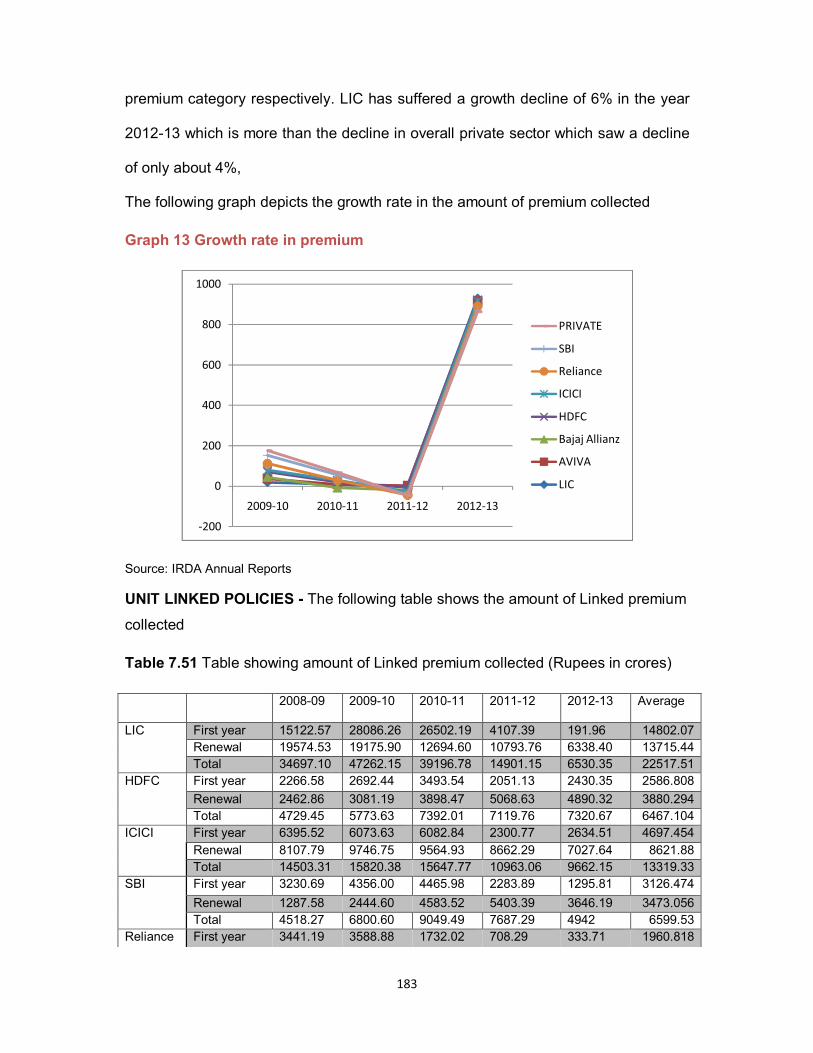
183
premium category respectively. LIC has suffered a growth decline of 6% in the year
2012-13 which is more than the decline in overall private sector which saw a decline
of only about 4%,
The following graph depicts the growth rate in the amount of premium collected
Graph 13 Growth rate in premium
Source: IRDA Annual Reports
UNIT LINKED POLICIES - The following table shows the amount of Linked premium
collected
Table 7.51 Table showing amount of Linked premium collected (Rupees in crores)
2008-09 2009-10 2010-11 2011-12 2012-13 Average
LIC First year 15122.57 28086.26 26502.19 4107.39 191.96 14802.07
Renewal 19574.53 19175.90 12694.60 10793.76 6338.40 13715.44
Total 34697.10 47262.15 39196.78 14901.15 6530.35 22517.51
HDFC First year 2266.58 2692.44 3493.54 2051.13 2430.35 2586.808
Renewal 2462.86 3081.19 3898.47 5068.63 4890.32 3880.294
Total 4729.45 5773.63 7392.01 7119.76 7320.67 6467.104
ICICI
First year 6395.52 6073.63 6082.84 2300.77 2634.51 4697.454
Renewal 8107.79 9746.75 9564.93 8662.29 7027.64 8621.88
Total 14503.31 15820.38 15647.77 10963.06 9662.15 13319.33
SBI First year 3230.69 4356.00 4465.98 2283.89 1295.81 3126.474
Renewal 1287.58 2444.60 4583.52 5403.39 3646.19 3473.056
Total 4518.27 6800.60 9049.49 7687.29 4942 6599.53
Reliance First year 3441.19 3588.88 1732.02 708.29 333.71 1960.818
-200
0
200
400
600
800
1000
2009-10 2010-11 2011-12 2012-13
PRIVATE
SBI
Reliance
ICICI
HDFC
Bajaj Allianz
AVIVA
LIC

184
Renewal 1319.32 2567.85 3326.71 2713.24 1354.08 2256.24
Total 4760.51 6156.72 5058.73 3412.52 168.78 3911.452
Bajaj Allianz
First year 4197.07 3748.84 2436.27 841.38 566.05 2357.922
Renewal 5789.33 6536.42 5543.65 3452.02 1845.3 4633.344
Total 9986.40 10285.27 7979.93 4293.41 2415.36 6992.074
AVIVA First year 693.95 752.18 519.86 211.35 132.90 462.048
Renewal 1258.88 1570.66 1567.21 1459.32 1120.63 1395.34
Total 1952.83 2322.84 2087.07 1680.66 1253.54 1859.388
PRIVATE First year 29537.74 31839.19 27040.46 13298.44 10677.31 22478.63
Renewal 26412.22 36419.61 42764.83 41450.32 31621.67 35733.73
Total 55949.96 68258.80 69805.28 54748.76 42299.18 58212.4
Source: IRDA Annual Reports
Due to change in IRDA regulations with regard to Unit Linked insurance products,
there has been a drastic fall in all companies in the first year premium collected by
life insurance companies in this segment. From the year 2008-09 to 2012-13 the
total difference in unit linked policy premium collected by LIC alone has fallen by a
whopping 14930.61 Crores. In that same period the private sector life insurance
companies which were predominantly selling unit linked products saw their
premiums fall by 18860.43 Crores. In the renewal premium segment, LIC has had a
fall of 13236.13 Crores and overall the premiums of LIC have fallen by 28166.75
Crores. The following graph depicts the premium collected in the unit linked
segment.
Graph 14 Unit linked Premium collected
Source: IRDA Annual Reports
0
10000
20000
30000
40000
50000
60000
70000
80000
Column2
2008-09
2009-10

185
The following table depicts the growth rate in unit linked policies in LIC and private
sector life insurance companies.
Table 7.52 Table showing growth in unit linked premium in percentage
2009-10 2010-11 2011-12 2012-13
LIC First year 85.72412 -5.64002 -84.5017 -95.3265
Renewal -2.03647 -33.7992 -14.9736 -41.2772 Total 906.1985 -17.0652 -61.9837 -56.1755
HDFC First year 18.78866 29.75368 -41.2879 18.48835
Renewal 25.10618 26.52482 30.01588 -3.51791 Total 22.07825 28.03055 -3.68303 2.821865
ICICI First year -5.03305 0.151639 -62.1761 14.50558
Renewal 20.21463 -1.86544 -9.43697 -18.8709 Total 9.081168 -1.09106 -29.9385 -11.8663
SBI First year 34.83188 2.524793 -48.8603 -43.263
Renewal 89.86005 87.4957 17.88734 -32.5203 Total 50.51336 33.06899 -15.0528 -35.7121
Reliance First year 4.291829 -51.7393 -59.1061 -52.8851
Renewal 94.63436 29.55235 -18.4407 -50.0936 Total 29.329 -17.834 -32.542 -95.0541
Bajaj Allianz First year -10.6796 -35.0127 -65.4644 -32.7236
Renewal 12.9046 -15.1883 -37.7302 -46.5443 Total 2.99277 -22.414 -46.1974 -43.7426
AVIVA First year 8.391094 -30.8862 -59.3448 -37.1185
Renewal 24.76646 -0.21965 -6.88421 -23.2088 Total 18.94737 -10.1501 -19.4728 -25.4138
PRIVATE First year 7.791558 -15.0718 -50.8202 -19.7101
Renewal 37.88924 17.42254 -3.07381 -23.7119 Total 21.99973 2.265613 -21.5693 -22.7395
Source: IRDA Annual Reports
The table above shows that there is a 95% negative growth in LIC s first year
premiums in the unit linked segment. However in the private sector the total decline
in all the companies together has been only 20% in the first year premium and 24%
in renewal premiums. The overall decline in private sector is only about 23% where
as in LIC the fall in the renewal premium sector is 41% and in the total premium the
decline is 56%. Every private company has seen the fall the maximum fall being
shown in Bajaj Allianz which has seen a de growth of 65% in this segment. Though
the maximum policies in the unit linked segment have been sold by private sector
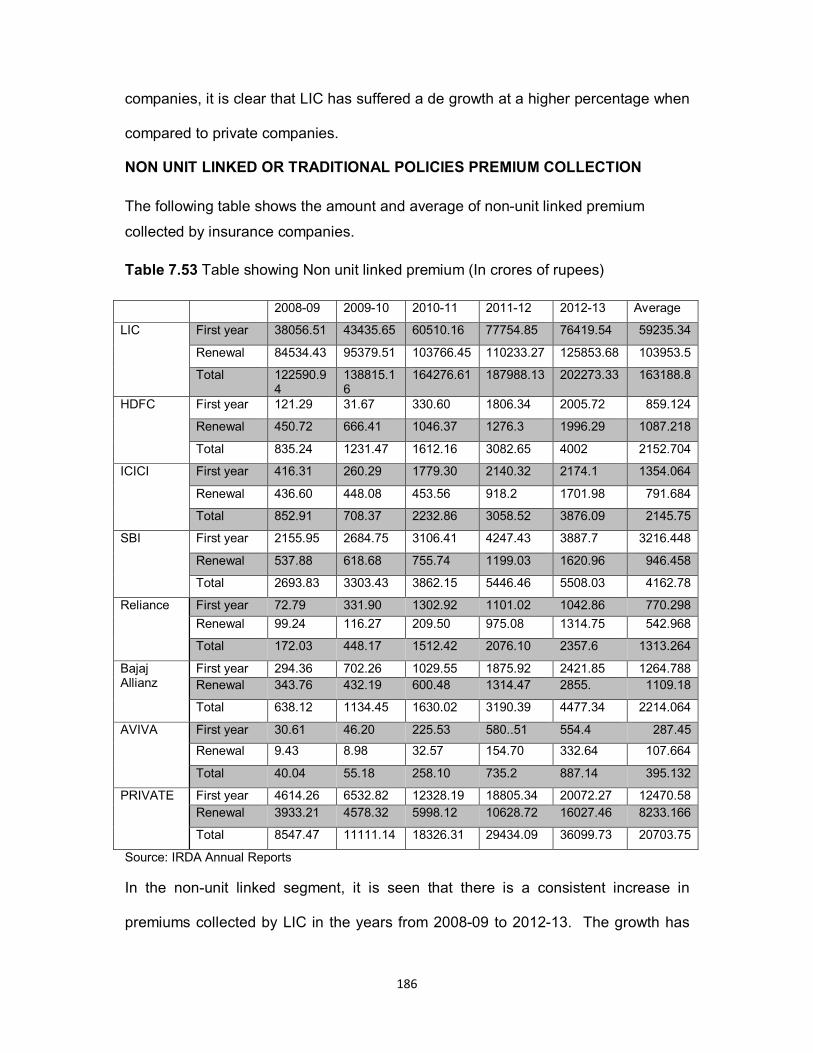
186
companies, it is clear that LIC has suffered a de growth at a higher percentage when
compared to private companies.
NON UNIT LINKED OR TRADITIONAL POLICIES PREMIUM COLLECTION
The following table shows the amount and average of non-unit linked premium
collected by insurance companies.
Table 7.53 Table showing Non unit linked premium (In crores of rupees)
2008-09 2009-10 2010-11 2011-12 2012-13 Average
LIC First year 38056.51 43435.65 60510.16 77754.85 76419.54 59235.34
Renewal 84534.43 95379.51 103766.45 110233.27 125853.68 103953.5
Total 122590.94
138815.16
164276.61 187988.13 202273.33 163188.8
HDFC First year 121.29 31.67 330.60 1806.34 2005.72 859.124
Renewal 450.72 666.41 1046.37 1276.3 1996.29 1087.218
Total 835.24 1231.47 1612.16 3082.65 4002 2152.704
ICICI First year 416.31 260.29 1779.30 2140.32 2174.1 1354.064
Renewal 436.60 448.08 453.56 918.2 1701.98 791.684
Total 852.91 708.37 2232.86 3058.52 3876.09 2145.75
SBI First year 2155.95 2684.75 3106.41 4247.43 3887.7 3216.448
Renewal 537.88 618.68 755.74 1199.03 1620.96 946.458
Total 2693.83 3303.43 3862.15 5446.46 5508.03 4162.78
Reliance First year 72.79 331.90 1302.92 1101.02 1042.86 770.298
Renewal 99.24 116.27 209.50 975.08 1314.75 542.968
Total 172.03 448.17 1512.42 2076.10 2357.6 1313.264
Bajaj Allianz
First year 294.36 702.26 1029.55 1875.92 2421.85 1264.788
Renewal 343.76 432.19 600.48 1314.47 2855. 1109.18
Total 638.12 1134.45 1630.02 3190.39 4477.34 2214.064
AVIVA First year 30.61 46.20 225.53 580..51 554.4 287.45
Renewal 9.43 8.98 32.57 154.70 332.64 107.664
Total 40.04 55.18 258.10 735.2 887.14 395.132
PRIVATE First year 4614.26 6532.82 12328.19 18805.34 20072.27 12470.58
Renewal 3933.21 4578.32 5998.12 10628.72 16027.46 8233.166
Total 8547.47 11111.14 18326.31 29434.09 36099.73 20703.75
Source: IRDA Annual Reports
In the non-unit linked segment, it is seen that there is a consistent increase in
premiums collected by LIC in the years from 2008-09 to 2012-13. The growth has
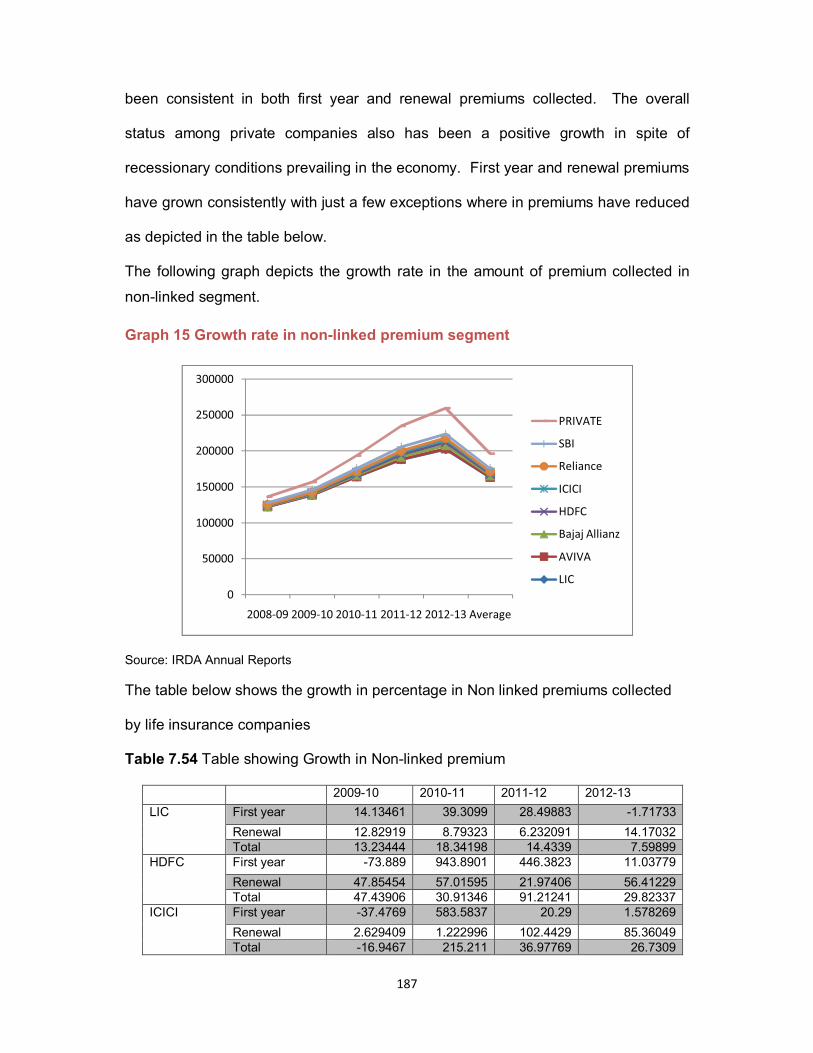
187
been consistent in both first year and renewal premiums collected. The overall
status among private companies also has been a positive growth in spite of
recessionary conditions prevailing in the economy. First year and renewal premiums
have grown consistently with just a few exceptions where in premiums have reduced
as depicted in the table below.
The following graph depicts the growth rate in the amount of premium collected in
non-linked segment.
Graph 15 Growth rate in non-linked premium segment
Source: IRDA Annual Reports
The table below shows the growth in percentage in Non linked premiums collected
by life insurance companies
Table 7.54 Table showing Growth in Non-linked premium
2009-10 2010-11 2011-12 2012-13
LIC First year 14.13461 39.3099 28.49883 -1.71733
Renewal 12.82919 8.79323 6.232091 14.17032 Total 13.23444 18.34198 14.4339 7.59899
HDFC First year -73.889 943.8901 446.3823 11.03779
Renewal 47.85454 57.01595 21.97406 56.41229 Total 47.43906 30.91346 91.21241 29.82337
ICICI First year -37.4769 583.5837 20.29 1.578269
Renewal 2.629409 1.222996 102.4429 85.36049 Total -16.9467 215.211 36.97769 26.7309
0
50000
100000
150000
200000
250000
300000
2008-09 2009-10 2010-11 2011-12 2012-13 Average
PRIVATE
SBI
Reliance
ICICI
HDFC
Bajaj Allianz
AVIVA
LIC

188
SBI First year 24.52747 15.70575 36.73115 -8.46936
Renewal 15.02194 22.15362 58.65642 35.18928 Total 22.62949 16.91333 41.02145 1.130459
Reliance First year 355.9692 292.564 -15.496 -5.28237
Renewal 17.16042 80.18405 365.432 34.83509 Total 160.5185 237.4657 37.27007 13.55908
Bajaj Allianz First year 138.5718 46.60525 82.20776 29.10199
Renewal 25.72434 38.93889 118.9032 117.1978 Total 77.78004 43.68372 95.72705 40.33833
AVIVA First year 50.93107 388.1602 157.3981 -4.49777
Renewal -4.772 262.6949 374.977 115.0226 Total 37.81219 367.7419 184.8508 20.66649
PRIVATE First year 41.57893 88.71161 52.53934 6.737076
Renewal 16.40162 31.01138 77.20086 50.79389 Total 29.99332 64.93636 60.61111 22.64599
Source: IRDA Annual Reports
The table above shows the percentage of growth and decline in the first year,
renewal and total premium collected. The highest growth rate is reported in the year
2010-11 by Aviva which shows a 388% growth in one year and HDFC reports
maximum fall in this segment in the year 2009-10 with a decline of 74%. However in
most of the cases there is a positive growth and this is seen in the overall total in
premiums collected by private companies. However LIC shows a marginal decline of
nearly 2% in the year 2012-13.
LAPSATION OF POLICY
Surrender and lapsation of policies is one of the major challenges that an insurance
company has to face. Customer dissatisfaction leading to lapsation of policy is widely
prevalent both in LIC and especially in the private sector. This is more so in the
wake of mis selling of insurance products, promise of false and unrealistic returns
and high rate of allocation charges that are hidden from the client when the policy is
sold. The following table shows the number of policies lapsed in the years from
2005-06 to 2012-13.

189
Table 7.55 Table showing forfeiture/lapsed policies in respect of non-linked business
Insurers 2005-06 2006-07 2007-08 2008-09 2009-10 2010-11 2011-12 2012-13
LIC
No, policies in '000
9568.88 7773.00 11008.50 7372.61 9744.37 11483.44 12512.517 14819.45
S.A (Crore)
61640.0 63206.46
73685.88 52926.09 114767.41
89860.47 109789.55 13.44
LapesRatio(no,p) (%)
6 4 4 5 5 5.6
HDFC Standard
No, policies in '000
40.55 29.32 36.47 76.07 114.09 80.54 73.8 109.52
S.A (Crore)
793.56 787.29 908.73 1524.00 2716.23 2777.51 3271.56 5624.63
LR(no,p) (%)
4 6 8 5 4.2 5.6
ICICI Prudential
No, policies in '000
136.54 179.97 439.24 776.76 968.89 547.89 525.42 511.29
S.A (Crore)
1377.46 2460.90 6853.82 25269.40 32353.92
16581.87 10109.19 9538.24
LR(no,p) (%)
40 53 81 46 41.9 34.1
SBI Life
No, policies in '000
31.52 85.29 78.84 47.89 46.49 54.37 109.023 202.30
S.A (Crore)
459.43 772.89 1108.38 1355.59 5903.89 2035.08 3991.71 0.79
LR(no,p) (%)
16 9 7 7 9.4 12.3
Reliance
No, policies in '000
17.58 47.13 43.46 90.91 80.96 202.12 793.652 588.82
S.A (Crore)
259.80 691.90 662.53 678.68 1531.28 2362.68 8200.19 9614.35
LR(no,p) (%)
21 40 31 16 38.5 25.8
Bajaj Allianz
No, policies in '000
66.47 77.42 105.91 96.14 160.62 156.33 454.58 459.24
S.A (Crore
2417.74 2364.27 2392.49 1723.27 10852.05
4944.94 1943.75 9940.77
LR(no,p) (%)
19 14 17 11 21.4 18.7
AVIVA Life
No, policies in '000
18.60 24.19 39.71 32.47 37.36 33.28 57.11 63.02
S.A (Crore
48.99 3.23 124.86 165.63 377.58 1290.80 3142.86 5969.41
LR(no,p) (%)
80 59 24 31 27.8 21.7
Private Total
No, policies in '000
617.19
884.1
1287.6
1732.316
2608.59
2567.96
3533.116
12046.01
S.A (Crore)
12436.55
16093.99
25103.29
46616.26
100033.8
68435.78
83400.48
73332.62
LR(no,p) (%)
-278
-386
-395
-531
-398
511.1
553
Source: IRDA Annual Reports
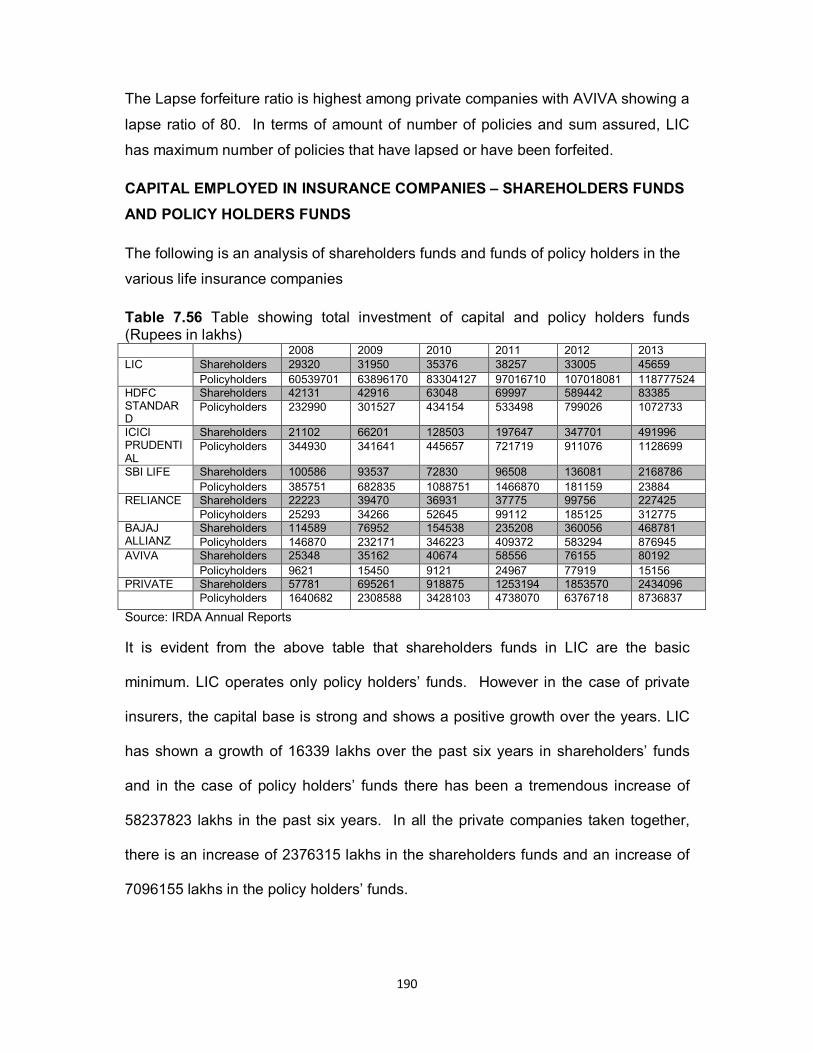
190
The Lapse forfeiture ratio is highest among private companies with AVIVA showing a
lapse ratio of 80. In terms of amount of number of policies and sum assured, LIC
has maximum number of policies that have lapsed or have been forfeited.
CAPITAL EMPLOYED IN INSURANCE COMPANIES – SHAREHOLDERS FUNDS
AND POLICY HOLDERS FUNDS
The following is an analysis of shareholders funds and funds of policy holders in the
various life insurance companies
Table 7.56 Table showing total investment of capital and policy holders funds (Rupees in lakhs) 2008 2009 2010 2011 2012 2013 LIC
Shareholders 29320 31950 35376 38257 33005 45659
Policyholders 60539701 63896170 83304127 97016710 107018081 118777524 HDFC STANDARD
Shareholders 42131 42916 63048 69997 589442 83385 Policyholders 232990 301527 434154 533498 799026 1072733
ICICI PRUDENTIAL
Shareholders 21102 66201 128503 197647 347701 491996 Policyholders 344930 341641 445657 721719 911076 1128699
SBI LIFE
Shareholders 100586 93537 72830 96508 136081 2168786
Policyholders 385751 682835 1088751 1466870 181159 23884 RELIANCE
Shareholders 22223 39470 36931 37775 99756 227425 Policyholders 25293 34266 52645 99112 185125 312775
BAJAJ ALLIANZ
Shareholders 114589 76952 154538 235208 360056 468781 Policyholders 146870 232171 346223 409372 583294 876945
AVIVA
Shareholders 25348 35162 40674 58556 76155 80192
Policyholders 9621 15450 9121 24967 77919 15156 PRIVATE Shareholders 57781 695261 918875 1253194 1853570 2434096 Policyholders 1640682 2308588 3428103 4738070 6376718 8736837
Source: IRDA Annual Reports
It is evident from the above table that shareholders funds in LIC are the basic
minimum. LIC operates only policy holders’ funds. However in the case of private
insurers, the capital base is strong and shows a positive growth over the years. LIC
has shown a growth of 16339 lakhs over the past six years in shareholders’ funds
and in the case of policy holders’ funds there has been a tremendous increase of
58237823 lakhs in the past six years. In all the private companies taken together,
there is an increase of 2376315 lakhs in the shareholders funds and an increase of
7096155 lakhs in the policy holders’ funds.
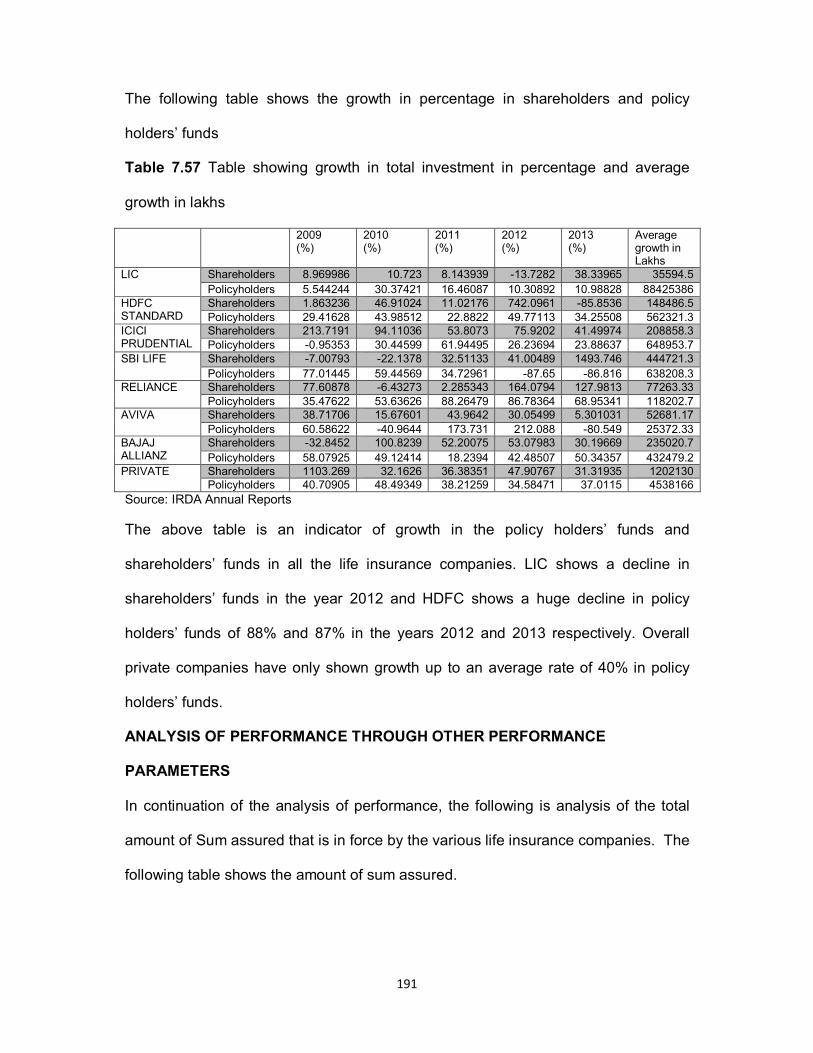
191
The following table shows the growth in percentage in shareholders and policy
holders’ funds
Table 7.57 Table showing growth in total investment in percentage and average
growth in lakhs
2009 (%)
2010 (%)
2011 (%)
2012 (%)
2013 (%)
Average growth in Lakhs
LIC
Shareholders 8.969986 10.723 8.143939 -13.7282 38.33965 35594.5
Policyholders 5.544244 30.37421 16.46087 10.30892 10.98828 88425386 HDFC STANDARD
Shareholders 1.863236 46.91024 11.02176 742.0961 -85.8536 148486.5 Policyholders 29.41628 43.98512 22.8822 49.77113 34.25508 562321.3
ICICI PRUDENTIAL
Shareholders 213.7191 94.11036 53.8073 75.9202 41.49974 208858.3 Policyholders -0.95353 30.44599 61.94495 26.23694 23.88637 648953.7
SBI LIFE
Shareholders -7.00793 -22.1378 32.51133 41.00489 1493.746 444721.3
Policyholders 77.01445 59.44569 34.72961 -87.65 -86.816 638208.3 RELIANCE
Shareholders 77.60878 -6.43273 2.285343 164.0794 127.9813 77263.33 Policyholders 35.47622 53.63626 88.26479 86.78364 68.95341 118202.7
AVIVA
Shareholders 38.71706 15.67601 43.9642 30.05499 5.301031 52681.17
Policyholders 60.58622 -40.9644 173.731 212.088 -80.549 25372.33 BAJAJ ALLIANZ
Shareholders -32.8452 100.8239 52.20075 53.07983 30.19669 235020.7
Policyholders 58.07925 49.12414 18.2394 42.48507 50.34357 432479.2 PRIVATE Shareholders 1103.269 32.1626 36.38351 47.90767 31.31935 1202130
Policyholders 40.70905 48.49349 38.21259 34.58471 37.0115 4538166
Source: IRDA Annual Reports
The above table is an indicator of growth in the policy holders’ funds and
shareholders’ funds in all the life insurance companies. LIC shows a decline in
shareholders’ funds in the year 2012 and HDFC shows a huge decline in policy
holders’ funds of 88% and 87% in the years 2012 and 2013 respectively. Overall
private companies have only shown growth up to an average rate of 40% in policy
holders’ funds.
ANALYSIS OF PERFORMANCE THROUGH OTHER PERFORMANCE
PARAMETERS
In continuation of the analysis of performance, the following is analysis of the total
amount of Sum assured that is in force by the various life insurance companies. The
following table shows the amount of sum assured.

192
Table 7.58 Table showing sum assured in force (Rupees in crores)
INSURER
3/31/2005
3/31/2006
3/31/2007
3/31/2008
3/31/2009
3/31/2010
3/31/2011
3/31/2012
3/31/2013
LIC 1,292,794.87
1,539,943.84
2,104,340.16
2,298,188.94
2,745,080.10
3,112,936.85
3,475,163.11
3,862,497.27
3,942,351.25
HDFC 4,773,040.00
6,719,297.00
4,574,300.00
5,715,800.00
7,261,000.00
9,891,700.00
13,871,800.00
20,185,800.00
ICICI 4,587,700.00
9,233,400.00
15,999,500.00
18,790,200.00
18,375,660.01
17,376,443.41
24,168,600.00
27,577,100.00
SBI 5,437,167.93
6,483,775.34
6,450,300.00
8,589,600.00
Reliance
44,264.58
67,983.49
65,933.12
130,099.37
123,409.46
125,792.34
Source: IRDA Annual Reports
The above table indicates that the amount of sum assured of LIC has increased by
2649556.38 Crores, indicating a growth rate of 205%. There is a continuous steady
increase in the amount of sum assured by LIC. The Sum assured in private
insurance companies also has increased steadily in HDFC the growth is 15412760 in
the past nine years recording a growth of 322.91%. ICICI records a growth of
22989400 Crores resulting in a growth rate of 501.10%.
The following table shows the yield on policy holders’ account which is an important
indicator of performance
Table 7.59 Table showing Yield on Policy Holders’ Account
INSURER 3/31/2006 3/31/2007 3/31/2008 3/31/2009 3/31/2010 3/31/2011 3/31/2012 3/31/2013
LIC 8.68% 8.21% 7.83% 7.71% 7.59% 7.39% 7.70% 7.90% HDFC 13.67% 8.69% 8.97% 8.20% 6.40% 9.31% 9.56% 8.54%
ICICI 24.00% 8.00% 13.00% -20.40% 40.00% 10.20% -0.20% 9.10%
SBI 8.00% 6.00% 5.00% -12.00% 21.00% 8.00% 1.00% 9.00%
Source: IRDA Annual Reports
The above table shows a consistent growth rate of about 8% in LIC. Private
companies have shown very erratic return as seen above. HDFC shows consistently
highest yield with no negative returns over the entire period. ICICI shows high
returns of 40% in the year ended 31.3.2010 however there is a wide variation in

193
returns of ICICI. SBI also has very inconsistent yield on investment as shown above
with yield ranging between -12% and a maximum of 21% in two subsequent years.
The following table shows yield on Shareholders account
Table 7.60 Table showing Yield on Share Holder's account
INSURER 3/31/2006 3/31/2007 3/31/2008 3/31/2009 3/31/2010 3/31/2011 3/31/2012 3/31/2013 LIC 6.54% 6.98% 5.34% 9.15% 8.69% 9.03% 7.12% 8.40% HDFC 10.60% 7.04% 8.04% 7.49% 6.30% 8.55% 9.30% 8.82% ICICI 4.00% 5.00% 11.00% 8.10% 3.20% 6.50% 8.00% 9.80% SBI 11.00% 8.00% 7.00% 7.00% 7.00% 4.00% 7.00% 8.00%
Source: IRDA Annual Reports
The above table shows a consistent growth rate of about 7-8% in LIC. Private
companies have also shown consistency in return as seen above. HDFC shows
consistently highest yield with no negative returns over the entire period. ICICI also
shows relatively steady rate of yield averaging about 8%. SBI also has very
consistent yield on investment as shown above with yield ranging between 4% and a
maximum of 11% in the five year period. The following graph depicts the yield on
shareholders account
Graph 16 Yield on shareholders account
Source: IRDA Annual Reports
The following table shows the Salary expenses of life insurance companies
0.00%
5.00%
10.00%
15.00%
20.00%
25.00%
30.00%
35.00%
40.00%
SBI
ICICI
HDFC
LIC

194
Table 7.61 Table showing Salary paid in Lakhs of rupees
INSURER 2006-07 2007-08 2008-09 2009-10
2010-11 2011 3/31/2012 3/31/2013
LIC 359,896.29 407,361.25 504,792.79 577,371.12
805,245.72
1,205,528.10
1,009,986.37
1,189,491.49
HDFC 11,179.23 19,054.28 40,291.41 66,213.51
61,029.63 62,421.87
54,746.48 60,920.81
ICICI 30,242.62 53,697.06 108,824.85 109105.35
92,773.50 86,400.90
76,388.82 76,913.69
SBI 3,453.21 10,027.79 16,737.60 24,093.35
30,914.67 38,528.99
42,765.11 46,620.25
Reliance 40,694.22 75,552.55
57,065.13 64,832.95
52,907.68 50,237.77
Source: IRDA Annual Reports
Salaries paid by LIC have increased by 829595.20 lakhs and has increased by 230%
in the eight year period. Private companies also have relatively stable amount of
salaries paid over the period. However ICICI shows a wide variation in salaries paid.
OPERATING EXPENSES
The amount spent on operating expenses is a major determinant of performance of
an insurance company. In the recent past it is seen that insurance companies are
cutting down costs by closing down local offices, reducing work force and increasing
productivity and efficiency among employees. The following table shows the amount
of operating expenses paid by insurance companies.
Table 7.62 Table showing Operating expenses related to insurance business (in lakhs of rupees)
INSURER 3/31/2006 3/31/2007 3/31/2008 3/31/2009 3/31/2010 3/31/2011 3/31/2012 3/31/2013
LIC 604156 708584 830932 906429 1224582 1698028 1491440 1670766 HDFC 39849 57674 101298 176007 150904 149521 126988 134377 ICICI 72500 152296 291994 274059 256915 218739 200347 203863 SBI 18996 32238 44694 62050 75298 88299 102393 115105
Reliance 11593 42904 103076 192297 163673 156270 128125 127506
Bajaj 48681 107302 200434 187579 177163 160658 140628 160030
Aviva 25498 42749 67601 77390 71019 56873 59451 51379 Private 356949 650000 1199741 1676761 1666046 1596202 2816466 1485404
Source: IRDA Annual Reports

195
The above table shows that there is a steady increase in the operating expenses of
LIC, the amount being increased by 1066610 lakhs over the eight year period,
resulting in an overall growth of 176.54%. In case of total operating expenses of
private companies, there is an increase of 1128455 lakhs, indicating an overall
growth of 316.13%. Many of the private companies like SBI show a consistent
increase in operating expenses, however ICICI has reduced operating expenses
from the fourth year onwards.
The following table shows the amount of administration expenses paid by insurance
companies
Table 7.63 Table showing Administration expenses ( in lakhs of rupees)
INSURER
3/31/2006 3/31/2007 3/31/2008 3/31/2009
3/31/2010 3/31/2011
3/31/2012
3/31/2013
LIC 203,480.75
254,974.10
277,548.58
261,910.28
335,375.47
125,586.35
402,743.88
412,789.67
HDFC 16,528.48 23,159.81 36,059.75 54,933.39
49,555.35 41,546.70
51,172.03
48,119.49
ICICI 22,333.36 54,658.73 102,532.60
98,540.58
127,064.41
99,035.28
86,550.06
92,166.95
SBI 10,877.66 16,502.48 21,162.68 30,204.71
37,256.35 41,251.54
49,121.70
54,762.35
Reliance
38,531.30 86,557.07
54,038.48 44,475.92
51,591.46
52,161.00
Source: IRDA Annual Reports
The above table shows that there is a steady increase in the administration
expenses of LIC, the amount being increased by 209308.92 lakhs over the eight
year period, resulting in an overall growth of 102.86%. Many of the private
companies show consistent increase in administration expenses.
The following table shows the amount of financial charges paid by insurance
companies

196
Table 7.64 Table showing Financial Charge ( in lakhs of rupees)
INSURER
3/31/2005
3/31/2006
3/31/2007
3/31/2008
3/31/2009
3/31/2010
3/31/2011
3/31/2012
3/31/2013
LIC 7,447.54
8,098.45
10,109.68
9,462.72
10,808.88
10,879.83
11,017.94
9,287.80
9,743.40
HDFC 49.62 113.91 506.66 379.54 29.74 313.25 448.61 1,462.59
ICICI 1,039.69
2,183.73
17,904.36
3188.7 8,386.42
2,429.67
1,579.92
1,359.82
SBI 77.25 160.42 320.55 333.12 486.03 555.53 440.59 446.62
Reliance
432.59 1,809.29
1,514.92
1,171.25
943.47 872.33
Source: IRDA Annual Reports
The above table shows that there is no consistency in the payments of financial
charges by LIC, the amount being increased by just 2295.86 lakhs over the eight
year period, resulting in an overall growth of 30.82%. Many of the private companies
show consistent increase in financial charges.
The following table shows the amount of marketing charges paid by insurance
companies.
Table 7.65 Table showing Marketing expenses (in lakhs of rupees)
INSURER 3/31/2006 3/31/2007 3/31/2008 3/31/2009 3/31/2010 3/31/2011 3/31/2012 3/31/2013
LIC 13,561.23 21,455.93 20,253.65 24,389.96 30,496.26 32,459.35 34,921.35 26,460.10 HDFC 8,660.42 9,243.83 11,081.42 40,347.80 27,659.82 33,595.09 3,117.82 2,835.96
ICICI 5,614.71 10,542.69 3,357.43 11170.44 2,932.21 8,697.92 11,410.92 13,052.43 SBI 3,835.84 3,243.15 3,893.69 3684.62 3,000.24 3,622.85 3,927.14 4,686.20
Reliance 19,585.66 25,440.62 49528.78 43647.95 21,657.71 22,897.59
Source: IRDA Annual Reports
The above table shows that there is a steady increase in the marketing expenses of
LIC, the amount being increased by 12898.87 lakhs over the eight year period,
resulting in an overall growth of 95%. Many of the private companies show
inconsistent changes in the amount spent on marketing which is a very essential
expenditure for an insurance company.
The following table shows the amount of Training expenses paid by insurance
companies.

197
Table 7.66 Table showing Training expenses (in lakhs of rupees)
INSURER 3/31/2006 3/31/2007 3/31/2008 3/31/2009 3/31/2010 3/31/2011 3/31/2012 3/31/2013
LIC 911.71 1,308.62 1,172.72 1,945.41 1,586.97 2,435.16 2,270.87 2,372.56 HDFC 2,186.30 4,302.82 8,586.23 7,450.35 4,344.88 4,304.80 4,860.49 4,885.58
ICICI 7,888.04 18,351.78 31,443.61 16363.42 19,416.96 16,308.49 18,433.51 16,504.02 SBI 292.07 810.61 1,115.72 1,858.68 791.44 1,724.37 2,004.29 3,630.72
Reliance 3,431.22 2,211.08 530.70 369.77 382.08 743.71
Source: IRDA Annual Reports
The above table shows that there is a steady increase in the training expenses of
LIC, the amount being increased by 1460.85 lakhs over the eight year period,
resulting in an overall growth of 160.23%. Many of the private companies show
inconsistent changes in the amount spent on training which is a very essential
expenditure for an insurance company. During the years 2008 to 2009, private
companies increased their spending on training and this is seen to be gradually
decreasing in the following years. However the table reveals that the amount spent
on training by private companies like ICICI and HDFC is extremely high when
compared to LIC.
The following table shows the amount of other expenses paid by insurance
companies.
Table 7.67 Table showing other expenses ( in lakhs of rupees)
INSURER 3/31/2006 3/31/2007 3/31/2008 3/31/2009 3/31/2010 3/31/2011 3/31/2012 3/31/2013
LIC 18,207.63 13,374.53 17,701.60 30,003.09 40,998.17 36,164.96 32,229.85 29,909.06 HDFC 1,245.43 1,799.38 4,772.44 6,682.24 7,146.46 7,338.95 12,643.04 16,152.33
ICICI 5,381.95 12,861.88 27,930.90 35504.07 6,341.83 5,867.22 5,984.05 3,865.97 SBI 460.45 810.75 1,463.49 1,875.81 2,849.39 2,615.36 4,134.02 4,958.84
Reliance 400.87 726.22 995.24 1,772.30 642.60 593.88
Source: IRDA Annual Reports
The above table depicts the amount spent on other expenses by life insurance
companies. The table shows no particular trend in the amount spent by LIC. Private
companies too show a lot of variation especially ICICI shows a dramatic increase in
the year ended 31.3.2008 and 31.3.2009 and then a sudden fall in the following

198
years. The following table indicates the Operating surplus of the various insurance
companies.
Table 7.68 Table showing Operating surplus ( in lakhs of rupees)
INSURER 3/31/2006 3/31/2007 3/31/2008 3/31/2009 3/31/2010 3/31/2011 3/31/2012 3/31/2013
LIC 62,177.05 75,780.89 82,958.97 92,911.58 103,092.27 113,761.71 128,122.90 143,638.18
HDFC 255.15 339.70 7,038.06 16,663.98 19,094.09 6,698.09 37,291.54 64,210.74
ICICI 10.06 136.02 325.11 212.93 1,297.70 607.60 1,331.96 1,449.68
SBI 252,787.54 8,156.13 10,845.49 17,775.28 33,552.00 59,693.65 73,839.54
Reliance 103075.86 192296.83 163673.25 156270.14 128125 127506.28
Source: IRDA Annual Reports
All companies show a positive operating surplus. However, LIC shows a growth in
operating surplus to the extent of Rs. 81461.13 lakhs in the period of eight years
resulting in an increase of 131.01%. Private companies too show a marked increase
in operating surplus in the eight year period. However the growth in the surplus has
been very inconsistent. The following table shows the relationship between
Operating Expenses on premium received.
Table 7.69 Table showing Premium received /Operating Expenses (in lakhs of
rupees)
INSURER 3/31/2009 3/31/2010 3/31/2011 3/31/2012 3/31/2013
LIC 576.286029 658.1038817 834.5208759 735.1004449 80.01739154
HDFC 3162.92552 2154.201939 1660.575045 1243.955958 1186.794999
ICICI 1784.67748 1554.352265 1223.329379 1428.847534 1505.830891
SBI 860.359673 745.2273994 683.8712975 779.6179915 1101.480091
Reliance 3898.53909 2478.054172 2378.122551 2330.553949 3151.883996
Bajaj 1765.52917 1551.379151 1671.788095 1879.098854 2321.731687
Aviva 3883.34412 2986.488703 2425.112039 2460.852612 2400.136406
Source: IRDA Annual Reports

199
The table above shows the amount spent on operating expense in relation to
premium received. It is seen that LIC spends the least amount on operating
expenses in relation to premium received. Private companies however have been
incurring very high expenditure on operating expenditure as indicated above.
The table below shows the Net profit on Share Capital
Table 7.70 Table showing net profit/share capital
INSURER 3/31/2008 3/31/2009 3/31/2010 3/31/2011 3/31/2012 3/31/2013
LIC 1,689,251.80 1,914,697.60 2,121,433.60 2,343,607.40 131,334.29 148,992.49
HDFC -1,915.89 -2,800.74 -1,398.29 -496.28 1,358.55 225.80
ICICI -9,956.84 -5,462.91 1,806.33 7,852.74 9,687.33 10,469.53
SBI 347.54 347.54 2,774.91 3,704.52 5,558.21 6,221.71
Reliance -6,692.23 -9,334.17 -2,436.68 -1,108.99 3,114.31 3,179.90
Bajaj -14,192.16 -4,689.80 35,982.35 70,137.35 87,001.53 85,305.55
Aviva -2,015.83 -3,318.47 -1,825.07 143.40 366.95 159.61
Source: IRDA Annual Reports
Most of the private companies are showing a negative return on share capital.
However because of the fact that LIC has a capital of only 5 crore, it shows a very
high return on share capital. SBI Life shows a very high return on share capital as
also Bajaj Allianz. The following table shows the profit before taxation in relation to
total shareholders’ investment.
Table 7.71 Table showing Profit before taxation as per shareholders’ account (in
lakhs)/Total shareholders’ investment
INSURER 2007-08 2008-09 2009-10 2010-11 2011-12 2012-13
LIC 288.072988 299.640063 299.841701 306.296887 397.92153 326.31464
HDFC Standard
-57.7982958 -117.196384 -43.6461109 -14.1434633 4.5979079 54.652515
ICICI Prudential
-731.276656 -133.034244 21.8306187 42.1205483 40.659072 31.902902
SBI Life 3.45475513 -2.84807082 38.1010573 38.3854188 40.844791 2.8687478
Reliance 345.619403 274.869521 76.8920419 34.2263402 3.7661895 16.727273
Bajaj Allianz -18.6649678 -9.18364695 36.0422679 45.9873814 37.482503 28.660931
Aviva -79.8840145 -140.919174 -84.75193 4.90982991 9.6605607 3.990423
Source: IRDA Annual Reports

200
LIC shows a very high profit as per shareholders account in relation to shareholders’
investment. However private companies too show a relatively high return.The
following table shows the profit before taxation in relation to total policyholders’
investment.
Table 7.72 Table showing Policy Holders’ Account Surplus (in lakhs)/Total
shareholders’ investment
INSURER 2007-08 2008-09 2009-10 2010-11 2011-12 2012-13
LIC 0.13703239 0.14540778 0.12375377 0.11725815 0.1197209 0.1209303
HDFC Standard
3.0207305 5.5265366 4.3979786 1.25548737 4.6671823 5.9857392
ICICI Prudential
9.42568057 6.23256576 29.1188066 8.41878903 14.619637 12.843814
SBI Life 2.11431727 1.58823142 1.78424635 2.39366815 32.316915 306.27617
Reliance 0 4.63141306 16.4820971 9.70719994 20.442944 14.20446
Bajaj Allianz 13.4833526 4.97478152 11.8308142 20.5424406 17.234876 9.8349383
Aviva 1385.89544 720.36246 3518.98915 835.398726 26.513431 176.12827
Source: IRDA Annual Reports
Since LIC has extremely small amount of shareholders investment, there is no
logical conclusion for comparison of policy holders’ surplus with Total shareholders’
investment. However among the private companies, it is obvious that some
companies are showing huge amount of return. Aviva shows a surplus 1385 times of
shareholders’ investment. The following table shows the Total investment with
relation to Operating Surplus.
Table 7.73 Table showing Total Investment/Operating Surplus
Source: IRDA Annual Reports
INSURER 3/31/2008 3/31/2009 3/31/2010 3/31/2011 3/31/2012 3/31/2013
LIC 0.14 0.15 0.12 0.12 0.12 0.12
HDFC 2.56 4.84 3.84 1.11 2.69 5.55
ICICI 0.09 0.05 0.23 0.07 0.11 0.09
SBI 1.68 1.40 1.53 2.15 18.82 3.37
Reliance 216.93 260.79 182.72 114.16 44.97 23.60

201
Since LIC has extremely small amount of shareholders investment, there is no
logical conclusion for comparison of policy holders’ surplus with Total shareholders’
investment. However among the private companies, it is obvious that some
companies are showing huge amount of return. Reliance shows a huge amount of
investment when compared to return.
Table 7.74 Table showing Operating Expenses/Net Premium (%)
INSURER 2008-09 2009-10 2010-11 2011-12 2012-13
LIC 5.76 6.58 8.35 7.35 0.8
HDFC Standard 31.63 21.54 16.61 12.44 11.87
ICICI Prudential 17.85 15.54 12.23 14.29 15.06
SBI Life 8.6 7.45 6.84 7.8 11.01
Reliance 38.99 24.78 23.78 23.31 31.52
Bajaj Allianz 17.66 15.51 16.72 18.79 23.22
Aviva 38.83 29.86 24.25 24.61 24
Private 26 20.99 18.11 33.46 18.95
Source: IRDA Annual Reports
The table above depicts the ratio between operating expenses as a percentage of
net premium. It is clearly seen that operating expenses of LIC as a percentage of
Net premium is very less when compared to Private companies. All private
companies spend on an average about 25% of premium as operating expenses.
However LIC shows high degree of operational efficiency. Among the private
companies, SBI Life is the only company which has average operating expenses on
net premium ratio of just 8.34%.
Table 7.75 Table showing Investment income/Net premium (%)
INSURER 2008-09 2009-10 2010-11 2011-12 2012-13
LIC 37.11 24.55 19.68 41.56 46.1
HDFC Standard 9.04 3.14 1.45 5.98 38.63
ICICI Prudential -0.48 0.2 0.25 5.09 10.08
SBI Life 2.04 0.84 0.77 1.03 5.28
Reliance 12.97 4.2 0.48 -0.72 74.8
Bajaj Allianz 27.39 8.39 14.81 -7.07 8.506
Aviva 28.33 9.77 16.11 9.63 34.52
Source: IRDA Annual Reports
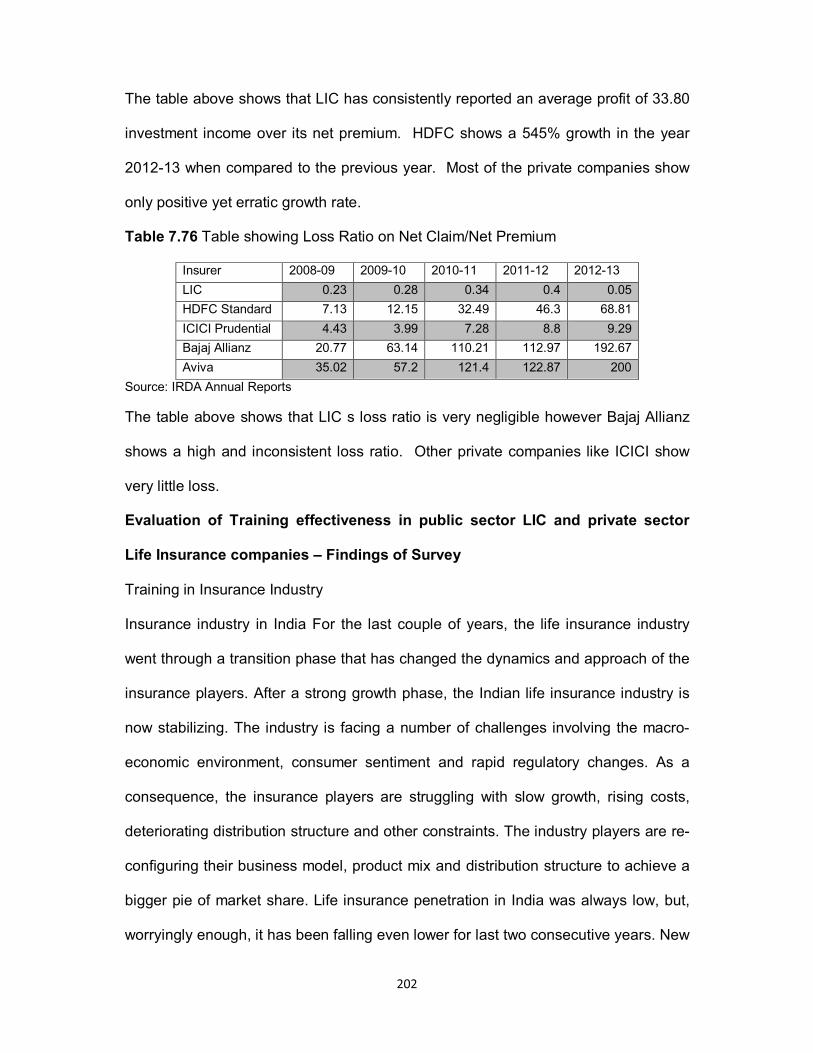
202
The table above shows that LIC has consistently reported an average profit of 33.80
investment income over its net premium. HDFC shows a 545% growth in the year
2012-13 when compared to the previous year. Most of the private companies show
only positive yet erratic growth rate.
Table 7.76 Table showing Loss Ratio on Net Claim/Net Premium
Insurer 2008-09 2009-10 2010-11 2011-12 2012-13
LIC 0.23 0.28 0.34 0.4 0.05
HDFC Standard 7.13 12.15 32.49 46.3 68.81
ICICI Prudential 4.43 3.99 7.28 8.8 9.29
Bajaj Allianz 20.77 63.14 110.21 112.97 192.67
Aviva 35.02 57.2 121.4 122.87 200
Source: IRDA Annual Reports
The table above shows that LIC s loss ratio is very negligible however Bajaj Allianz
shows a high and inconsistent loss ratio. Other private companies like ICICI show
very little loss.
Evaluation of Training effectiveness in public sector LIC and private sector
Life Insurance companies – Findings of Survey
Training in Insurance Industry
Insurance industry in India For the last couple of years, the life insurance industry
went through a transition phase that has changed the dynamics and approach of the
insurance players. After a strong growth phase, the Indian life insurance industry is
now stabilizing. The industry is facing a number of challenges involving the macro-
economic environment, consumer sentiment and rapid regulatory changes. As a
consequence, the insurance players are struggling with slow growth, rising costs,
deteriorating distribution structure and other constraints. The industry players are re-
configuring their business model, product mix and distribution structure to achieve a
bigger pie of market share. Life insurance penetration in India was always low, but,
worryingly enough, it has been falling even lower for last two consecutive years. New

203
regulations enforced by the insurance regulator effective September 2010, are partly
responsible for curbing the scope of Unit Linked Insurance Plans (ULIPs). The share
of linked business is declining year after year. In distribution channel mix,
Bancassurance channel is gaining more prominence due to its cost effectiveness
and wide network availability. During the year, the industry strengthened its focus
towards enhancing professional delivery of products and services, customer
satisfaction and operational efficiency. In financial year 2012-13, the industry has
witnessed a de-growth of 6.3% in new business premium income. With low
insurance penetration as compared to the large Indian population base, there is
tremendous scope for the life insurers to capitalize on.
Training Function: Insurance company training programs not only help employees
and students develop current and relevant skills, but also allow professionals to gain
a competitive advantage in the job market. Insurance professionals often seek
continuing education within companies to advance their careers, and develop deep
knowledge about the insurance industry. Formal training programs allow participants
to learn about the latest news and trends around specialties, including actuarial
calculations, insurance policy insurance and accounting.
The curriculum in insurance company training courses varies according to the
professional goals of the student, the organization and program objectives. For
instance, a typical program for an insurance sales agent might include a course on
the fundamentals of insurance planning, effective selling, account building,
negotiation tactics and retirement planning. An underwriting training class could
focus on the different types of insurance businesses and evaluation best practices.
Additionally, human resources departments within some insurance companies offer
management training programs. Courses range from improving oral and written

204
communication skills to managing stress and prioritizing projects.Skills development:
Students pick up a variety of skills-oral communications, decision-making and
negotiation skills-during company insurance training. Other abilities emphasized and
taught during insurance training programs include delivering customer service, as
well as building strong relationships with customers. Professionals also learn how to
measure and assess results; develop clearly defined strategies when selling and
marketing to clients, and lead teams with confidence.
Training program for sales managers:
The training program duration is 15 – 20 days, they get training on product
knowledge, they are trained on how to motivate and encourage Advisors.
Training program for Advisors:
The training program duration is 15 – 20 days, they are trained on product
knowledge, convincing skills and objection Handling.
Training program for operations executives:
They will get training on customer database files, they are trained in taking care of
the customer files, well trained in product information and documentation, renewals
will be informed periodically.
Every company offers training programs to help you understand their products and
give you some advantage in sales. The programs often include data gathering and
analyzing to locate the client's needs. Since life insurance has many different uses,
the company training also touches on several of the ways clients benefit from
policies. This training covers buy/sell business arrangements, estate planning,
deferred compensation programs, key man insurance and others.
Other skills for employees in Life Insurance Companies:
205
Interpersonal skills, excellent communication skills, Understanding nature, client care
and interest, aggressiveness, convincing skills, ability to motivate others and a keen
interest to learn are the other skills that are imperative for employees of insurance
companies.
Potential for employees in insurance industry - Companies desiring to increase its
Internet marketing presence during the 2008 to 2018 decade will hire educated
workers trained in the latest computer and Internet technologies according to the
Bureau of Labor Statistics. Also, factors such as population growth will drive demand
for the insurance business. Consumers will need to purchase housing insurance, car
insurance and other liability policies to protect against loss, theft or injury. However,
the rapid advancement of technology in the sector could curb hiring in insurance
companies. Internet technologies allow customers to conduct research on their own,
as well as receive price quotes and submit insurance claims without the assistance
of a trained professional.
The position of a life insurance agent varies dramatically in not only pay but also the
area of life insurance in which you work. You might start out with a salary but this
often lasts a short time until you finish the company training. Once you complete the
training, normally the position is commission-only pay. Training for a position in life
insurance sales may take as little as a month to get the basic license.
Training for Licensing - In order to sell life insurance products, you have to have a
license. The IRDA has strict rules with regard to licensing and certification of agents.
Agents are provided mandatory training to enable them to successfully complete the
examination conducted by the IRDA. The Regulator requires all agents to take a test
in order to receive a license. It is compulsory to take pre-test training either live in the
classroom or online before the test is taken. As per IRDA Guideline, until a person
206
passes out IRDA examination he cannot sell insurance. For this, person has to get
attached with a insurance company as agent, financial consultant or corporate
broker or a person has to be the employee of Insurance company.
Then he has to undergo a offline or online 50 hour training (mandatory) to get eligible
to give the exam. Whichever company he will completes training with, will give letter
of completion, which is mandatory to carry along while appearing for the exam.
Once the person passes the exam, he can sell insurance for only one company ( in
case of individual) and for many companies( if it’s a company as corporate broker).
As per IRDA Guideline an Individual cannot sell life & general insurance of more
than one company. Normally the classes for preparation are one to four days. In
addition to the classroom study, it's advisable to study at home also. Once the
training is completed the agent receives a certificate to validate the training
completed. The certificate is required to sit for the examination.
Leadership Training for Success
All managers need methods. Leaders need to know the most effective techniques for
guiding teams, mentoring individuals, and validating the results. Without solid
methods, managers will revert use a one-size-fits-all approach to leadership that
reflects the leader's personality, rather than the employees' needs. Committed,
mentoring leadership is essential to employee morale, productivity and retention
ANALYSIS AND INTERPRETATION OF FINDINGS OF SURVEY:
The following are the findings of the survey conducted among the employees and
agents of public sector LIC and 10 private sector LIC s SBI Life, ICICI Prudential,
HDFC Life, Max Life, Bajaj Life, Met Life, Birla Sun Life, ING Vysya, TATA AIG and
Reliance Life.
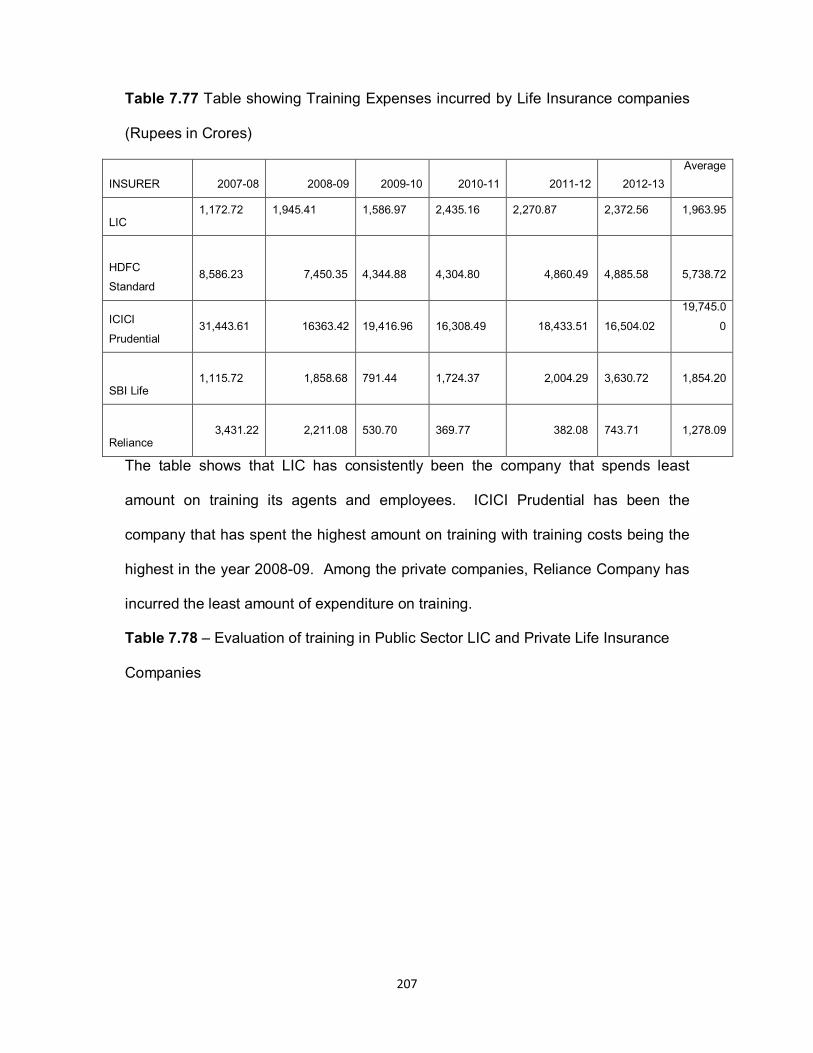
207
Table 7.77 Table showing Training Expenses incurred by Life Insurance companies
(Rupees in Crores)
INSURER 2007-08 2008-09 2009-10 2010-11 2011-12 2012-13
Average
LIC 1,172.72 1,945.41 1,586.97 2,435.16 2,270.87 2,372.56 1,963.95
HDFC
Standard
8,586.23 7,450.35
4,344.88
4,304.80 4,860.49
4,885.58
5,738.72
ICICI
Prudential
31,443.61 16363.42
19,416.96
16,308.49 18,433.51
16,504.02
19,745.0
0
SBI Life
1,115.72 1,858.68
791.44
1,724.37 2,004.29
3,630.72 1,854.20
Reliance 3,431.22 2,211.08
530.70
369.77 382.08
743.71 1,278.09
The table shows that LIC has consistently been the company that spends least
amount on training its agents and employees. ICICI Prudential has been the
company that has spent the highest amount on training with training costs being the
highest in the year 2008-09. Among the private companies, Reliance Company has
incurred the least amount of expenditure on training.
Table 7.78 – Evaluation of training in Public Sector LIC and Private Life Insurance
Companies
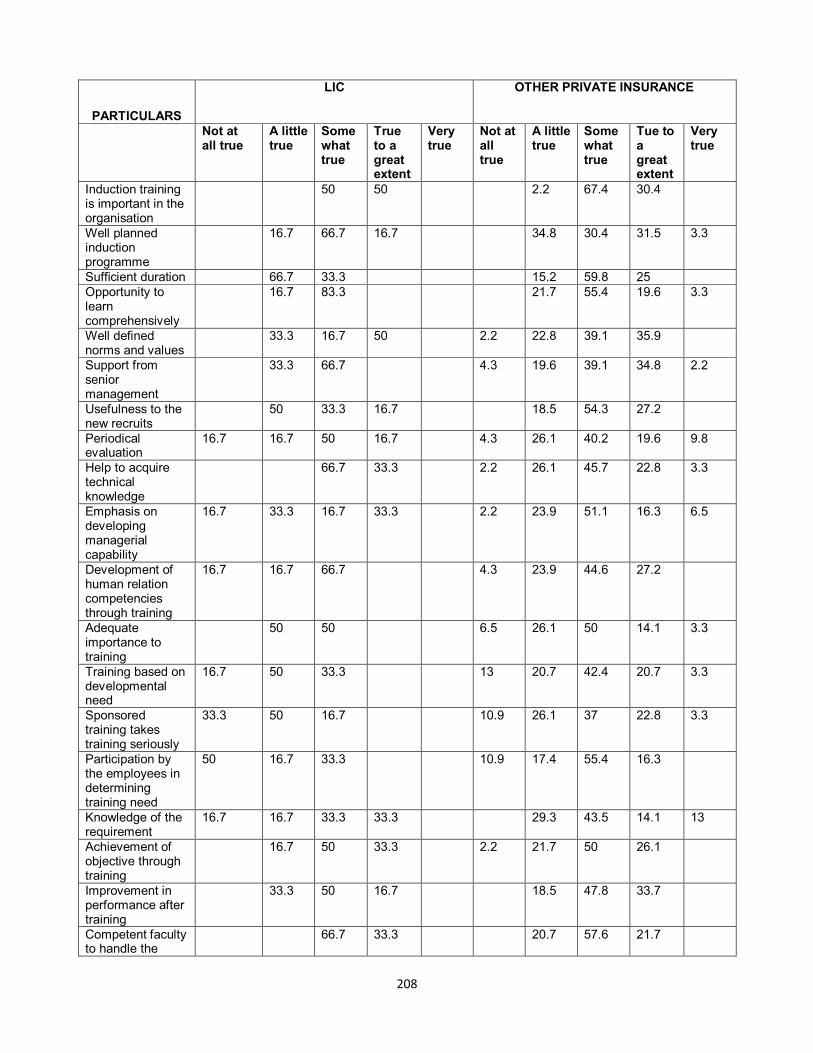
208
PARTICULARS
LIC OTHER PRIVATE INSURANCE
Not at all true
A little true
Some what true
True to a great extent
Very true
Not at all true
A little true
Some what true
Tue to a great extent
Very true
Induction training is important in the organisation
50
50 2.2 67.4 30.4
Well planned induction programme
16.7 66.7 16.7 34.8 30.4 31.5 3.3
Sufficient duration 66.7 33.3 15.2 59.8 25 Opportunity to learn comprehensively
16.7 83.3 21.7 55.4 19.6 3.3
Well defined norms and values
33.3 16.7 50 2.2 22.8 39.1 35.9
Support from senior management
33.3 66.7 4.3 19.6 39.1 34.8 2.2
Usefulness to the new recruits
50 33.3 16.7 18.5 54.3 27.2
Periodical evaluation
16.7 16.7 50 16.7 4.3 26.1 40.2 19.6 9.8
Help to acquire technical knowledge
66.7 33.3 2.2 26.1 45.7 22.8 3.3
Emphasis on developing managerial capability
16.7 33.3 16.7 33.3 2.2 23.9 51.1 16.3 6.5
Development of human relation competencies through training
16.7 16.7 66.7 4.3 23.9 44.6 27.2
Adequate importance to training
50 50 6.5 26.1 50 14.1 3.3
Training based on developmental need
16.7 50 33.3 13 20.7 42.4 20.7 3.3
Sponsored training takes training seriously
33.3 50 16.7 10.9 26.1 37 22.8 3.3
Participation by the employees in determining training need
50 16.7 33.3 10.9 17.4 55.4 16.3
Knowledge of the requirement
16.7 16.7 33.3 33.3 29.3 43.5 14.1 13
Achievement of objective through training
16.7 50 33.3 2.2 21.7 50 26.1
Improvement in performance after training
33.3 50 16.7 18.5 47.8 33.7
Competent faculty to handle the
66.7 33.3 20.7 57.6 21.7

209
Source: Training survey
The table above clearly suggests that induction training provided by some private
companies is extremely professional. Some of the companies like Max Life
Insurance Co. provide training to candidates who are recruited after a stringent
screening process. The private companies spend a lot of money on training.
However it was found that in some private companies training is done in a very
haphazard manner and they lack integrity. The trainees do not take the programmes
seriously nor do they adhere to training norms. Training provided by LIC ranks
second in terms of induction training. However periodic evaluation, planning and
review of on-going training programmes are ranked higher in LIC than among most
private sector.
Analysis of findings of the Survey
Ø Analysis of Customer awareness and preference for Life Insurance as an
investment tool
Why Awareness is Important
The growing need for financial education for the families to take better financial
decision and to increase their economic security has been widely recognized. It is
felt that well informed and well educated customers can create economic ripples.
training programme Competency in implementing action plan by trainee after training
16.7 50 16.7 16.7 12 67.3 20.7
Selection of external training programmes after collecting information about quality
50 50 4.3 13 62 20.7
Commitment by learner about implementing learnt skill
50 33.3 16.7 7.6 30.4 39.1 22.8
Impact of the training on return on investment
50 50 2.2 15.2 56.5 26.1
Rating of company with regard to the level of training
33.3 (2nd
8.7 (2
nd
rank)
63 (3
rd
rank)
28.3 (4
th
rank)

210
They make better financial decisions for themselves and their families, increasing
their economic security and well-being. Secured families are more involved in
their communities as home owners and voters. They are more involved as
parents with their children’s schools and teachers, enabling better educational
and economic outcomes for their children. They contribute to vital, thriving
communities, further fostering community economic development. Thus, being
financially literate is not only important to the individual household and family, it is
also important to communities and societies. (Hogarth, Jeanne M.,2006).
Insurance companies can address the problem of financial illiteracy of consumers
by educating them. This point was corroborated by the Max New York–NCAER
survey (NCAER, 2008) which showed that even though a majority of Indian
households are good savers, they do not undertake financial planning and are
financially at risk. Households need to understand the risk of both ‘living too long’
and ‘dying too young’. Further, in urban India and amongst the salaried class,
insurance is largely used as a tax saving tool, rather than for protection against
risk. There is need to reorient the consumer about the benefits of life insurance
for both financial protection as well as for long-term wealth creation. The
importance of insurance is unquestionable in modern economies as it serves a
broad public interest and is vital to individuals’ security. Advocacy can typically: (i)
heighten individuals’ awareness and responsibility towards potential risks;
(ii) enhance understanding of insurance mechanisms that can cover these risks;
and
(iii) enable the development of consumers’ knowledge and capacity in order to
make informed decisions as regards insurance matters(OECD, 2006).
211
Private insurers have introduced many innovative products and offer incentives
on policies in order to woo consumers. The market share of private insurers has
increased steadily on the basis of total premium from 14.25 per cent in 2005–06
to 29.90 per cent in 2009–10. In today’s context, though the customer has a
variety of products to choose from, wise choices are possible only with requisite
awareness. Besides, it is not enough for the customer to have knowledge only of
the various policies available. It is possible that a customer has problems with a
particular policy and should ideally be aware of organisations that look into
grievances and make prompt payment of claims. The customer must also be
informed about the lapse of policies, revival of policies, and the value of a policy
in case of surrender. Hence, the customer must not only choose a product which
is suitable, but also engage with a company in which the agents provide correct
information.
The results of the Max New York Life–NCAER Survey on India Financial
Protection (NCAER, 2008) indicates that awareness of life insurance stands at a
high of 78 per cent on an all-India level with more urban households (90%) aware
of it than rural households (73%). The level of awareness has increased with
education, age and income levels. However, ownership of insurance products
was low at only 24 per cent. Further, it was the salaried class that tended to buy
insurance the most, followed by businessmen. Also, as compared to others
married people are more likely to buy insurance.
A recent study by McKinsey & Company indicates that consumers have an unmet
need for long-term savings products and a preference for insurance vis-à-vis
other investment products. Consumers rank insurance higher than other
investment options because of the ease and convenience in investing, and in

212
obtaining tax benefits and protection cover. Indian consumers perceive life
insurance as a low-risk and high-return investment, this being a perception driven
by the awareness of LIC’s performance and its record of delivering stable returns
over the years. According to the study, India’s insurance market has grown over
the past ten years. Liberalisation of the sector has enabled the entry of a number
of new players who have contributed to the growth, (over 40 per cent per annum),
by enhancing product awareness and promoting consumer education and
information. However, the market is still in a nascent stage.1
Both insurance penetration and density have increased significantly over the
years, especially with the opening up of the insurance industry to the private
sector. However, the increase has been marginal as far as the non-life insurance
sector is concerned. India’s insurance penetration is lower than the world
average which in 2009 was 7.0 per cent, while for India it was 5.2 per cent.
Although, the penetration of Indian insurance is higher than that of some South
Asian countries like Pakistan (0.7%), Bangladesh (0.9%) and Sri Lanka (1.4%), it
lags behind other Asian countries like Japan (9.9%), South Korea (10.4%) and
Singapore (6.8%).2
Insurance markets in India are showing clear signs of expansion, requiring insurers
to be innovative in their approach towards achievement of sustainable growth. The
report explores underlying trends in customer awareness levels and their
implications on insurers. An in-depth study was made on the preferences of the
customers on their choices for long term savings.
1 The Journal of Insurance Institute of India, Mumbai, July–December, 2007, p.120.
2 Article in Economic Times “Life insurance companies may get to sell old products under new rules” 7
th January 2013

213
INSURANCE EDUCATION
Consumers today have choices of both products and insurers and are discovering
insurance as a financial product satisfying much more than mere requirement of a
tax saving device. Advancement of technology, media revolution, quality orientation
and intense competition created a dire need of educating the customers. During the
post-liberalisation period, most of the private players entered the insurance market.
This resulted in creating awareness about the significance of insurance to the under-
privileged sections of the society.
The Insurance Institute of India, Mumbai prepared good reading books for insurance
awareness of customers. The Institute has also played an important role in
conducting pre-recruitment examination for insurance agents. Some of the other
institutes and also universities have introduced insurance topics in their curriculum of
graduate and post-graduate courses of both regular and distance education
programmes. The College of Insurance has moved to a leadership position in
insurance education at present. It is a place for research, dissemination of
information and leadership development for the insurance industry. As insurance
awareness in India is very poor, this could be a potential area of activity for both the
College of Insurance and also the Associated Institutes.3
Insurance education is a very important administrative and economic function to any
insurer. It is a tool for managing economic development of the country. The
orientation that insurance education today must seek to develop is a keen
understanding of insurance customers, the benefits they seek and the aspirations
they have of financial products and services, coupled with skills of customer
cultivation, customer service and long-term customer retention. The insurance
3 The Journal of Insurance Institute of India, Mumbai, July–December, 2007, p.120.
214
education ensures the strength, weaknesses, opportunities and threats of various
strategies and reduces the gap between the insurance agent and the policyholder.
The insurance literacy alone can empower consumers to be better insurance
shoppers, allowing them to obtain insurance services at lower cost.
Further, insurance education provides the insured to understand the different
innovative products of the insurers and the associated risks involved therein. The
market efficiency, the transparency and the competitive practices of the insurers are
also made known to the customers through education. It also helps to monitor
insurance market regularly and advises the investors to take decisions judiciously
and efficiently. After liberalization of the insurance sector, many new insurance
players entered the market and put increased emphasis on customer education,
service and finding new and imaginative ways of rendering the same.4
The LIC has been spreading the awareness programme to rural areas through
village panchayats and village servants. The development officers are also working
aggressively for selling insurance products in rural areas. The life insurance agents
are also the real heroes of the insurance sales programmes of these areas. The
IRDA is in touch with the Indian Institutes of Management and Institute of Chartered
Accountant of India to have insurance as a subject in their curriculum. Imparting
training to sales force is not a onetime activity. From time to time, their knowledge is
to be upgraded. The newcomers will get better results only through the right type of
training imparted to them by the insurers. The technology up-gradation training
becomes very important for the survival of agents in this era of competition. The
private players are also introducing innovative insurance products and hence training
is necessary and utmost important to agents. As a result of the changes in family
4 Article In Business Line Chennai, Jan. 30, 2011: ‘Life insurance sector must relook at cost structure”

215
structures and changing attitudes of consumers, customer service is faced with new
challenges with every passing day. Some customers want service to be delivered at
all times. They demand that service is to be delivered to their doorsteps instead of
them having to come to the service delivery points. Customers are quick to switch
loyalties when they get a better deal from a competitive service provider. Any slip-up
on the part of the service provider may cause customers to dump the service
provider and switch over to a new one.86.
FINDINGS OF THE SURVEY
The following are the findings of the primary data survey conducted among
employed persons in and around the City of Mangalore and Dakshina Kannada
District
Table 8.1 - Sex of Respondents
Sex No. of Respondents Percentage Male 71 51% Female 69 49% 140 100
The representation of men and women were almost equal
Table 8.2 Residential Status Residential Status No. of Respondents Percentage Resident in India 140 99% Non resident 1 1% Foreign national 0 0
99% of the respondents were Resident in India who were employed in an around the city of Mangalore.
Table 8.3 Age and Number of Policies
Age__________ No. of Policies
20 - 30 30 - 40 40 - 50 50 - 60 60 &above
0 4 4 4 1 1 1 18 12 3 3 0 2 17 7 5 4 1
3 - 5 9 22 11 4 1 5 - 10 2 3 2 3 0
More than 10 0 1 1 0 0 Source: Insurance Awareness Primary Data Survey - 2010

216
Table 8.4 Correlations of Age Vs Number of Policies
Pearson’s Correlation P value N
Age Vs Number of
policies
0.176 0.019 140
Source: Insurance Awareness Primary Data Survey - 2010
Correlation is significant at the 0.05 level (1-tailed).
1. Ho there is no relationship between age and number of policies. The correlation
between age and number of policy is 0.176 which indicates 17.6% positive
relationship between these variables. P value is 0.019 and is significant at 5%.
Hence. Hypothesis is rejected at 5%. So it is concluded that there is relationship
between age and number of policies.
Table 8.5 - Awareness of mechanism
Awareness of mechanism
of insurance policy
No. of Respondents Percentage
Aware 134 95%
Not aware 7 5%
140 100
Source: Insurance Awareness Primary Data Survey - 2010
Table 8.6 – Annual Income and Number of Policies owned
Annual
Income_
No. of
Policies
Below 2
lakhs
2 – 5 Lakhs 5 – 10
Lakhs
10-20
Lakhs
20 – 50
Lakhs
0 8 1 1 1
1 30 7 0 0 0
2 18 13 2 0 0
3 - 5 14 26 5 1 0
5 - 10 0 6 1 1 0
More than 10 0 3 0 0 0
Source: Insurance Awareness Primary Data Survey - 2010

217
Table 8.9 Correlations of Sources of Revenue and Number of Policies
Pearson’s Correlation P value N Sources of Revenue Vs Number of policies
0.57 0.252 140
Source: Insurance Awareness Primary Data Survey – 2010
Table 8.7Correlations of Number of policies and Annual income
Pearson’s Correlation
P value N
Number of policies Vs Annual Income
0.318 0.000 140
Correlation is significant at the 0.01 level (1-tailed).
Source: Insurance Awareness Primary Data Survey – 2010
2. Ho there is no relationship between income and number of Policies.
The correlation between income and number of policies is 0.318 which
indicates 31.8% positive relationship between these variables p value is
0.000 and is significant at 1%. Hence hypothesis is rejected at 1%. So it
is concluded that there is relationship between income and number of
policies.
Table 8.8 Whether premium paid is worth the benefits
No. of Respondents Percentage Yes 91 64.5% No 46 32% May be 4 3% 140 100
Source: Insurance Awareness Primary Data Survey - 2010
Majority of the respondents were of the opinion that the premium paid for
the policy was well worth the benefits that were assigned them on an
insurance policy.

218
1. Ho there is no relationship between number of policies and source of
revenue and number of policies. The correlation between policy used as source of revenue
and number of policies is 0.057 which indicates 5.7% positive relationship between
these variables p value is 0.252. Hence hypothesis is accepted at 5%. Hence it is
concluded that there is no correlation between number of policies and source of revenue.
2. Chi-Square Test
Frequencies – Table 8.10
Sex of the population and Awareness as means of savings and
financial security
Sex Observed N Awareness Observed N
Male 71 Aware 129
Female 69 Not aware 11
Total 140 Total 140
Source: Insurance Awareness Primary Data Survey - 2010
Table 8.11 Test Statistics
Sex of the
population
Awareness as
means of
savings and
financial
security
Chi-Square .029a 99.457a
df 1 1
P value .866 .000
a. 0 cells (.0%) have expected frequencies
less than 5. The minimum expected cell
frequency is 70.0.
Source: Insurance Awareness Primary Data Survey - 2010
Ho there is no association between sex and awareness about insurance as

219
means of Savings and as financial security. P value is >0.05, hence it is concluded that
there is no association between the gender and awareness about insurance as means
of savings. Hypothesis is accepted at 5% significant level.
Chi-Square Test
Frequencies
Table 8.12 Sex of the population Vs Awareness about
Sum assured
Sex Observed N Awareness Observed N
Male 71 Yes 129
Female 69 No 11
Total 140 Total 140
Source: Insurance Awareness Primary Data Survey - 2010
Table 8.13 Test Statistics
Sex of the population
Awareness about sum assured
Chi-Square .029a 99.457a
df 1 1
P value .866 .000
0 cells (.0%) have expected frequencies less
than 5. The minimum expected cell frequency
is 70.0.
Source: Insurance Awareness Primary Data Survey - 2010
5. Ho there is no association between gender and awareness about sum
assured. Since the P value is >0.05, Ho is accepted at 5% level of significance.
Hence it is concluded that there is no association between gender and
awareness about sum assured.

220
Sex of the population N Mean Std. Deviation
Std. Error Mean
Number of policy Male 71 3.35 1.084 .129
Female 69 2.75 1.168 .141
Source: Insurance Awareness Primary Data Survey – 2010
Table 8.15 Independent Samples Test – Number of Policies and sex of
customer
Levene's Test for Equality of Variances t-test for Equality of Means
F P value t df
P
value
Number of policy Equal
variances
assumed
.753 .387 3.144 138 .002
Equal
variances not
assumed
3.140 136.530 .002
Source: Insurance Awareness Primary Data Survey - 2010
5. Ho there is no significance difference between gender and number of
policies. Since P value is <0.01 null hypothesis is rejected at 1% level of significance.
Hence it is concluded that there is significant difference between gender and
number of policies.
Table 8.16 Independent Samples Test – Necessity to cover risk
Levene's Test for Equality of Variances t-test for Equality of Means
F P value t df P value
Necessity to cover risk
Equal variances assumed
2.535 .114 -.765 138 .446
Equal variances not assumed
-.767 134.884 .444
Table 8.14 Group Statistics – Sex of population

221
6. Ho there is no significance difference between gender and preference for
insurance as a necessity to cover risk. Since the P value is >0.05 , Ho is accepted at 5%
level of significance. Hence it is concluded that there is no significant difference in gender
and preference of LIC as a means to cover risk.
Table 8.17 Independent Samples Test – Benefit for premium paid
Levene's Test for Equality of Variances t-test for Equality of Means
F P value t df P value
Benefit for premium paid
Equal variances assumed
1.555 .215 -.623 138 .534
Equal variances not assumed
-.624 137.958 .534
Source: Insurance Awareness Primary Data Survey - 2010
7. Ho there is no significant difference between gender and opinion
regarding insurance premium paid is worth to cover the risk. Since the P value is >
0.05, null hypothesis is accepted at 5% level of significance. Hence it is concluded
that there is no difference in gender and opinion regarding premium paid
is worth to cover the risk.
Table 8.18 Independent Samples Test – Sources of Revenue
Levene's Test for Equality of Variances t-test for Equality of Means
F P value t df P value
Sources of revenue
Equal variances assumed
11.398 .001 1.664 138 .098
Equal variances not assumed
1.668 135.438 .098
222
Source: Insurance Awareness Primary Data Survey - 2010
Ho there is no significant difference between gender and insurance used as
source of revenue. Since the P value is >0.05, null hypothesis is accepted at 5% level of
significance. Hence it is concluded that there is no difference between gender and
insurance used as source of revenue.
Table 8.19 Preference of Insurance Policies over other instruments of investment
Insurance policies are better than
No. of Respondents Percentage
FD's 30 21% MF 33 25% Gold 8 5% RD's 30 21% NSC 25 18% SB a/c 64 45%
Source: Insurance Awareness Primary Data Survey - 2010
Table 8.20 Necessity of Life insurance products
Rating of life insurance policy
No. of Respondents
Percentage
Very essential 42 30 Essential 95 67 Unnecessary 3 2 Useless 1 1
Source: Insurance Awareness Primary Data Survey - 2010
Conclusions and suggestions
It is very clear from the analysis of the data and the statistical analysis that follows
that the employed public considers life insurance as an effective measure of social
security. Most of the insured public consider that insurance is better than other
investment products and the benefits received on an insurance policy far outweighs
the price paid as premium on the insurance policy. Most of the insured population is
aware of the basic terms, principles and concepts of life insurance. However it was
also found out that a certain percentage of the insured population, though a minority
still is not convinced that life insurance is a good measure of social security. Hence

223
the insurance companies should enhance customer satisfaction and introduce need
based products that enable the customers to derive maximum benefits from an
insurance policy. Further it is absolutely essential for the representatives of the
insurance company explain the product and the benefits and costs of it to the
customer clearly without any ambiguity so as to create more trust and confidence in
the mind of the customer regarding the company that they are dealing with and the
product that they are purchasing. Mis selling of any product at any time should be
avoided on all counts since the contract of insurance operates on uberrimaefidei
(utmost good faith) and this applies not only to the insured but also to the company
which sells the policy. This will ensure that the customers have no grievances with
the insurance company after they have sold the product to the customer.
Ø Analysis of shift of customer preference from Public sector LIC to private Life Insurance companies
DATA COLLECTION AND ANALYSIS AND INTERPRETATION OF DATA
Primary data was obtained from the insured population of 722 respondents who
were policy holders of LIC and ten private companies. The ten private companies
were – SBI Life, ICICI Prudential, Reliance Life, HDFC Life, Bajaj Allianz, Max Life,
Met Life, ING Vysya, Birla Sun life and Tata AIA. Secondary data was obtained from
various IRDA publications, insurance company websites, newspaper articles and
related journals.
The following were the results of the survey of 722 respondents conducted among
policy holders of LIC and ten private companies in various cities of South India and
Mumbai.
Table 8.21 Sex of Respondents Sex No. of Respondents Percentage Male 460 63.7% Female 262 36.3% 722 100

224
Majority of the respondents interviewed were male as they were the bread winners in
most of the cases.
1. Ho there is no association between gender and preference for insurance
sector.
H1There is association between gender and preference for insurance sector.
Table 8.22 Gender of the sample * Preference for public or private sector Cross tabulation
Preference for public or private sector
Total
LIC only Private Private and
LIC
Gender of the sample Male Count 148 42 270 460
Expected Count 156.7 37.6 265.7 460.0
% within Gender of the sample
32.2% 9.1% 58.7% 100.0%
% within Preference for public or private sector
60.2% 71.2% 64.7% 63.7%
% of Total 20.5% 5.8% 37.4% 63.7%
Female Count 98 17 147 262
Expected Count 89.3 21.4 151.3 262.0
% within Gender of the sample
37.4% 6.5% 56.1% 100.0%
% within Preference for public or private sector
39.8% 28.8% 35.3% 36.3%
% of Total 13.6% 2.4% 20.4% 36.3%
Total Count 246 59 417 722
Expected Count 246.0 59.0 417.0 722.0
% within Gender of the sample
34.1% 8.2% 57.8% 100.0%
% within Preference for public or private sector
100.0% 100.0% 100.0% 100.0%
% of Total 34.1% 8.2% 57.8% 100.0%
Source: Customer Preference Primary Data Survey - 2012
Table 8.23 Chi-Square Tests
Value df P value
Pearson Chi-Square 2.960a 2 .228
N of Valid Cases 722
a. 0 cells (.0%) have expected count less than 5. The minimum expected count is 21.41.
Source: Customer Preference Primary Data Survey - 2012 P value is <0.01 so null hypothesis is accepted at 1% significant level. Hence it is
concluded that there is no association between gender and preference for sector
2. Ho There is no association between Marital status and preference for sector
H1 There is an association between Marital status and preference for sector
225
Table 8. 24 Marital status of the population * Preference for public or private sector Cross tabulation
Preference for public or private sector
Total
LIC only Private Private and LIC
Marital status of the population
Single Count 72 39 157 268
Expected Count 91.3 21.9 154.8 268.0
% within Marital status of the population
26.9% 14.6% 58.6% 100.0%
% within Preference for public or private sector
29.3% 66.1% 37.6% 37.1%
% of Total 10.0% 5.4% 21.7% 37.1%
Married Count 168 20 256 444
Expected Count 151.3 36.3 256.4 444.0
% within Marital status of the population
37.8% 4.5% 57.7% 100.0%
% within Preference for public or private sector
68.3% 33.9% 61.4% 61.5%
% of Total 23.3% 2.8% 35.5% 61.5%
Widow/Widower Count 6 0 2 8
Expected Count 2.7 .7 4.6 8.0
% within Marital status of the population
75.0% .0% 25.0% 100.0%
% within Preference for public or private sector
2.4% .0% .5% 1.1%
% of Total .8% .0% .3% 1.1%
Divorced Count 0 0 2 2
Expected Count .7 .2 1.2 2.0
% within Marital status of the population
.0% .0% 100.0% 100.0%
% within Preference for public or private sector
.0% .0% .5% .3%
% of Total .0% .0% .3% .3%
Total Count 246 59 417 722
Expected Count 246.0 59.0 417.0 722.0
% within Marital status of the population
34.1% 8.2% 57.8% 100.0%
% within Preference for public or private sector
100.0% 100.0% 100.0% 100.0%
% of Total 34.1% 8.2% 57.8% 100.0%
Source: Customer Preference Primary Data Survey - 2012
Table 8.25 Chi-Square Tests
Value df P value
Pearson Chi-Square 34.160a 6 .000
N of Valid Cases 722
a. 6 cells (50.0%) have expected count less than 5. The minimum expected count is .16.
Source: Customer Preference Primary Data Survey - 2012
226
P value is <0.01 so null hypothesis is rejected at 1% significant level. Hence it is
concluded that there is a significant association between Marital status and
preference for sector.
3. Ho There is no association between preference for insurance sector and public
perception
H1There is association between preference for sector and public perception
Table 8.26 Public perception * Preference for public or private sector Cross tabulation
Preference for public or private sector
Total
LIC only Private Private and
LIC
Public perception Yes Count 136 40 297 473
Expected Count 161.2 38.7 273.2 473.0
% within Public perception 28.8% 8.5% 62.8% 100.0%
% within Preference for public or private sector
55.3% 67.8% 71.2% 65.5%
% of Total 18.8% 5.5% 41.1% 65.5%
No Count 110 19 120 249
Expected Count 84.8 20.3 143.8 249.0
% within Public perception 44.2% 7.6% 48.2% 100.0%
% within Preference for public or private sector
44.7% 32.2% 28.8% 34.5%
% of Total 15.2% 2.6% 16.6% 34.5%
Total Count 246 59 417 722
Expected Count 246.0 59.0 417.0 722.0
% within Public perception 34.1% 8.2% 57.8% 100.0%
% within Preference for public or private sector
100.0% 100.0% 100.0% 100.0%
% of Total 34.1% 8.2% 57.8% 100.0%
Source: Customer Preference Primary Data Survey - 2012
Table 8.27 Chi-Square Tests
Value df P value
Pearson Chi-Square 17.545a 2 .000
N of Valid Cases 722
a. 0 cells (.0%) have expected count less than 5. The minimum expected count is 20.35.
Source: Customer Preference Primary Data Survey - 2012
P value is <0.01 so null hypothesis is rejected at 1% significant level. Hence it is
concluded that there is association between preference for sector and public
perception about insurance. Study reveals the fact that private insurance companies
have changed the public perception of insurance.

227
4. Ho There is no association between preference for sector and efficiency in
settling the insurance contract
H1 There is association between preference for sector and efficiency in
settling the insurance contract
Table 8.28 Efficiency in closing the contract of Business of private insurance co and LIC * Preference for public or private sector Cross tabulation
Preference for public or private sector
Total
LIC only Private Private and
LIC
Efficiency in closing the contract of Business of private insurance co and LIC
Agree Count 84 36 166 286
Expected Count 97.4 23.4 165.2 286.0
% within Efficiency in closing the contract of Business of private insurance co and LIC
29.4% 12.6% 58.0% 100.0%
% within Preference for public or private sector
34.1% 61.0% 39.8% 39.6%
% of Total 11.6% 5.0% 23.0% 39.6%
Disagree Count 72 14 42 128
Expected Count 43.6 10.5 73.9 128.0
% within Efficiency in closing the contract of Business of pvt insurance co and LIC
56.2% 10.9% 32.8% 100.0%
% within Preference for public or private sector
29.3% 23.7% 10.1% 17.7%
% of Total 10.0% 1.9% 5.8% 17.7%
Partially agree Count 90 9 209 308
Expected Count 104.9 25.2 177.9 308.0
% within Efficiency in closing the contract of Business of pvt insurance co and LIC
29.2% 2.9% 67.9% 100.0%
% within Preference for public or private sector
36.6% 15.3% 50.1% 42.7%
% of Total 12.5% 1.2% 28.9% 42.7%
Total Count 246 59 417 722
Expected Count 246.0 59.0 417.0 722.0
% within Efficiency in closing the contract of Business of pvt insurance co and LIC
34.1% 8.2% 57.8% 100.0%
% within Preference for public or private sector
100.0% 100.0% 100.0% 100.0%
% of Total 34.1% 8.2% 57.8% 100.0%
Source: Customer Preference Primary Data Survey - 2012
Table 8.29 Chi-Square Tests
Value df P value
Pearson Chi-Square 60.104a 4 .000
N of Valid Cases 722
a. 0 cells (.0%) have expected count less than 5. The minimum expected count is 10.46.
Source: Customer Preference Primary Data Survey - 2012

228
P value is <0.01 so null hypothesis is rejected at 1% significant level. Hence it is
concluded that there is association between preference for sector and efficiency in
settling the contract
5. H0 there is no association between preference for sector and formalities at the
time of inception
H1 There is association between preference for sector and formalities at the
time of inception
Table 8.30 Formalities at the time of inception * Preference for public or private sector Cross tabulation
Preference for public or private sector
Total
LIC only Private Private and
LIC
Formalities at the time of inception
Agree Count 84 28 132 244
Expected Count 83.1 19.9 140.9 244.0
% within Formalities at the time of inception
34.4% 11.5% 54.1% 100.0%
% within Preference for public or private sector
34.1% 47.5% 31.7% 33.8%
% of Total 11.6% 3.9% 18.3% 33.8%
Disagree Count 82 15 73 170
Expected Count 57.9 13.9 98.2 170.0
% within Formalities at the time of inception
48.2% 8.8% 42.9% 100.0%
% within Preference for public or private sector
33.3% 25.4% 17.5% 23.5%
% of Total 11.4% 2.1% 10.1% 23.5%
Partially Agree Count 80 16 212 308
Expected Count 104.9 25.2 177.9 308.0
% within Formalities at the time of inception
26.0% 5.2% 68.8% 100.0%
% within Preference for public or private sector
32.5% 27.1% 50.8% 42.7%
% of Total 11.1% 2.2% 29.4% 42.7%
Total Count 246 59 417 722
Expected Count 246.0 59.0 417.0 722.0
% within Formalities at the time of inception
34.1% 8.2% 57.8% 100.0%
% within Preference for public or private sector
100.0% 100.0% 100.0% 100.0%
% of Total 34.1% 8.2% 57.8% 100.0%
Source: Customer Preference Primary Data Survey – 2012
Table 8.31 Chi-Square Tests
Value df P value
Pearson Chi-Square 36.200a 4 .000
N of Valid Cases 722
a. 0 cells (.0%) have expected count less than 5. The minimum expected count is 13.89.
Source: Customer Preference Primary Data Survey - 2012

229
P value is <0.01 so null hypothesis is rejected at 1% significant level. Hence it is
concluded that there is association between preference for sector and formalities at
the time of processing the contract. Shift in the preference is found mainly due to this
reason.
6. H0 there is no association between preference for sector and need based and
flexibility offered
H1 there is association between preference for sector and need based and
flexibility offered
Table 8.32 Need based and flexibility of private insurance products over LIC * Preference for public or private sector Cross tabulation
Preference for public or private sector
Total
LIC only Private Private and
LIC
Need based and flexibility of private insurance products over LIC
yes Count 60 26 124 210
Expected Count 71.6 17.2 121.3 210.0
% within Need based and flexibility of pvt insurance products over LIC
28.6% 12.4% 59.0% 100.0%
% within Preference for public or private sector
24.4% 44.1% 29.7% 29.1%
% of Total 8.3% 3.6% 17.2% 29.1%
no Count 84 14 56 154
Expected Count 52.5 12.6 88.9 154.0
% within Need based and flexibility of pvt insurance products over LIC
54.5% 9.1% 36.4% 100.0%
% within Preference for public or private sector
34.1% 23.7% 13.4% 21.3%
% of Total 11.6% 1.9% 7.8% 21.3%
somewhat Count 102 19 237 358
Expected Count 122.0 29.3 206.8 358.0
% within Need based and flexibility of pvt insurance products over LIC
28.5% 5.3% 66.2% 100.0%
% within Preference for public or private sector
41.5% 32.2% 56.8% 49.6%
% of Total 14.1% 2.6% 32.8% 49.6%
Total Count 246 59 417 722
Expected Count 246.0 59.0 417.0 722.0
% within Need based and flexibility of pvt insurance products over LIC
34.1% 8.2% 57.8% 100.0%
% within Preference for public or private sector
100.0% 100.0% 100.0% 100.0%
Source: Customer Preference Primary Data Survey - 2012

230
Table 8.33 Chi-Square Tests
Value df P value
Pearson Chi-Square 49.073a 4 .000
N of Valid Cases 722
a. 0 cells (.0%) have expected count less than 5. The minimum expected count is 12.58.
Source: Customer Preference Primary Data Survey - 2012
P value is <0.01 so null hypothesis is rejected at 1% significant level. Hence it is
concluded that there is association between preferences for sector need based
product and flexibility offered.
7. H0 there is no association between preference for sector and superiority of
product
H1 there is association between preference for sector and superiority of
product
Source: Customer Preference Primary Data Survey - 2012
Table 8.35Chi-Square Tests
Value df P value
Pearson Chi-Square 29.881a 8 .000
N of Valid Cases 722
a. 2 cells (13.3%) have expected count less than 5. The minimum expected count is .82.
Source: Customer Preference Primary Data Survey - 2012
P value is <0.01 so null hypothesis is rejected at 1% significant level. Hence it is
concluded that there is association between preference for sector and superiority of
product.
8. H0 There is no association between sector and choice to customer in terms of
product and service
H1 There is association between sector and choice to customer in terms of
product and service
Table 8.34 Preference for public or private sector * Private company products are superior to those offered by LIC Cross tabulation
Count
Private company products are superior to those offered by LIC
Total
Highly professional
services Huge
savings Excellent returns High life cover Any other
Preference for public or private sector
LIC only 97 96 26 21 6 246
Private 29 17 10 1 2 59
Private and LIC
160 117 86 52 2 417
Total 286 230 122 74 10 722

231
Table 8.36 Preference for public or private sector * Arrival of private companies have given varied choice to customers in terms of products and services Cross tabulation
Count
Arrival of private companies have given varied choice to customers in terms of products and services
Total Agree Disagree
Preference for public or private sector
LIC only 185 61 246
Private 44 15 59
Private and LIC 374 43 417
Total 603 119 722
Source: Customer Preference Primary Data Survey - 2012
Source: Customer Preference Primary Data Survey - 2012
P value is <0.01 so null hypothesis is rejected at 1% significant level. Hence it is concluded
that there is association between preference for sector and quality product
9. H0 There is no association between preference for sector and objective of buying policy
H1 There is association between preference for sector and objective of buying policy
Table 8.38 Preference for public or private sector * Objective of buying policy Cross tabulation
Count
Objective of buying policy
Total
life cover Investment for
pension
Investment for Children education Tax benefits
Agents persuasion
Preference for public or private sector
LIC only 162 31 14 26 13 246
Private 34 2 7 14 2 59
Private and LIC 186 50 68 84 29 417
Total 382 83 89 124 44 722
Source: Customer Preference Primary Data Survey - 2012
Table 8.39 Chi-Square Tests
Value df P value
Pearson Chi-Square 42.699a 8 .000
N of Valid Cases 722
a. 1 cells (6.7%) have expected count less than 5. The minimum expected count is 3.60.
Source: Customer Preference Primary Data Survey – 2012
Table 8.37 Chi-Square Tests
Value df P value
Pearson Chi-Square 27.315a 2 .000
N of Valid Cases 722
a. 0 cells (.0%) have expected count less than 5. The minimum expected count is 9.72.
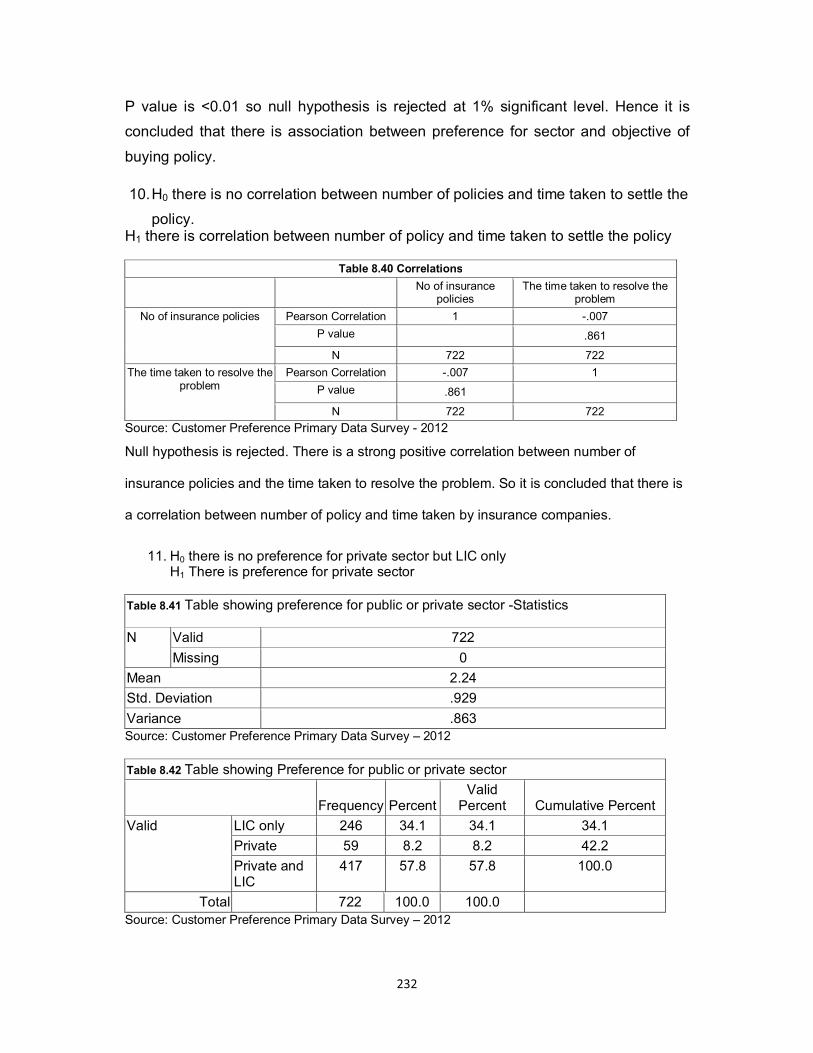
232
P value is <0.01 so null hypothesis is rejected at 1% significant level. Hence it is
concluded that there is association between preference for sector and objective of
buying policy.
10. H0 there is no correlation between number of policies and time taken to settle the
policy. H1 there is correlation between number of policy and time taken to settle the policy
Table 8.40 Correlations
No of insurance policies
The time taken to resolve the problem
No of insurance policies Pearson Correlation 1 -.007
P value .861
N 722 722
The time taken to resolve the problem
Pearson Correlation -.007 1
P value .861
N 722 722
Source: Customer Preference Primary Data Survey - 2012
Null hypothesis is rejected. There is a strong positive correlation between number of
insurance policies and the time taken to resolve the problem. So it is concluded that there is
a correlation between number of policy and time taken by insurance companies.
11. H0 there is no preference for private sector but LIC only H1 There is preference for private sector
Table 8.41 Table showing preference for public or private sector -Statistics
N Valid 722
Missing 0
Mean 2.24
Std. Deviation .929
Variance .863 Source: Customer Preference Primary Data Survey – 2012
Table 8.42 Table showing Preference for public or private sector
Frequency Percent
Valid Percent Cumulative Percent
Valid LIC only 246 34.1 34.1 34.1
Private 59 8.2 8.2 42.2
Private and LIC
417 57.8 57.8 100.0
Total 722 100.0 100.0
Source: Customer Preference Primary Data Survey – 2012

233
Table 8.43 Table showing preference for private over public
Preference for public or private sector
Observed N Expected N Residual
LIC only 246 240.7 5.3
Private 59 240.7 -181.7
Private and LIC
417 240.7 176.3
Total 722
Source: Customer Preference Primary Data Survey - 2012
Table 8.44 Table showing Test statistics for preference of private over public
Preference for public or private sector
Chi-Square 266.446a
df 2
P value .000
a. 0 cells (.0%) have expected frequencies less than 5. The minimum expected cell frequency is 240.7.
Source: Customer Preference Primary Data Survey - 2012
P value is <0.01 so null hypothesis is rejected at 1% significant level. Hence it is concluded
that there is preference for private sector and not LIC only.
12. H0 All companies have equal credibility due to government assurance H1 LIC has more credibility due to government assurance
Table 8.45 Table showing credibility of LIC due to Government assurance - Statistics
N Valid 722
Missing 0
Mean 1.39
Std. Deviation .489
Variance .239 Source: Customer Preference Primary Data Survey - 2012

234
Table 8.46 Table showing credibility due to government assurance
Frequency Percent Valid Percent Cumulative Percent
Valid Yes 437 60.5 60.5 60.5
No 285 39.5 39.5 100.0
Total 722 100.0 100.0
Source: Customer Preference Primary Data Survey - 2012
Source: Customer Preference Primary Data Survey - 2012
Table 8.48 Table showing Test Statistics of Credibility of LIC
Credibility due to govt assurance
Chi-Square 32.000a
df 1
P value .000
a. 0 cells (.0%) have expected frequencies less than 5. The minimum expected cell frequency is 240.7.
Source: Customer Preference Primary Data Survey - 2012
P value is <0.01 so null hypothesis is rejected at 1% significant level. Hence it is concluded
that all companies have equal credibility due to Government assurance.
13. H0 Private companies’ products are not more need based and flexible when
compared to LIC
H1 Private Companies products are more need based and flexible when compared to
LIC
Table 8.47 Table showing credibility of LIC due to Government assurance
Credibility due to government assurance
Observed N Expected N Residual
Yes 437 361.0 76.0
No 285 361.0 -76.0
Total 722

235
Table 8.49 Table showing statistics of need based and flexibility of private company insurance products
N Valid 722
Missing 0
Mean 2.20
Std. Deviation .864
Variance .746 Source: Customer Preference Primary Data Survey - 2012
Table 8.50 Table showing need based and flexibility of private insurance products over LIC
Frequency Percent Valid Percent
Cumulative Percent
Valid Yes 210 29.1 29.1 29.1
No 154 21.3 21.3 50.4
Somewhat 358 49.6 49.6 100.0
Total 722 100.0 100.0 Source: Customer Preference Primary Data Survey - 2012
Table 8.51 Table showing Need based and flexibility of private insurance products over LIC
Observed N Expected N Residual
Yes 210 240.7 -30.7
No 154 240.7 -86.7
Somewhat 358 240.7 117.3
Total 722
Source: Customer Preference Primary Data Survey – 2012
Table 8.52 Table showing Test statistics of Need based and flexibility of private companies products over LIC
Need based and flexibility of private insurance products over LIC
Chi-Square 92.321b
df 2
P value .000
b. 0 cells (.0%) have expected frequencies less than 5. The minimum expected cell frequency is 240.7.
Source: Customer Preference Primary Data Survey - 2012
236
P value is <0.01 so null hypothesis is rejected at 1% significant level. Hence it is concluded
that .Private companies’ products are more need based and flexible when compared to LIC
14. H0 There is no significant difference in the efficiency of private companies in closing
the contract of business when compared to LIC
H1 There is significant difference in the efficiency of private companies in closing the contract
of business when compared to LIC
Table 8.53 Table showing Statistics of efficiency in closing the contract by private
insurance companies over LIC
N Valid 722
Missing 0
Mean 2.03
Std. Deviation .907
Variance .823 Source: Customer Preference Primary Data Survey - 2012
Table 8.54 Table showing efficiency in closing the contract of Business of
private insurance company and LIC
Frequency Percent Valid Percent
Cumulative
Percent
Valid Agree 286 39.6 39.6 39.6
Disagree 128 17.7 17.7 57.3
Partially agree 308 42.7 42.7 100.0
Total 722 100.0 100.0
Source: Customer Preference Primary Data Survey - 2012
Table 8.55 Table showing efficiency in closing the
contract of business of private insurance
companies
Efficiency in closing the contract of Business of
private insurance co and LIC
Observed N Expected N Residual
Agree 286 240.7 45.3
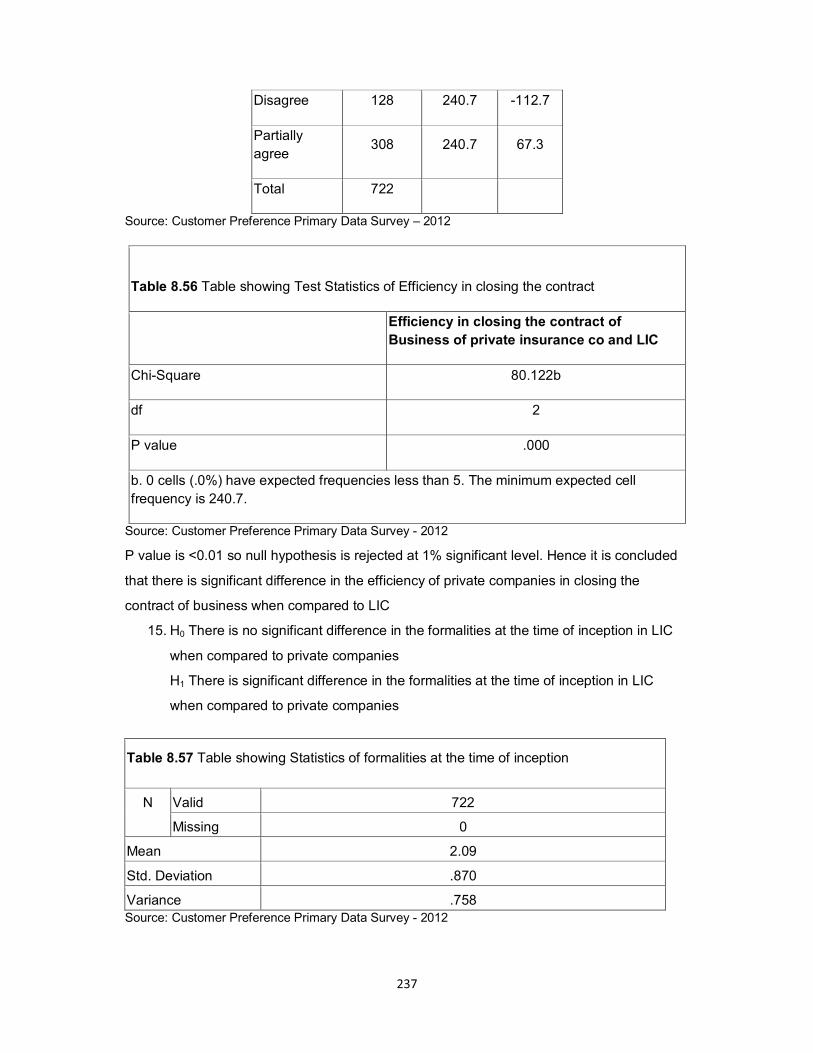
237
Disagree 128 240.7 -112.7
Partially
agree 308 240.7 67.3
Total 722
Source: Customer Preference Primary Data Survey – 2012
Table 8.56 Table showing Test Statistics of Efficiency in closing the contract
Efficiency in closing the contract of
Business of private insurance co and LIC
Chi-Square 80.122b
df 2
P value .000
b. 0 cells (.0%) have expected frequencies less than 5. The minimum expected cell
frequency is 240.7.
Source: Customer Preference Primary Data Survey - 2012
P value is <0.01 so null hypothesis is rejected at 1% significant level. Hence it is concluded
that there is significant difference in the efficiency of private companies in closing the
contract of business when compared to LIC
15. H0 There is no significant difference in the formalities at the time of inception in LIC
when compared to private companies
H1 There is significant difference in the formalities at the time of inception in LIC
when compared to private companies
Table 8.57 Table showing Statistics of formalities at the time of inception
N Valid 722
Missing 0
Mean 2.09
Std. Deviation .870
Variance .758 Source: Customer Preference Primary Data Survey - 2012

238
Table 8.58 Table showing formalities at the time of inception
Frequency Percent Valid Percent
Cumulative
Percent
Valid Agree 244 33.8 33.8 33.8
Disagree 170 23.5 23.5 57.3
Partially
Agree
308 42.7 42.7 100.0
Total 722 100.0 100.0
Source: Customer Preference Primary Data Survey - 2012
Table 8.59 Table showing formalities at the time of inception
Formalities at the time of inception
Observed N Expected N Residual
Agree 244 240.7 3.3
Disagree 170 240.7 -70.7
Partially Agree 308 240.7 67.3
Total 722
Source: Customer Preference Primary Data Survey - 2012
Source: Customer Preference Primary Data Survey - 2012
P value is <0.01 so null hypothesis is rejected at 1% significant level. Hence it is concluded
that there is significant difference in the formalities at the time of inception in LIC when
compared to private companies
Table 8.60 Table showing Test statistics of Test Statistics don formalities at the time of
inception
Formalities at the time of inception
Chi-Square 39.634b
df 2
P value .000
b. 0 cells (.0%) have expected frequencies less than 5. The minimum expected cell
frequency is 240.7.

239
16. H0 Private companies have not changed public perception of insurance
H1 Private Companies have changed public perception of insurance
Table 8.61 Table showing statistics on change in public perception
N Valid 722
Missing 0
Mean 1.34
Std. Deviation .476
Variance .226 Source: Customer Preference Primary Data Survey - 2012
Table 8.62 Table showing change in public perception
Public perception
Frequency Percent Valid Percent
Cumulative
Percent
Valid Yes 473 65.5 65.5 65.5
No 249 34.5 34.5 100.0
Total 722 100.0 100.0
Source: Customer Preference Primary Data Survey - 2012
Table 8.63 Public perception
Observed N Expected N Residual
Yes 473 361.0 112.0
No 249 361.0 -112.0
Total 722
Source: Customer Preference Primary Data Survey - 2012
Table 8.64 Table showing Test Statistics on public perception
Test Statistics
Public perception
Chi-Square 69.496a
df 1

240
P value .000
a. 0 cells (.0%) have expected frequencies less than 5. The minimum expected cell
frequency is 240.7.
Source: Customer Preference Primary Data Survey - 2012
P value is <0.01 so null hypothesis is rejected at 1% significant level. Hence concluded that
Public perception has shifted towards private companies
17. Ho Monopoly position of LIC put the customer at a disadvantage
H1 Monopoly position of LIC did not put the customer at a disadvantage
Table 8.65 Table showing statistics with regard to Monopoly position of LIC
N Valid 722
Missing 0
Mean 1.49
Std. Deviation .500
Variance .250 Source: Customer Preference Primary Data Survey - 2012
Table 8.66 Table showing Test statistics of monopoly position of
LIC put the customer at disadvantage
Frequency Percent Valid Percent
Cumulative
Percent
Valid Yes 366 50.7 50.7 50.7
No 356 49.3 49.3 100.0
Total 722 100.0 100.0
Source: Customer Preference Primary Data Survey - 2012
Table 8.67 Table showing disadvantage of
Monopoly position of LIC
Observed N Expected N Residual
Yes 366 361.0 5.0
No 356 361.0 -5.0
Total 722
Source: Customer Preference Primary Data Survey - 2012

241
Table 8.68 Table showing Test Statistics on Monopoly position of LIC putting customer at a disadvantage
Monopoly position of LIC put the customer at disadvantage
Chi-Square .139a
df 1
P value .710
a. 0 cells (.0%) have expected frequencies less than 5. The minimum expected cell frequency is 240.7.
Source: Customer Preference Primary Data Survey - 2012
P value is >0.01 so null hypothesis is accepted at 1% significant level. Hence it is concluded
Monopoly position of LIC did not put the customer at a disadvantage
18. H0 Arrival of private companies have not given varied choice to customers in terms of
products and services
H1 Arrival of private companies have not given any additional varied choice to
customers in terms of products and services
Table 8.69 Table showing Test Statistics on whether arrival of private
companies have given varied choice to customers
N Valid 722
Missing 0
Mean 1.16
Std. Deviation .371
Variance .138 Source: Customer Preference Primary Data Survey - 2012
Source: Customer Preference Primary Data Survey - 2012
Table 8.70 Table showing opinion on arrival of private companies have given
varied choice to customers in terms of products and services
Frequency Percent Valid Percent
Cumulative
Percent
Valid Agree 603 83.5 83.5 83.5
Disagree 119 16.5 16.5 100.0
Total 722 100.0 100.0

242
Table 8.71 Table showing public opinion on
arrival of private companies
Arrival of private companies have given
varied choice to customers in terms of
products and services
Observed N Expected N Residual
Agree 603 361.0 242.0
Disagree 119 361.0 -242.0
Total 722
Source: Customer Preference Primary Data Survey - 2012
Table 8.72 Table showing Test statistics on arrival of private companies have given varied
choice to customers in terms of products and services
Arrival of pvt companies have given varied
choice to customers in terms of products
and services
Chi-Square 324.454a
df 1
P value .000
a. 0 cells (.0%) have expected frequencies less than 5. The minimum expected cell
frequency is 240.7.
Source: Customer Preference Primary Data Survey - 2012
P value is <0.01 so alternative hypothesis is accepted at 1% significant level. Hence it is
concluded that arrival of private companies have given varied choice to customers in terms
of products and services
19. Ho Customers preferences has not shifted from LIC towards Private insurance
companies
H1 Customers preference has shifted from LIC towards private insurance companies

243
Table 8.73 Table showing Statistics of customer preference shift from pubic to private
Customers preferences has shifted from LIC towards Private insurance
N Valid 722
Missing 0
Mean 2.27
Std. Deviation .859
Variance .737 Source: Customer Preference Primary Data Survey - 2012
Table 8.74 Table showing customers preferences shifted from LIC towards
Private insurance
Frequency Percent Valid Percent
Cumulative
Percent
Valid Yes 194 26.9 26.9 26.9
No 136 18.8 18.8 45.7
To a certain
extent
392 54.3 54.3 100.0
Total 722 100.0 100.0
Source: Customer Preference Primary Data Survey - 2012
Table 8.75 Table showing customer preference shift from Public to Private
sector
Customers preferences has shifted from LIC towards Pvt insurance
Observed N Expected N Residual
Yes 194 240.7 -46.7
No 136 240.7 -104.7
To a certain extent 392 240.7 151.3
Total 722
Source: Customer Preference Primary Data Survey - 2012
Table 8.76 Table showing customer preference shift from Public to Private sector.
Customers preferences has shifted from LIC
towards Private insurance companies

244
Chi-Square 149.729b
df 2
P value .000
b. 0 cells (.0%) have expected frequencies less than 5. The minimum expected cell
frequency is 240.7.
Source: Customer Preference Primary Data Survey - 2012
P value is <0.01 so alternative hypothesis is accepted at 1% significant level. Hence it is
concluded that Customers preference has shifted from LIC towards private insurance
companies
20. Ho LIC was not unsuccessful in reaching the insurance market before the arrival of
private companies H1 LIC was unsuccessful in reaching the insurance market before the arrival of private companies
Table 8.77 Table showing Statistics of coverage of Insurance markets before year 2000
N Valid 722
Missing 0
Mean 1.46
Std. Deviation .498
Variance .249
Source: Customer Preference Primary Data Survey - 2012
Table 8.78 Table showing coverage of Insurance markets before year 2000
Frequency Percent Valid Percent Cumulative Percent
Valid Yes 392 54.3 54.3 54.3
No 330 45.7 45.7 100.0
Total 722 100.0 100.0
Source: Customer Preference Primary Data Survey - 2012

245
Table 8.79 Table showing coverage of
Insurance markets before year 2000 –
Test statistics
The coverage of insurance markets
earlier to 2000 less than 20%
Observed N Expected N Residual
Yes 392 361.0 31.0
No 330 361.0 -31.0
Total 722
Source: Customer Preference Primary Data Survey - 2012
Table 8.80 Table showing coverage of Insurance markets before year 2000
Test Statistics
The coverage of insurance markets earlier to
2000 less than 20%
Chi-Square 5.324a
df 1
P value .021
a. 0 cells (.0%) have expected frequencies less than 5. The minimum expected cell
frequency is 240.7.
Source: Customer Preference Primary Data Survey – 2012
P value is <0.05 so alternative hypothesis is accepted at 5% significant level. Hence it is
concluded that LIC was unsuccessful in reaching the insurance market before the arrival of
private companies
21. Ho LIC does not have more pending claim cases when compared to private
companies
H1 LIC has more pending claim cases when compared to private companies

246
Table 8.81 Table showing More pending settlement cases in LIC than private sector
Statistics
More pending settlement compared to private insurance co
N Valid 722
Missing 0
Mean 1.63
Std. Deviation .484
Variance .234 Source: Customer Preference Primary Data Survey - 2012
Table 8.82 Table showing pending cases in LIC
more pending settlement compared to pvt insurance co
Frequency Percent Valid Percent
Cumulative
Percent
Valid Yes 270 37.4 37.4 37.4
No 452 62.6 62.6 100.0
Total 722 100.0 100.0
Source: Customer Preference Primary Data Survey - 2012
Source: Customer Preference Primary Data Survey - 2012
Table 8.83 Table showing Statistics on
pending cases in LIC whether there is any
change
More pending settlement compared to
private insurance co
Observed N Expected N Residual
Yes 270 361.0 -91.0
No 452 361.0 91.0
Total 722
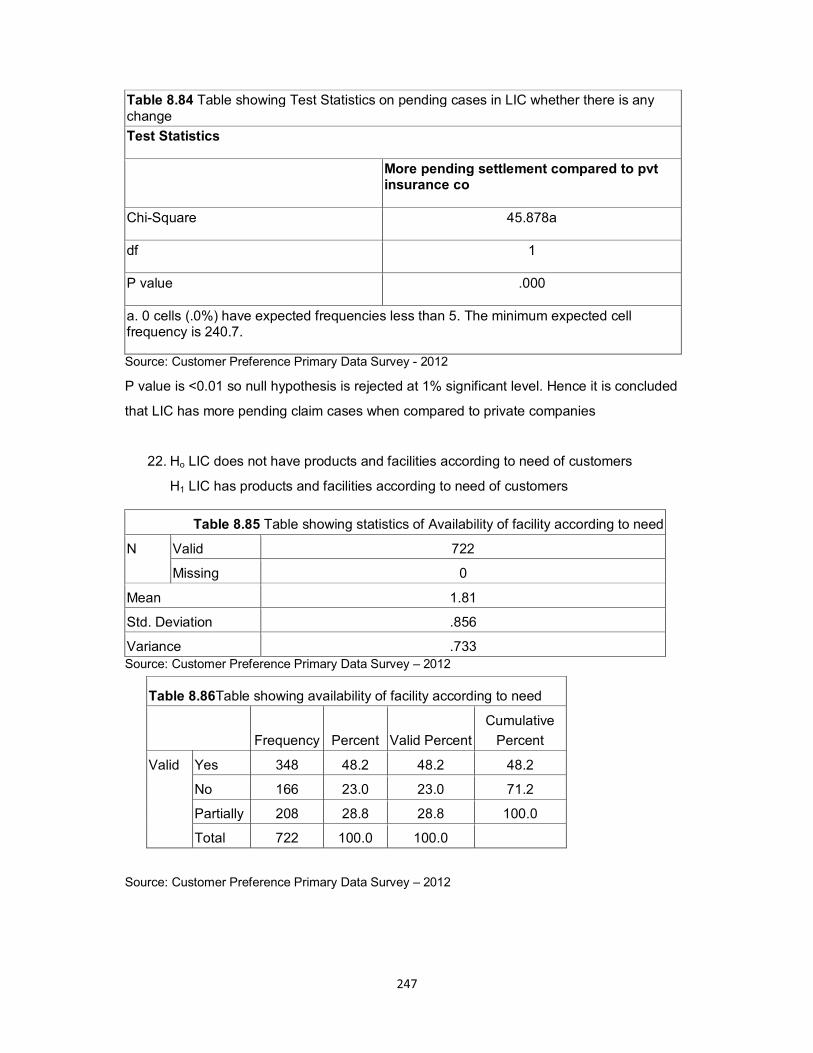
247
Table 8.84 Table showing Test Statistics on pending cases in LIC whether there is any change
Test Statistics
More pending settlement compared to pvt insurance co
Chi-Square 45.878a
df 1
P value .000
a. 0 cells (.0%) have expected frequencies less than 5. The minimum expected cell frequency is 240.7.
Source: Customer Preference Primary Data Survey - 2012
P value is <0.01 so null hypothesis is rejected at 1% significant level. Hence it is concluded
that LIC has more pending claim cases when compared to private companies
22. Ho LIC does not have products and facilities according to need of customers
H1 LIC has products and facilities according to need of customers
Table 8.85 Table showing statistics of Availability of facility according to need
N Valid 722
Missing 0
Mean 1.81
Std. Deviation .856
Variance .733 Source: Customer Preference Primary Data Survey – 2012
Source: Customer Preference Primary Data Survey – 2012
Table 8.86Table showing availability of facility according to need
Frequency Percent Valid Percent
Cumulative
Percent
Valid Yes 348 48.2 48.2 48.2
No 166 23.0 23.0 71.2
Partially 208 28.8 28.8 100.0
Total 722 100.0 100.0
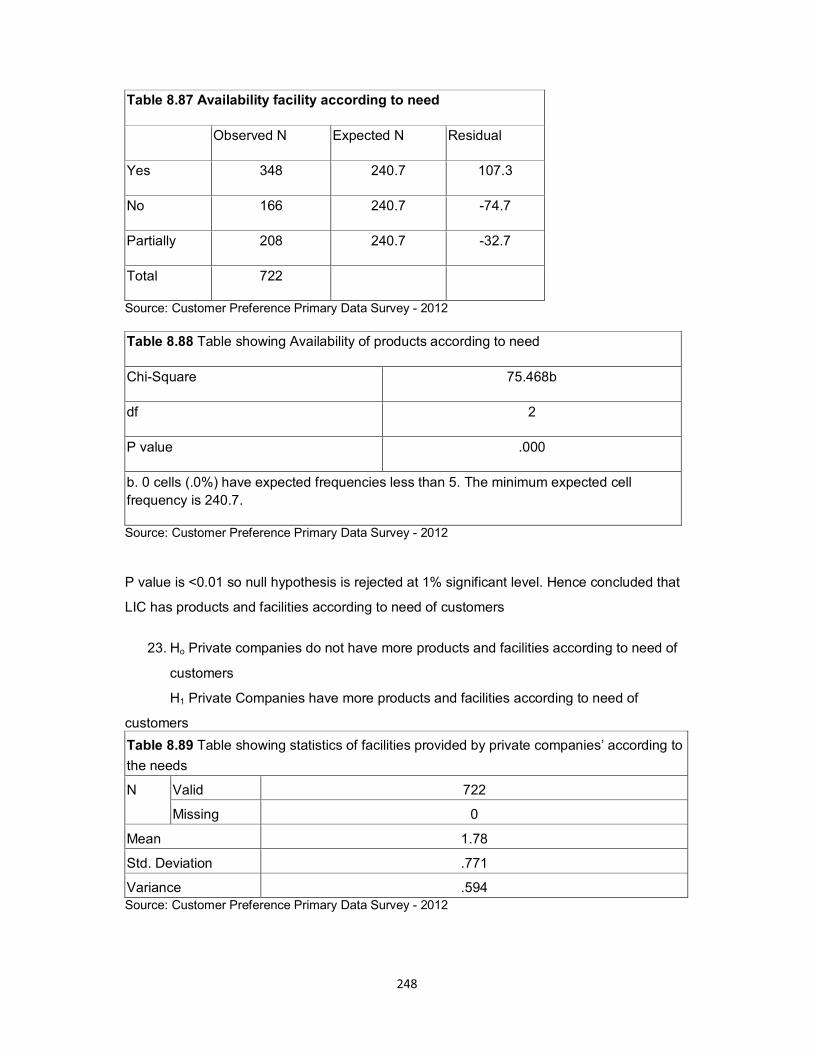
248
Table 8.87 Availability facility according to need
Observed N Expected N Residual
Yes 348 240.7 107.3
No 166 240.7 -74.7
Partially 208 240.7 -32.7
Total 722
Source: Customer Preference Primary Data Survey - 2012
Table 8.88 Table showing Availability of products according to need
Chi-Square 75.468b
df 2
P value .000
b. 0 cells (.0%) have expected frequencies less than 5. The minimum expected cell
frequency is 240.7.
Source: Customer Preference Primary Data Survey - 2012
P value is <0.01 so null hypothesis is rejected at 1% significant level. Hence concluded that
LIC has products and facilities according to need of customers
23. Ho Private companies do not have more products and facilities according to need of
customers
H1 Private Companies have more products and facilities according to need of
customers
Table 8.89 Table showing statistics of facilities provided by private companies’ according to
the needs
N Valid 722
Missing 0
Mean 1.78
Std. Deviation .771
Variance .594 Source: Customer Preference Primary Data Survey - 2012
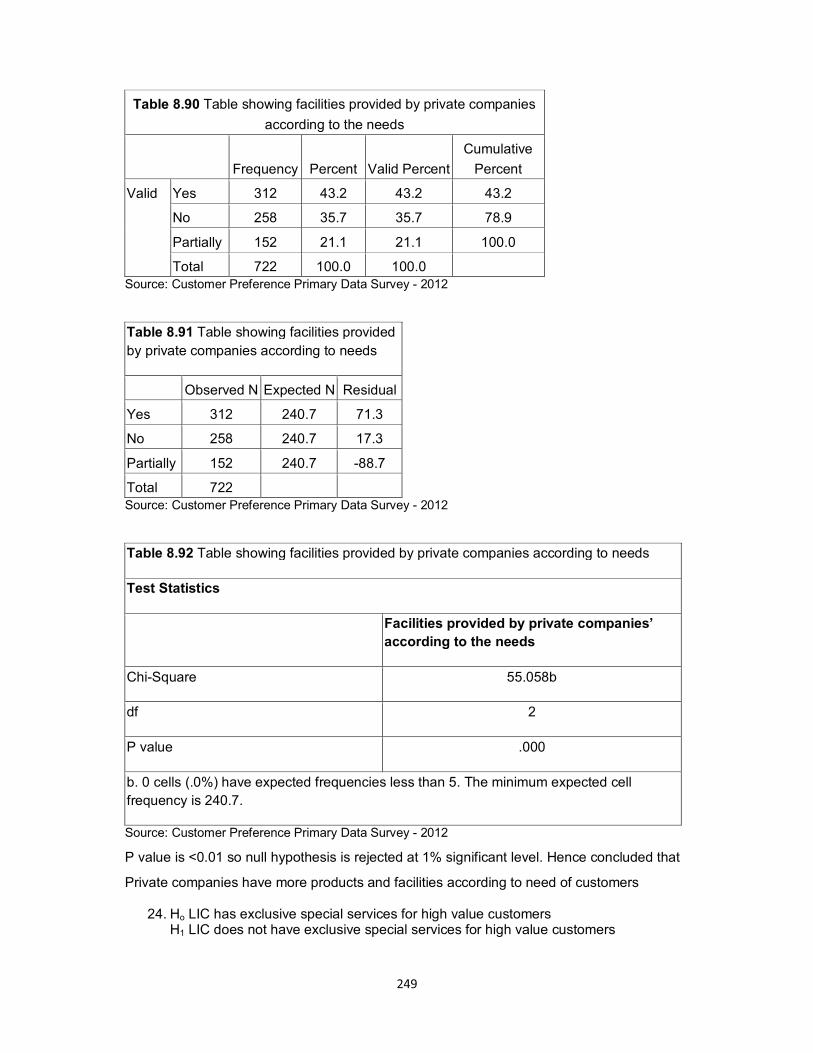
249
Table 8.90 Table showing facilities provided by private companies
according to the needs
Frequency Percent Valid Percent
Cumulative
Percent
Valid Yes 312 43.2 43.2 43.2
No 258 35.7 35.7 78.9
Partially 152 21.1 21.1 100.0
Total 722 100.0 100.0
Source: Customer Preference Primary Data Survey - 2012
Table 8.91 Table showing facilities provided
by private companies according to needs
Observed N Expected N Residual
Yes 312 240.7 71.3
No 258 240.7 17.3
Partially 152 240.7 -88.7
Total 722
Source: Customer Preference Primary Data Survey - 2012
Table 8.92 Table showing facilities provided by private companies according to needs
Test Statistics
Facilities provided by private companies’
according to the needs
Chi-Square 55.058b
df 2
P value .000
b. 0 cells (.0%) have expected frequencies less than 5. The minimum expected cell
frequency is 240.7.
Source: Customer Preference Primary Data Survey - 2012
P value is <0.01 so null hypothesis is rejected at 1% significant level. Hence concluded that
Private companies have more products and facilities according to need of customers
24. Ho LIC has exclusive special services for high value customers H1 LIC does not have exclusive special services for high value customers

250
Table 8.93 Table showing Statistics for exclusive special services for high value LIC
customers
N Valid 722
Missing 0
Mean 2.05
Std. Deviation .656
Variance .430 Source: Customer Preference Primary Data Survey - 2012
Table 8.94 Table showing special services for high value LIC customers
Exclusive special services for high value LIC customers
Frequency Percent Valid Percent
Cumulative Percent
Valid Yes 138 19.1 19.1 19.1
No 410 56.8 56.8 75.9
Partially 174 24.1 24.1 100.0
Total 722 100.0 100.0 Source: Customer Preference Primary Data Survey – 2012
Table 8.95 Table showing special services
for high value LIC customers
Observed N Expected N Residual
Yes 138 240.7 -102.7
No 410 240.7 169.3
Partially 174 240.7 -66.7
Total 722
Source: Customer Preference Primary Data Survey - 2012
Table 8.96 Table showing Test Statistics of Exclusive special services for high value LIC customers
Exclusive special services for high value LIC customers
Chi-Square 181.407b
df 2

251
P value .000
b. 0 cells (.0%) have expected frequencies less than 5. The minimum expected cell frequency is 240.7.
Source: Customer Preference Primary Data Survey - 2012
P value is <0.01 so null hypothesis is rejected at 1% significant level. Hence concluded that LIC does not have exclusive special services for high value customers
25. Ho Private companies have exclusive special services for high value customers H1 Private companies do not have exclusive special services for high value customers
Table 8.97 Table showing Exclusive services for high value private insurance
companies
N Valid 722
Missing 0
Mean 2.04
Std. Deviation .655
Variance .429 Source: Customer Preference Primary Data Survey - 2012
Table 8.98 Table showing Exclusive services for high value private insurance companies
Frequency Percent Valid Percent
Cumulative Percent
Valid Yes 142 19.7 19.7 19.7
No 412 57.1 57.1 76.7
Partially 168 23.3 23.3 100.0
Total 722 100.0 100.0 Source: Customer Preference Primary Data Survey - 2012
Table 8.99 Table showing Exclusive services for high value
private insurance companies
Observed N Expected N Residual
Yes 142 240.7 -98.7
No 412 240.7 171.3
Partially 168 240.7 -72.7
Total 722
Source: Customer Preference Primary Data Survey - 2012
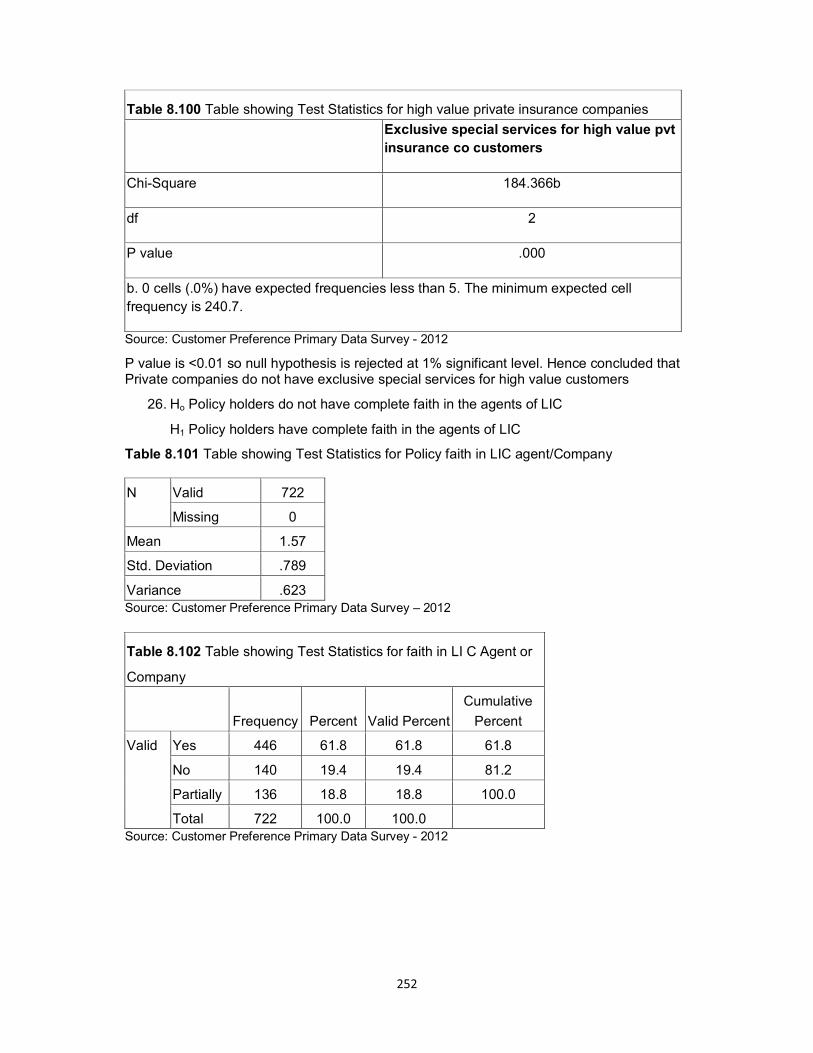
252
Table 8.100 Table showing Test Statistics for high value private insurance companies
Exclusive special services for high value pvt
insurance co customers
Chi-Square 184.366b
df 2
P value .000
b. 0 cells (.0%) have expected frequencies less than 5. The minimum expected cell
frequency is 240.7.
Source: Customer Preference Primary Data Survey - 2012
P value is <0.01 so null hypothesis is rejected at 1% significant level. Hence concluded that Private companies do not have exclusive special services for high value customers
26. Ho Policy holders do not have complete faith in the agents of LIC
H1 Policy holders have complete faith in the agents of LIC
Table 8.101 Table showing Test Statistics for Policy faith in LIC agent/Company
N Valid 722
Missing 0
Mean 1.57
Std. Deviation .789
Variance .623 Source: Customer Preference Primary Data Survey – 2012
Table 8.102 Table showing Test Statistics for faith in LI C Agent or
Company
Frequency Percent Valid Percent
Cumulative
Percent
Valid Yes 446 61.8 61.8 61.8
No 140 19.4 19.4 81.2
Partially 136 18.8 18.8 100.0
Total 722 100.0 100.0
Source: Customer Preference Primary Data Survey - 2012

253
Table 8.103 Table showing policy holders
faith in LIC Agent or Company
Observed N Expected N Residual
Yes 446 240.7 205.3
No 140 240.7 -100.7
Partially 136 240.7 -104.7
Total 722
Source: Customer Preference Primary Data Survey - 2012
Table 8.104 Table showing Test Statistics of faith in LI C Agent or Company
Test Statistics
Policy holders faithfulness LIC insurance
agent/ insurance co
Chi-Square 262.814b
df 2
P value .000
b. 0 cells (.0%) have expected frequencies less than 5. The minimum expected cell
frequency is 240.7.
Source: Customer Preference Primary Data Survey - 2012
P value is <0.01 so null hypothesis is rejected at 1% significant level. Hence it is concluded
that Policy holders have complete faith in the agents of LIC
27. Ho Policy holders do not have complete faith in the agents of Private Companies
H1 Policy holders have complete faith in the agents of Private Companies
Table 8.105 Table showing Test Statistics of faith in Private sector Agent or Company
N Valid 722
Missing 0
Mean 1.82
Std. Deviation .745
Variance .555 Source: Customer Preference Primary Data Survey - 2012

254
Table 8.106 Table showing faith in Private sector Agent or
Company by Policy holders
Frequency Percent Valid Percent
Cumulative
Percent
Valid Yes 278 38.5 38.5 38.5
No 298 41.3 41.3 79.8
Partially 146 20.2 20.2 100.0
Total 722 100.0 100.0
Source: Customer Preference Primary Data Survey - 2012
Table 8.107 Table showing faith in Private
sector Agent or Company by Policy holders
Observed N Expected N Residual
Yes 278 240.7 37.3
No 298 240.7 57.3
Partially 146 240.7 -94.7
Total 722
Source: Customer Preference Primary Data Survey - 2012
Table 8.108 Table showing Test Statistics of faith in Private sector Agent or Company by
Policy holders
Chi-Square 56.687b
df 2
P value .000
b. 0 cells (.0%) have expected frequencies less than 5. The minimum expected cell
frequency is 240.7.
Source: Customer Preference Primary Data Survey - 2012
P value is <0.01 so null hypothesis is rejected at 1% significant level. Hence it is concluded
that Policy holders have complete faith in the agents of private companies.
28. Ho Surrender of insurance policies is more in private companies
H1 Surrender of insurance policies is not more in private companies

255
Table 8.109 Table showing Test Statistics of surrenders of insurance policies by insured
N Valid 722
Missing 0
Mean 1.80
Std. Deviation .404
Variance .163 Source: Customer Preference Primary Data Survey - 2012
Table 8.110 Table showing surrenders of insurance company
whether more in private company
Frequency Percent Valid Percent
Cumulative
Percent
Valid Yes 148 20.5 20.5 20.5
No 574 79.5 79.5 100.0
Total 722 100.0 100.0
Source: Customer Preference Primary Data Survey - 2012
Table 8.111 Table showing surrenders of insurance company
Observed N Expected N Residual
Yes 148 361.0 -213.0
No 574 361.0 213.0
Total 722
Source: Customer Preference Primary Data Survey - 2012
Table 8.112 Table showing Test Statistics of surrenders of insurance policies
Chi-Square 251.352a
df 1
P value .000
a. 0 cells (.0%) have expected frequencies less than 5. The minimum expected cell
frequency is 240.7.
Source: Customer Preference Primary Data Survey - 2012
P value is <0.01 so null hypothesis is rejected at 1% significant level. Hence concluded that

256
Surrender of insurance policies is not more in private companies
29. Ho Returns offered by LIC is more than the return offered by private companies
H1 Returns offered by LIC is not more than the return offered by private companies
Table 8.113 Table showing return offered by LIC more than other insurance companies
N Valid 722
Missing 0
Mean 2.29
Std. Deviation .863
Variance .745
Source: Customer Preference Primary Data Survey - 2012
Table 8.114 Table showing returns offered by LIC more than other
insurance company.
Frequency Percent Valid Percent
Cumulative
Percent
Valid Yes 194 26.9 26.9 26.9
No 124 17.2 17.2 44.0
May be 404 56.0 56.0 100.0
Total 722 100.0 100.0
Source: Customer Preference Primary Data Survey - 2012
30. Ho There is a direct relationship between the age of the population and the number of
insurance policies
H1 There is no direct relationship between the age of the population and the number
of insurance policies.
Table 8.115 Table showing relationship between age of the population and No, of
insurance policies- Descriptive Statistics
Mean Std. Deviation N
Age of the population 2.19 1.132 722
No of insurance
policies
1.76 .651 722
Source: Customer Preference Primary Data Survey - 2012
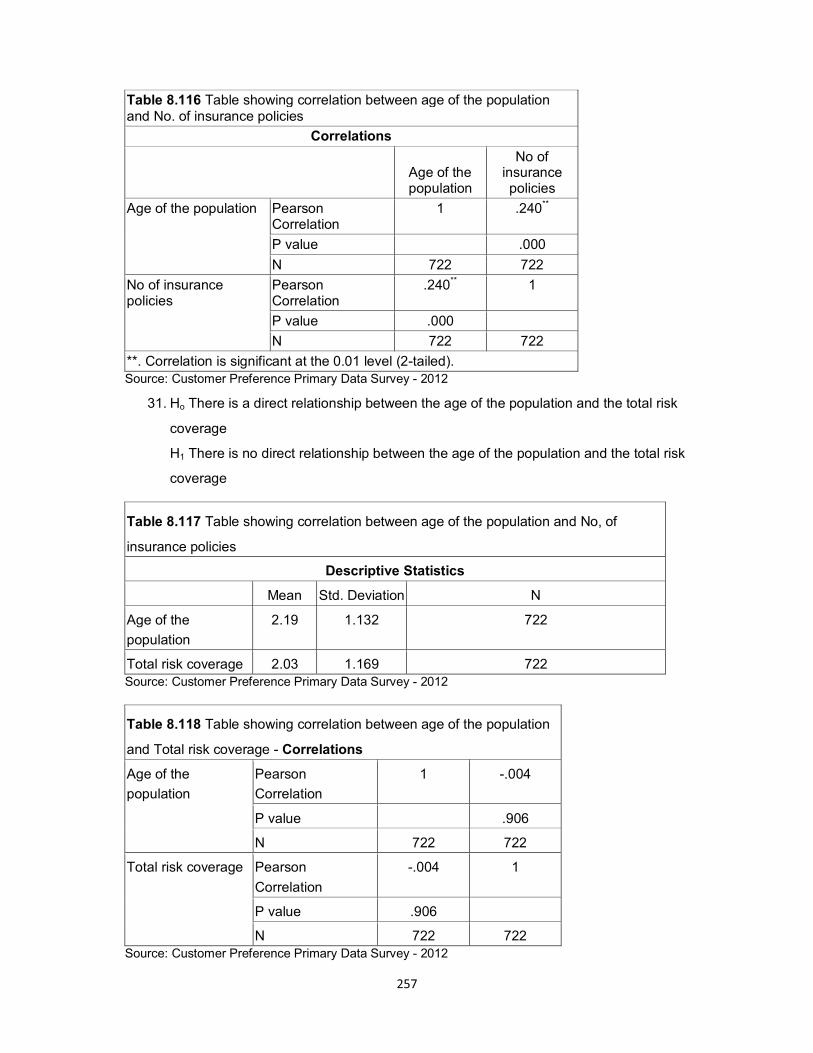
257
Table 8.116 Table showing correlation between age of the population and No. of insurance policies
Correlations
Age of the population
No of insurance policies
Age of the population Pearson Correlation
1 .240**
P value .000
N 722 722
No of insurance policies
Pearson Correlation
.240** 1
P value .000
N 722 722
**. Correlation is significant at the 0.01 level (2-tailed). Source: Customer Preference Primary Data Survey - 2012
31. Ho There is a direct relationship between the age of the population and the total risk
coverage
H1 There is no direct relationship between the age of the population and the total risk
coverage
Table 8.117 Table showing correlation between age of the population and No, of
insurance policies
Descriptive Statistics
Mean Std. Deviation N
Age of the
population
2.19 1.132 722
Total risk coverage 2.03 1.169 722 Source: Customer Preference Primary Data Survey - 2012
Table 8.118 Table showing correlation between age of the population
and Total risk coverage - Correlations
Age of the
population
Pearson
Correlation
1 -.004
P value .906
N 722 722
Total risk coverage Pearson
Correlation
-.004 1
P value .906
N 722 722 Source: Customer Preference Primary Data Survey - 2012

258
32. Ho There is no correlation between number of policies and agents advice
H1 There is correlation between number of policies and agents advice
Table 8.119 Table showing correlation between Number of Insurance policy and Agent’s
advice
Mean Standard Deviation
Correlation P value
No. of Insurance policy
1.76 0.651 -0.04 0.708
Agent’s Advice 2.32 1.285 Source: Customer Preference Primary Data Survey - 2012 Since P value >0.05., null hypothesis is accepted at 5% level of significance. Hence it is
concluded that there is no correlation between number of policies and agents advice
Table 8.120 Table showing correlation between age of the population and
Agents advice before purchase- Correlations
No of
insurance
policies
Agent advice
before
purchase
No of insurance policies Pearson
Correlation
1 -.014
P value .708
N 722 722
Agent advice before
purchase
Pearson
Correlation
-.014 1
P value .708
N 722 722 Source: Customer Preference Primary Data Survey - 2012
33. Ho There is no correlation between number of insurance policies and terms and
conditions of the policy
H1 There is correlation between number of insurance policies and terms and
conditions of the policy
Table 8.121 Table showing correlation between Number of policy holders and terms of
conditions Mean Standard
Deviation Correlation P value
No. of Insurance 1.76 0.651 0.085 0.022

259
policy Terms and Conditions
2.11 1.299
Source: Customer Preference Primary Data Survey - 2012
P value is < 0.05, so null hypothesis is rejected at 5% level of significance. Hence it’s
concluded that there is correlation between number of insurance policies and terms and
conditions of the policy.
Table 8.122 Table showing correlation between Number of insurance
companies and Terms and conditions
Correlations
No of insurance
policies
Terms and
condition
No of insurance
policies
Pearson
Correlation
1 .085*
P value .022
N 722 722
Terms and condition Pearson
Correlation
.085* 1
P value .022
N 722 722
*. Correlation is significant at the 0.05 level (2-tailed). Source: Customer Preference Primary Data Survey - 2012
The data obtained was subjected to statistical analysis and with the help of Chi
Square and Correlation techniques the results were obtained. The study revealed
that in the survey conducted among 722 respondents from all over South India and
Maharashtra, 83.5% of the respondents feel that the entry of the private life
insurance companies have given variety to customers in terms of products offered
and 51% of them feel that the monopoly position of LIC in the past put them at a
disadvantage. 61% of the respondents feel that private companies are equally
secure when compared to LIC. 79% of the respondents feel the products offered by
private Life Insurance Companies are more need based when compared to LIC.
Due to quick service by private companies, 82% prefer services of private
companies. According to information obtained from IRDA websites it was found that
95% claim settlement cases that were pending were of the public sector giant LIC.
Private companies settled claims very quickly comparatively. However the loyalty of

260
the agents and employees of LIC to their clients was much more when compared to
those of private sector Life Insurance Companies.
Table 8.123 Summary of important findings
Yes No Partially
1. Private insurance company are equally secured 60.5 39.5
2. Products offered by private Insurance Company are more need based
(Mean 22 Std. Deviation 0.864)
29.1 21.2 49.6
3. Quick service by Private [Test results 2.03 0.907 0.823] 39.6 17.7 42.7
4. Preliminary difficulties with LIC 33.8 23.5 42.7
5. Monopoly position of LIC till year 2000 put customers at a disadvantage 50.7 49.3
6. Availability of facilities for online payment of renewal premium is made
available by LIC
34.1
7. Availability of facilities for online payment of renewal premium is made
available by private LIC’s
57.2
8. Entry of private companies have given more choice and customer centered
products
83.5 16.5
9. Shift in customers preference from LIC to private companies 26.9 18.8 54.3
10. Awareness about failure of LIC to spread the market for insurance beyond
20% of population
54.3 45.7
11. Awareness about maximum pending claim settlements of LIC 37.4 62.6
12. Public sector LIC uses advanced technology and facilities according to
customer’s need.
48.2 23 28.8
13. Private sector LIC uses advanced technology and facilities according to
customer’s need.
43.2 35.7 21.1
14. LIC ‘s exclusive service to High value customers 19.1 56.8 24.1
15. Private LIC ‘s exclusive service to High value customers 19.7 57.1 23.3
16. Customer’s faith on agents of LIC 61.8 19.4 18.8
17. Customer’s faith on agents of LIC 38.5 41.3 20.2
18. Surrender value of amount invested in ULIP’s are less than amount
invested
20.5 79.5
19. Return on LIC’s policies are greater than return on policies of private
companies
25.9 17.2 56
20. Availability of products are more after private companies have entered the
insurance market
65.9 34.1
21. Do the agents of LIC follow up on lapsed policies 8.2 91.8
22. Do the agents of private LIC’s follow up on lapsed policies 65.3 34.7
23. Difficulty in reinstatement of lapsed policy in LIC 85.3 14.7
24. Difficulty in reinstatement of lapsed policy in private Companies 20.4 79.6
25. LIC has tried to sell more and more products to existing policy holders 30.4 69.6
26. Private companies try to sell more and more products to existing policy
holders
67.4 32.6
Source: Customer Preference Primary Data Survey – 2012
261
GREEN MANAGEMENT - Findings of the Study
Environmental management focuses on continuous improvement of environmental
management systems for corporate sustainability. In this study an attempt has been
made to evaluate the measures adopted by Life Insurance Companies to ensure
protection of environment and elimination of wastage of resources. The following is
the report of the survey conducted in 11 Life Insurance Companies in their Local
General Offices in Mangalore.
Green Initiatives at Life Insurance Corporation were nil.
Green Initiatives at HDFC Life Insurance Company
India’s second largest private sector lender, HDFC Bank, has launched “green
banking” for which it has constituted an Environment Management Committee to
implement its green banking initiatives. The bank has tied up with environmental
organisations and NGOs to the areas of tree plantation, watershed management and
alternate energy. Beginning with Nasik, Nagpur, Pune, Mumbai and New Delhi, the
bank has spread the tree plantation initiative to other parts of the country.
Environmental Initiatives – HDFC Life has always believed that establishing a strong
and ethical foundation in an essential pre requisite for long term sustainable growth.
Their focus is on maintaining the quality of their business and creation of long term
value for policy holders and stakeholders. In keeping with the “HDFC Life Way” of
giving back to the society, in the past few years, they have contributed their bit to the
society. Major CSR Projects and Environment Initiatives undertaken in the last two
years include Children Education Project, Teach for India and Payroll giving.

262
Green Initiatives in ICICI group
ICICI Bank’s green initiative is to make healthy environment in the organisation by
creating intrapersonal skills among the customer and understanding between
employees of the organisation. ICICI group has launched a “Go Green initiative”
across the group to move processes and customers to cost-efficient, automated
channels and build awareness about the environment. ICICI ‘s Go green initiative
saved 30000 trees in 2009-2010. As responsible corporate citizens they believe that
every small GREEN step taken today would go a long way in building a greener
future and that each one of them can work towards a better global environment.
ICICI group’s Green Initiatives aimed at customers are driven by the objective of
collaborating with each of their customers and making GREEN a part of all their
lives. These initiatives range from green offerings/incentives, green engagement to
green communication to their customers.
Green products and services included Mobile banking and payment of policy
premium anytime anywhere through internet banking, i-mobile banking etc. This
reduces the carbon footprint of the customers by ensuring they do not have to resort
to physical statements or travel to their insurance offices to pay their premium.
Most of the communication to the policy holders are done on line thus saving paper
and enormous amount of time and energy involved in writing of cheques and mailing
the cheques and collection of cheques.
As part of Green Engagements, ICICI has conducted Green themed events with their
customers during Diwali to build awareness about the environment amongst
employees and customers alike. During this event money plants were presented to

263
their customers as a token of prosperity and also as a token of their collective
responsibility in building a greener society.
Earth Hour which is the world’s largest global climate change event, had the ICICI
group furthering its Green commitment by pledging its support to the event.
ICICI group celebrated the World Environment Day on June 5th and to mark the
occasion, branches across the country undertook a number of activities. Branches
along with their customers took the green pledge through signature campaigns,
planted and distributed saplings, conducted drawing and competition for children and
conducted cycle rallies.
Green communication – ICICI group has extensively capitalized on the existing
internal media, statements, inserts, credit cards, charge slips to reach out to the
customers and seek their collaboration in the Go Green movement. The
communication on online premium pay, online funds transfer and accessing policy
details online are aimed at migrating customers to paperless and commute free
mode of conducting some of the their major transactions.
Green Partners – ICICI group is working and looking forward to partnerships with
national and international green organisations and NGO’s. In the past ICICI group
has been associated with BNHS in the past and has also partnered the Green
Governance Awards set up by BNHS to recognize and appreciate the participant
organisations efforts beyond meeting the statutory compliance for protection and
conservation of the environment.
Green Initiatives at SBI Life Insurance Company were nil.
Green Initiatives at Reliance Life Insurance Company

264
Reliance Power believes in using the best technology for all its business to lessen
the environmental impact. The Reliance Life Insurance company adopted the green
initiatives as following. The Reliance Life Insurance utilizes the leadership in energy
and environmental design standard to determine if the building is considered green.
They have also been driving a quiet revolution over the past decades or so by
increasing incentives for business owners to go green and adopt more eco-friendly
businesses and infrastructure. Reliance insurance began to offer green discount to
clients. These discounts can be expected to become a regular part of risk
management as more and more businesses could adopt and insist on green
initiatives and system
Green Initiatives at Bajaj Allianz Life Insurance Company
• The study conducted in Bajaj Allianz Life Insurance Company revealed the
following green initiatives taken by the company. The various roles as
insurance solution provider, long term investor and as a corporate citizen
have given rise to the initiatives.
• As a solution provider they support clients and business partners with the right
financing, insurance or asset management solution for coping with the effects
of climate change.
• As a long term investor they focus on promoting low-carbon technologies and
provide financing to help drive the huge investments required to shift to a low
carbon economy.
• As a corporate citizen they are exposed to the real impacts of climate change
and make use of their expertise to communicate their insights and best
practices to their stake holders.
265
Products and Solutions
• Solar Energy – In May 2010 Allainz had bought the first 8 solar plants in Italy.
• Wind power – Over EURO 800 Million investments in wind parks were made
in Italy and Germany and France with total capacity exceeding 450 MW.
• Green products – Over 70 products focus on carbon reduction, mitigation of
climate risks and the carbon market.
• Low carbon markets – Renewables & Clean Technology Projects, Energy
saving and energy efficiency, Emissions trading markets (CDM), Alternative
asset classes like forests, Low energy buildings and materials and Alternative
traffic technology.
Green Initiatives at TATA AIG Life Insurance Company
In TATA AIG as part of green initiatives, the green channel settlement has been
introduced based on customer research which reveals the two biggest concerns of
customers today. Green channels settlement which came with a unique warranty on
accident repairs from auto secure garages, has been designed keeping in mind
convenience and user friendly service with quality. Tata group has given a green
settlement to all of its business and plant operations in a bid to reduce its carbon
footprints and mitigate its environmental impacts. While most organisation are still
formulating their strategy on climate change, the company has already rolled its
sleeves and have begun to tackle the issue. The company’s brief to its architects
was to create a world class infotech facility without destroying natural habitat.
Green Initiatives at Birla Sun Life Insurance Company
At Sun Life, being a sustainable company means paying attention to a range of
environmental, social and governance matters that interact with their business.
266
While the definition of sustainability has evolved beyond its financial roots taking
action today to achieve a greener tomorrow continues to be an important area of
focus in their approach to sustainability. They have continued to focus on their
environmental practices making progress in such area as sustainability certifications
in their real estate assets, investments in clean and renewable energy projects and
measuring and reporting on greenhouse gases. They constantly seek better way to
be more efficient in their premises and the way we carry out their business.
In their buildings, they are taking significant steps to reduce their environmental foot
print by consuming less, diverting more waste and by adopting sustainable building
and development practices. They occupy approximately 2.8 million square feet of
office space in Canada alone. In 2011 throughout the organization they completed
several energy and water efficiency projects and achieved sustainable improvements
in their overall sustainability profile. They actively monitor and manage the
environmental footprint of their existing properties.
In their business, their efforts to promote paperless, electronic services continued in
2011-12 leveraging the use of online services, personal electronic devices and web
based transactions. They have been able to reduce the need for tens of millions of
pages of paper each year as well as saving the energy it takes to produce and
distribute paper documents
Birla Sun Life has been investing in clean and renewable energy for more than 28
years. In 2011 – 12 they financed approximately $217 million in five clean and
renewable energy projects. This includes natural gas renewable projects which are
considered environmentally preferable as they use otherwise waste heat from
neighbouring industries.
267
Green Initiatives at Met Life Insurance Company
As a leading global provider of insurance, annuities and employee benefit programs
serving 90 million customers in more than 60 countries they are aware that their
“green” initiatives can potentially have a significant impact on the global environment.
Met Life Ranked among News Week’s Top green US companies with the following
green initiatives taken by them
Met Life’s green house gas emissions, • Water Use, Environmental policies and
Green programs. Met life is committed to addressing its environmental impact
by reducing carbon emissions, implementing recycling and energy efficiency
programs in its facilities and conserving natural resources by investing in renewable
energy projects
Reduction in Environmental Footprint – In the last three years, the MetLife Stadium
has provided five updates documenting its green initiatives. Met Life has signed a
Memorandum of Understanding (MOU) pledging to become an environmental
steward by implementing a number of green initiatives that would reduce its carbon
footprint and further improve their plant’s environment.
Green Initiatives at ING Vysya Life Insurance Company
ING Vysya Life insurance has been conducting a series of sapling distribution drives
and blood donation camp as part of an initiative to protect and celebrate life. The
campaign was started on June 5th which is World Environment Day and the total
budget for the venture is Rs. 20 lakh. The company linked its commitment for life
protection to this green initiative and hoped that more individuals and companies
would join this drive to improve Mumbai. In addition to providing life protection, this

268
commitment is expressed in their efforts to create awareness for a greener and
cleaner Mumbai.
Conclusions and Suggestions
Insurance industry has to re-think its role in prompting good corporate citizenship by
creating innovative insurance products at reduced premiums or with green policy
terms. Green insurance products include premium reward and coverage
enhancement for hybrid cars, buildings constructed to be more robust against
extreme weather conditions, pollution legal liability and remediation cover, and
specialist insurance for renewable energy projects. These are some of the ideas on
which general insurance industry has to ponder over. It was found that Green
Initiatives in Life Insurance Companies were at the inception stage. In most of the
companies their foreign counterparts and partners played a major role in
environment protection in their respective countries. However the initiatives in the
home countries have not yet taken off in any noticeable manner. It was also found
that in those companies which had the parent company in the banking industry
especially private banks, for example ICICI, HDFC etc, the banks were ahead in
implementing green initiatives to a much larger extent when compared to the
subsidiary life insurance company. It was found that there were absolutely no green
initiatives undertaken in the public sector Insurance giant Life Insurance Corporation
of India. The same was true in the case of SBI Life insurance company which is also
a subsidiary of the biggest public sector bank SBI. All insurance companies should
therefore understand the need of the hour to protect environment as a top priority
and initiate a lot of activities within the organisation and among its policy holders to
create awareness about environment protection and also to take concrete steps to
incorporate it into its major policies.