an advanced signal phasing scheme for diverging diamond ...docs.trb.org/prp/14-1875.pdf · 3 an...
TRANSCRIPT

1
Hu, Tian, Xu, and Andalibian
1
2
AN ADVANCED SIGNAL PHASING SCHEME FOR DIVERGING DIAMOND 3
INTERCHANGES 4
5
6
Peifeng Hu, Ph.D. 7
(Corresponding Author) 8
Department of Civil & Environmental Engineering 9
University of Nevada, Reno 10
Reno, NV, USA 89557 11
Email: [email protected] 12
Tel: (775) 784-1232 13
Fax: (775) 784-1390 14
15
Zong Z. Tian, Ph.D., P.E. 16
Department of Civil & Environmental Engineering 17
University of Nevada, Reno 18
Reno, NV, USA 89557 19
Email: [email protected] 20
Tel: (775) 784-1232 21
Fax: (775) 784-1390 22
23
Hao Xu, Ph.D. 24
Department of Civil & Environmental Engineering 25
University of Nevada, Reno 26
Reno, NV, USA 89557 27
Email: [email protected] 28
Tel: (775) 784-6909 29
Fax: (775) 784-1390 30
31
Rasool Andalibian, Ph.D. Candidate 32
Department of Civil & Environmental Engineering 33
University of Nevada, Reno 34
Reno, NV, USA 89557 35
Email: [email protected] 36
Tel: (775) 784-6195 37
Fax: (775) 784-1390 38
39
40
Nov 2013 41
42
TRB 2014 Annual Meeting Paper revised from original submittal.

2
Hu, Tian, Xu, and Andalibian
ABSTRACT 43
A diverging diamond interchange (DDI), also called a double crossover diamond interchange 44
(DCD), is a relatively new interchange type in the U.S. Due to its many advantages over the 45
conventional diamond interchanges such as higher capacity and lower delay, there has been a 46
growing interest in its analysis methodologies and operational strategies. DDIs have shown 47
particularly high efficiency under conditions with heavy ramp traffic to arterial roads. However, 48
as the DDI concept is relatively new in the U.S., the research on DDIs is still considered to be in 49
the preliminary stage. In particular, most studies found in the literature only provided basic 50
phasing schemes, which were not optimized for efficiency. Furthermore, there is a lack of 51
commonly acceptable methodologies for obtaining critical signal control parameters, such as the 52
cycle length, and phasing splits. Therefore, it is an area topic in need of much research in order 53
to develop signal phasing schemes for achieving the optimized DDI performance. This study 54
proposed a new methodology for signal phasing scheme design at DDIs. With minor adjustment, 55
it can be applied to a variety of DDIs with different traffic demands and geometric 56
configurations. The proposed phasing design approach was specifically designed for DDIs, so it 57
could be employed as a guide or a reference for signal timing design at DDIs. At the DDI of 58
Moana Ln and U.S. 395 in Reno, Nevada, the proposed scheme was evaluated and compared 59
with various signal phasing schemes by using the hardware-in-the-loop simulation technology. 60
The simulation results indicated that the proposed approach significantly outperformed the one 61
currently being used at this interchange. 62
Keywords: Diverging Diamond Interchange, Traffic Signal Control, Signal Phasing Scheme, 63
Webster Method, VISSIM. 64
INTRODUCTION 65
The DDI concept was first introduced to the United States by Gilbert Chlewicki in 2003 (1). 66
The first DDI was constructed in Springfield, Missouri in 2009 (2). Before that, the only known 67
DDIs existed in the communities of Versailles, Le Perreux-sur-Marne, and Seclin in France (3). 68
Field and simulation studies have demonstrated many advantages of DDIs over the conventional 69
diamond interchanges. As a result, seven states (Missouri, Utah, Georgia, Kentucky, Maryland, 70
New York, and Nevada) have constructed DDIs with demonstrated operational improvements 71
by the end of year 2012. More than 17 states are currently constructing DDIs in the U.S. (3). 72
Studies have been conducted to evaluate the performance of DDIs (1, 4-6). Most of 73
these studies compared the performance of DDIs to conventional diamond interchanges and 74
single point urban interchanges. Researchers sought signal timing plans either manually or by 75
using Synchro to optimize signal timing for each traffic scenario. Since Synchro does not 76
provide the specific function of signal timing optimization at DDIs, some of the research 77
interpreted the two crossover intersections of DDIs as two separate intersections operated by 78
two controllers (2). The microscopic simulation software of VISSM was then employed to 79
evaluate the performance. The existing research results have indicated that DDI works better 80
than the conventional interchange designs in terms of delay, number of stops, queue length, and 81
capacity (2, 6). 82
TRB 2014 Annual Meeting Paper revised from original submittal.

3
Hu, Tian, Xu, and Andalibian
FHWA’s research suggested that the DDI signal timing could be two-phase control, with 83
each phase dedicated for the alternative opposing movements (7). Signals at a DDI can be fixed 84
time and may be fully actuated to minimize delay. Detectors can be used on all approaches of 85
both crossovers, and durations of signal phases may vary on a cycle-by-cycle basis. A DDI can 86
be operated by one controller or two. FHWA also indicated a three-phase signal operation by 87
adding a dummy phase as the spacing between the crossover junctions is very close. Until now, 88
there is no commonly accepted signal timing methodology specifically for DDIs. Therefore, 89
professionals rely on personal experience or conventional approaches for other types of 90
interchanges. 91
This study proposed a new methodology for the signal phasing scheme design at DDIs. 92
With minor adjustment, it can be applied to a variety of DDIs with different traffic demands and 93
geometric configurations. The proposed phasing design approach was specifically designed for 94
DDIs, so it could be employed as a guide or a reference for signal timing design at DDIs. This 95
research paper consists of four major sections. Section 1 provides a comprehensive literature 96
review pertinent to DDIs. Section 2 briefly introduces the current operation scheme and presents 97
a mathematical model for traffic signal timing design of DDIs based on Webster’s method. 98
Section 3 compares performance of the current traffic signal operation scheme and signal timing 99
by the proposed methodology with simulation results at the DDI of Moana Ln and U.S. 395 100
interchange in Reno, NV. The results indicated that the performance of the proposed scheme is 101
better than the current operation scheme at the studied interchange under the traffic demand 102
conditions. The last section offers conclusions of this study. 103
METHODOLOGY 104
Proposed Operation 105
The proposed phasing scheme is for one controller operation and can be used with all control 106
types: pre-timed, semi-actuated, and fully actuated. It is a general phasing scheme design 107
methodology for DDIs. The proposed phasing scheme is shown in Figure 1 and Figure 2. The 108
proposed operation operates very efficiently by applying overlapping phases extensively. 109
Phasing Scheme 110
As shown in Figure 1, phases 1 and 5 have the same split that is approximately equal to the 111
travel time (���,��,� sec) between locations of “11” and “7” (or between “4” and “8”) as depicted 112
in Figure 3. Phases 1 and 5 start and terminate at the same time, so they have the same “Max 1” 113
or “phase splits” in the controller settings for the same maximum recall. The two phases allow 114
the southbound (SB) off-ramp to be released earlier by ���,��,� sec. Due to the early release, 115
there are no stops at the next signal, which means improved capacity. Phase 7 serves as the 116
green extension for phase 2, which allows the vehicles passing through location “5” in phase 2 117
to get to location “8”. These vehicles can then be served with green signal when phase 3 comes 118
on, which reduces the control delay of the northbound (NB) off-ramp traffic. In addition, phase 119
7 is set to “Max Recall” for safety and its duration must be less than the minimum green of 120
phase 4, which is set to be “Min Recall” in the controller. Another reason for setting “Max 121
Recall” on phase 7 is to avoid the queue between nodes “3” and “4” exceeding the segment 122
TRB 2014 Annual Meeting Paper revised from original submittal.

4
Hu, Tian, Xu, and Andalibian
between these two nodes. Although Phase 8 is not assigned to any of the movements, the phase 123
with a “Min Recall” ensures phases 3 and 7 not to come on at the same time as they are actually 124
conflicting phases. Without phase 8, phase 7 will extend to run simultaneously with phase 3. If 125
phase 8 is set up with “Max Recall, the signal operation the DDI is not efficiently as phase 3 126
cannot gap out when its pertinent traffic is low. Figure 2 shows the locations of phases in the 127
proposed DDI phasing scheme. The SB on-ramp right-turn traffic and the NB on-ramp right-128
turn traffic are controlled by “yield” type in this study. They can also be controlled by overlap 129
phases such as phase 4 for SB on-ramp right-turn traffic and overlapping phases 1 and 3 for NB 130
on-ramp right-turn traffic. Therefore, the proposed phasing scheme can be easily adjusted for 131
controlling other DDIs with different configurations. 132
133
Figure 1 Phases, Rings, and Barrier for Proposed Operation 134
135
Figure 2 Phase Location Diagram for Proposed Operation 136
TRB 2014 Annual Meeting Paper revised from original submittal.

5
Hu, Tian, Xu, and Andalibian
137
Figure 3 Critical Nodes of a DDI 138
Signal Timing 139
1. Assumptions and Basic Strategies 140
Similarly to Webster’s method, the proposed operation assumes that the v/c ratios for critical 141
lane groups are equal, and that the green times allocated to critical lane groups are assumed to 142
be proportional to their saturation flow rates. Unlike the traditional Webster’s method, the 143
principle of deriving a real cycle length and the real splits (the cycle length and the splits shown 144
in a controller) of a DDI by the proposed operation is adding a certain of additional times 145
(coming from overlapping phases) to the real cycle length for calculating its effective splits in 146
proportion, and then deducting the additional times from the effective cycle length and splits to 147
obtain the real cycle length and the real splits, which will be input into a controller. 148
The proposed method introduces phases 2 and 6 into the signal operation, which lead to 149
two different timing schemes: phase 6 is one of the critical phases or phase 2 is the one of the 150
critical phases. The criterion for selecting the critical phases between phases 2 and 6 is 151
determined by the traffic demands and configurations of a DDI. The performance of these two 152
schemes is different as their operation efficiencies are different. The flow chart in Figure 4 153
indicates the basic steps for deciding which scheme to use. 154
TRB 2014 Annual Meeting Paper revised from original submittal.

6
Hu, Tian, Xu, and Andalibian
155
Figure 4 Overview of Proposed Operation 156
2. Signal Timing Scheme 1 of Proposed Operation 157
Signal timing scheme 1 is for the situation that phases 6, 4, and 3 are critical phases. Phase 1 is 158
predetermined by the travel time of ���,��,� sec. 159
1) Cycle Length 160
For the traffic signal operation shown in Figure 1, the DDI traffic signal timing parameters must 161
satisfy the relationship in the following equation: 162
�� � � � � � � � ���,��,� � ���,��,� � � � � � 2 ∗ ���,��,� � � (1) 163
where 164
��: effective green time of phase 3 (s); 165
�: effective green time of phase 4 (s); 166
�: effective green time of phase 6 (s); 167
� : sum of splits of phases 3, 4, and 6 shown in Figure 1 (s); 168
TRB 2014 Annual Meeting Paper revised from original submittal.

7
Hu, Tian, Xu, and Andalibian
���,��,�: split of phase 1, fixed and determined by the travel time between the two signals 169
“11” and “7” through nodes “11,” “12,” and “7” shown in Figure 3; and 170
�: total lost time per cycle (s); 171
For this kind of DDI, the effective cycle length (��) for the three critical lane groups 172
(SBL, eastbound (EB), and westbound (WB)) satisfy the following relationship with � : 173
�� � � � 2 ∗ ���,��,� (2) 174
Replacing ��, �, � and � in Equations (1) and (2) yields: 175
∑��
��∗
��
��
�� � �� � � (3) 176
Then, based on the assumption, � � �� � �� for � ≠ " ,the effective cycle length is: 177
�� �#
�$∑
%�&�
'�
(
�#
�$∑ )�
'�(
�#
�$*
(
(4) 178
where 179
+�: flow ratio for critical lane group +�; and 180
,: sum of all critical lane groups. 181
For this traffic signal timing plan, the total lost time is: 182
� � -� � - � - (5) 183
-� � -�,� � -.,� � -�,� � ,� � /0� � 1� (6) 184
where 185
-�: lost time of critical lane group � (� � 4 345 6) (s); 186
-�,�: start-up lost time of critical lane group � (� � 4 345 6) (s); 187
-.,�: clearance lost time of critical lane group � (� � 4 345 6) (s); 188
,�: yellow interval of critical lane group � (� � 4 345 6) (s); 189
/0�: all-red interval of critical lane group � (� � 4 345 6) (s); and 190
1�: extension of effective green time of critical lane group � (� � 4 345 6) (s). 191
-� � -�,� � 2 (7) 192
The lost time of phase 3 is 2 sec, since it is overlapped by phase 1. Phase 1 is overlapped 193
by phase 2. Therefore, the westbound through traffic has start-up lost time of 2 sec as shown in 194
Equation (7). 195
The real cycle length is computed by: 196
� � �� � � � ���,��,� �#
�$*
(
� � � ���,��,� (8) 197
2) Effective Green Times and Phase Splits 198
TRB 2014 Annual Meeting Paper revised from original submittal.

8
Hu, Tian, Xu, and Andalibian
Effective green times can be calculated by: 199
��7 �
8�
∑ 8�'�
∗ (�� � �) (9) 200
where 201
��7: effective green time for phase � (� � 3, 4, 6). 202
The actual green time shown in Figure 1 can be obtained by: 203
�� � ∅� � ,� � /0� (10) 204
�� � ��7 � ∅� (11) 205
� � �7 (12) 206
�� � � � �7 � ∅� (13) 207
where 208
∅�: is equal to ���,��,� (s). 209
The phase splits 3, 4, and 6 are: 210
∅� � �� � ,� � /0� (14) 211
The +� in Equation (4) can be replaced by: 212
+� � =3� {�?,@A,B
�?,@A,B,
�?,C,D
�?,C,D} (15) 213
+ � =3� {�A,@,F
�A,@,F,
�A,@G,H
�A,@G,H} (16) 214
where 215
I�,�,�: traffic volumes of lane group between nodes “14” and “7” (veh/h); 216
J�,�,�: saturation flow rate of lane group between nodes “14” and “7” (veh/h); 217
I�,K,: traffic volumes of lane group between nodes “5” and “6” (veh/h); 218
J�,K,: saturation flow rate of lane group between nodes “5” and “6” (veh/h); 219
I,�,L: traffic volumes of lane group between nodes “1” and “8” (veh/h); 220
J,�,L: saturation flow rate of lane group between nodes “1” and “8” (veh/h); 221
I,� ,M: traffic volumes of lane group between nodes “10” and “9” (veh/h); and 222
J,� ,M: saturation flow rate of lane group between nodes “10” and “9” (veh/h). 223
3. Signal Timing Scheme 2 of Proposed Operation 224
Signal timing scheme 2 is for the situation that phases 2, 3, and 4 are critical phases. In this 225
scheme, phase 1 is also predetermined by the travel time of ���,��,� sec. Phase 1 serves SBL off-226
ramp traffic with phase 6. Phase 1 also serves the WBT through traffic. Phase 7 is neglected in 227
the scheme 2 for studying the signal timing as phase 2 is the critical phase. It is not efficient to 228
TRB 2014 Annual Meeting Paper revised from original submittal.

9
Hu, Tian, Xu, and Andalibian
calculate the cycle length and splits by adding phase 7 into the effective green time as phase 2 229
itself can serve NBL off-ramp traffic well, or in other words, phase 7 is not effective for the 230
entire intersection although it can still add an additional green time to phase 2. All the symbols 231
of the signal timing scheme 2 are same as the signal timing scheme 1. 232
1) Cycle Length 233
For the traffic signal operation shown in Figure 2, the DDI traffic signal timing parameters 234
should satisfy the relationship in Equation 17: 235
�� � �� � � � � � ���,��,� � � � � � ���,��,� � � (17) 236
Under this condition, the effective cycle length for the three critical lane groups (NBL, 237
EB, and WB) satisfy the following relationship with � : 238
�� � � � ���,��,� (18) 239
Replacing ��, ��, � and � in Equations (17) and (18) yields: 240
∑��
��∗
��
��
�� � �� � � (19) 241
Then, based on the assumption, � � �� � �� for � ≠ " , the effective cycle length is: 242
�� �#
�$∑
%�&�
'�
(
�#
�$∑ )�
'�(
�#
�$*
(
(20) 243
The real cycle length is calculated as: 244
� � �� � � �#
�$*
(
� � (21) 245
For this traffic signal timing plan, the total lost time is: 246
� � -� � -� � - (22) 247
-� � -�,� � -.,� � -�,� � ,� � /0� � 1� (23) 248
-� � -�,� � 2 (24) 249
The lost time of phase 3 is only 2 sec, since it is overlapped by phase 1. Phase 1 is 250
overlapped by phase 2. Therefore, the westbound through traffic has start-up lost time of 2 sec 251
as shown in Equation (24). 252
2) Effective Green Times and Phase Splits 253
Effective green times can be calculated by: 254
��7 �
8�
∑ 8�'�
∗ (�� � �) (25) 255
The actual green time illustrated in Figure 1 can be obtained by: 256
�� � ∅� � ,� � /0� (26) 257
TRB 2014 Annual Meeting Paper revised from original submittal.

10
Hu, Tian, Xu, and Andalibian
� � �� � ��7 (27) 258
�� � ��7 � ∅� (28) 259
� � �7 (29) 260
CASE STUDY 261
The proposed schemes have proved to work well with one controller operation at DDIs (8). In 262
this study, the interchange performance with the proposed scheme was compared with the 263
performance of the existing traffic operation. 264
Site Description 265
The interchange of Moana Lane and U.S. 395 is a diverging diamond interchange in Reno, NV, 266
as shown in Figure 5. The interchange has high right-turn traffic demands on the off-ramps. No-267
turn-on-red is used on the southbound off-ramp due to the dual-lane geometry. Other peak hour 268
volumes of the interchange are shown in Figure 5. 269
270
Figure 5 Bird’s-Eye View and Peak Hour Volumes of the Moana Lane/U.S. 395 271 Interchange (8, 9) 272
Existing Traffic Operation and Performance 273
The current actuated-coordinated signal timing plans running at the studied interchange were 274
developed by the City of Reno in 2012, with consideration of the heavy right-turn movements 275
on the off-ramps and southbound no-turn-on-red. The current signal phasing scheme has been 276
evaluated by Hu et al. in September, 2012 (8). The existing timing plan is displayed in Figure 6 277
and Figure 7. 278
279
E Moana Ln
Year 2015
AM (PM)
Peak Hour Volumes
AM Peak: 7:00-8:00
PM Peak: 17:00-18:00
TRB 2014 Annual Meeting Paper revised from original submittal.

11
Hu, Tian, Xu, and Andalibian
280
Figure 6 Phase, Ring, and Barrier Diagram by City of Reno 281
282
283
Figure 7 Phase Designation Diagram by City of Reno 284
Phases 4 and 1 are not conflicting phases. There is no accurate way to determine the phase 1’s 285
split. Therefore, there is no accurate quantitative method to derive the cycle length for the 286
current method as well. The cycle lengths of the actuated-coordinated signal timing plans at the 287
DDI are provided as the existing actuated-coordinated plans for the adjacent signals: 110-sec 288
cycle for AM and 130-sec cycle for PM. In this study, the phase 1 split is assumed to be 10% of 289
the cycle length. Phases 2, 3, and 4 share the remaining time in proportion to their critical 290
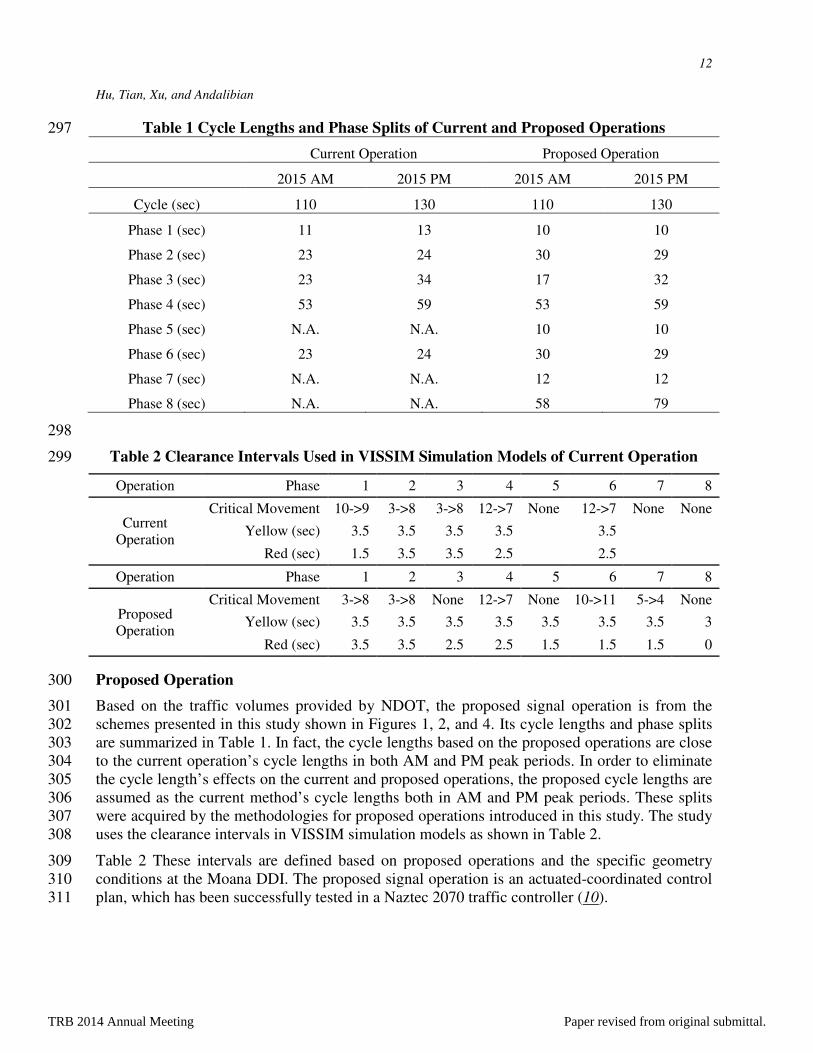
saturation flow ratios. Table 1 shows each phase split in year 2015 AM and PM peak hours. 291
Table 2 provides the yellow and all-red intervals of the two actuated-coordinated plans for 292
current operation used in VISSIM simulation models. 293
294
295
296
TRB 2014 Annual Meeting Paper revised from original submittal.
12
Hu, Tian, Xu, and Andalibian
Table 1 Cycle Lengths and Phase Splits of Current and Proposed Operations 297
Current Operation Proposed Operation
2015 AM 2015 PM 2015 AM 2015 PM
Cycle (sec) 110 130 110 130
Phase 1 (sec) 11 13 10 10
Phase 2 (sec) 23 24 30 29
Phase 3 (sec) 23 34 17 32
Phase 4 (sec) 53 59 53 59
Phase 5 (sec) N.A. N.A. 10 10
Phase 6 (sec) 23 24 30 29
Phase 7 (sec) N.A. N.A. 12 12
Phase 8 (sec) N.A. N.A. 58 79
298
Table 2 Clearance Intervals Used in VISSIM Simulation Models of Current Operation 299
Operation Phase 1 2 3 4 5 6 7 8
Current
Operation
Critical Movement 10->9 3->8 3->8 12->7 None 12->7 None None
Yellow (sec) 3.5 3.5 3.5 3.5
3.5
Red (sec) 1.5 3.5 3.5 2.5 2.5
Operation Phase 1 2 3 4 5 6 7 8
Proposed
Operation
Critical Movement 3->8 3->8 None 12->7 None 10->11 5->4 None
Yellow (sec) 3.5 3.5 3.5 3.5 3.5 3.5 3.5 3
Red (sec) 3.5 3.5 2.5 2.5 1.5 1.5 1.5 0
Proposed Operation 300
Based on the traffic volumes provided by NDOT, the proposed signal operation is from the 301
schemes presented in this study shown in Figures 1, 2, and 4. Its cycle lengths and phase splits 302
are summarized in Table 1. In fact, the cycle lengths based on the proposed operations are close 303
to the current operation’s cycle lengths in both AM and PM peak periods. In order to eliminate 304
the cycle length’s effects on the current and proposed operations, the proposed cycle lengths are 305
assumed as the current method’s cycle lengths both in AM and PM peak periods. These splits 306
were acquired by the methodologies for proposed operations introduced in this study. The study 307
uses the clearance intervals in VISSIM simulation models as shown in Table 2. 308
Table 2 These intervals are defined based on proposed operations and the specific geometry 309
conditions at the Moana DDI. The proposed signal operation is an actuated-coordinated control 310
plan, which has been successfully tested in a Naztec 2070 traffic controller (10). 311
TRB 2014 Annual Meeting Paper revised from original submittal.

13
Hu, Tian, Xu, and Andalibian
Simulation Results 312
Each VISSIM model ran five simulations with random seeds. The warm-up time in the 313
simulation models was 300 sec, followed by 3600 sec of run time with data compiled and 314
collected for each traffic movement at the Moana DDI. The average delays of five runs of the 315
current and proposed operations as well as the compared results of their average delays are 316
presented in Table 3. The average maximum queues of the five runs of the current and proposed 317
operations as well as their average maximum queues are provided in Table 4. The percent 318
values in Table 3 are obtained by taking the difference of the average delays from the proposed 319
operation and the current operation and then dividing by the average delay found in the current 320
operation. For example, the value “11%” shown in the table is obtained by (17.9-321
16.1)/16.1*100%. The value “16.1” comes from the current operation average delay of traffic 322
movement “10->9” during the AM peak hour. Similarly, the number “17.9” is the proposed 323
operations average delay of the same traffic movement in the period. Based on simulation 324
results, proposed operations brought about less average delay for most movements but greater 325
average delay of movement “10->9” compared to the operation developed by the City of Reno 326
for 2015 AM and PM peak hour periods. The reason for less delay of movement “10->9” by the 327
current operation is that it adds phase 1 to this traffic movement compared to the proposed 328
operation. The average delay for all vehicles of the proposed operation dropped by 17% and 329
28% in AM and PM peak hours, respectively, compared to the current operation. 330
Similar to the data in Table 3, Table 4 summarizes the results of average maximum queues. The 331
average maximum queue of movement “10->11” under the proposed operation decreased by 332
15% and 44% in the AM and PM peak hours, respectively, compared to the current operation. 333
The average maximum queue of movement “5->4” in the proposed operations reduced 21% in 334
both the AM and PM peak hour over the current operation, specifically from 222.1 to 174.8 feet 335
in the AM peak and from 308.9 to 245.5 feet in the PM peak. Of the other traffic movements 336
including “1->8,” “1->2,” “12->7,” and “14->7,” the proposed operation performed better than 337
the current operation during the peak periods. However, proposed operations increased the 338
maximum queue by 0% and 24% of movement “10->9,” and increased 11% and 14% of the 339
maximum queue of movement “3->8” ” in the AM and PM peak hour periods to 69.0 and 84.3 340
feet, respectively. The same reason for greater average delay of traffic movement “10->9” 341
brought about the larger average maximum queue of this movement. The reason for longer 342
maximum queues of movement “3->8” experienced with the proposed operation is that this 343
operation allows the release of northbound left (NBL) traffic earlier, which stops in front of 344
node “8.” The maximum queues of this movement were less than 84.3 feet. This maximum 345
queue is acceptable for reducing the delay in front of node “4.” Of the other movements, both 346
operations performed well with no noticeable differences for their low traffic volume, even 347
though they seemed much different. 348
349
TRB 2014 Annual Meeting Paper revised from original submittal.

14
Hu, Tian, Xu, and Andalibian
Table 3 Average Delays from VISSIM Simulation Models (sec/veh) 350
Peak Hours AM PM
Movement Current Proposed Change (%) Current Proposed Change (%)
10->9 16.1 17.9 11% 22.1 26.9 22%
10->11 45.8 33.5 -27% 85 45.3 -47%
1->8 21.7 16.3 -25% 35.9 30.3 -16%
1->2 0.8 0.8 5% 2.7 2.1 -21%
3->8 7.7 8.7 14% 7.5 6.3 -15%
3->2 0.3 0.3 -7% 0.8 0.3 -67%
14->13 0.6 0.5 -4% 2.6 1 -59%
14->7 51.7 47.6 -8% 68.3 51.1 -25%
5->6 0.8 0.7 -8% 1.3 1.2 -12%
5->4 48.7 32.5 -33% 66.1 41.1 -38%
12->13 1.4 1.3 -8% 3.7 3 -18%
12->7 5.9 1.5 -75% 14.6 2 -86%
All 18.3 15.1 -17% 27 19.5 -28%
351
352
Table 4 Average of the Maximum Queue from Simulation Models (ft) 353
354
Peak Hours AM PM
Movement Current Proposed Change (%) Current Proposed Change (%)
10->9 288.2 287.2 0% 345.1 427.1 24%
10->11 206.4 175.3 -15% 479.4 267.8 -44%
1->8 250.7 229.9 -8% 634.5 594.8 -6%
1->2 41.7 30.8 -26% 365 325.4 -11%
3->8 62 69 11% 74 84.3 14%
3->2 13.5 37.7 180% 50.9 67 32%
14->13 0 0 N.A. 0 0 N.A.
14->7 274.8 279.7 2% 632.1 526.3 -17%
5->6 0 0 N.A. 0 0 N.A.
5->4 222.1 174.8 -21% 308.9 245.5 -21%
12->13 0 7.8 N.A. 100.3 59.2 -41%
12->7 101.8 95.6 -6% 279.6 238.9 -15%
TRB 2014 Annual Meeting Paper revised from original submittal.

15
Hu, Tian, Xu, and Andalibian
CONCLUSION 355
Since there is no widely accepted signal timing methodology for DDIs, in the literature, traffic 356
engineers and researchers designed DDI signal timing plans based on their personal experience 357
and approaches for conventional interchanges, which have been proven to be inefficient. Some 358
of the signal phasing schemes in existing research did not consider the capability of signal 359
controllers, so they are not readily implementable in the field. 360
Because DDIs are a relatively new interchange design, there is a limited amount of related 361
literature. Most DDI related reports do not include detailed descriptions of feasible signal 362
phasing schemes. Where signal phasing was actually discussed, most reports did not follow the 363
NEMA convention, thus the phasing schemes were not readily implementable in the field. This 364
paper presented an innovative phasing scheme and a methodology for determining cycle length, 365
splits, and phase intervals for DDIs with consideration of the capacity of signal controllers. The 366
proposed phasing scheme employed the conception of overlap phases, which was inspired by 367
the TTI-4 signal strategy for conventional diamond interchanges. The phasing scheme and the 368
timing methodology had been fully tested by Hu et al. (8) for its validity under pre-time, fully 369
actuated, and actuated-coordinated control modes. The proposed phasing scheme and timing 370
methodology can also be easily modified to meet the specific DDI requirements under a variety 371
of geometric characteristics and traffic demand conditions. A case study was conducted using 372
the first DDI site in Nevada. The simulation results by VISSIM showed that the proposed 373
operation outperformed what was initially implemented by reducing vehicle delays. 374
Further research identified through this study includes the following. First, the 375
relationship between cycle length and interchange level delay needs to be further addressed. 376
Second, the relationship between traffic demands, phasing scheme, and signal timing 377
parameters, needs additional investigation. Finally, the effect of signal spacing on DDI’s 378
performance needs to also be thoroughly researched. 379
380
TRB 2014 Annual Meeting Paper revised from original submittal.

REFERENCES
1. Chlewicki, G. New Interchange and Intersection Designs : The Synchronized Split-
Phasing Intersection and the Diverging Diamond Interchange. 2nd Urban Street
Symposium, Anaheim, CA, 2003, pp. 3–16.
2. Missouri Department of Transportation. Missouri’s Experience with a Diverging Diamond
Interchange. Report No.: OR 10 - 021, Jefferson, MO, 2010, pp. 4–22.
3. Wikipedia. http://en.wikipedia.org/wiki/Diverging_diamond_interchange. accessed Oct.
29, 2013.
4. Bared, J., P. Edara, and R. Jagannathan. Design and Operational Performance of Double
Crossover Intersection and Diverging Diamond Interchange. Transportation Research
Record, Vol. 1912, No. 1, Jan. 2005, pp. 31–38.
5. Bared, J. G., T. Granda, and A. Zineddin. Drivers’ Evaluation of the Diverging Diamond
Interchange. Publication No.: FHWA-HRT-07-048, McLean, VA, 2009, p. 11.
6. Stanek, D. Innovative Diamond Interchange Designs : How to Increase Capacity and
Minimize Cost. ITE 2007 Annual Meeting and Exhibit, Pittsburgh, PA, 2007, pp. 1–17.
7. Hughes, W., R. Jagannathan, D. Sengupta, and J. H. Hummer. Alternative
Intersections/Interchanges: Informational Report (AIIR). Publication No.: FHWA-HRT-
09-060, Washington, DC, 2009, pp. 217-259.
8. Hu, P., and Z. Tian. Proposed Signal Control at the Moana Lane / U . S . 395 Diverging
Diamond Interchange. NDOT Sponsored Research (to be published), Reno, NV, 2012.
9. Diverging Diamond Interchanges, Nevada Department of Transportation.
https://www.nevadadot.com/Traveler_Info/Safety/Diverging_Diamond_Interchange.aspx.
accessed Oct. 29, 2013.
10. Hu, P., and Z. Tian. Advanced Signal Control Strategies and Analysis Methodologies for
Diverging Diamond Interchanges. University of Nevada, Reno. Reno, NV, 2013.
http://www.youtube.com/watch?v=VVOvzOTHUDA. Accessed Oct. 29, 2013.
TRB 2014 Annual Meeting Paper revised from original submittal.