an action plan for san diego civic leaders the housing affordability crisis in san diego and beyond...
TRANSCRIPT

ADDRESSING THE
HOUSING AFFORDABILITY CRISIS
IN SAN DIEGO AND BEYOND NOVEMBER 25, 2015
An Action Plan for San Diego Civic Leaders
Prepared for San Diego Housing Commission by:
LeSar Development Consultants Jennifer LeSar, President and CEO
619-236-0612 [email protected]
www.LeSarDevelopment.com

Addressing the Housing Affordability Crisis in San Diego and Beyond
San Diego Housing Commission | November 25, 2015 | Page 2 of 96
About Us
Established in 1979, the San Diego Housing Commission (SDHC) is an award-winning public agency dedicated to preserving and increasing affordable housing within the City of San Diego. Since 1981, SDHC has contributed more
than $1 billion in loans and bond financing to projects that have produced 14,531 affordable rental units. We provide a variety of award-winning affordable housing programs and services that stimulate the local economy, revitalize neighborhoods, and help improve the lives of more than 125,000 San Diegans annually. To learn more about SDHC, please visit http://www.sdhc.org/.
LeSar Development Consultants (LDC) provides a full range of strategic advisory services primarily to clients involved in creating physically, economically and environmentally
sustainable communities. Founded in 2005 by Jennifer LeSar, LDC is certified by the State of California as a woman-owned, small business corporation and has offices and staff located in San Diego, Los Angeles, Orange County, Berkeley and Sacramento. To learn more about LDC, please visit http://www.lesardevelopment.com/.
Copyright © 2015 by LeSar Development Consultants. All rights reserved. This report or any portion thereof may not be reproduced or used in any manner whatsoever without the express written permission by LeSar Development Consultants.
Addressing the Housing Affordability Crisis in San Diego and Beyond
San Diego Housing Commission | November 25, 2015 | Page 3 of 96
Table of Contents
TABLE OF CONTENTS .................................................................................................................... 3
LIST OF CONTRIBUTORS AND REVIEWERS ................................................................................. 4
EXECUTIVE SUMMARY .................................................................................................................. 6
I. INTRODUCTION ......................................................................................................................... 12
II. ACTIONABLE OPPORTUNITIES ................................................................................................ 16
III. ECONOMIC IMPACT OF HIGH HOUSING COSTS ................................................................... 42
APPENDIX 1: METHODOLOGY ...................................................................................................... 61
METHODOLOGY PART I: KEYSER MARSTON ASSOCIATES ANALYSIS ........................................................ 62
METHODOLOGY PART II: CALCULATION OF THE HOUSING AFFORDABILITY GAP ........................................ 79
APPENDIX 2: LITERATURE REVIEW ............................................................................................ 80
BIBLIOGRAPHY ............................................................................................................................ 93

Addressing the Housing Affordability Crisis in San Diego and Beyond
San Diego Housing Commission | November 25, 2015 | Page 4 of 96
List of Contributors and Reviewers
Local Leaders
San Diego Housing Commission
Richard C. Gentry, President and CEO
Debbie Ruane, Senior Vice President, Real Estate Division
Maria Velasquez, Senior Vice President, Communications & Legislative Affairs
Wendy Dewitt, Director, Business and Program Development
Ann Kern, Vice President, Housing Finance and Program Development
San Diego Jobs and Housing Coalition
Matt Adams, Vice President, Building Industry Association of San Diego
Theresa Andrews, Interim President & CEO, San Diego County Taxpayers Association
Craig Benedetto, Principal, California Strategies
Stefanie Benvenuto, Policy Analyst, San Diego Regional Chamber of Commerce
Aimee Fawcett, COO, San Diego Regional Chamber of Commerce
Jerry Sanders, President and CEO, San Diego Regional Chamber of Commerce
Ken Sauder, President and CEO, Wakeland Housing & Development Corporation
James Schmid, CEO, Chelsea Investment Corporation
Ted Shaw, Board Member, NAIOP and Senior Land Use Consultant at Atlantis Group
City of San Diego
Jaymie Bradford, Deputy Chief of Staff for Mayor Kevin Faulconer
Elyse Lowe, Deputy Director, Development Services Department
Andrea Tevlin, Independent Budget Analyst
Holland & Knight
Jennifer Hernandez, Partner – West Coast Land Use and Environment
Keyser Marston Associates
Paul Marra, Managing Principal
Linnie Gavino, Manager
Napa County
Larry Florin, Director, Housing and Intergovernmental Affairs
Shea Homes Paul Barnes, Division President
Addressing the Housing Affordability Crisis in San Diego and Beyond
San Diego Housing Commission | November 25, 2015 | Page 5 of 96
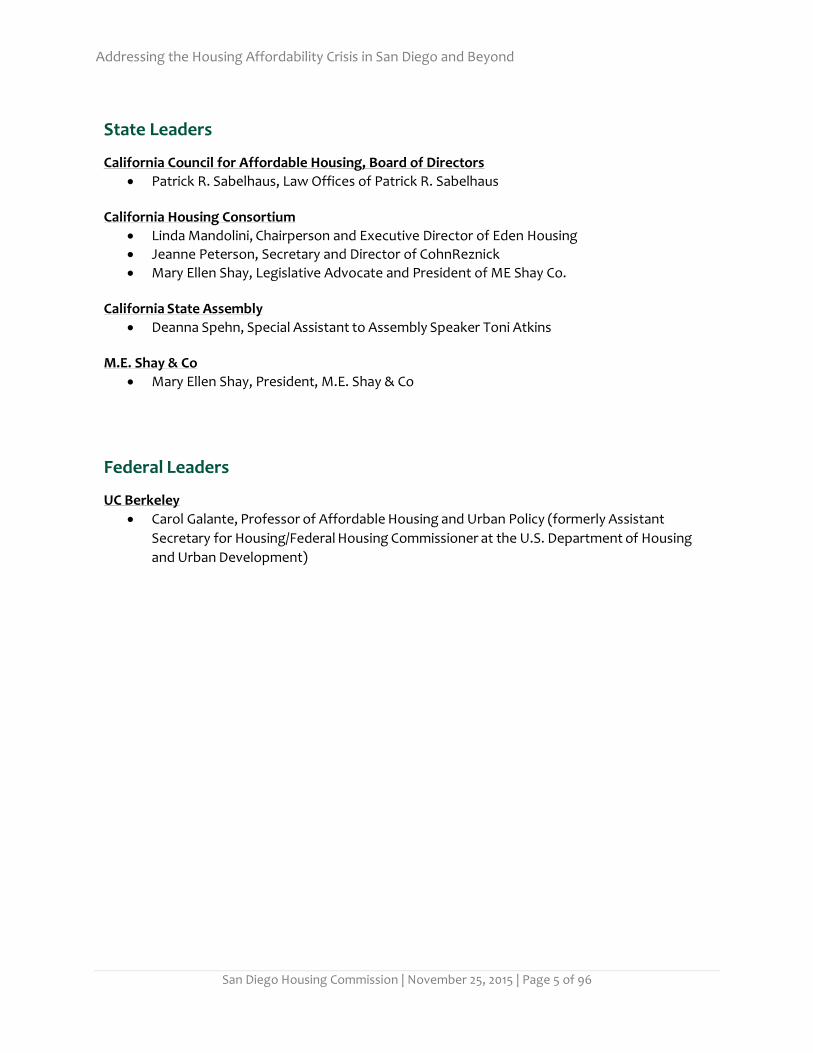
State Leaders
California Council for Affordable Housing, Board of Directors
Patrick R. Sabelhaus, Law Offices of Patrick R. Sabelhaus
California Housing Consortium
Linda Mandolini, Chairperson and Executive Director of Eden Housing
Jeanne Peterson, Secretary and Director of CohnReznick
Mary Ellen Shay, Legislative Advocate and President of ME Shay Co.
California State Assembly
Deanna Spehn, Special Assistant to Assembly Speaker Toni Atkins
M.E. Shay & Co
Mary Ellen Shay, President, M.E. Shay & Co
Federal Leaders
UC Berkeley
Carol Galante, Professor of Affordable Housing and Urban Policy (formerly Assistant
Secretary for Housing/Federal Housing Commissioner at the U.S. Department of Housing
and Urban Development)

Addressing the Housing Affordability Crisis in San Diego and Beyond
San Diego Housing Commission | November 25, 2015 | Page 6 of 96
Executive Summary
The San Diego Housing Commission Board and San Diego City Council are concerned about the rising
costs and inadequate supply of housing in San Diego. They have therefore directed the San Diego
Housing Commission to propose strategies to address the housing affordability crisis in San
Diego. This report has been commissioned to propose programmatic and tactical action steps that
can be moved forward for implementation and execution. This report outlines eleven action steps to
improve housing affordability in San Diego.
This report’s recommendations aim to boost production and reduce costs for both affordable and
market rate housing in San Diego. We estimate that these eleven action steps could reduce
development costs by the following amounts:
- A range of $36K to $174K per unit and up to $23 million total annually for affordable housing;
- A range of $23K to $51K per unit and up to $54 million total annually for market rate housing; and
- Up to $77 million annually on total housing development costs.
In San Diego and other major cities around the globe, the demand for housing is growing much
faster than construction of new units.1 As the supply of housing fails to keep up with demand, the
price is continually bid higher for both rentals and home ownership, making housing increasingly
unaffordable for San Diegans across the income spectrum. This report finds that nearly 50% of San
Diegans face housing affordability challenges in rentals and homeownership, and over 70% of San
Diegans are priced out of the homeownership market.
The SANDAG Regional Growth Assessment estimates that San Diego will need to produce 161,980
more units of housing from 2010 through 2020. This includes 67,220 high-income units, 30,610
moderate-income units and 64,150 low-income units. In the first four years of the projection period
(about 36% of the time period), San Diego has produced 31% of the high-income units needed, 4% of
the moderate-income units needed and 6% of the low-income units needed. Building permit
numbers show that the pipeline of new development significantly lags demand for housing in the
moderate-income and low-income segments. At the current pace, San Diego will produce only 10% of
needed moderate-income housing and 18% of needed low-income housing by the end of 2020.
Housing affordability impacts everyone. Households struggle to make ends meet. San Diegans
spend less money in other sectors as they struggle to pay for housing. Employers struggle to attract
1 SANDAG estimates that San Diego will need 161,980 new units of housing to be produced from 2010 through 2020 based on population growth, job growth and other economic data. As of the end of 2013, only 17% of the estimated need is permitted for production. San Diego Association of Governments Regional Housing Progress Report 2003 to 2013, March 20, 2015. http://www.sandag.org/uploads/publicationid/publicationid_1928_18891.pdf. (Accessed 09/27/2015).

Addressing the Housing Affordability Crisis in San Diego and Beyond
San Diego Housing Commission | November 25, 2015 | Page 7 of 96
and retain a talented workforce due to high housing costs. We estimate that the City of San Diego
has a housing affordability gap of $2.4 billion annually, creating a 2.5% annual drag on local GDP.
Housing affordability is a public policy challenge globally, nationally, statewide in California and
locally in the City of San Diego. The City of San Diego is one of the most unaffordable housing
markets in the nation. Zillow recently surveyed nearly 300 cities and found San Diego to be one of
the most unaffordable six markets in the United States. Both renting and owning in San Diego are
increasingly out of reach for average families. The average home price in San Diego is $506,000
according to Zillow – affordable only with an income over $80,000 per year. The average two-
bedroom rental in San Diego is $1820 per month, affordable only with an income of $72,800 per year.
Median income in the City of San Diego is approximately $72,000.2
Affordability is disproportionately a burden for low-income households. Low-income and very low
income households face a severe shortage of affordable units and are disproportionately rent
burdened by housing costs, as the affordable housing shortages force them to consume more
expensive housing than they can afford. As of 2013 there were approximately 120,000 extremely low-
income families and only 20,000 affordable units available for them in San Diego.3 The pace of new
construction for very low income, low income and moderate-income units is lagging severely behind
the estimated need in San Diego for these types of housing from 2003 through 2020.4
This report proposes eleven action steps to reduce housing costs and boost production by applying
McKinsey’s framework for housing cost reduction to the San Diego market. McKinsey’s framework
includes four levers for cost reduction: (1) Unlock Land; (2) Reduce Construction Costs; (3) Reduce
Operations and Maintenance Costs; and (4) Reduce Financing Costs.5 Within this framework, local
housing policies, zoning and planning regulations are a crucial part of the analysis of constraints on
new housing production. This report examines local housing policies and regulations, as well as state
and national housing policies in making cost reduction recommendations. The report’s action
opportunities aim to reduce housing development costs and boost housing production of both
market rate and affordable units in San Diego.6
2 Zillow, http://www.zillow.com/research/6-least-affordable-rental-markets-9412/ (Accessed 08/08/2015). 3 See Appendix One to this report for calculations of the affordability gap and impact on GDP. 3 Urban Institute website, Mapping America’s rental crisis, http://datatools.urban.org/features/rental-housing-crisis-map/. (Accessed 09/12/2015). 4 San Diego Association of Governments Regional Housing Progress Report 2003 to 2013, March 20, 2015. 5 A blueprint for addressing the global affordable housing challenge. McKinsey Global Institute. 6 This report addresses both housing affordability and affordable housing. Housing affordability is generally defined based on the amount of household income spent on housing. If a family spends more than 30% of their income on housing, housing is considered unaffordable. The 30% affordability threshold has been used by McKinsey, Habitat for Humanity, the United States Treasury Department and United States Department of Housing and Urban Development (“HUD”) as an affordability threshold for housing costs. Affordable housing, to differentiate it from housing affordability, is housing targeting a specific income group, defined by HUD as below 80% of Area Median Income (“AMI”)6 and providing subsidies if necessary to make the rent payments affordable. Affordable housing is a key part of the housing supply problem, and must be included in a discussion of housing affordability issues writ large.

Addressing the Housing Affordability Crisis in San Diego and Beyond
San Diego Housing Commission | November 25, 2015 | Page 8 of 96
Producing more affordable and market rate housing at a reasonable cost has the potential to boost
our local GDP, reduce income inequality, improve government efficiency and enhance well-being for
all San Diegans. Making housing affordable should be a key priority for all stakeholders in San Diego.
Report Methodology
This report begins by recommending eleven action opportunities to improve housing affordability
with specific action steps and timelines for implementation. The report provides illustrative
estimates of the potential cost containment and housing production impact of these
recommendations where possible. The goal of the report is that the progress of these action steps
will be tracked over time. After outlining the eleven recommendations and illustrative cost savings,
the report analyzes the San Diego housing market and key local economic indicators to provide a
baseline for housing affordability in San Diego today.
In developing the analysis and recommendations, we conducted a review of a wide array of recent
reports on housing affordability published by academia, think tanks, government agencies, trade
groups and the private sector. The analysis of the drag on San Diego GDP caused by unaffordable
housing is based on McKinsey’s methodology published in A blueprint for addressing the global
affordable housing challenge.7 We have included a summary of many of the most relevant reports
that we reviewed in the Literature Review in Appendix Two to this report.
This report focuses on new multifamily housing production, specifically containing costs and
increasing production of new housing, both market rate and affordable. There are many other
important housing affordability strategies that are not addressed in this report. For example, this
report does not discuss housing preservation strategies such as purchasing covenants, rehabilitation
and accessory dwelling units. It also does not include important work on increasing density of single-
family housing lots. This report does include a section with each of the eleven action
recommendations entitled “Other Innovative Ideas.” This section includes ideas that were
suggested by readers and reviewers of this paper that are not fully vetted. However, we wanted to
capture reviewers’ thoughts and feedback, and as many innovative ideas related to our eleven
recommendations as possible.
Report Structure
This report includes four sections and two appendices. The first section is the Introduction where we
frame the housing affordability problem in San Diego in more detail. In Section Two the report
describes the actionable opportunities at the local, state and federal levels for improving housing
affordability. This section includes detailed descriptions of each of the eleven action opportunities
recommended in the report. In Section Three, the report analyzes the consequences of not
7 Jonathan Woetzel, Sangeeth Ram, Jan Mischke, Nicklas Garemo and Shirish Sankhe. A blueprint for addressing the global affordable housing challenge. McKinsey Global Institute. October 2014.
Addressing the Housing Affordability Crisis in San Diego and Beyond
San Diego Housing Commission | November 25, 2015 | Page 9 of 96
addressing housing affordability, including the negative impact on GDP. The fourth section applies
the McKinsey framework for housing cost reduction to San Diego’s rental and homeownership
markets.8 Appendix 1 includes a description of the methodology used in calculating the illustrative
cost impact of the eleven recommendations and the key metrics of housing affordability used in the
report. Appendix 2 is a literature review including summaries of some of the key sources reviewed
in compiling this report.
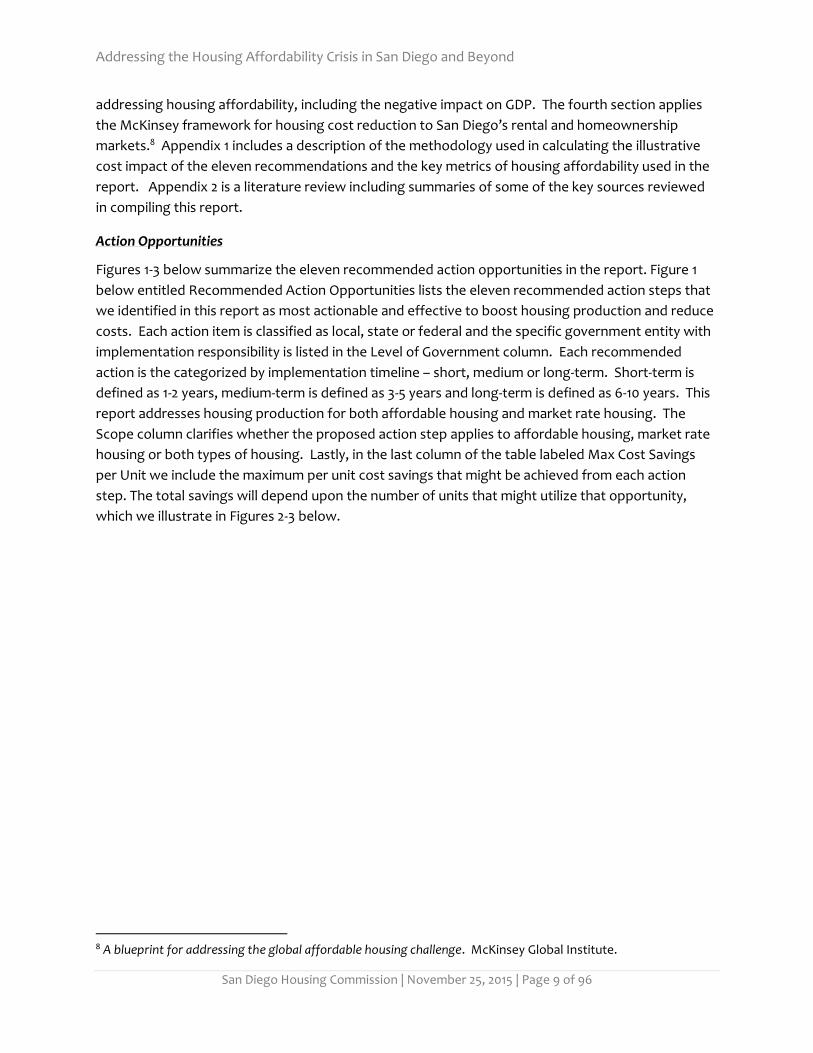
Action Opportunities
Figures 1-3 below summarize the eleven recommended action opportunities in the report. Figure 1
below entitled Recommended Action Opportunities lists the eleven recommended action steps that
we identified in this report as most actionable and effective to boost housing production and reduce
costs. Each action item is classified as local, state or federal and the specific government entity with
implementation responsibility is listed in the Level of Government column. Each recommended
action is the categorized by implementation timeline – short, medium or long-term. Short-term is
defined as 1-2 years, medium-term is defined as 3-5 years and long-term is defined as 6-10 years. This
report addresses housing production for both affordable housing and market rate housing. The
Scope column clarifies whether the proposed action step applies to affordable housing, market rate
housing or both types of housing. Lastly, in the last column of the table labeled Max Cost Savings
per Unit we include the maximum per unit cost savings that might be achieved from each action
step. The total savings will depend upon the number of units that might utilize that opportunity,
which we illustrate in Figures 2-3 below.
8 A blueprint for addressing the global affordable housing challenge. McKinsey Global Institute.

Addressing the Housing Affordability Crisis in San Diego and Beyond
San Diego Housing Commission | November 25, 2015 | Page 10 of 96
Figure 1: Proposed Action Opportunities
Recommended Action Opportunities
Proposed Action Level of
Government Timeline Scope
Max Cost Savings Per Unit
1. Set Annual Housing Production Goals Local
City Council Short Term
Affordable & Market
N/A
2. Incentivize more 80/20 developments Local
City Council SDHC
Short Term
Affordable $85,000
3. Defer Development Fees Local
City Council Short Term
Affordable & Market
$6,000
4. Reduce Parking Requirements Local
City Council SDHC
Short Term
Affordable & Market
$10,000
5. Reduce Commercial Space Requirements
Local City Council
SDHC Short Term
Affordable & Market
$19,000
6. Unlock Land & Increase Ground Leases
Local City Council
SDHC Short Term
Affordable
$39,000
7. Shorten Entitlement Process Local
City Council
Short Term
Affordable & Market
$9,000
8. Approve Community Plans with Master EIRs
Local City Council
Long Term
Affordable & Market
$6,000
9. Support CEQA Reform
State Local
Medium Term
Affordable & Market
N/A
10. Align State Oversight State
Governor/ Treasurer
Medium Term
Affordable
N/A
11. Increase State and Federal Resources
State Federal
Congress HUD
Medium Term
Affordable
N/A
Addressing the Housing Affordability Crisis in San Diego and Beyond
San Diego Housing Commission | November 25, 2015 | Page 11 of 96
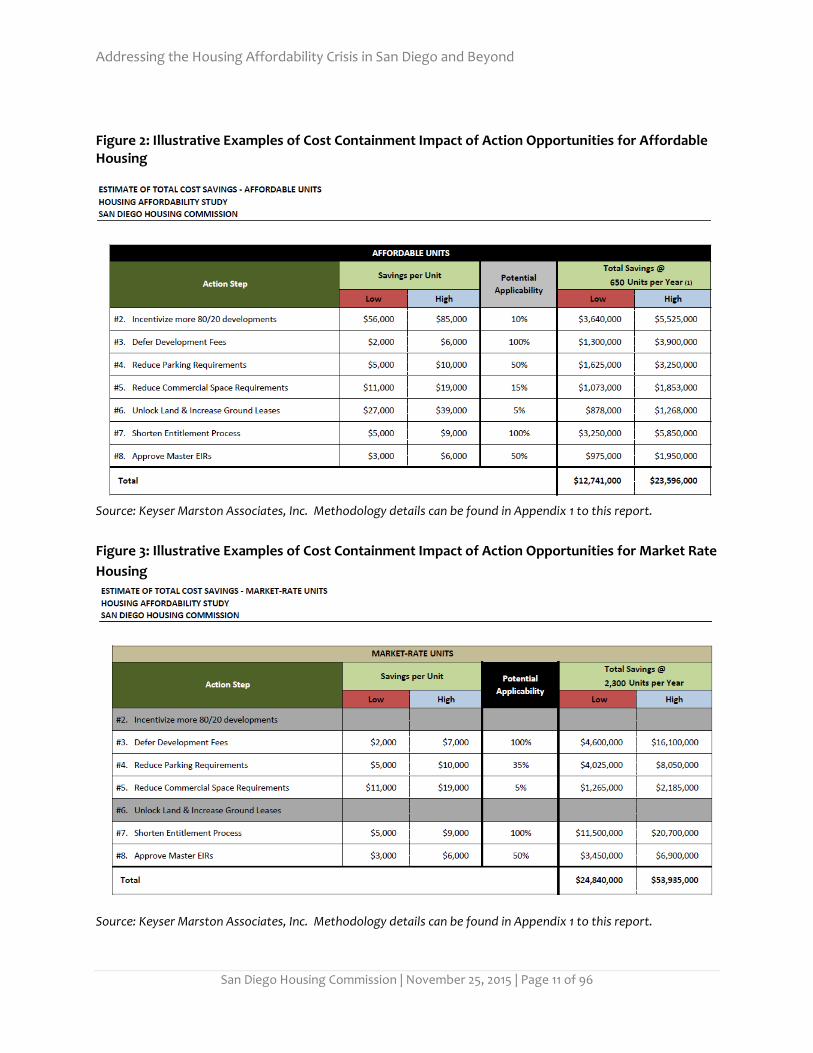
Figure 2: Illustrative Examples of Cost Containment Impact of Action Opportunities for Affordable Housing
Source: Keyser Marston Associates, Inc. Methodology details can be found in Appendix 1 to this report.
Figure 3: Illustrative Examples of Cost Containment Impact of Action Opportunities for Market Rate
Housing
Source: Keyser Marston Associates, Inc. Methodology details can be found in Appendix 1 to this report.

Addressing the Housing Affordability Crisis in San Diego and Beyond
San Diego Housing Commission | November 25, 2015 | Page 12 of 96
I. Introduction
Housing affordability impacts everyone. San Diego has a housing affordability gap equal to roughly
2.5% of city GDP9 – expenditures that would otherwise go toward growing our local economy and
producing local jobs. Low-Income families are particularly hard hit as housing costs rise, and there is
an even greater shortage of units available to serve low-income groups.10 Over one-third of San
Diegans struggle to make ends meet.11 Others are forced to make difficult decisions among
commute time, proximity to essential services, and paying for necessities such as food and medicine.
Employers struggle to attract and retain a qualified workforce due to San Diego’s high housing costs.
San Diego’s unaffordable and rising housing costs are creating an urgent crisis for residents and
businesses and limiting the growth potential of our city.
Housing affordability impacts everyone. Over the past five years, San Diego has seen positive
economic and employment growth.12 With this economic and employment growth, the population
has increased. Production of new housing has not kept up with rising demand over the past twenty
years,13 and housing costs have risen sharply over the same period.14 Housing costs are the largest
component of living expenses for most families in the United States.15 Unaffordable housing costs
reduce disposable income that would otherwise be spent in the local economy, supporting local
businesses and growing GDP. In addition, producing additional housing will be a net boon to the
local economy. High housing costs also impose significant adverse impacts on employers and the
business community. Employers struggle to attract and retain the necessary workforce when
employees cannot afford to live within a reasonable commuting range of their workplaces.
In a recent study the Fermanian Institute at Point Loma Nazarene University estimates that a
relatively modest 3% reduction in the regulatory cost of San Diego’s housing could open up housing
alternatives to approximately 6,750 additional households and reverse the city’s recent trend of net
domestic out-migration of about 11,000 residents per year to a net positive inflow of about 7,000.16
In addition, according to the Fermanian Institute, the economic benefits of the resulting increase in
homebuilding would be substantial. After including all of the ripple or multiplier effects, the
Fermanian Institute estimates the benefits of the resulting increase in homebuilding in San Diego as
9 See Appendix 1 for calculations of the affordability gap and impact on GDP. 10 Urban Institute website, Mapping America’s rental crisis, http://datatools.urban.org/features/rental-housing-crisis-map/. (Accessed 09/12/2015). 11 Block, Betsy Baum, Henry Gascon, Peter Manzo and Adam D. Parker. 2015. Struggling To Get By: The Real Cost Measure in California 2015. United Way of California. 12 US Bureau of Labor Statistics. http://www.bls.gov/opub/ted/2015/percent-changes-in-average-hourly-earnings-for-largest-metro-areas-june-2014-to-june-2015.htm (Accessed 08/11/2015). 13 California Department of Finance; U 14 Zillow, http://files.zillowstatic.com/research/public/rental/ZRI.San%20Diego.395056.pdf (Access 08/11/2015)); Trulia, http://www.trulia.com/home_prices/California/San_Diego-heat_map/ (Accessed September 1, 2015), Jones Lasalle Lang estimates. 15 United Way of California. Struggling To Get By: The Real Cost Measure in California 2015. 16 Opening San Diego’s Door to Lower Housing Costs. Fermanian Business and Economic Institute at Point Loma Nazarene University. 2015.
Addressing the Housing Affordability Crisis in San Diego and Beyond
San Diego Housing Commission | November 25, 2015 | Page 13 of 96
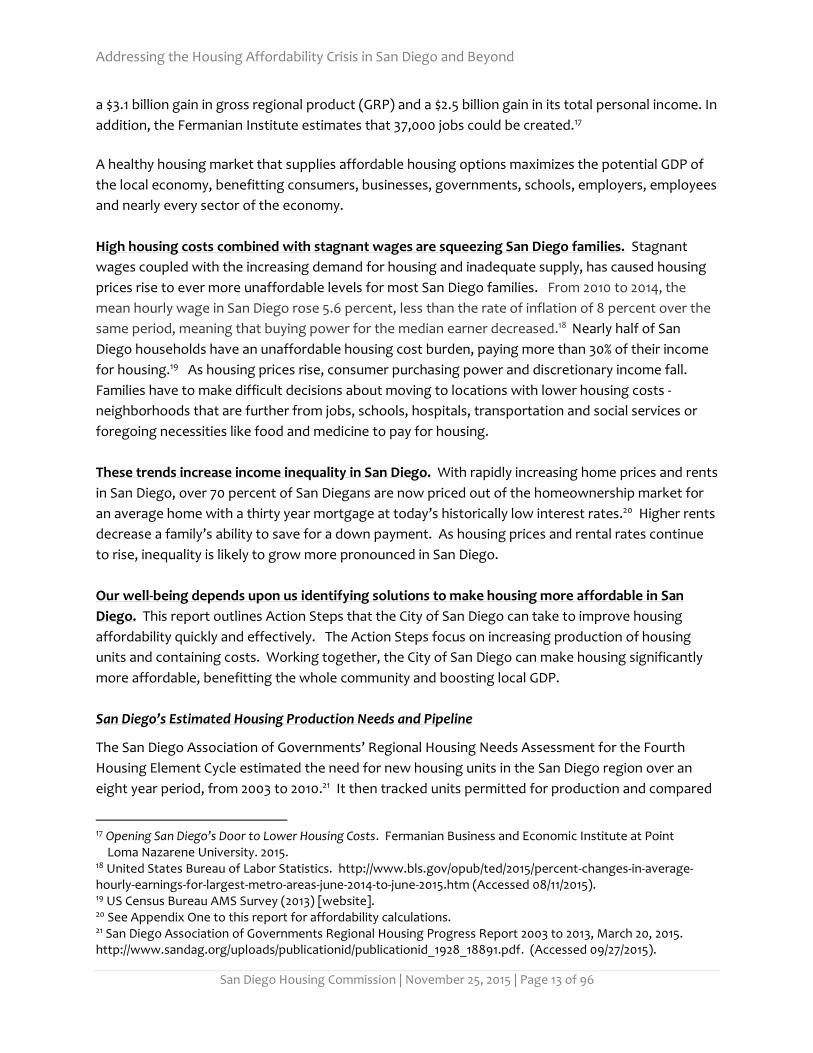
a $3.1 billion gain in gross regional product (GRP) and a $2.5 billion gain in its total personal income. In
addition, the Fermanian Institute estimates that 37,000 jobs could be created.17
A healthy housing market that supplies affordable housing options maximizes the potential GDP of
the local economy, benefitting consumers, businesses, governments, schools, employers, employees
and nearly every sector of the economy.
High housing costs combined with stagnant wages are squeezing San Diego families. Stagnant
wages coupled with the increasing demand for housing and inadequate supply, has caused housing
prices rise to ever more unaffordable levels for most San Diego families. From 2010 to 2014, the
mean hourly wage in San Diego rose 5.6 percent, less than the rate of inflation of 8 percent over the
same period, meaning that buying power for the median earner decreased.18 Nearly half of San
Diego households have an unaffordable housing cost burden, paying more than 30% of their income
for housing.19 As housing prices rise, consumer purchasing power and discretionary income fall.
Families have to make difficult decisions about moving to locations with lower housing costs -
neighborhoods that are further from jobs, schools, hospitals, transportation and social services or
foregoing necessities like food and medicine to pay for housing.
These trends increase income inequality in San Diego. With rapidly increasing home prices and rents
in San Diego, over 70 percent of San Diegans are now priced out of the homeownership market for
an average home with a thirty year mortgage at today’s historically low interest rates.20 Higher rents
decrease a family’s ability to save for a down payment. As housing prices and rental rates continue
to rise, inequality is likely to grow more pronounced in San Diego.
Our well-being depends upon us identifying solutions to make housing more affordable in San
Diego. This report outlines Action Steps that the City of San Diego can take to improve housing
affordability quickly and effectively. The Action Steps focus on increasing production of housing
units and containing costs. Working together, the City of San Diego can make housing significantly
more affordable, benefitting the whole community and boosting local GDP.
San Diego’s Estimated Housing Production Needs and Pipeline The San Diego Association of Governments’ Regional Housing Needs Assessment for the Fourth
Housing Element Cycle estimated the need for new housing units in the San Diego region over an
eight year period, from 2003 to 2010.21 It then tracked units permitted for production and compared
17 Opening San Diego’s Door to Lower Housing Costs. Fermanian Business and Economic Institute at Point Loma Nazarene University. 2015. 18 United States Bureau of Labor Statistics. http://www.bls.gov/opub/ted/2015/percent-changes-in-average-hourly-earnings-for-largest-metro-areas-june-2014-to-june-2015.htm (Accessed 08/11/2015). 19 US Census Bureau AMS Survey (2013) [website]. 20 See Appendix One to this report for affordability calculations. 21 San Diego Association of Governments Regional Housing Progress Report 2003 to 2013, March 20, 2015. http://www.sandag.org/uploads/publicationid/publicationid_1928_18891.pdf. (Accessed 09/27/2015).
Addressing the Housing Affordability Crisis in San Diego and Beyond
San Diego Housing Commission | November 25, 2015 | Page 14 of 96
that to the estimated needs. The needs assessment includes needs for housing in four income
groupings: (1) very low-income; (2) low income; (3) moderate income and (4) above moderate
income.
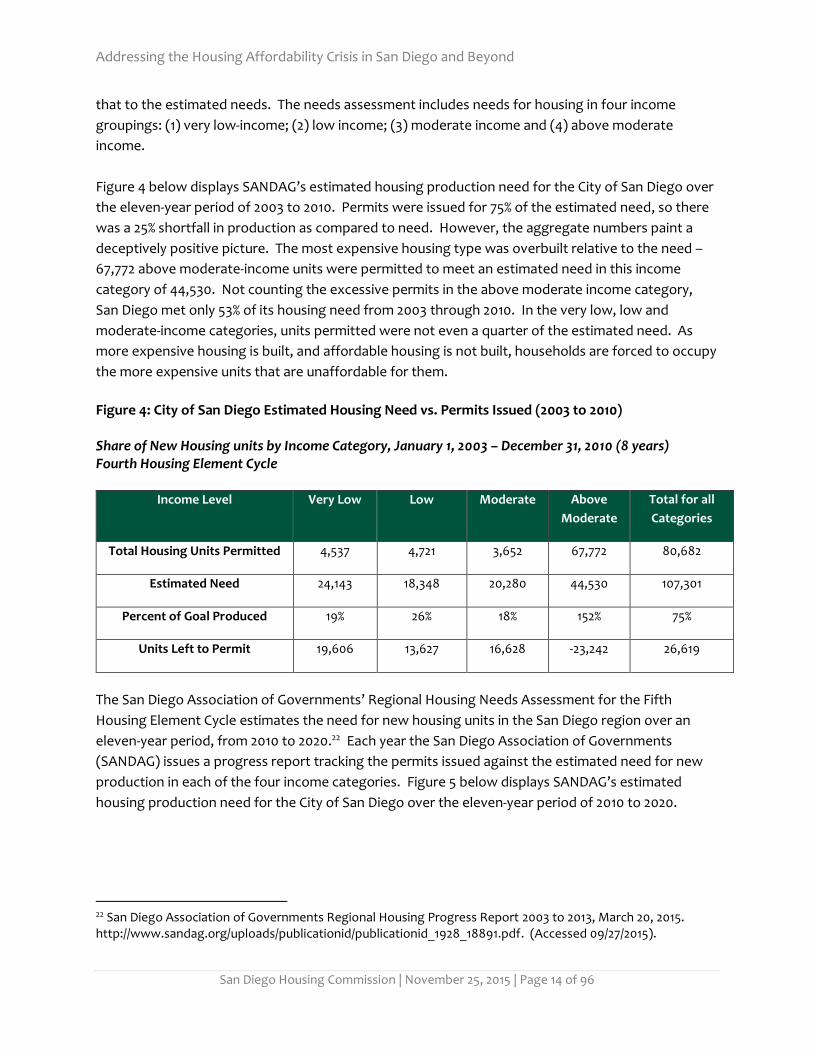
Figure 4 below displays SANDAG’s estimated housing production need for the City of San Diego over
the eleven-year period of 2003 to 2010. Permits were issued for 75% of the estimated need, so there
was a 25% shortfall in production as compared to need. However, the aggregate numbers paint a
deceptively positive picture. The most expensive housing type was overbuilt relative to the need –
67,772 above moderate-income units were permitted to meet an estimated need in this income
category of 44,530. Not counting the excessive permits in the above moderate income category,
San Diego met only 53% of its housing need from 2003 through 2010. In the very low, low and
moderate-income categories, units permitted were not even a quarter of the estimated need. As
more expensive housing is built, and affordable housing is not built, households are forced to occupy
the more expensive units that are unaffordable for them.
Figure 4: City of San Diego Estimated Housing Need vs. Permits Issued (2003 to 2010)
Share of New Housing units by Income Category, January 1, 2003 – December 31, 2010 (8 years) Fourth Housing Element Cycle
Income Level Very Low Low Moderate Above
Moderate
Total for all
Categories
Total Housing Units Permitted 4,537 4,721 3,652 67,772 80,682
Estimated Need 24,143 18,348 20,280 44,530 107,301
Percent of Goal Produced 19% 26% 18% 152% 75%
Units Left to Permit 19,606 13,627 16,628 -23,242 26,619
The San Diego Association of Governments’ Regional Housing Needs Assessment for the Fifth
Housing Element Cycle estimates the need for new housing units in the San Diego region over an
eleven-year period, from 2010 to 2020.22 Each year the San Diego Association of Governments
(SANDAG) issues a progress report tracking the permits issued against the estimated need for new
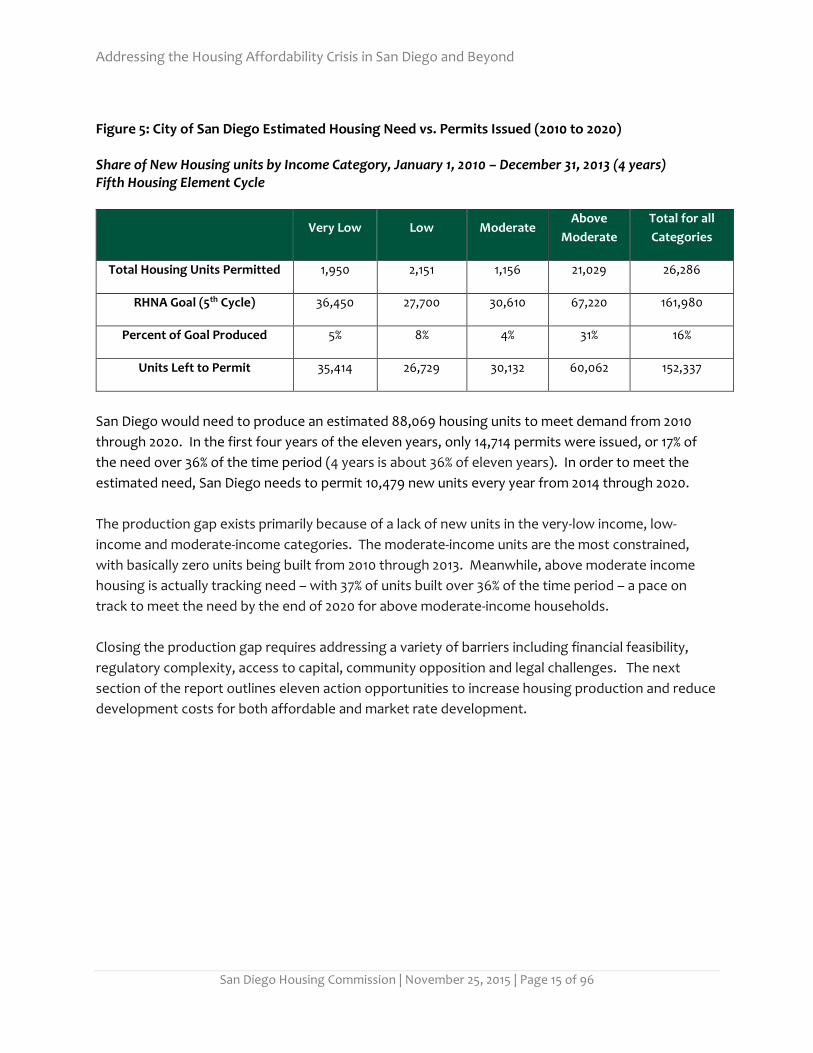
production in each of the four income categories. Figure 5 below displays SANDAG’s estimated
housing production need for the City of San Diego over the eleven-year period of 2010 to 2020.
22 San Diego Association of Governments Regional Housing Progress Report 2003 to 2013, March 20, 2015. http://www.sandag.org/uploads/publicationid/publicationid_1928_18891.pdf. (Accessed 09/27/2015).
Addressing the Housing Affordability Crisis in San Diego and Beyond
San Diego Housing Commission | November 25, 2015 | Page 15 of 96
Figure 5: City of San Diego Estimated Housing Need vs. Permits Issued (2010 to 2020) Share of New Housing units by Income Category, January 1, 2010 – December 31, 2013 (4 years) Fifth Housing Element Cycle
Very Low Low Moderate Above
Moderate
Total for all
Categories
Total Housing Units Permitted 1,950 2,151 1,156 21,029 26,286
RHNA Goal (5th Cycle) 36,450 27,700 30,610 67,220 161,980
Percent of Goal Produced 5% 8% 4% 31% 16%
Units Left to Permit 35,414 26,729 30,132 60,062 152,337
San Diego would need to produce an estimated 88,069 housing units to meet demand from 2010
through 2020. In the first four years of the eleven years, only 14,714 permits were issued, or 17% of
the need over 36% of the time period (4 years is about 36% of eleven years). In order to meet the
estimated need, San Diego needs to permit 10,479 new units every year from 2014 through 2020.
The production gap exists primarily because of a lack of new units in the very-low income, low-
income and moderate-income categories. The moderate-income units are the most constrained,
with basically zero units being built from 2010 through 2013. Meanwhile, above moderate income
housing is actually tracking need – with 37% of units built over 36% of the time period – a pace on
track to meet the need by the end of 2020 for above moderate-income households.
Closing the production gap requires addressing a variety of barriers including financial feasibility,
regulatory complexity, access to capital, community opposition and legal challenges. The next
section of the report outlines eleven action opportunities to increase housing production and reduce
development costs for both affordable and market rate development.

Addressing the Housing Affordability Crisis in San Diego and Beyond
San Diego Housing Commission | November 25, 2015 | Page 16 of 96
II. Actionable Opportunities
Action Steps to Contain Costs and Boost Production at the Local, State &
National Levels
In this section we outline the report’s recommended action steps at the City, State and Federal levels
that will increase production and reduce costs of market rate and affordable housing.
We classify these action steps as short-term, medium-term and long-term to describe the
implementation timeline for each proposal. Short-term is defined as 1 to 2 years, Medium-term is
defined as 3 to 5 years and Long-term is defined as 5 to 10 years.
We also categorize the applicability of each action step – whether it applies to affordable housing,
market rate housing or both.
Where it is possible to quantify the impact of the action step on the cost and production of housing,
we have done so and included those numerical estimates in the detailed action step summaries.
For each recommended action opportunity, we have created a detailed description of the
opportunity including background, benefits, risks, key stakeholders, San Diego Housing Commission
role, implementation timeline and underlying policy framework.
The actionable opportunities identified in this report are the highest impact actions that are
pragmatic and attainable in a reasonable timeframe. The majority of recommended opportunities
are actions that can be implemented at the local level in the short term.

Addressing the Housing Affordability Crisis in San Diego and Beyond
San Diego Housing Commission | November 25, 2015 | Page 17 of 96
Action Opportunities for San Diego Housing Market
Opportunity Proposed Action Level of
Government Timeline Scope
1. Set Annual Housing Production Goals
City Council sets annual housing production goals and publishes annual scorecard tracking progress against the goal.
Local City Council
Short Term
Affordable & Market
2. Incentivize more 80/20 developments
SDHC and/or City Council incentivize 80/20 developments to produce more affordable units at lower cost, utilize unused 4% credits and lower subsidy from SDHC.
Local City Council
SDHC
Short Term
Affordable
3. Defer Development Fees
City of San Diego implements a policy that builds on existing deferral programs to defer more development fees until Temporary Certificate of Occupancy is issued.
Local City Council
Short Term
Affordable & Market
4. Reduce Parking Requirements
City and SDHC further reduce parking requirements by amending the City’s Land Development Code to include maximums rather than minimums.
Local City Council
SDHC
Short Term
Affordable & Market
5. Reduce Commercial Space Requirements
City and SDHC reduce ground floor commercial space requirements by amending the City’s Land Development Code.
Local City Council
SDHC
Short Term
Affordable & Market
6. Unlock Land & Increase Ground Leases
SDHC, City and local agencies inventory land, increase ground leases of land to affordable housing developers at below market rates or at nominal cost and make regulatory changes to unlock land for market rate housing.
Local City Council
SDHC
Short Term
Affordable
7. Shorten Entitlement Process
Mayor directs development services to streamline entitlement process, including implementing conceptual review and online processing of approvals.
Local City Council
Short Term
Affordable & Market
8. Approve Community Plans with Master EIRs
City Council expedites Community Plan Updates and requires completion of Master EIRs as part of process.
Local City Council
Long Term
Affordable & Market
9. Support CEQA Reform
State legislation to streamline California Environmental Quality Act (CEQA) for Infill Projects. City Council action to amend local CEQA thresholds.
State Local
Medium Term
Affordable & Market
10. Align State Oversight
Ad hoc committee issues recommendations to align the five state housing oversight agencies and policy processes.
State Governor/ Treasurer
Medium Term
Affordable
11. Increase State and Federal Resources
Fair Share of Continuum of Care Recommend a formula change to ensure San Diego gets fair share of homelessness funds. Expand LIHTC to support development and preservation of affordable housing. Increase Federal Rental Assistance for affordable housing. Enact Moving to Work Authority to support people transitioning back to employment.
State Federal
Congress HUD
Medium Term
Affordable
Addressing the Housing Affordability Crisis in San Diego and Beyond
San Diego Housing Commission | November 25, 2015 | Page 18 of 96
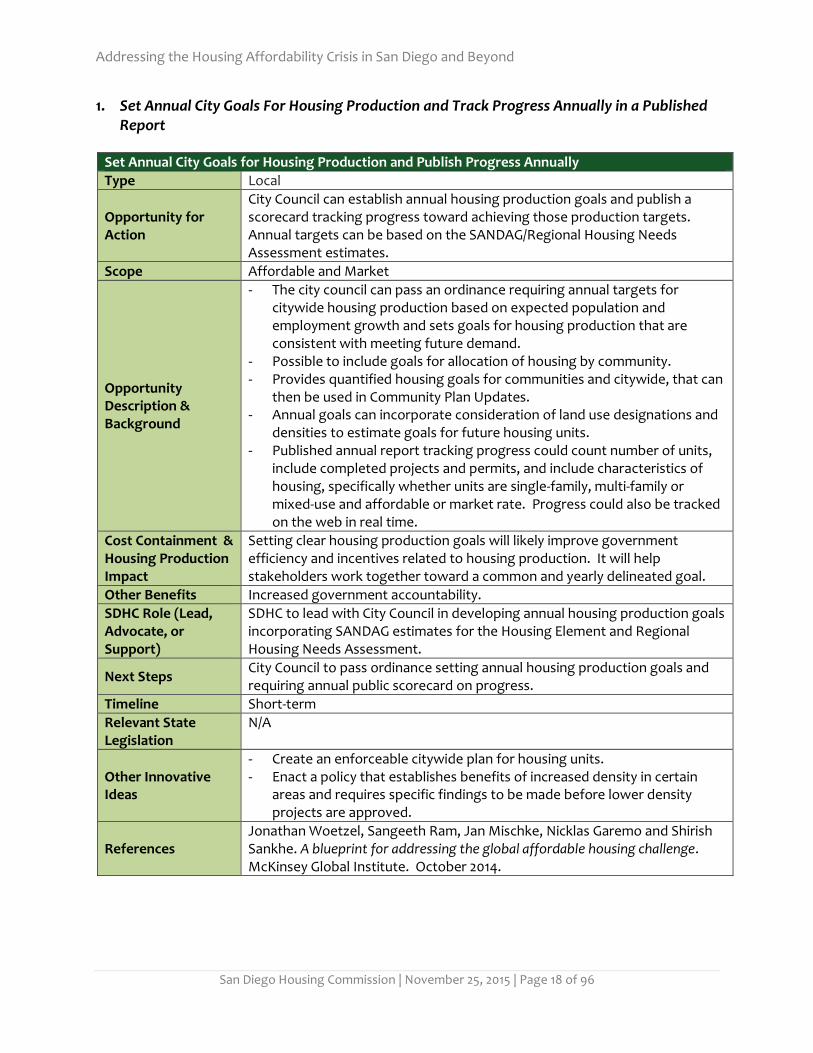
1. Set Annual City Goals For Housing Production and Track Progress Annually in a Published Report
Set Annual City Goals for Housing Production and Publish Progress Annually
Type Local
Opportunity for Action
City Council can establish annual housing production goals and publish a scorecard tracking progress toward achieving those production targets. Annual targets can be based on the SANDAG/Regional Housing Needs Assessment estimates.
Scope Affordable and Market
Opportunity Description & Background
- The city council can pass an ordinance requiring annual targets for citywide housing production based on expected population and employment growth and sets goals for housing production that are consistent with meeting future demand.
- Possible to include goals for allocation of housing by community. - Provides quantified housing goals for communities and citywide, that can
then be used in Community Plan Updates. - Annual goals can incorporate consideration of land use designations and
densities to estimate goals for future housing units. - Published annual report tracking progress could count number of units,
include completed projects and permits, and include characteristics of housing, specifically whether units are single-family, multi-family or mixed-use and affordable or market rate. Progress could also be tracked on the web in real time.
Cost Containment & Housing Production Impact
Setting clear housing production goals will likely improve government efficiency and incentives related to housing production. It will help stakeholders work together toward a common and yearly delineated goal.
Other Benefits Increased government accountability.
SDHC Role (Lead, Advocate, or Support)
SDHC to lead with City Council in developing annual housing production goals incorporating SANDAG estimates for the Housing Element and Regional Housing Needs Assessment.
Next Steps City Council to pass ordinance setting annual housing production goals and requiring annual public scorecard on progress.
Timeline Short-term
Relevant State Legislation
N/A
Other Innovative Ideas
- Create an enforceable citywide plan for housing units. - Enact a policy that establishes benefits of increased density in certain
areas and requires specific findings to be made before lower density projects are approved.
References Jonathan Woetzel, Sangeeth Ram, Jan Mischke, Nicklas Garemo and Shirish Sankhe. A blueprint for addressing the global affordable housing challenge. McKinsey Global Institute. October 2014.
Addressing the Housing Affordability Crisis in San Diego and Beyond
San Diego Housing Commission | November 25, 2015 | Page 19 of 96
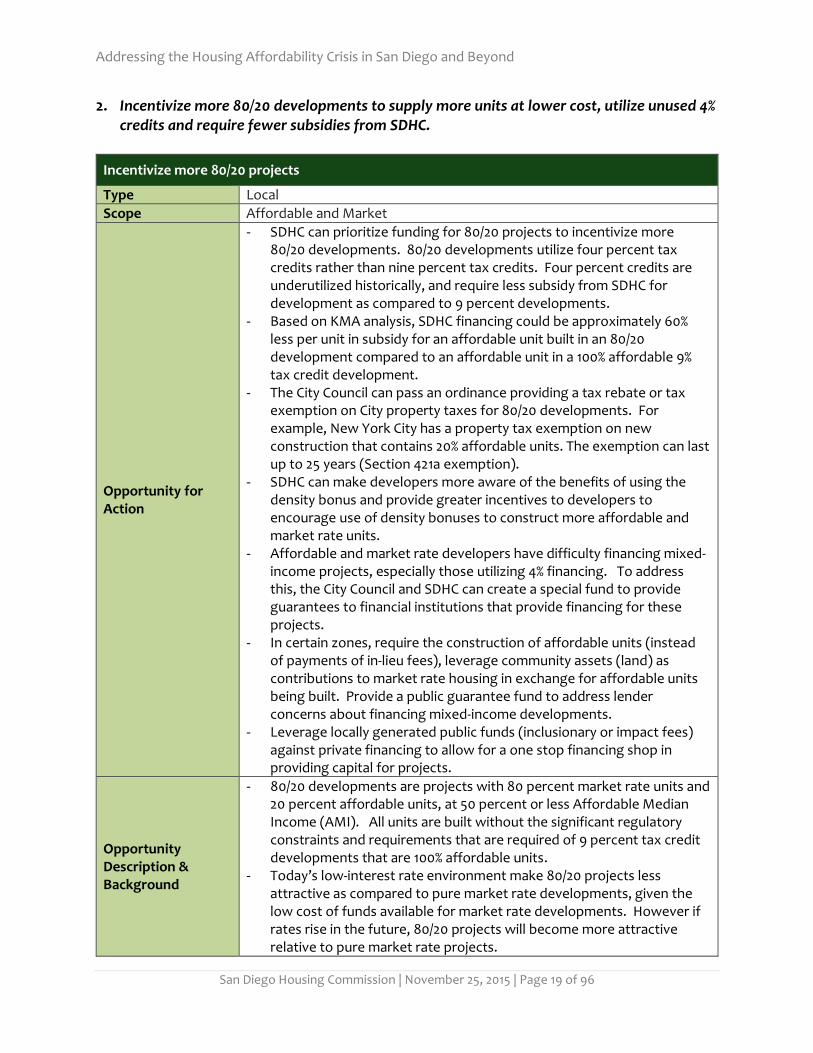
2. Incentivize more 80/20 developments to supply more units at lower cost, utilize unused 4% credits and require fewer subsidies from SDHC.
Incentivize more 80/20 projects
Type Local Scope Affordable and Market
Opportunity for Action
- SDHC can prioritize funding for 80/20 projects to incentivize more 80/20 developments. 80/20 developments utilize four percent tax credits rather than nine percent tax credits. Four percent credits are underutilized historically, and require less subsidy from SDHC for development as compared to 9 percent developments.
- Based on KMA analysis, SDHC financing could be approximately 60% less per unit in subsidy for an affordable unit built in an 80/20 development compared to an affordable unit in a 100% affordable 9% tax credit development.
- The City Council can pass an ordinance providing a tax rebate or tax exemption on City property taxes for 80/20 developments. For example, New York City has a property tax exemption on new construction that contains 20% affordable units. The exemption can last up to 25 years (Section 421a exemption).
- SDHC can make developers more aware of the benefits of using the density bonus and provide greater incentives to developers to encourage use of density bonuses to construct more affordable and market rate units.
- Affordable and market rate developers have difficulty financing mixed-income projects, especially those utilizing 4% financing. To address this, the City Council and SDHC can create a special fund to provide guarantees to financial institutions that provide financing for these projects.
- In certain zones, require the construction of affordable units (instead of payments of in-lieu fees), leverage community assets (land) as contributions to market rate housing in exchange for affordable units being built. Provide a public guarantee fund to address lender concerns about financing mixed-income developments.
- Leverage locally generated public funds (inclusionary or impact fees) against private financing to allow for a one stop financing shop in providing capital for projects.
Opportunity Description & Background
- 80/20 developments are projects with 80 percent market rate units and 20 percent affordable units, at 50 percent or less Affordable Median Income (AMI). All units are built without the significant regulatory constraints and requirements that are required of 9 percent tax credit developments that are 100% affordable units.
- Today’s low-interest rate environment make 80/20 projects less attractive as compared to pure market rate developments, given the low cost of funds available for market rate developments. However if rates rise in the future, 80/20 projects will become more attractive relative to pure market rate projects.
Addressing the Housing Affordability Crisis in San Diego and Beyond
San Diego Housing Commission | November 25, 2015 | Page 20 of 96
Incentivize more 80/20 projects
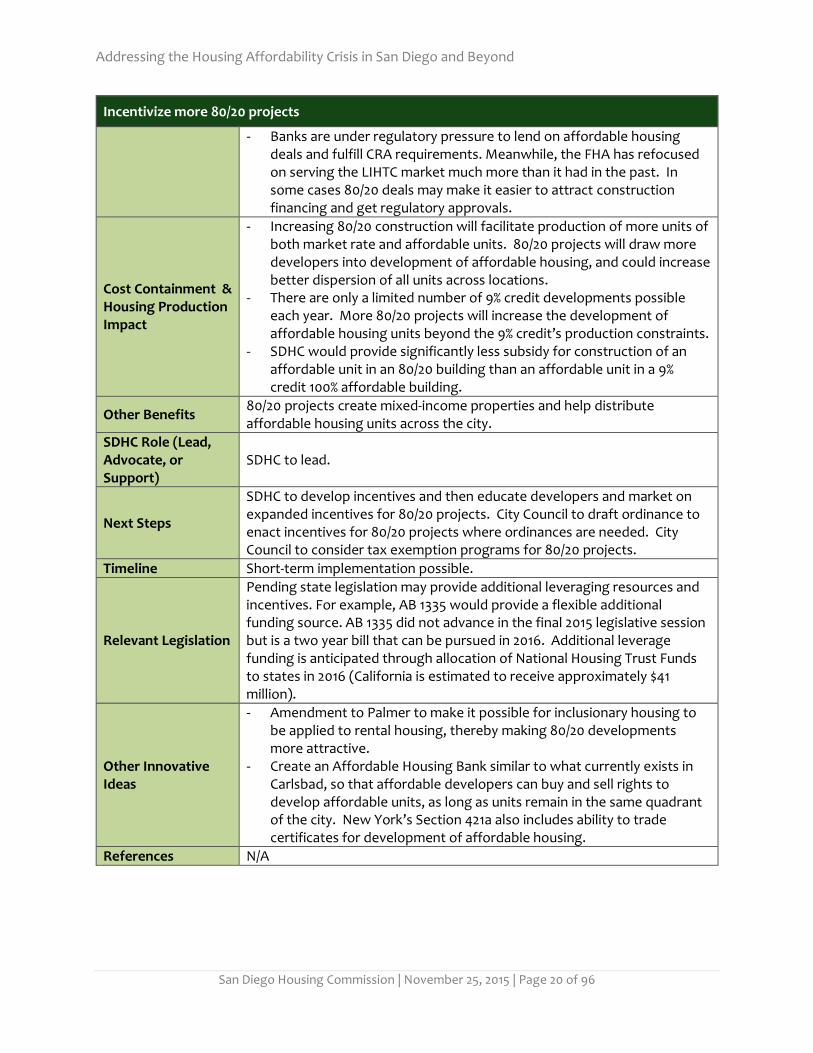
- Banks are under regulatory pressure to lend on affordable housing deals and fulfill CRA requirements. Meanwhile, the FHA has refocused on serving the LIHTC market much more than it had in the past. In some cases 80/20 deals may make it easier to attract construction financing and get regulatory approvals.
Cost Containment & Housing Production Impact
- Increasing 80/20 construction will facilitate production of more units of both market rate and affordable units. 80/20 projects will draw more developers into development of affordable housing, and could increase better dispersion of all units across locations.
- There are only a limited number of 9% credit developments possible each year. More 80/20 projects will increase the development of affordable housing units beyond the 9% credit’s production constraints.
- SDHC would provide significantly less subsidy for construction of an affordable unit in an 80/20 building than an affordable unit in a 9% credit 100% affordable building.
Other Benefits 80/20 projects create mixed-income properties and help distribute affordable housing units across the city.
SDHC Role (Lead, Advocate, or Support)
SDHC to lead.
Next Steps SDHC to develop incentives and then educate developers and market on expanded incentives for 80/20 projects. City Council to draft ordinance to enact incentives for 80/20 projects where ordinances are needed. City Council to consider tax exemption programs for 80/20 projects.
Timeline Short-term implementation possible.
Relevant Legislation
Pending state legislation may provide additional leveraging resources and incentives. For example, AB 1335 would provide a flexible additional funding source. AB 1335 did not advance in the final 2015 legislative session but is a two year bill that can be pursued in 2016. Additional leverage funding is anticipated through allocation of National Housing Trust Funds to states in 2016 (California is estimated to receive approximately $41 million).
Other Innovative Ideas
- Amendment to Palmer to make it possible for inclusionary housing to be applied to rental housing, thereby making 80/20 developments more attractive.
- Create an Affordable Housing Bank similar to what currently exists in Carlsbad, so that affordable developers can buy and sell rights to develop affordable units, as long as units remain in the same quadrant of the city. New York’s Section 421a also includes ability to trade certificates for development of affordable housing.
References N/A

Addressing the Housing Affordability Crisis in San Diego and Beyond
San Diego Housing Commission | November 25, 2015 | Page 21 of 96
3. City and SDHC implement a policy that defers development and permit fees until Temporary Certificate of Occupancy is issued.
Defer All Development Fees
Type Local
Scope Affordable and Market
Opportunity for Action
Building on already existing fee deferral programs, City implements a policy that defers additional fees, including: impact fees, fire, water fees, sewer fees and school fees as well as permit fees until Temporary Certificate of Occupancy is issued.
Opportunity Description & Background
There is a current development fee deferment program in San Diego that has had a positive impact in lessening housing production costs. Deferral of additional development fees and permit fees will further reduce financing costs for developers by delaying additional costs and allowing developers to benefit from the time value of money. We recommend deferral of impact fees, fire, water fees, sewer fees and school fees as well as permit fees until Temporary Certificate of Occupancy is issued.
Cost Containment & Housing Production Impact
Reduces the costs of affordable development by reducing financing costs.
Other Benefits Easy to implement with clear threshold required for collection of fees.
SDHC Role (Lead, Advocate, or Support)
- SDHC to lead by proposing this change to the City Council. - Consultation with the Development Services Department and IBA to
facilitate ease of execution.
Next Steps
- SDHC to propose changes to the City Council. - City Council to prepare motion to defer impact fees, fire, water fees,
sewer fees and school fees as well as permit fees until the Temporary Certificate of Occupancy is issued.
Timeline Short-term implementation is possible.
Relevant Legislation N/A
Other Innovative Ideas
- Where possible allow fees to be paid out of residual cash flow of projects - Extend deferral of fees beyond Certificate of Occupancy to Close of
Escrow - Deferral of school fees until stabilization of rental projects or sale of
homeownership units.
References San Diego Development Services Department website.

Addressing the Housing Affordability Crisis in San Diego and Beyond
San Diego Housing Commission | November 25, 2015 | Page 22 of 96
4. Reduce parking requirements for affordable and market rate developments
Reduce Parking Requirements
Type Local
Scope Affordable and Market
Opportunity for Action
City has already taken effective action to reduce parking requirements for affordable projects. We recommend building upon that success. Current reduced parking requirements for affordable housing should be extended to apply to market rate housing. In addition, the City and SDHC can further reduce parking requirements by amending the City’s Land Development Code to include parking maximums rather than parking minimums. We recommend that additional reduced parking requirements apply to both affordable and market rate housing.
Opportunity Description & Background
Parking requirements have been significantly reduced for affordable developments by prior policy changes in San Diego. These changes have been effective in reducing affordable development costs. However, parking remains a major project expense, particularly podium or subterranean parking. Recommend additional creative parking solutions including further lowering of parking requirements and alternative methods for satisfying such requirements. This includes encouraging use of tandem parking and other space saving technology. Direct City Staff to work with stakeholders to lower parking requirements for residential projects and allow alternative methods to satisfy parking requirements, such as bike-racks and car-sharing programs. Fund Civic San Diego planning strategies to examine and implement market-based parking approaches. Analyze nationwide best practices for efficient parking regulation and design. Study/implement reduction/removal of parking requirements for Downtown community given thriving private market for parking that exists there. In general density and transit should be considered when crafting parking requirements.
Cost Containment & Housing Production Impact
- Parking costs range from $20,000 to $40,000 per space and add a significant cost per unit if podium or subterranean parking. Additionally, if the site requires underground parking, the costs often determine whether or not the project will be built.
- Adding parking maximums rather than minimums in addition to the parking requirement reductions already implemented in San Diego will further contain development costs.
- Reducing parking requirements will reduce operational costs for multifamily developments over time.

Addressing the Housing Affordability Crisis in San Diego and Beyond
San Diego Housing Commission | November 25, 2015 | Page 23 of 96
Reduce Parking Requirements
Other Benefits
Reducing parking availability in Transit Oriented Development projects promotes active transportation methods such as biking, walking, or mass transit. Reducing vehicle miles travelled improves the environment and reduces traffic in residential neighborhoods.
SDHC Role (Lead, Advocate, or Support)
SDHC to lead by encouraging reduction of parking requirements in its own development projects and ensuring that public underwriting guidelines are encouraging maximum limits on parking space production rather than minimums. SDHC can also advocate to the city council to reduce parking requirements in its zoning policy.
Next Steps
- SDHC to meet with city council and key city staff to advocate for further reduced parking requirements
- SDHC and City Council to receive updates on any related legislation signed by the Governor (after October 11, 2015)
Timeline Short-term
Relevant State Legislation
Approved 2015 state legislation (AB 744) would at request of developer, city or county, prohibit imposing a parking requirement greater than .5 spaces per bedroom for 100% low-income and senior/special needs housing located within a half of a mile of accessible transit.
Other Innovative Ideas
- Allow one level of parking above ground without counting toward the project FAR for urban projects.
- Allow by-right tandem private (garage) parking for all new multi-family residential and mixed-use development and ease parking requirements for mixed use and transit-oriented development projects.
- Pursue community-wide parking reform measures in parking-impacted communities, including creation of parking districts, shared parking and offsite public parking alternatives.
- Allow for in-lieu fees and parking districts in lieu of mandatory onsite parking for mixed uses.
References San Diego Regional Chamber of Commerce Housing Action Plan (2015 Update); Civic San Diego.

Addressing the Housing Affordability Crisis in San Diego and Beyond
San Diego Housing Commission | November 25, 2015 | Page 24 of 96
5. City and SDHC reduce commercial space requirements for affordable developments by amending the City’s Land Development Code.
Reduce Commercial Space Requirements
Type Local
Scope Affordable and Market
Opportunity for Action
City and SDHC can reduce commercial space requirements for affordable and market rate developments. Commercial space requirements often pose difficulties for developers in leasing up the space and financing the overall project because the commercial space inserts an element of risk in the project that would not otherwise exist as part of a housing development. As a result, developers often underwrite their commercial space income with high vacancies and low rental values due to a historic lack of success in leasing these spaces and monetizing them for the benefit of the project. By reducing or eliminating commercial space requirements, developers will be able to demonstrate stronger cash flows to their capital partners. In addition, an occupied, well-maintained residential space will be better for community stability and neighborhood property values than an empty commercial space.
Opportunity Description & Background
There are several approaches to reducing commercial space requirements: - Reduce the commercial space requirement for all multifamily
developments; - Structure commercial space as a separate condominium space that is
financed separately; and/or - Discourage commercial space in affordable developments.
Cost Containment & Housing Production Impact
- Enables efficient use of space in a manner that maximizes the income that can be used for debt service, thereby maximizing the amount of permanent debt that can be put on a project.
- Commercial space requirements are particularly problematic and costly in affordable housing development, where financing is already challenging and the commercial space requirement adds even greater financing challenges. Once affordable housing is built, commercial space can be a costly operational expense on an ongoing basis when it cannot be leased or must be leased at a loss or to unstable tenants.
Other Benefits
- Often, commercial space, particularly in affordable developments, sits vacant, or the owners are unable to lease the space to active uses so the space is unattractive, may attract crime and may bring down nearby property values.
- By utilizing the ground floor for residential and related uses where it is occupied rather than vacant, the ground floor space may be more active than it would have been as commercial space, thereby boosting surrounding property values and increasing the community’s stability.
SDHC Role (Lead, Advocate, or Support)
SDHC to advocate to the City to review and amend commercial space requirements for residential buildings.

Addressing the Housing Affordability Crisis in San Diego and Beyond
San Diego Housing Commission | November 25, 2015 | Page 25 of 96
Reduce Commercial Space Requirements
Next Steps City Council to prepare motion to amend City’s Land Development Code
Timeline Short-term
Relevant Legislation
N/A
Other Innovative Ideas
Expand reduction in commercial space requirement to market rate developments.
References Keyser Marston & Associates

Addressing the Housing Affordability Crisis in San Diego and Beyond
San Diego Housing Commission | November 25, 2015 | Page 26 of 96
6. SDHC, City and Local Agencies take action to unlock land and increase ground leases to affordable housing developers at below market rates or at nominal cost.
Unlock Land and Increase Ground Leases
Type Local
Scope Affordable and Market
Opportunity for Action
Working with the City and SANDAG, SDHC can generate an inventory of land owned by the government or affiliates that could be sites for housing development in San Diego. Creating an inventory of all underutilized land, vacant land and potential re-use sites owned by public agencies will be a very effective first step in unlocking land for housing development. This inventory can be ranked in terms of suitability for affordable housing and mixed income development. The City, SDHC and affiliates can ground lease land at a nominal cost for affordable housing development. SDHC can work with the City to revise land use regulations in ways that leverage public land and unlock land for market development.
Opportunity Description & Background
- Working with SANDAG, the City of San Diego and Community Planners Committee, SDHC can generate a map that identifies sites currently zoned for multifamily housing. The map could be created using SANDAG’s Smart Growth Concept Map, and Community Plans showing vacant land, potential scrape and rebuild properties along transit routes, and zoned mixed use development sites along transit routes. Inventory can include land owned by the government, agencies and any affiliated government entities as well as potential re-use sites.
- SDHC can consider use of the new right of first refusal for non-profits to acquire parcels that can be developed as affordable housing. AB 2135 was passed in September 2014 and prioritizes the use of local agency surplus property for the development of affordable housing that serves lower income households.
- A local ballot measure, Proposition A, was approved by voters in San Francisco on Nov. 3, 2015, which authorizes the city to issue up to $310 million in bonds for affordable housing programs.
- The City, SDHC and other local/regional agencies can put out Requests for Qualifications and Requests for Proposals (RFQs/RFPs) to advertise to developers that these sites are available for affordable housing and mixed use projects. Property can be ground-leased long-term to the most qualified developers at below market rates or at nominal cost.
- The City Council can unlock land by crafting ordinances that boost market rate housing production through better land use regulations. For example, the City Council can enact programs such as creating priority development areas around transit corridors and rezoning underutilized industrial space or other non-residential land uses.
Addressing the Housing Affordability Crisis in San Diego and Beyond
San Diego Housing Commission | November 25, 2015 | Page 27 of 96
Unlock Land and Increase Ground Leases
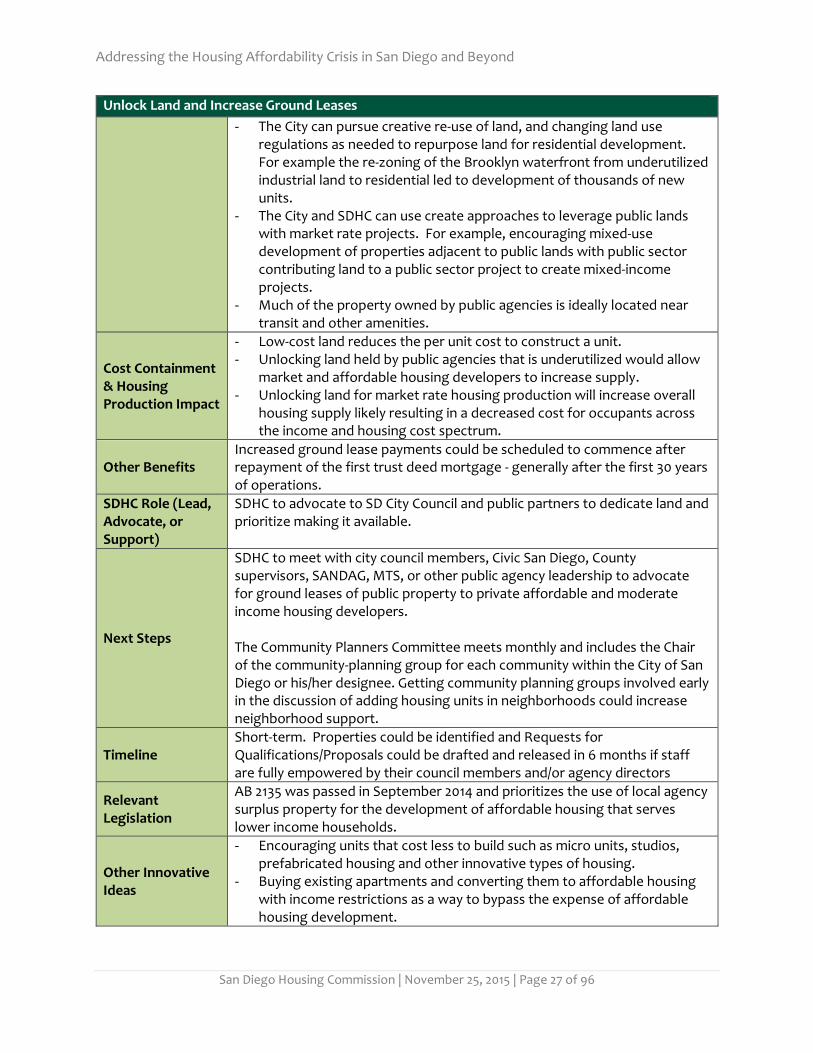
- The City can pursue creative re-use of land, and changing land use regulations as needed to repurpose land for residential development. For example the re-zoning of the Brooklyn waterfront from underutilized industrial land to residential led to development of thousands of new units.
- The City and SDHC can use create approaches to leverage public lands with market rate projects. For example, encouraging mixed-use development of properties adjacent to public lands with public sector contributing land to a public sector project to create mixed-income projects.
- Much of the property owned by public agencies is ideally located near transit and other amenities.
Cost Containment & Housing Production Impact
- Low-cost land reduces the per unit cost to construct a unit. - Unlocking land held by public agencies that is underutilized would allow
market and affordable housing developers to increase supply. - Unlocking land for market rate housing production will increase overall
housing supply likely resulting in a decreased cost for occupants across the income and housing cost spectrum.
Other Benefits Increased ground lease payments could be scheduled to commence after repayment of the first trust deed mortgage - generally after the first 30 years of operations.
SDHC Role (Lead, Advocate, or Support)
SDHC to advocate to SD City Council and public partners to dedicate land and prioritize making it available.
Next Steps
SDHC to meet with city council members, Civic San Diego, County supervisors, SANDAG, MTS, or other public agency leadership to advocate for ground leases of public property to private affordable and moderate income housing developers. The Community Planners Committee meets monthly and includes the Chair of the community-planning group for each community within the City of San Diego or his/her designee. Getting community planning groups involved early in the discussion of adding housing units in neighborhoods could increase neighborhood support.
Timeline Short-term. Properties could be identified and Requests for Qualifications/Proposals could be drafted and released in 6 months if staff are fully empowered by their council members and/or agency directors
Relevant Legislation
AB 2135 was passed in September 2014 and prioritizes the use of local agency surplus property for the development of affordable housing that serves lower income households.
Other Innovative Ideas
- Encouraging units that cost less to build such as micro units, studios, prefabricated housing and other innovative types of housing.
- Buying existing apartments and converting them to affordable housing with income restrictions as a way to bypass the expense of affordable housing development.
Addressing the Housing Affordability Crisis in San Diego and Beyond
San Diego Housing Commission | November 25, 2015 | Page 28 of 96
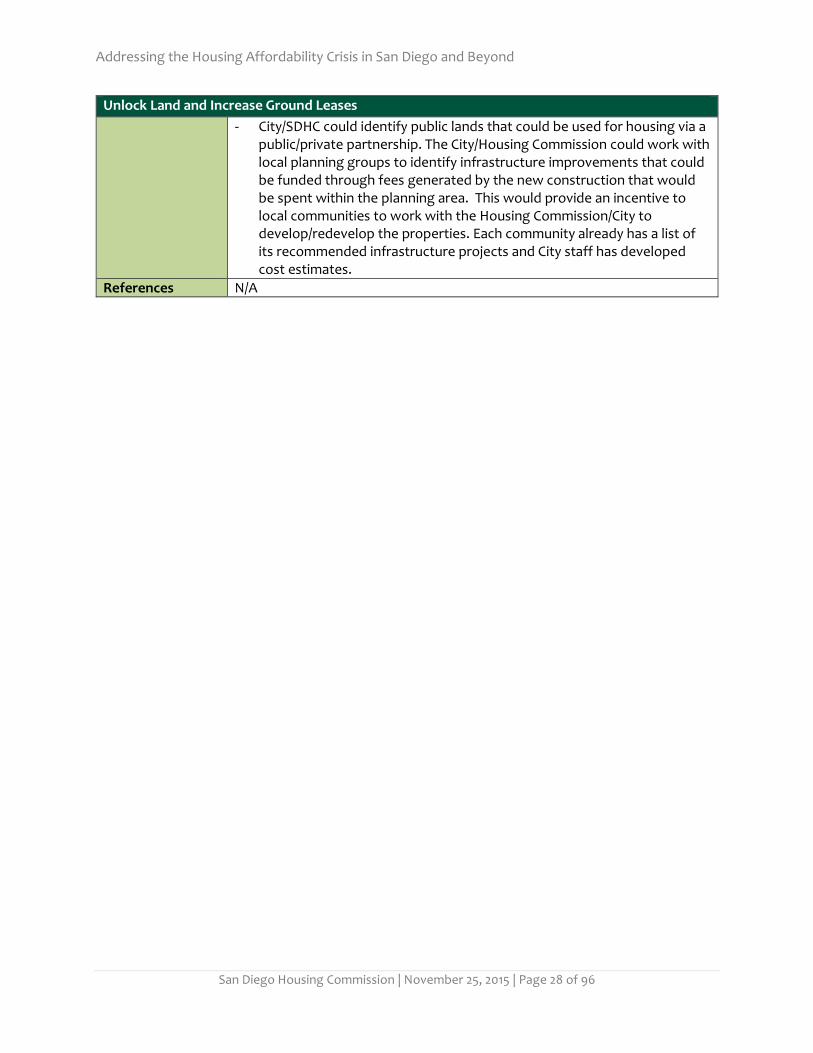
Unlock Land and Increase Ground Leases
- City/SDHC could identify public lands that could be used for housing via a public/private partnership. The City/Housing Commission could work with local planning groups to identify infrastructure improvements that could be funded through fees generated by the new construction that would be spent within the planning area. This would provide an incentive to local communities to work with the Housing Commission/City to develop/redevelop the properties. Each community already has a list of its recommended infrastructure projects and City staff has developed cost estimates.
References N/A
Addressing the Housing Affordability Crisis in San Diego and Beyond
San Diego Housing Commission | November 25, 2015 | Page 29 of 96
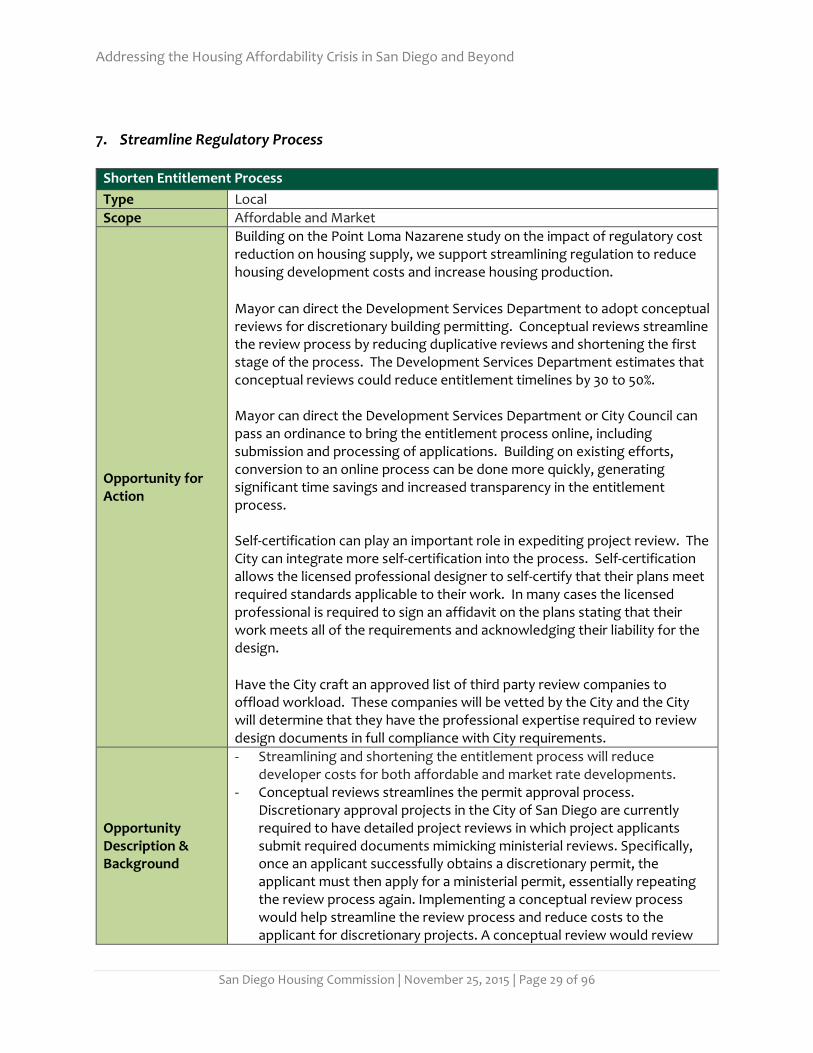
7. Streamline Regulatory Process
Shorten Entitlement Process
Type Local
Scope Affordable and Market
Opportunity for Action
Building on the Point Loma Nazarene study on the impact of regulatory cost reduction on housing supply, we support streamlining regulation to reduce housing development costs and increase housing production.
Mayor can direct the Development Services Department to adopt conceptual reviews for discretionary building permitting. Conceptual reviews streamline the review process by reducing duplicative reviews and shortening the first stage of the process. The Development Services Department estimates that conceptual reviews could reduce entitlement timelines by 30 to 50%. Mayor can direct the Development Services Department or City Council can pass an ordinance to bring the entitlement process online, including submission and processing of applications. Building on existing efforts, conversion to an online process can be done more quickly, generating significant time savings and increased transparency in the entitlement process. Self-certification can play an important role in expediting project review. The City can integrate more self-certification into the process. Self-certification allows the licensed professional designer to self-certify that their plans meet required standards applicable to their work. In many cases the licensed professional is required to sign an affidavit on the plans stating that their work meets all of the requirements and acknowledging their liability for the design.
Have the City craft an approved list of third party review companies to offload workload. These companies will be vetted by the City and the City will determine that they have the professional expertise required to review design documents in full compliance with City requirements.
Opportunity Description & Background
- Streamlining and shortening the entitlement process will reduce developer costs for both affordable and market rate developments.
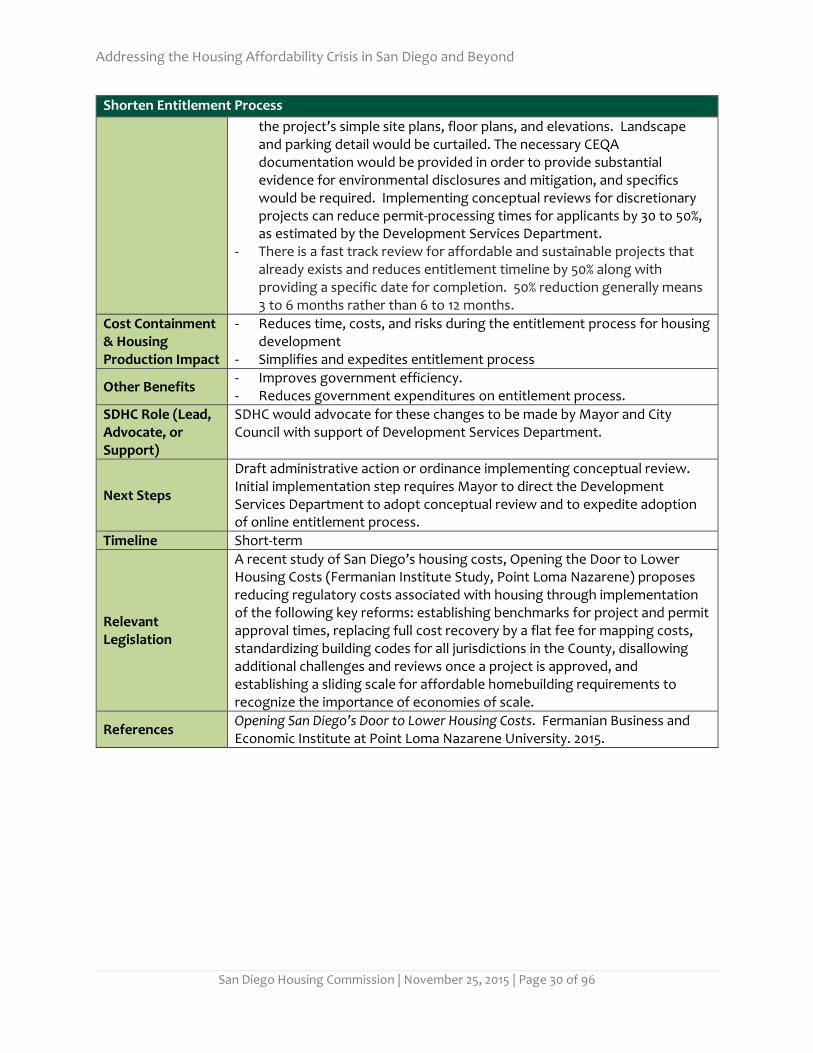
- Conceptual reviews streamlines the permit approval process. Discretionary approval projects in the City of San Diego are currently required to have detailed project reviews in which project applicants submit required documents mimicking ministerial reviews. Specifically, once an applicant successfully obtains a discretionary permit, the applicant must then apply for a ministerial permit, essentially repeating the review process again. Implementing a conceptual review process would help streamline the review process and reduce costs to the applicant for discretionary projects. A conceptual review would review
Addressing the Housing Affordability Crisis in San Diego and Beyond
San Diego Housing Commission | November 25, 2015 | Page 30 of 96
Shorten Entitlement Process
the project’s simple site plans, floor plans, and elevations. Landscape and parking detail would be curtailed. The necessary CEQA documentation would be provided in order to provide substantial evidence for environmental disclosures and mitigation, and specifics would be required. Implementing conceptual reviews for discretionary projects can reduce permit-processing times for applicants by 30 to 50%, as estimated by the Development Services Department.
- There is a fast track review for affordable and sustainable projects that already exists and reduces entitlement timeline by 50% along with providing a specific date for completion. 50% reduction generally means 3 to 6 months rather than 6 to 12 months.
Cost Containment & Housing Production Impact
- Reduces time, costs, and risks during the entitlement process for housing development
- Simplifies and expedites entitlement process
Other Benefits - Improves government efficiency. - Reduces government expenditures on entitlement process.
SDHC Role (Lead, Advocate, or Support)
SDHC would advocate for these changes to be made by Mayor and City Council with support of Development Services Department.
Next Steps
Draft administrative action or ordinance implementing conceptual review. Initial implementation step requires Mayor to direct the Development Services Department to adopt conceptual review and to expedite adoption of online entitlement process.
Timeline Short-term
Relevant Legislation
A recent study of San Diego’s housing costs, Opening the Door to Lower Housing Costs (Fermanian Institute Study, Point Loma Nazarene) proposes reducing regulatory costs associated with housing through implementation of the following key reforms: establishing benchmarks for project and permit approval times, replacing full cost recovery by a flat fee for mapping costs, standardizing building codes for all jurisdictions in the County, disallowing additional challenges and reviews once a project is approved, and establishing a sliding scale for affordable homebuilding requirements to recognize the importance of economies of scale.
References Opening San Diego’s Door to Lower Housing Costs. Fermanian Business and Economic Institute at Point Loma Nazarene University. 2015.

Addressing the Housing Affordability Crisis in San Diego and Beyond
San Diego Housing Commission | November 25, 2015 | Page 31 of 96
8. Adopt Specific Plans and Community Plans with Master Environmental Impact Reports (EIRs) and Provisions that Increase Production of Market Rate Housing
Adopt Specific Plans and Community Plans with Master EIRs
Type Local
Scope Affordable and Market
Opportunity for Action
City Council can pass an ordinance to expedite adoption of Specific Plans and Community Plans with Master Environmental Impact Reports (EIRs) that enable medium- to high-density urban infill mixed use and multi-family development. Updated Community Plans provide certainty to developers and can significantly reduce the time and cost of producing new housing units. There has been a recent increased focus at the local government level to expedite Community Plan Updates. The inclusion of Master Environmental Impact Reports (“EIRs”) in Community Plan Updates can minimize CEQA review for individual projects. This will create a single productive and focused opportunity for the public and advocates to express input on the general plan and community plans. Streamlining the process in this manner will reduce the housing development timeline and reduce regulatory costs associated with housing production. Part of the Community Plan Updates should include proposals that increase market rate housing. This could include programs such as creating priority development areas around transit corridors and rezoning underutilized industrial and other types of non-residential land.
Opportunity Description & Background
There are 52 Community Plans in San Diego. - 3 Community Plans are less than 10 years old; - 12 Community Plans are 11 to 20 years old; - 22 Community Plans are 21 to 30 years old; - 12 Community Plans are 31 to 40 years old; and - 3 Community Pans are over 40 years old.
A Community Plan is a public document that contains specific proposals for future land uses and public improvements in a community consistent with the City’s General Plan. Typical elements include: land use, transportation, urban design, public facilities and services, natural and cultural resources and economic development. All stakeholders, including employers, residents and government are provided certainty by the adoption of Community Plans. Community Plans and other efforts toward smart growth reduce the time and cost of producing new units by reducing regulatory uncertainty and regulatory process. Coordinated and certain smart growth plans make the region a more attractive place to live and do business. Historically the process to update a Community Plan took about a decade to complete. Recently as increased local resources have been focused on Community Plan Updates, the timeline is targeted to be a two and a half year process.

Addressing the Housing Affordability Crisis in San Diego and Beyond
San Diego Housing Commission | November 25, 2015 | Page 32 of 96
Adopt Specific Plans and Community Plans with Master EIRs
As part of the process of updating Community Plans, it is important to give communities an opportunity provide input on plans and weigh in on how plans will best meet the community’s needs. Including a Master EIR can further reduce regulatory burden for housing development. A Master EIR completed as part of a Community Plan for individual neighborhoods will simplify and expedite the entitlement process and limit potential lawsuits (assisting both market-rate and affordable housing projects). A Master EIR can be tailored to encourage publicly desired development. SDHC could support proposals by Civic San Diego and the City Planning Department to engage in specific plans and other tools to quickly update planning rules for priority development areas within community plans.
Cost Containment & Housing Production Impact
- Reduces time, costs, and risks during the entitlement process for housing development
- Simplifies and expedites entitlement process. - Provides certainty for regional development planning that will reduce time and
costs of housing project development process. - Increasing density in Community Plans as they are updated will support
increased housing production by unlocking land available for housing development.
Other Benefits - Eases planning costs for developers while allowing local residents to participate
in planning the long-term future development of their neighborhoods.
SDHC Role (Lead, Advocate, or Support)
- SDHC could advocate for these changes to be made by City Council.
Next Steps
- Build broad base of coalition supporters at the local level. - Identify local legislative leaders to support legislation. - SDHC outreach to City Council and City Council action - Specific and Community Plan Development
Timeline Long term - Implemented as community plans undergo review.
Relevant Legislation
N/A

Addressing the Housing Affordability Crisis in San Diego and Beyond
San Diego Housing Commission | November 25, 2015 | Page 33 of 96
Adopt Specific Plans and Community Plans with Master EIRs
Other Innovative Ideas
- Density targets and limits should be specified in City Plan updates and in the General Plan to maximize land available for housing production while balancing other factors important to community well-being.
- Use the Centre City Development Corporation/Civic San Diego model for Community Plan Updates
- Set minimum citywide significance thresholds for Community Plan Updates and develop a comprehensive density strategic plan. Include in that plan a policy that densities in communities are not lowered and height maximums are not decreased.
- Add In-fill and Transit-Oriented Development target areas within all future Community and Specific Plans in order to use the CEQA processes established by SB 743 (Steinberg, 2013).
- Affordable Housing Overlay Zone creates as-of-right zoning for specific parcels. This approach can be used in the housing element process – when the element is being approved, the city can designate certain parcels as AHOZ eligible, the city would then have to designate the requisite zoning for the parcels and the development of affordable housing would be as of right. This would streamline approval of affordable housing, though it might limit plan design flexibility.
References San Diego Regional Chamber of Commerce Housing Action Plan (2015 Update)

Addressing the Housing Affordability Crisis in San Diego and Beyond
San Diego Housing Commission | November 25, 2015 | Page 34 of 96
Community AdoptedLa Jolla 2014Otay Mesa 2014Downtown 2006Rancho Encantada 2001Del Mar Mesa 2000Black Mountain Ranch 1998Mid-City 1998Eastern Area 1998Kensington-Talmadge 1998Linda Vista 1998Normal Heights 1998Pacific Highlands Ranch 1998Otay Mesa-Nestor 1997Torrey Hills 1997Torrey Highlands 1996Pacific Beach 1995San Pasqual Valley 1995Torrey Pines 1995Mira Mesa 1994Rancho Peñasquitos 1993Kearny Mesa 1992North City Future Urbanizing Area 1992Barrio Logan 1991Midway Pacific Hwy Corridor 1991San Ysidro 1990Clairemont Mesa 1989College Area 1989Greater Golden Hill 1988Rancho Bernardo 1988Uptown 1988Encanto 1987Old Town San Diego 1987Peninsula 1987Skyline Paradise Hills 1987Southeastern San Diego 1987University 1987North Park 1986Carmel Mountain Ranch 1984Mission Valley 1984Via de la Valle 1984Fairbanks Ranch Country Club 1982Mission Beach 1982Navajo 1982Sabre Springs 1982Tierrasanta 1982Miramar Ranch North 1980Scripps Miramar Ranch 1978Serra Mesa 1977Tijuana River Valley 1976Carmel Valley 1975Ocean Beach 1975East Elliot 1971
Less than 10 Years Old
11 to 20 Years Old
21 to 30 Years Old
31 to 40 Years Old
Over 40 Years Old
City of San Diego Community Plan Adoption Dates
Sources: San Diego Regional Chamber of Commerce, City of San Diego

Addressing the Housing Affordability Crisis in San Diego and Beyond
San Diego Housing Commission | November 25, 2015 | Page 35 of 96
9. California Legislature and Governor to adopt CEQA reform measures targeting infill development projects and City to revise local CEQA thresholds.
Support CEQA Reform at State and City Levels
Type State, Local
Scope Affordable and Market
Opportunity for Action
At the State level, Members of the State Legislature can introduce legislation that addresses the following reforms: 1) Require those filing CEQA lawsuits to disclose their identity and environmental or non-environmental interests, 2) Eliminate duplicative lawsuits against EIRs that have been certified; 3) Restrict invalidation of project approvals due to technical errors in the EIR.
At the local level, the City can take immediate action to commence revisions to its CEQA thresholds.
Opportunity Description & Background
State Legislation: Though only about 10% of CEQA filed cases are published, a report by Holland & Knight (August 2015) completed a study of all CEQA lawsuits filed over a 3-year period. Of those cases, almost half are targeted towards taxpayer-funded projects that reinforce California’s environmental goals. These statistics indicate that there are 3 key legislative changes that could be made to the CEQA process that could reform the process to improve the chances of success for infill projects, including affordable housing. These changes are listed in the Opportunity for Action Box above. City Thresholds: Traffic, noise, air quality and parks CEQA significance thresholds are based on suburban land uses and traffic generation and applied to urban projects and environments. They can be modified to more accurately reflect current and future development patterns. Making the thresholds more applicable to urban environments will reduce unnecessary regulatory costs.
Cost Containment & Housing Production Impact
- Increase supply of affordable product in California by improving chances of project success.
- Decrease project and taxpayer costs by reducing legal costs and time delay costs due to frivolous CEQA lawsuits.
Other Benefits Helps contain development costs by keeping projects with approvals out of litigation.
SDHC Role (Lead, Advocate, or Support)
SDHC to advocate within coalitions for reform and reach out to legislators to initiate these changes.
Next Steps
- Build broad base of coalition supporters at the state and local level for state legislation.
- Identify local legislative leaders to carry state legislation. - Work with City Council to draft ordinance amending CEQA thresholds for the
City of San Diego.
Timeline Short-term for local actions; Medium term for state legislation.
Relevant Legislation
N/A
Other Innovative Ideas
- Override mechanism at the state level, similar to Massachusetts 40B.
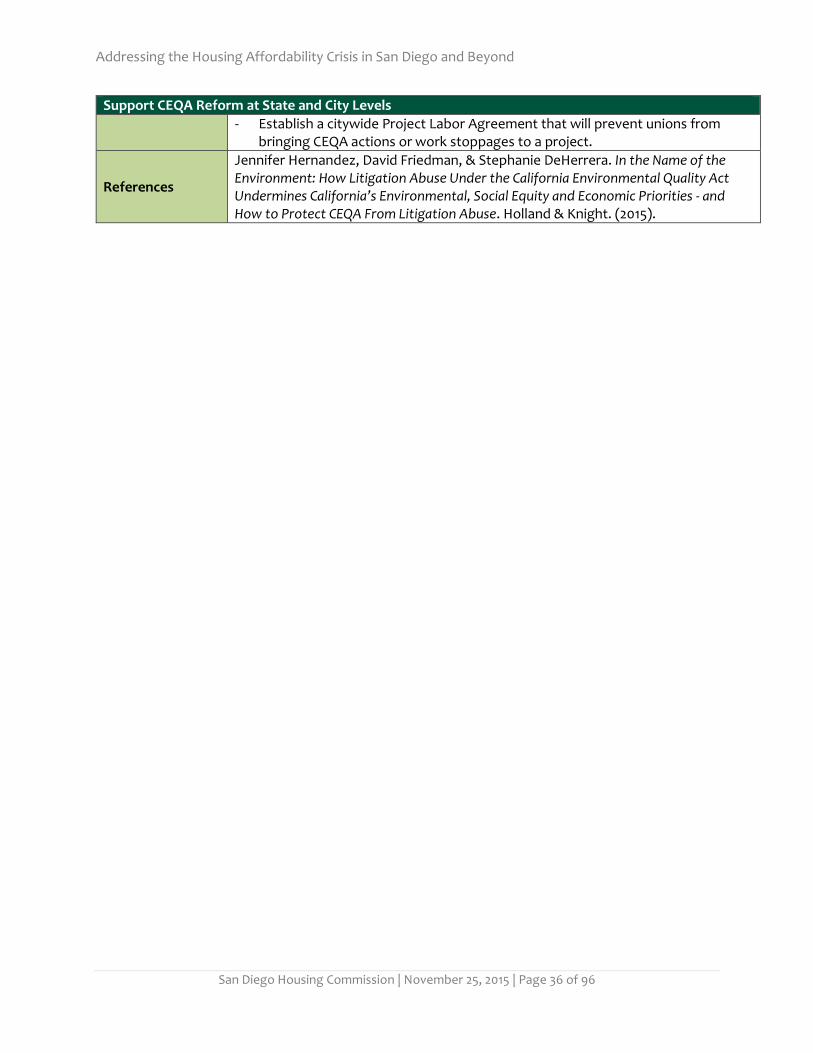
Addressing the Housing Affordability Crisis in San Diego and Beyond
San Diego Housing Commission | November 25, 2015 | Page 36 of 96
Support CEQA Reform at State and City Levels
- Establish a citywide Project Labor Agreement that will prevent unions from bringing CEQA actions or work stoppages to a project.
References
Jennifer Hernandez, David Friedman, & Stephanie DeHerrera. In the Name of the Environment: How Litigation Abuse Under the California Environmental Quality Act Undermines California’s Environmental, Social Equity and Economic Priorities - and How to Protect CEQA From Litigation Abuse. Holland & Knight. (2015).

Addressing the Housing Affordability Crisis in San Diego and Beyond
San Diego Housing Commission | November 25, 2015 | Page 37 of 96
10. Align State Oversight
Align State Oversight
Type State
Scope Affordable
Opportunity for Action
Appoint an ad hoc committee to prepare an alignment plan proposing how the five state agencies responsible for housing policy and/or financing in California can better align their processes and policy objectives. The ad hoc committee should be appointed by officials who currently have housing policy oversight responsibilities, specifically the Governor and the Treasurer. Aligning affordable housing policy and financing programs at the state level in California will reduce costs of regulation, monitoring and implementation in affordable housing developments and by local housing agencies.
Opportunity Description & Background
Five Agencies currently manage affordable housing policy, funding and oversight/monitoring in California:
- California Debt Allocation Committee (CDLAC) - Tax Credit Allocation Committee (TCAC) - Department of Housing and Community Development - California Housing Finance Agency - Strategic Growth Council
For affordable housing developers, better alignment will reduce development and operational costs and reduce timelines for development. The various agencies could create a streamlined application, loan documentation system, portfolio administration process and monitoring requirements. Specifically, alignment could achieve:
- Single online electronic application; - Single reporting format for ongoing monitoring and compliance; and - Single underwriting form for financing from public lending institutions
(similar to applying for financial aid for higher education through a single form).
The ad hoc committee could design and oversee a process to achieve improved government efficiency and cost reduction in administering California’s housing policy, finance and affordable housing development oversight.
Cost Containment & Housing Production Impact
- Aligning these processes and the policy goals of the five agencies will increase government efficiency and speed delivery of housing resources at both the state and local levels.
- Alignment will reduce initial and ongoing administrative and compliance costs for developing and monitoring affordable housing.
Other Benefits Increased government efficiency.
SDHC Role (Lead, Support or Advocate)
SDHC to support creation of an ad hoc committee.
Next Steps Support dialogue and action to align State Agencies practices.

Addressing the Housing Affordability Crisis in San Diego and Beyond
San Diego Housing Commission | November 25, 2015 | Page 38 of 96
Align State Oversight
Timeline Short to Medium Term Relevant Legislation N/A
Other Innovative Ideas
- Other states have streamlined housing policy and oversight in innovative ways that may provide a model for California.
- Massachusetts has a single online application for affordable housing financing.
References N/A

Addressing the Housing Affordability Crisis in San Diego and Beyond
San Diego Housing Commission | November 25, 2015 | Page 39 of 96
11.1. Promote Fair Share of Continuum of Care Allocations for San Diego
Continuum of Care Allocations
Type Federal
Scope Affordable
Opportunity for Action
The current Continuum of Care funding formula does not allow San Diego and other jurisdictions to adequately address their homeless population needs. At the urging of Congressman Scott Peters (CA-52), San Diego must not wait for Washington to DC to lead and should create viable and equitable formula alternatives for release and outreach to garner public comment and support. Those alternatives should then be provided to San Diego’s Congressional Delegation to advocate for San Diego’s fair share of Federal dollars to end homelessness in San Diego under HUD’s Continuum of Care Program.
Opportunity Description & Background
The Continuum of Care (CoC) Program is designed to: - Promote community-wide commitment to the goal of ending homelessness; - Provide funding for efforts by social services providers, and state and local
governments to quickly rehouse homeless individuals and families while minimizing the trauma and dislocation caused to homeless individuals, families, and communities by homelessness;
- Promote access to and effect utilization of mainstream programs by homeless individuals and families; and
- Optimize self-sufficiency among individuals and families experiencing homelessness.
Cost Containment & Housing Production Impact
Increasing San Diego’s Continuum of Care allocation to match its homeless population will directly increase resources available in San Diego to provide adequate levels of social services and housing support to the homeless.
Other Benefits Reduce use of other public resources for housing by having an adequate level of Continuum of Care support.
SDHC Role (Lead, Advocate, or Support)
SDHC could participate in or help facilitate a process to draft alternative formulas, create substantial public comment opportunities, and provide to the California Congressional delegation the needed information for advocacy at federal level.
Next Steps
- Obtain current funding formula for Continuum of Care allocations and convene stakeholders to draft alternative formula that provides fair share of homeless funds to San Diego.
- Research alternatives and obstacles to national support - Partner with Congressional Delegation to advocate new funding formula for
Continuum of Care allocations.
Timeline Short-term
Relevant Legislation
President Obama’s 2016 budget
Other Innovative Ideas
N/A
References United States Department of Housing & Urban Development

Addressing the Housing Affordability Crisis in San Diego and Beyond
San Diego Housing Commission | November 25, 2015 | Page 40 of 96
11.2. Advocate with Congressional Delegation to Increase Federal Rental Assistance
Increase Federal Rental Assistance
Type Federal
Scope Affordable
Opportunity for Action Advocate with Congressional delegation to increase federal rental assistance for public housing, project-based housing, vouchers and other federal rental assistance.
Opportunity Description & Background
- All of San Diego’s subsidies for lower income families to afford rental units come from federal rental assistance programs.
- There is currently a severe shortage of affordable units in San Diego and low-income families are severely rent burdened. Increasing federal rental assistance would increase resources in San Diego to help low-income families and extremely low-income families find adequate housing.
- Community Development Block Grants and HOME Investment Partnerships Program HOME funds are crucial federal rental assistance funding sources for San Diego low-income households.
- The primary objective of the Community Development Block Grant Program (CDBG) is to develop viable communities through the provision of decent housing, a suitable living environment, and expanded economic opportunities. Eligible CDBG spending includes Public Services, Community and Economic Development, Capital Improvement Projects (CIP) Public Facilities/Infrastructure, and CIP Housing Rehabilitation.
- HOME (HOME Investment Partnerships Program) funds are dedicated to housing activities that meet local housing needs and typically preserve or create affordable housing. Uses include tenant-based rental assistance, rehabilitation, homebuyer assistance, and new construction.
Cost Containment & Housing Production Impact
Increasing federal funding of CDBG and HOME will make more affordable housing available for lower-income households, increasing supply generally and therefore making housing more available and affordable at higher income levels as well.
Other Benefits - Reduce homelessness - Reduce severe rent burdens on low-income families
SDHC Role (Lead, Advocate, or Support)
SDHC to lead advocacy with San Diego Congressional delegation and local stakeholders.
Next Steps Partner with Congressional Delegation to advocate for increased federal rental assistance including increased funding for CDBG, HOME and other federal rental assistance programs.
Timeline Medium Term
Relevant Legislation Federal Fiscal Year 2016 Budget
Other Innovative Ideas N/A
References United States Department of Housing & Urban Development

Addressing the Housing Affordability Crisis in San Diego and Beyond
San Diego Housing Commission | November 25, 2015 | Page 41 of 96
11.3. Expand Low Income Housing Tax Credit
Expand the Low Income Housing Tax Credit
Type Federal
Scope Affordable
Opportunity for Action Reform and expand the Low Income Housing Tax Credit (LIHTC) to support development and preservation of affordable housing.
Opportunity Description & Background
1. Encourage mixed income occupancy by allowing LIHTC-supported projects to elect a criterion employing a restriction on average income. The criterion would be: At least 40 percent of the units in the project would have to be occupied by tenants with incomes that average no more than 60% of AMI, and households with incomes up to 80% of AMI could be served.
2. Expand LIHTCs available to finance affordable housing by allowing conversion of private activity bond volume cap into LIHTCs.
Cost Containment & Housing Production Impact
- Increase production and lower financing costs by allowing states to utilize private activity bonds (PAB) volume that may be difficult to use in a low interest rate environment.
- Agencies in charge of allocating LIHTCs are often confronted with a larger number of deserving projects than they can support. Some of these buildings can be built only with higher credit rate LIHTCs. Increasing the volume of higher rate credits would allow the development of some projects for which the current supply is insufficient.
- Some developers obtain LIHTCs by financing buildings with Private Activity Bonds even though they have access to more preferred financing options. The resulting transaction costs consume resources that might otherwise provide affordable housing.
Other Benefits
- Encourages mixed income occupancy - LIHTC income criteria often produce buildings that serve a narrow income band of tenants—those just below the eligible income threshold. In addition, mitigates the inflexibility of the income criteria that has made it difficult for LIHTC to support acquisition of partially or fully occupied properties for preservation or repurposing.
SDHC Role (Lead, Advocate, or Support)
- Support proposal - Advocate with local members of Congress - Advocate through local, state, and national affordable housing trade
organizations
Next Steps - Advocate with San Diego Congressional delegation
Timeline Medium Term
Relevant Legislation Federal Fiscal Year 2016 Budget
Other Innovative Ideas Allow conversion of private activity bond cap to low income housing tax credits.
References President Obama’s 2016 Budget United States Department of Housing & Urban Development Internal Revenue Code
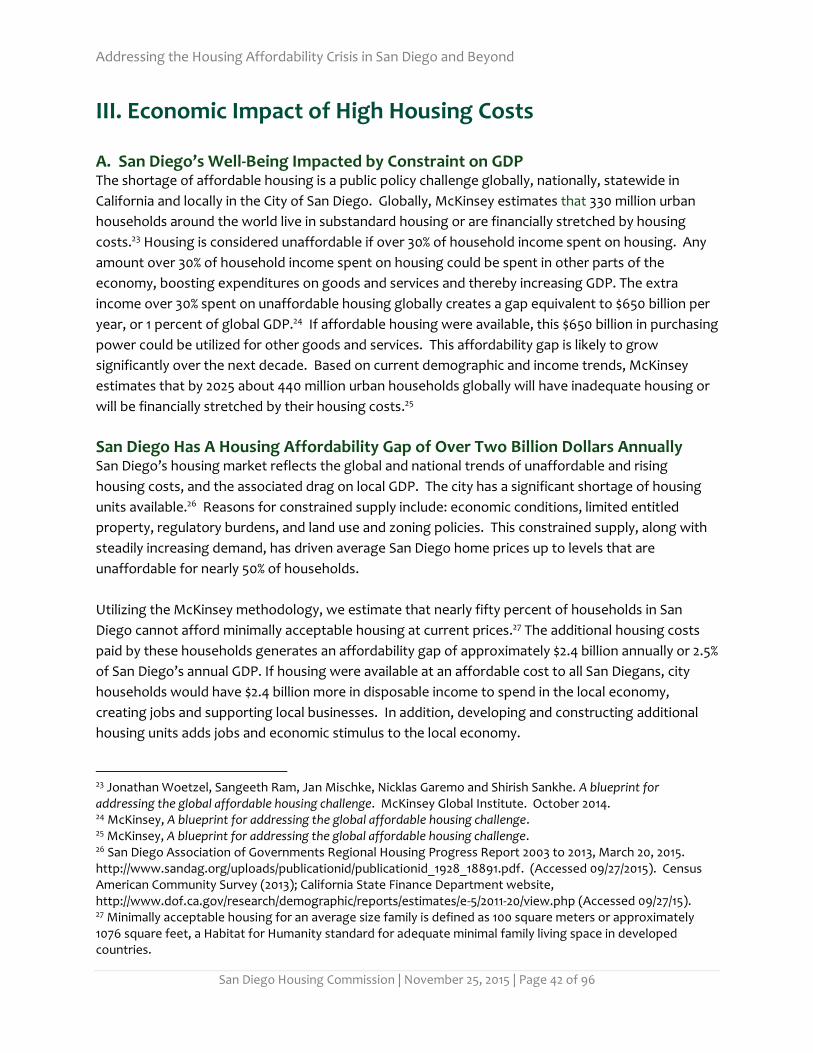
Addressing the Housing Affordability Crisis in San Diego and Beyond
San Diego Housing Commission | November 25, 2015 | Page 42 of 96
III. Economic Impact of High Housing Costs A. San Diego’s Well-Being Impacted by Constraint on GDP The shortage of affordable housing is a public policy challenge globally, nationally, statewide in
California and locally in the City of San Diego. Globally, McKinsey estimates that 330 million urban
households around the world live in substandard housing or are financially stretched by housing
costs.23 Housing is considered unaffordable if over 30% of household income spent on housing. Any
amount over 30% of household income spent on housing could be spent in other parts of the
economy, boosting expenditures on goods and services and thereby increasing GDP. The extra
income over 30% spent on unaffordable housing globally creates a gap equivalent to $650 billion per
year, or 1 percent of global GDP.24 If affordable housing were available, this $650 billion in purchasing
power could be utilized for other goods and services. This affordability gap is likely to grow
significantly over the next decade. Based on current demographic and income trends, McKinsey
estimates that by 2025 about 440 million urban households globally will have inadequate housing or
will be financially stretched by their housing costs.25
San Diego Has A Housing Affordability Gap of Over Two Billion Dollars Annually
San Diego’s housing market reflects the global and national trends of unaffordable and rising
housing costs, and the associated drag on local GDP. The city has a significant shortage of housing
units available.26 Reasons for constrained supply include: economic conditions, limited entitled
property, regulatory burdens, and land use and zoning policies. This constrained supply, along with
steadily increasing demand, has driven average San Diego home prices up to levels that are
unaffordable for nearly 50% of households.
Utilizing the McKinsey methodology, we estimate that nearly fifty percent of households in San
Diego cannot afford minimally acceptable housing at current prices.27 The additional housing costs
paid by these households generates an affordability gap of approximately $2.4 billion annually or 2.5%
of San Diego’s annual GDP. If housing were available at an affordable cost to all San Diegans, city
households would have $2.4 billion more in disposable income to spend in the local economy,
creating jobs and supporting local businesses. In addition, developing and constructing additional
housing units adds jobs and economic stimulus to the local economy.
23 Jonathan Woetzel, Sangeeth Ram, Jan Mischke, Nicklas Garemo and Shirish Sankhe. A blueprint for addressing the global affordable housing challenge. McKinsey Global Institute. October 2014. 24 McKinsey, A blueprint for addressing the global affordable housing challenge. 25 McKinsey, A blueprint for addressing the global affordable housing challenge. 26 San Diego Association of Governments Regional Housing Progress Report 2003 to 2013, March 20, 2015. http://www.sandag.org/uploads/publicationid/publicationid_1928_18891.pdf. (Accessed 09/27/2015). Census American Community Survey (2013); California State Finance Department website, http://www.dof.ca.gov/research/demographic/reports/estimates/e-5/2011-20/view.php (Accessed 09/27/15). 27 Minimally acceptable housing for an average size family is defined as 100 square meters or approximately 1076 square feet, a Habitat for Humanity standard for adequate minimal family living space in developed countries.

Addressing the Housing Affordability Crisis in San Diego and Beyond
San Diego Housing Commission | November 25, 2015 | Page 43 of 96
Figure 6: Affordability Gap in San Diego of $2.4 billion28 Over 50% of San Diego City Households cannot afford a minimal unit, a $2.4 billion annual economic gap. Over 70% cannot afford the average San Diego home.
In addition to looking at affordability for the minimum livable unit – the bottom dotted line on the
chart, we also looked at the affordability of an average priced home in San Diego today. Using San
Diego’s average home price as of August 2015 of $506,000 and adding in annual costs of property
taxes and homeowners insurance, the annual cost would be $29,000, an amount that would be
unaffordable for over 70% of San Diegans.29 San Diego’s median income is approximately $73,00030
for the city, which is consistent with our estimate that about half of San Diegans are unable to afford
a minimally sized unit.31 A minimal unit would be priced at approximately $400,000 based on current
San Diego home prices.32 Note that the minimum unit for San Diego, at 100 square meters (1,076
28 McKinsey, A blueprint for addressing the global affordable housing challenge; Census Bureau AMS Survey (2013); Trulia website, http://www.trulia.com/home_prices/California/San_Diego-heat_map/ (Accessed September 1, 2015); Freddie Mac Primary Market Survey Rate. See Appendix One for detailed methodology for calculations. 29 Zillow, San Diego County Website http://www2.sdcounty.ca.gov/pts/trasearch.asp. (Accessed 08/08/2015). Valuepenguin. http://www.valuepenguin.com/average-cost-of-homeowners-insurance. (Accessed 08/08/2015). 30 San Diego Housing Commission website, http://www.sdhc.org/uploadedFiles/Rental_Assistance/pdfs/AMIIncomeRentChart%202015.pdf (Accessed 09/15/2015). 31 Census Bureau ACS Survey (2013). US Bureau of Labor Statistics. http://www.bls.gov/opub/ted/2015/percent-changes-in-average-hourly-earnings-for-largest-metro-areas-june-2014-to-june-2015.htm. (Accessed 09/02/2015). 32 Trulia. http://www.trulia.com/real_estate/San_Diego-California/market-trends/. (Accessed 08/08/2015).
70,301 (15%) 75,140
(16%)
62,005 (13%)
80,622 (17%) 57,393
(12%)
80,360 (17%)50,730 (11%)$0
$5,000
$10,000
$15,000
$20,000
$25,000
$30,000
$35,000
$40,000
$45,000
$50,000
$55,000
$60,000
An
nu
al I
nco
me
Ava
ilab
le f
or
Ho
usi
ng
Number of Households
Annualized market price of minimum unit = $19,000
Annualized market price of average home (with taxes and insurance) = $29,000

Addressing the Housing Affordability Crisis in San Diego and Beyond
San Diego Housing Commission | November 25, 2015 | Page 44 of 96
square feet), is less than half the size of an average San Diego home, sized at an average of 220
square meters (2,368 square feet).
Half of San Diego Households Face Affordability Challenges across Homeownership and Rentals Housing affordability is a challenge for both homeowners and renters, nationally, statewide and in
San Diego. Just as home prices have been rising rapidly over the past five years, rents and rental
demand have also been surging both nationally and in San Diego. In San Diego, based on 2013
Census data, we estimate that approximately half of city households face affordability challenges in
paying housing costs. This includes nearly half of homeowners with a mortgage and over 50% of
renters. The situation has become less affordable over the past year for both owners and renters.

Addressing the Housing Affordability Crisis in San Diego and Beyond
San Diego Housing Commission | November 25, 2015 | Page 45 of 96
Figure 7: Affordability in San Diego across Housing Categories33
In San Diego, nearly half of the population faces affordability issues
Number of households in San Diego by housing category
33 Census Bureau AMS Survey (2013). McKinsey, San Diego Regional Task Force on Homelessness.
130,000
80,000
106,000
92,000
56,000
Unsheltered Homeless
Shelter Residents
Rentals Owned with Mortgage
Total Fully Owned
254,000
215,000
3,000
Population Facing Affordability Issues
55% of renters spend > 30% Income on housing
46% of owners with mortgages pay > 30% income on housing
3,000
Addressing the Housing Affordability Crisis in San Diego and Beyond
San Diego Housing Commission | November 25, 2015 | Page 46 of 96
Rents Rising Sharply in Urban Centers as Rental Demand Soars and Supply Lags Rental demand is increasing rapidly in urban centers across the nation and the supply of rental units
is not keeping pace, as documented in recent studies by the Harvard Joint Housing Center and the
NYU Furman Center.34 In 2014, the national apartment vacancy rate fell below 7.6%, its lowest point
in 20 years.35 Meanwhile, average rents nationally increased by 3.4% for a 1 bedroom and 2.5% for a 2
bedroom between April 2014 and April 2015.36 Rents are rising most rapidly in the medium priced
rental market due to constrained supply at the middle price point for rentals, as compared to luxury
and affordable housing rentals.37
The NYU Furman Center’s 2015 study of 11 large US cities found that tightening rental markets, with
lower vacancy rates and higher rents, meant it became harder between 2006 and 2013 for Americans
to find rental housing they could afford in the 11 largest US cities.38 The eleven cities included in the
report are: New York, Los Angeles, Chicago, Houston, Philadelphia, Dallas, San Francisco,
Washington, D.C., Boston, Atlanta and Miami. This is due to increased demand for rentals and a
shortage of supply. In 2006, the majority of the population in just five of the largest 11 U.S. cities
lived in rental housing; in 2013, that number increased to nine.39 As demand for rental housing grew
faster than available supply, rental vacancy rates declined in all but two of the 11 cities, making it
harder to find units for rent.40
San Diego is One of the Six Most Unaffordable Rental Markets in the Country The rental housing shortage is acute in San Diego and rents are rising rapidly. The vacancy rate is
currently at a historical low of 2.3%, well below the historical average of 5%.41 Over half of City of San
Diego renter households are facing an unaffordable rental burden, meaning these renters are paying
more than 30% of their income for housing costs.
Estimates of current median rent for a 2-bedroom apartment in San Diego varies from $1,390 to over
$2,000, depending on the source and whether it is including the city or the entire metropolitan
area.42 According to CBRE, from 2004 to 2014, the average rent in San Diego County rose from
$1,242 to $1,542 per month, a 24 percent increase. By 2019, CBRE estimates average rent to hit $1,830
34 The State of the Nation’s Housing. Joint Center for Housing Studies of Harvard University. Harvard University. http://bit. ly/1kKwpkW. Accessed July 27, 2015. Sean Capperis, Ingrid Gould Ellen and Brian Karfunkel. Renting in America’s Largest Cities. Furman Center for Real Estate and Urban Studies. May 2015. 35 The State of the Nation’s Housing. Joint Center for Housing Studies of Harvard University. 36 www.ApartmentList.com (Accessed 08/15/2015). 37 San Diego Association of Governments Regional Housing Progress Report 2003 to 2013, March 20, 2015. http://www.sandag.org/uploads/publicationid/publicationid_1928_18891.pdf. (Accessed 09/27/2015). 38 Sean Capperis, Ingrid Gould Ellen and Brian Karfunkel. Renting in America’s Largest Cities. NYU Furman Center for Real Estate and Urban Studies. May 2015. The elven cities are: New York, Los Angeles, Chicago, Houston, Philadelphia, Dallas, San Francisco, Washington, D.C., Boston, Atlanta and Miami). 39 Renting in America’s Largest Cities. NYU Furman Center for Real Estate and Urban Studies. May 2015. 40Renting in America’s Largest Cities. NYU Furman Center for Real Estate and Urban Studies. May 2015. 41 JLL. August 2015. 42 US Census Bureau AMS Survey (2103).

Addressing the Housing Affordability Crisis in San Diego and Beyond
San Diego Housing Commission | November 25, 2015 | Page 47 of 96
per month.43 Zillow estimates that current rents for the San Diego metro and the city of San Diego
are over $2,300 per month for a two bedroom as of July 2015.44 Jones Lang LaSalle estimates that
mean rent for a City of San Diego two bedroom apartment is $1819 as of August 2015.45
A recent Apartmentlist.com study listed the City of San Diego as one of the ten US cities with the
highest rents in the country. As of June 2015, ApartmentList.com identifies the city of San Diego as
the ninth most expensive city in the nation to rent an apartment, at an average of $1,800 per month
for a 2 bedroom.
Figure 8: ApartmentList.com List of 10 Most Expensive US Cities
Source: ApartmentList.com
Zillow recently surveyed rents in 89 cities across the country and identified six cities as “the
unaffordable six” – San Diego is one of those unaffordable six, along with New York, Los Angeles,
Miami, San Francisco and San Jose.46 Zillow’s analysis concludes that on average, San Diegans should
currently expect to pay 9.6 percent more of their income for rent than they did between 1985 and
2000 (43.2 percent now versus 33.6 percent historically).47
43 Dixie Hall, CBRE, quoted in Union Tribune (http://www.sandiegouniontribune.com/news/2014/sep/18/rents-housing-supply-downtown-units-forrent/). 44 Zillow, http://www.zillow.com/research/6-least-affordable-rental-markets-9412/ (Accessed 08/08/2015). 45 JLL. August 2015. 46 Zillow, http://www.zillow.com/research/6-least-affordable-rental-markets-9412/ (Accessed 08/08/2015). 47 Zillow, http://www.zillow.com/research/6-least-affordable-rental-markets-9412/ (Accessed 08/08/2015).
$0
$500
$1,000
$1,500
$2,000
$2,500
$3,000
$3,500
$4,000
$4,500
$5,000
10 U.S. Cities With The Highest Rents

Addressing the Housing Affordability Crisis in San Diego and Beyond
San Diego Housing Commission | November 25, 2015 | Page 48 of 96
One of the explanations for high housing costs in Zillow’s “unaffordable six” cities is an acute
shortage of supply. Zillow finds this hypothesis to have merit - demonstrating a distinct relationship
between a metro’s normalized permit measure and rent affordability.48 In each of the “unaffordable
six” markets, the number of permits issued for new apartment construction falls far short of the
amount needed to keep up with population growth. The chart in Figure 9 displays this finding.
Figure 9: Building Permits Lag in Most Unaffordable Cities
Source: Zillow
48 Zillow, http://www.zillow.com/research/6-least-affordable-rental-markets-9412/ (Accessed 08/08/2015).
0 200 400 600 800 1000 1200 1400 1600 1800 2000Permits Per 1000 New Residents
20%
25%
30%
35%
40%
45%
50%
Pe
rce
nt
of
Inco
me
Sp
en
t o
n R
en
t (2
01
4 Q
4)
San Jose, CA
San Francisco, CA
San Diego, CA New York, NY
Miami-Fort Lauderdale, FL
Los Angeles, CA
Riverside, CA
Detroit, MI
Albuquerque, NM
Allentown, PA
Baton Rouge, LA
Buffalo, NY
Chicago, IL
Cleveland, OH
Dayton, OH
El Paso, TX
Lancaster, PA
New Orleans, LA
Ogden, UT
Providence, RI
St. Louis, MO
Syracuse, NY
Toledo, OH
Figure 2: Building Permits vs Rent AffordabilityBuildingPermitsvs.RentAffordability

Addressing the Housing Affordability Crisis in San Diego and Beyond
San Diego Housing Commission | November 25, 2015 | Page 49 of 96
San Diego Home Prices Are Unaffordable For Over 70% of Households Today, the social mobility provided by the American Dream of owning a home is increasingly out of
reach for average households. National homeownership rates are at a 20-year low. 49 Reasons
include: rising home prices, constrained credit availability, particularly for low and moderate income
families, inability to save for a down payment due to high rental costs, millennials living with parents
longer due to high student debt, millennial preferences for renting in urban centers, shifts in
preferences of owning versus renting following the housing crash of 2008 and damaged financial
profiles due to the financial crisis. According to the National Association of Realtors, the number of
first-time buyers entering the market nationally is at the lowest point since 1987.50
In the City of San Diego, the median home price is $506,000 as of June 2015, according to Zillow.51
The chart in Figure 10 with data from Zillow shows home prices in the City of San Diego from 2005
through 2015.
Figure 10: Average Home Prices in the City of San Diego, 2005 to 2015
Source: Zillow
49 The State of the Nation’s Housing. Joint Center for Housing Studies of Harvard University. Harvard University. http://bit. ly/1kKwpkW. Accessed July 27, 2015. 50 Statement of the National Association of Realtors for Hearing Entitled: Inequality, Opportunity and the Housing Market. United States Senate Committee on Banking, Housing and Urban Affairs, Subcommittee on Housing Transportation and Community Development. December 9, 2014. 51 Zillow, See http://www.zillow.com/san-diego-ca/home-values/. (Accessed 8/8/2015).
$350,000
$370,000
$390,000
$410,000
$430,000
$450,000
$470,000
$490,000
$510,000
$530,000
$550,000
Jul 2
00
5
Jan
20
06
Jul 2
00
6
Jan
20
07
Jul 2
00
7
Jan
20
08
Jul 2
00
8
Jan
20
09
Jul 2
00
9
Jan
20
10
Jul 2
010
Jan
20
11
Jul 2
011
Jan
20
12
Jul 2
012
Jan
20
13
Jul 2
013
Jan
20
14
Jul 2
014
Jan
20
15

Addressing the Housing Affordability Crisis in San Diego and Beyond
San Diego Housing Commission | November 25, 2015 | Page 50 of 96
San Diego Wages Have Not Been Keeping Pace with Increasing Housing Costs Wages in San Diego have failed to keep pace with rising housing costs. From 2010 to 2014, wages in the San Diego metro have increased less than 5.6%, less than the increase in inflation of 8% over the same period.52 In real terms, purchasing power in the past five years has decreased for San Diego residents, while home prices increased by approximately 36% and rents increased by approximately 25%.53 This mismatch between increasing home prices and stagnant wages has caused affordability challenges across the income spectrum and rising barriers for first-time homebuyers. Over the past year, wages in San Diego have increased just 1.2%, on the low side as compared to other large MSAs.
Figure 11: Mean Hourly Wages and Inflation in San Diego 2010 – 2014
5.6% increase in mean hourly wages between 2010 and 2014 8.0% increase in inflation (consumer price index) between 2010 and 2014
Source: US Bureau of Labor Statistics
52 US Bureau of Labor Statistics 53 Zillow, See http://www.zillow.com/san-diego-ca/home-values/. (Accessed 8/8/2015).
235
240
245
250
255
260
265
270
$23.00
$23.50
$24.00
$24.50
$25.00
$25.50
$26.00
2010 2011 2012 2013 2014
Co
nsu
me
r P
rice
In
de
x
Me
an H
ou
rly
Wag
e
Mean Hourly Wage Consumer Price Index

Addressing the Housing Affordability Crisis in San Diego and Beyond
San Diego Housing Commission | November 25, 2015 | Page 51 of 96
Figure 12: Percent Change in Wages for San Diego and Other Metros Over Past Year
Source: US Bureau of Labor Statistics
B. Impact of Housing Affordability on Low-Income Households The burden imposed by a shortage of rental housing is most acute for low-income households. Since
2000, rents have risen and the number of renters who need low priced housing has increased. 54
These two pressures make finding affordable housing even tougher for very poor households in the
United States.55 The Low Income Housing Coalition’s 2015 Out of Reach report outlines the many
economic challenges facing low income renters, including stagnant wages, inconsistent job growth,
and rising costs of living.56 In the context of all these challenges, Out of Reach identifies a lack of
affordable housing as the most significant problem for low-income households.57
Particularly for low-income households, the gap between what people earn and the cost of minimally
acceptable housing continues to grow. This is true nationally, in the State of California, and in the
City of San Diego. Nationwide, only 28 adequate and affordable units are available for every 100
renter households with incomes at or below 30 percent of the area median income.58 Not a single
county in the United States has enough affordable housing for all its extremely low-income (ELI)
54 Josh Leopold, Liza Getsinger, Pamela Blumenthal, Katya Abazajian and Reed Jordan. The Housing Affordability Gap for Extremely Low Income Renters in 2013. The Urban Institute. June 2015. 55 The Housing Affordability Gap for Extremely Low Income Renters in 2013. 56 Althea Arnold, Sheila Crowley, Elina Bravve, Sarah Brundage, and Christine Biddlecombe. Out of Reach 2014.
National Low Income Housing Coalition. 2014. http://nlihc.org/sites/default/files/oor/2014OOR.pdf. Accessed 7/24/15. 57 National Low Income Housing Coalition. Out of Reach 2014. 58 The Housing Affordability Gap for Extremely Low Income Renters in 2013.
-2.0% -1.0% 0.0% 1.0% 2.0% 3.0% 4.0% 5.0% 6.0% 7.0%
San Francisco-Oakland-Hayward, CA
Sacramento--Roseville--Arden-Arcade, CA
San Jose-Sunnyvale-Santa Clara, CA
Seattle-Tacoma-Bellevue, WA
San Diego-Carlsbad, CA
Los Angeles-Long Beach-Anaheim, CA
Phoenix-Mesa-Scottsdale, AZ
San Antonio-New Braunfels, TX
Riverside-San Bernardino-Ontario, CA

Addressing the Housing Affordability Crisis in San Diego and Beyond
San Diego Housing Commission | November 25, 2015 | Page 52 of 96
renters.59 In addition, only one in four households nationwide eligible for rental subsidies actually
receives assistance due to overwhelming demand.60
Translating the affordability challenge into wages, the Low Income Housing Coalition estimates that
nationally, in order to afford a modest, two-bedroom apartment in the U.S., renters need to earn a
wage of $19.35 per hour.61 In 13 states and the District of Columbia they need to earn more than $20
per hour.62 The estimated average hourly wage for renters nationally is $15.16.63
Low-income households are disproportionately rent-burdened as shown in Figure 13 below for the
City of San Diego.
Figure 13: Percent of Income Renters Spend on Housing in City of San Diego, By Annual Income
Bracket
Source: US Census Bureau AMS Survey (2013)
California faces a shortage of 956,461 homes affordable and available to California’s lowest income
households. 64 At the same time, median rents in California increased by over 20% from 2000 to 2012,
while median income dropped 8%.65 San Diego also faces a severe shortage of units available to low-
59 The Housing Affordability Gap for Extremely Low Income Renters in 2013. 60 Tracey Ross. No Place Like Home: Addressing Poverty and Homelessness in the United States. Center for American Progress. 2103. 61 Out of Reach 2014. 62 Out of Reach 2014. 63 Out of Reach 2014. 64 California Housing Partnership Corporation, How California’s Housing Market is Failing to Meet the Needs of
Low-Income Families: Recommendations to the Leaders of the State of California. February 2014. 65 How California’s Housing Market is Failing to Meet the Needs of Low-Income Families.
0%
10%
20%
30%
40%
50%
60%
Less than $20,000 $20,000- $34,999 $35,000- $49,999 $50,000- $74,999 $75,000 or more
Pe
rce
nta
ge
of
Inco
me
Annual Income
Over 30% Under 30%

Addressing the Housing Affordability Crisis in San Diego and Beyond
San Diego Housing Commission | November 25, 2015 | Page 53 of 96
income renters. According to the Urban Institute data and the SANDAG Regional Housing
Dashboard, there are only about 21,000 affordable units available in San Diego for approximately
120,000 very low income households.
In 2013 in San Diego, a renter earning 30% or less of the area median income could afford to pay $548
in rent.66 Median rental cost for a 2-bedroom apartment was estimated to be $1,390 in the 2013
Census.67 In the past two years, median rental cost has risen to at least $1,500, while wages have
remained about the same, causing an even greater affordability challenge for low-income families.
For most low-income families and a significant number of moderate-income families, the median
rents in San Diego are not affordable. There is a severe shortage of affordably priced rental units and
the affordability gap is growing worse by the month. This affordability squeeze for low-income
families is occurring across California, as shown in Figure 14 below.
Figure 14: Comparison of California Rental Housing Costs
Housing Cost Measure State of
California San Diego
County Los Angeles
County San Francisco
County Santa Clara
County
2 BR Rent $1,386 $1,390 $1,424 $2,062 $1,809
Income Needed to Afford 2 BR Rent
$55,433 $55,600 $56,960 $82,480 $72,360
Median Renter Income $43,701 $45,207 $40,577 $59,656 $64,327
Affordable Monthly Rent at Mean Renter Wage
$1,093 $1,130 $1,014 $1,491 $1,608
Affordable Rent at 30% AMI
$542 $548 $473 $764 $797
Affordable Rent at Minimum Wage
$468 $468 $468 $468 $468
Gap Between Affordable Monthly Rent at Mean Renter Wage and 2 BR
Rent
$293 $260 $410 $571 $201
Source: National Low Income Housing Coalition
66 Out of Reach 2014. 67 US Census Bureau AMS Survey (2013).
Addressing the Housing Affordability Crisis in San Diego and Beyond
San Diego Housing Commission | November 25, 2015 | Page 54 of 96
One in Three San Diego Households Do Not Have Sufficient Income to Meet Basic Expenses, and Housing is the Largest Component of Expenses Increasing the supply of quality, affordable housing is essential to any strategy to end homelessness,
poverty, and to reverse rising economic inequality.68 According to the United Way’s Real Cost
Measure, one in three San Diego households (30%) do not have sufficient income to meet their basic
costs of living.69 Struggling families spend over 50% of their income on housing, and families living
below the Federal Poverty Level can spend as much as 80% of their income on housing.70 The Real
Cost Measure is a metric that more accurately measures the number of families struggling to make
ends meet, as compared to the Federal Poverty Line.71 Basic costs of living as defined in the Real Cost Measure include:
(i) Housing (29%) (ii) Childcare (21%) (iii) Transportation (15%) (iv) Healthcare (10%) (v) Food (16%) (vi) Taxes (9%)
Housing is the largest component of household expenses in the Real Cost Measure. Families with
two full-time, minimum wage jobs do not make enough to meet basic costs of living. For two full-
time, minimum wage earners earning $33,280 in gross income combined, annual expenses would
exceed annual income by $18,034.72 The cost of housing in San Diego annually is approximately
$19,000, or over 50% of annual income.
The most expensive time for families is early childhood when childcare costs are highest. Over time,
family budgets change with regard to childcare costs. In California, approximately one-half (51%) of
low-income households with children under six years of age are unable to meet basic costs of living,
and that rate jumps to 76% for single mothers with children under six.73 Although seniors have
different needs and work-force participation, United Way finds that a similar share—almost 1 in 3
(31%) are struggling to meet basic expenses.74 Households of color are disproportionately likely to
have inadequate income to meet basic expenses. In California, 51% of Latino households and 40% of
African American households have incomes insufficient to meet basic expenses. This is followed by
Asian- American households (28%) and white households (20%).75
68 Out of Reach 2014. 69 Betsy Baum Block, Henry Gascon, Peter Manzo and Adam D. Parker. Struggling To Get By: The Real Cost Measure in California 2015. United Way of California. 2015. 70 Struggling To Get By: The Real Cost Measure in California 2015. United Way of California. 2015. 71 Struggling To Get By: The Real Cost Measure in California 2015. United Way of California. 2015. 72 Struggling To Get By: The Real Cost Measure in California 2015. United Way of California. 2015. 73 Struggling To Get By: The Real Cost Measure in California 2015. United Way of California. 2015. 74 Struggling To Get By: The Real Cost Measure in California 2015. United Way of California. 2015. 75 Struggling To Get By: The Real Cost Measure in California 2015. United Way of California. 2015.
Addressing the Housing Affordability Crisis in San Diego and Beyond
San Diego Housing Commission | November 25, 2015 | Page 55 of 96
C. Growing Income Inequality
Income inequality has grown significantly over the past 25 years.76 Homeownership has historically
been an important tool for wealth building and social mobility in the United States. For example,
following the financial crisis of 2008, homeowners have fared much better than renters. Nationally,
from 2010 to 2013, the wealth of homeowners grew by $20,900 from 2010 to 2013 as compared to
just $300 for renters.77 The median net worth of a homeowner in 2013 was $195,400 versus $5,400 for
renters.78 Of course, other factors that lead to homeownership, also lead to wealth accumulation,
but much of the increase in households’ wealth over time can be directly attributed to increases in
the value of housing, particularly the value of land, based on recent scholarship on the topic of
housing and wealth inequality.79
Recent economic literature argues that increases in land and property values explain the majority of
growth in income inequality over the past several decades. Matthew Rognlie argues that while
returns on non-property investments have remained flat, returns on real property have grown
dramatically. Rognlie suggests that the place to start in terms of reducing income inequality is to
examine the role of land use regulation in bidding up land values and causing property owners to
accumulate wealth much more rapidly than non-land owners.80
Figure 15 below shows the unequal national wage growth over the past twenty five years nationally.
The upper income brackets have seen wage growth increase, while the lowest income brackets have
not seen wage growth increase at all over the past quarter century. This divergence in wage growth
trends has led to increased income inequality over the past twenty-five years.
76 US Bureau of Labor Statistics. 77 Statement of the National Association of Realtors for Hearing Entitled: Inequality Opportunity and the Housing Market. Senate Committee on Banking, Housing and Urban Affairs, Subcommittee on Housing Transportation and Community Development. December 9, 2014. 78 Statement of the National Association of Realtors for Hearing Entitled: Inequality Opportunity and the Housing Market. December 9, 2014. 79 Thomas Piketty. Capital in the Twenty-First Century. Harvard University Press. 2014 80 Matthew Rognlie. (2014, June 15). A note on Piketty and diminishing returns to capital. Retrieved from http://www.mit.edu/~mrognlie/piketty_diminishing_returns.pdf

Addressing the Housing Affordability Crisis in San Diego and Beyond
San Diego Housing Commission | November 25, 2015 | Page 56 of 96
Figure 15: Unequal National Wage Growth Over Past 25 Years
Selected percentiles of usual weekly earnings of full-time wage and salary workers age 16 and older, in 2014 dollars. 1979-2014
Source: US Census Bureau of Labor Statistics
California has one of the highest levels of income inequality in the nation, as shown on the map
below from the US Bureau of Labor Statistics. In California, the highest paid 10% of workers make 5.6
times more than the lowest paid 10% of workers – this inequality ratio is among the highest of all
states in the nation.81
81 US Bureau of Labor Statistics. See http://www.bls.gov/spotlight/2015/a-look-at-pay-at-the-top-the-bottom-and-in-between/home.htm. (Accessed 8/8/2015).
0
1
2
3
4
5
6
1979 1984 1989 1994 1999 2004 2009 2014
90th to 10th
90th to 25th
90th to 50th
90th to 75th
75th to 10th
75th to 25th
75th to 50th
50th to 10th
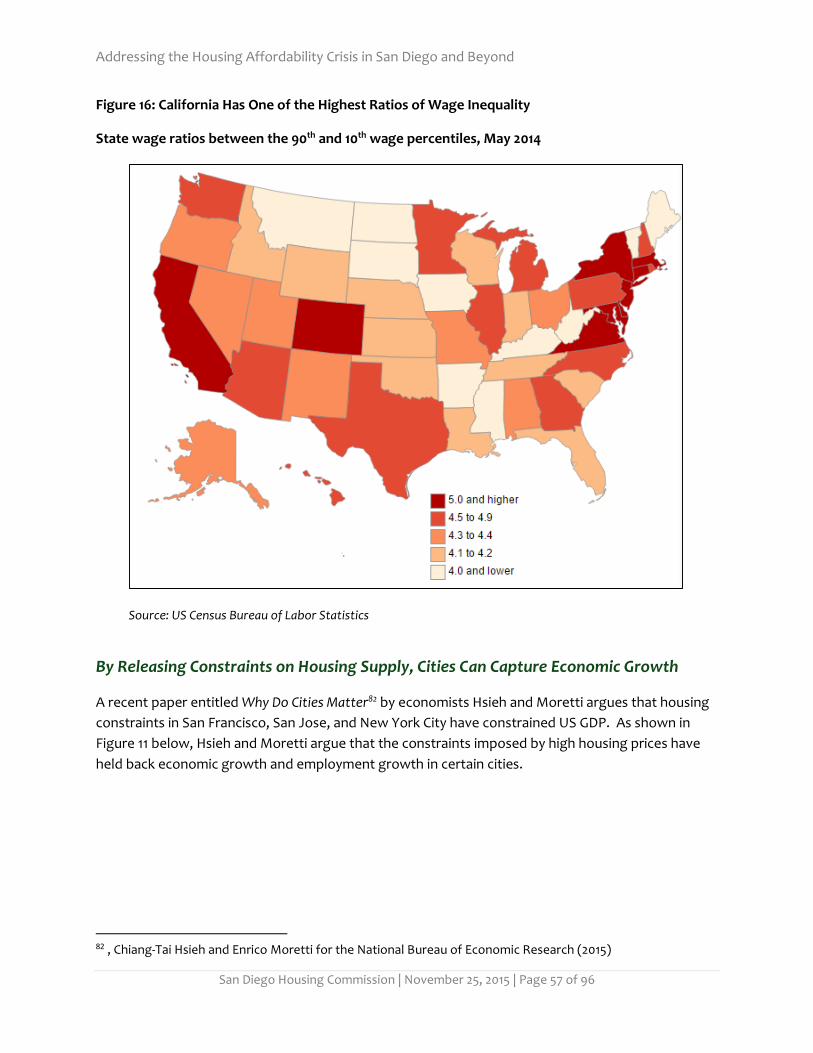
Addressing the Housing Affordability Crisis in San Diego and Beyond
San Diego Housing Commission | November 25, 2015 | Page 57 of 96
Figure 16: California Has One of the Highest Ratios of Wage Inequality
State wage ratios between the 90th and 10th wage percentiles, May 2014
Source: US Census Bureau of Labor Statistics
By Releasing Constraints on Housing Supply, Cities Can Capture Economic Growth
A recent paper entitled Why Do Cities Matter82 by economists Hsieh and Moretti argues that housing
constraints in San Francisco, San Jose, and New York City have constrained US GDP. As shown in
Figure 11 below, Hsieh and Moretti argue that the constraints imposed by high housing prices have
held back economic growth and employment growth in certain cities.
82 , Chiang-Tai Hsieh and Enrico Moretti for the National Bureau of Economic Research (2015)

Addressing the Housing Affordability Crisis in San Diego and Beyond
San Diego Housing Commission | November 25, 2015 | Page 58 of 96
Figure 17: Employment Growth Constrained by Housing Restrictions83
Research suggests that in some cities, housing restrictions are holding back economic growth. If those restrictions were not in place, how much would employment grow?
Source: Hsieh and Moretti, 2015
83 Amy Merrick, & Natasha Gural. (2015, May 31). Welcome to Nerdopolis. The University of Chicago Booth School of Business. Retrieved from http://preface.com/pdf/Welcome-to-Nerdopolis.pdf
237.70%
509.90%
522.40%
787.70%
Austin, TX
San Francisco
San Jose, CA
New York
Estimated Employment Growth - No Housing Cost Constraints
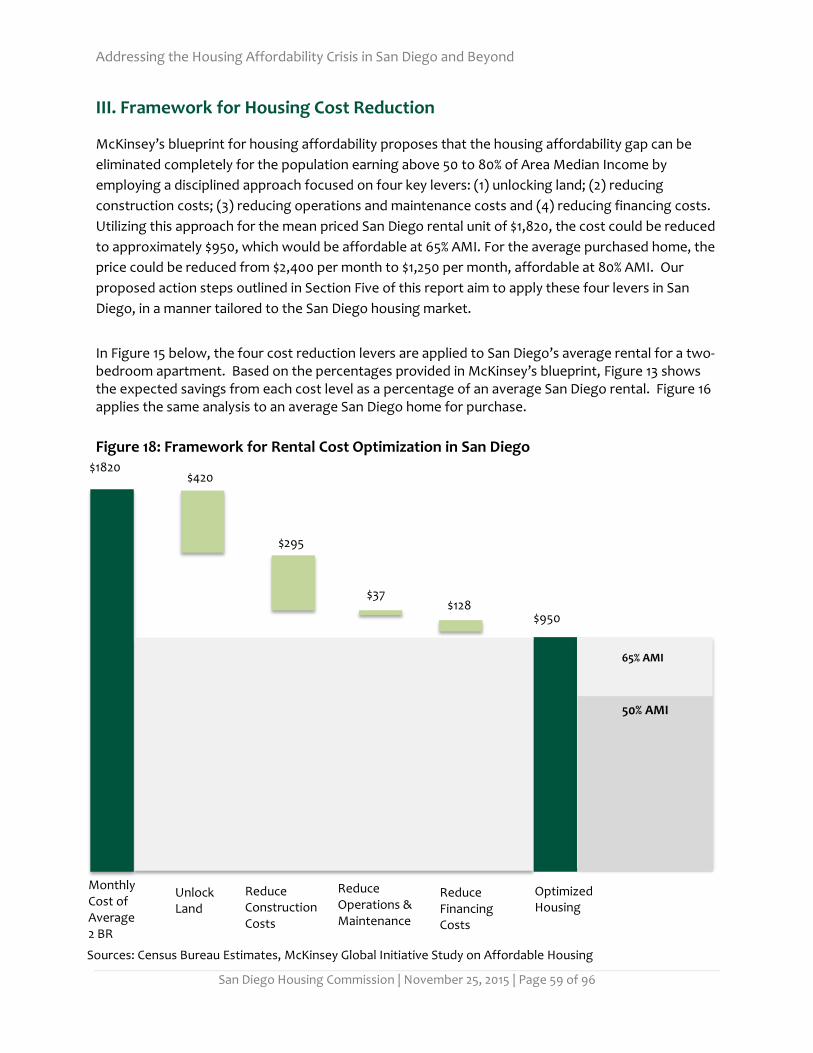
Addressing the Housing Affordability Crisis in San Diego and Beyond
San Diego Housing Commission | November 25, 2015 | Page 59 of 96
III. Framework for Housing Cost Reduction
McKinsey’s blueprint for housing affordability proposes that the housing affordability gap can be
eliminated completely for the population earning above 50 to 80% of Area Median Income by
employing a disciplined approach focused on four key levers: (1) unlocking land; (2) reducing
construction costs; (3) reducing operations and maintenance costs and (4) reducing financing costs.
Utilizing this approach for the mean priced San Diego rental unit of $1,820, the cost could be reduced
to approximately $950, which would be affordable at 65% AMI. For the average purchased home, the
price could be reduced from $2,400 per month to $1,250 per month, affordable at 80% AMI. Our
proposed action steps outlined in Section Five of this report aim to apply these four levers in San
Diego, in a manner tailored to the San Diego housing market.
In Figure 15 below, the four cost reduction levers are applied to San Diego’s average rental for a two- bedroom apartment. Based on the percentages provided in McKinsey’s blueprint, Figure 13 shows the expected savings from each cost level as a percentage of an average San Diego rental. Figure 16 applies the same analysis to an average San Diego home for purchase.
Figure 18: Framework for Rental Cost Optimization in San Diego
Monthly Cost of Average 2 BR Rental
$1820
Unlock Land
Reduce Construction Costs
Reduce Operations & Maintenance Costs
Reduce Financing Costs
Optimized Housing Cost
$420
$37
$295
$128 $950
50% AMI
65% AMI
Sources: Census Bureau Estimates, McKinsey Global Initiative Study on Affordable Housing

Addressing the Housing Affordability Crisis in San Diego and Beyond
San Diego Housing Commission | November 25, 2015 | Page 60 of 96
Figure 19: Framework for Homeownership Cost Optimization in San Diego
Sources: Census Bureau Estimates, McKinsey Global Initiative Study on Affordable Housing

Addressing the Housing Affordability Crisis in San Diego and Beyond
San Diego Housing Commission | November 25, 2015 | Page 61 of 96
Appendix 1: Methodology
Addressing the Housing Affordability Crisis in San Diego and Beyond
San Diego Housing Commission | November 25, 2015 | Page 62 of 96
Methodology Part I: Keyser Marston Associates Analysis

Addressing the Housing Affordability Crisis in San Diego and Beyond
San Diego Housing Commission | November 25, 2015 | Page 63 of 96
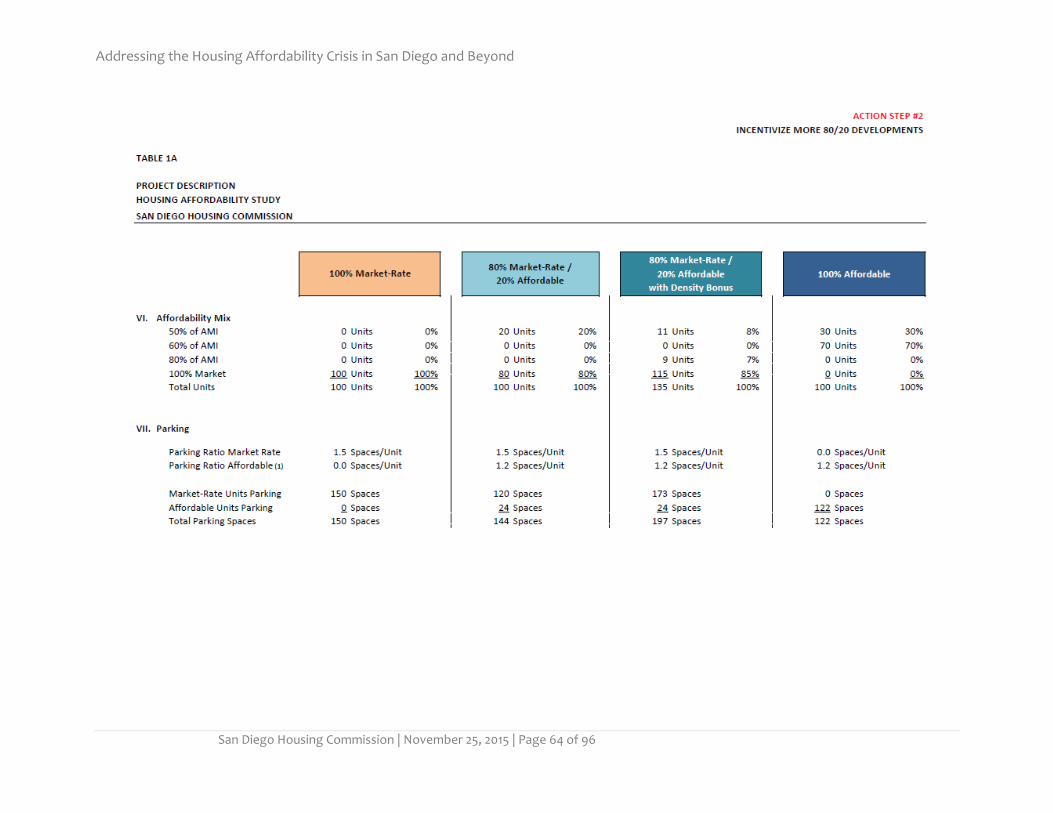
Addressing the Housing Affordability Crisis in San Diego and Beyond
San Diego Housing Commission | November 25, 2015 | Page 64 of 96
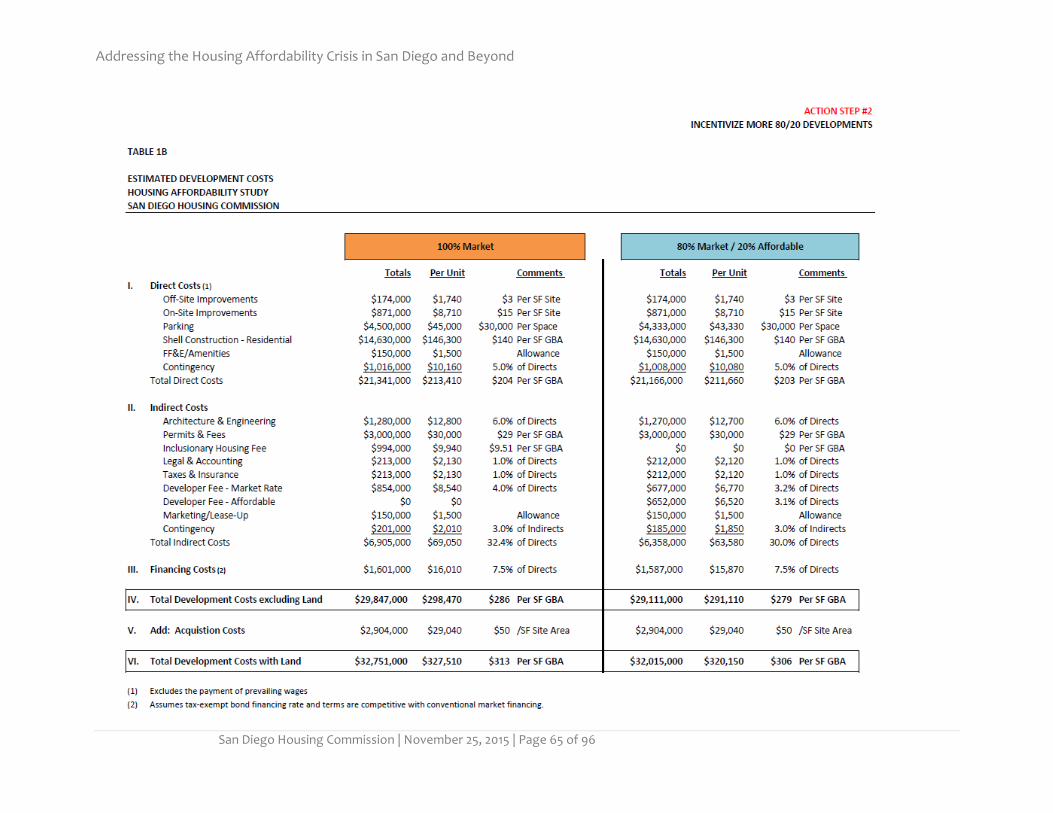
Addressing the Housing Affordability Crisis in San Diego and Beyond
San Diego Housing Commission | November 25, 2015 | Page 65 of 96

Addressing the Housing Affordability Crisis in San Diego and Beyond
San Diego Housing Commission | November 25, 2015 | Page 66 of 96
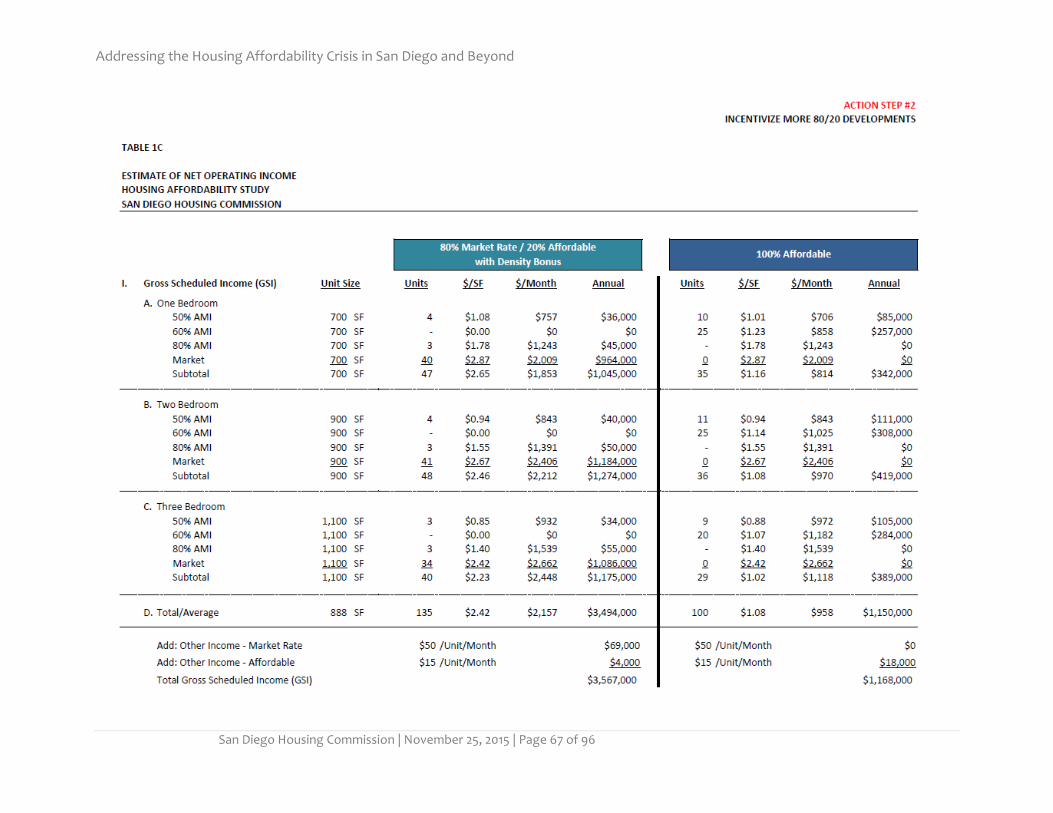
Addressing the Housing Affordability Crisis in San Diego and Beyond
San Diego Housing Commission | November 25, 2015 | Page 67 of 96

Addressing the Housing Affordability Crisis in San Diego and Beyond
San Diego Housing Commission | November 25, 2015 | Page 68 of 96

Addressing the Housing Affordability Crisis in San Diego and Beyond
San Diego Housing Commission | November 25, 2015 | Page 69 of 96

Addressing the Housing Affordability Crisis in San Diego and Beyond
San Diego Housing Commission | November 25, 2015 | Page 70 of 96
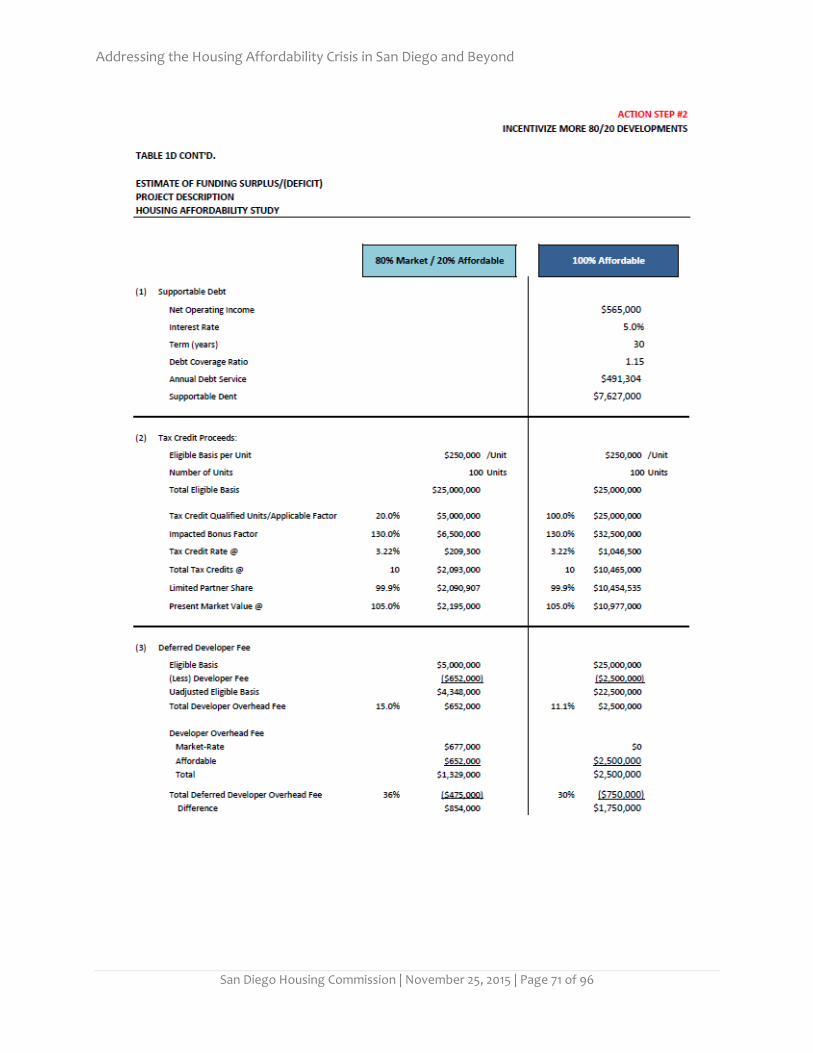
Addressing the Housing Affordability Crisis in San Diego and Beyond
San Diego Housing Commission | November 25, 2015 | Page 71 of 96

Addressing the Housing Affordability Crisis in San Diego and Beyond
San Diego Housing Commission | November 25, 2015 | Page 72 of 96

Addressing the Housing Affordability Crisis in San Diego and Beyond
San Diego Housing Commission | November 25, 2015 | Page 73 of 96

Addressing the Housing Affordability Crisis in San Diego and Beyond
San Diego Housing Commission | November 25, 2015 | Page 74 of 96

Addressing the Housing Affordability Crisis in San Diego and Beyond
San Diego Housing Commission | November 25, 2015 | Page 75 of 96

Addressing the Housing Affordability Crisis in San Diego and Beyond
San Diego Housing Commission | November 25, 2015 | Page 76 of 96
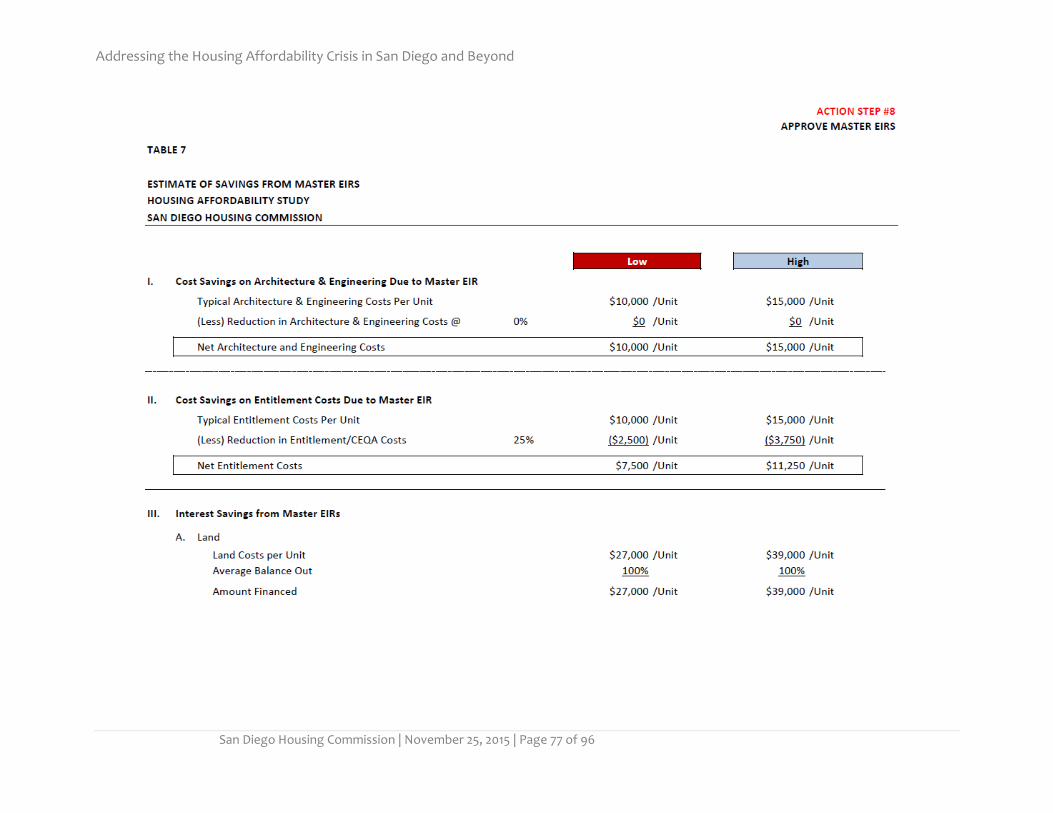
Addressing the Housing Affordability Crisis in San Diego and Beyond
San Diego Housing Commission | November 25, 2015 | Page 77 of 96
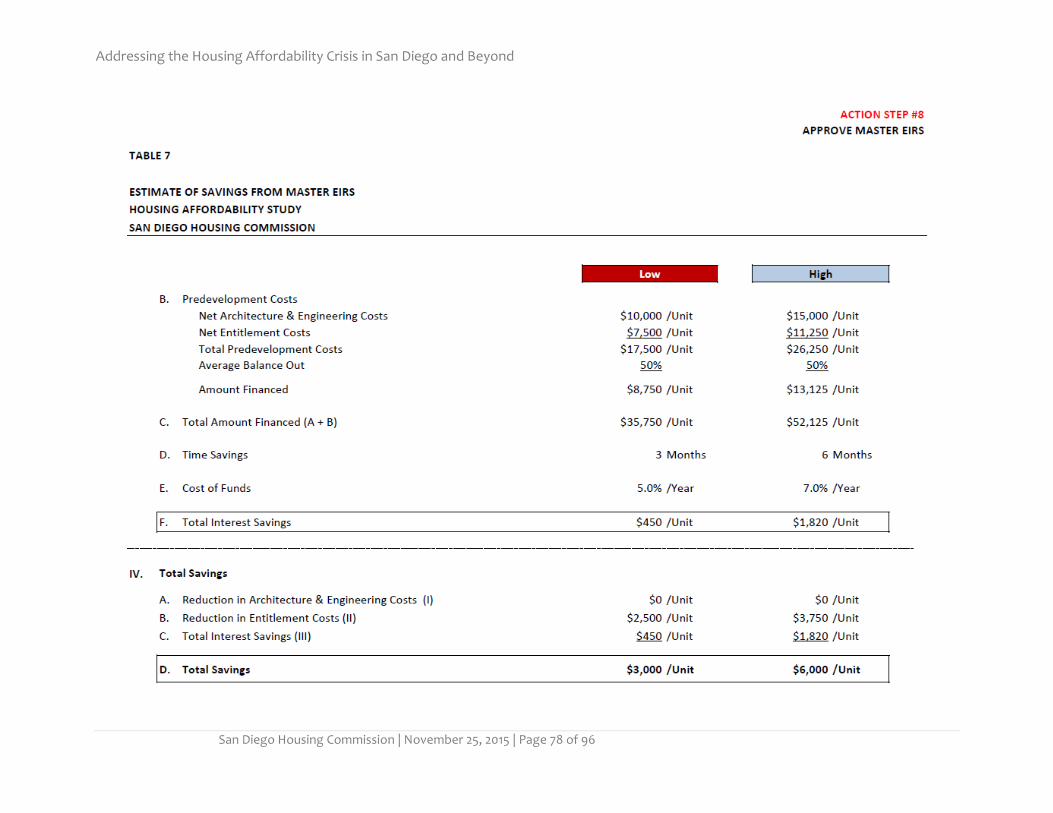
Addressing the Housing Affordability Crisis in San Diego and Beyond
San Diego Housing Commission | November 25, 2015 | Page 78 of 96
Addressing the Housing Affordability Crisis in San Diego and Beyond
San Diego Housing Commission | November 25, 2015 | Page 79 of 96
Methodology Part II: Calculation of the Housing
Affordability Gap
The housing affordability gap calculations are modeled on the methodology utilized in the McKinsey
Global Institute Blueprint for Addressing the Global Affordable Housing Challenge. First, we utilize
2013 Census data to establish initial income brackets and the number of households in each bracket.
We then divided the data into seven income brackets with roughly even population in each bracket.
We adjusted the income data to account for small increases since 2013, based on US Bureau of Labor
statistics data on wage changes in San Diego over the last two years.
Having established the seven income brackets and number of households in each bracket, we then
took 30% of the annual income of each bracket and used that number in the chart to indicate the
household resources available to pay for housing annually.
Next, we estimated average annual housing costs in San Diego for a minimally acceptable housing
unit, defined as 100 square meters or approximately 1076 square feet. Using Trulia’s average of $385
per square foot for a two bedroom, which would result in a home price of approximately $414,000.
We then subtracted a 20% down payment leaving a mortgage of approximately $331,500. Using the
Freddie Mac Primary Mortgage Survey Rate of 3.91% as of August 2015, that results in a monthly
payment of $1565 or $18,800 annually. We then added to that costs for property taxes ($7200
annually) and insurance ($1000 annually) resulting in a total cost of $27,000 annually.
Last, we estimated the annual cost of an average home in San Diego. For that calculation we
followed similar steps to the calculation for the minimal housing unit but began with the average
home price of $506,000 based on information from the Zillow website on average home prices in the
City of San Diego in 2015.

Addressing the Housing Affordability Crisis in San Diego and Beyond
San Diego Housing Commission | November 25, 2015 | Page 80 of 96
Appendix 2: Literature Review
Addressing the Housing Affordability Crisis in San Diego and Beyond
San Diego Housing Commission | November 25, 2015 | Page 81 of 96
Overview
In developing the analysis and recommendations in this report, we conducted a review of a wide array of recent reports on housing affordability published by academia, think tanks, government agencies, trade groups and the private sector. It includes reports from the global, national, state, regional and local levels. We selected a cross section of recent reports analyzing housing affordability challenges and proposed solutions. The literature provides a very brief summary of the reports we found particularly informative in analyzing the housing affordability crisis in San Diego.
Global
1. Jonathan Woetzel, Sangeeth Ram, Jan Mischke, Nicklas Garemo and Shirish Sankhe. A blueprint for addressing the global affordable housing challenge. McKinsey Global Institute. October 2014.
Summary: The study estimates that 330 million urban households around the world live in
substandard housing or are financially stretched by housing costs. Some 200 million households in the developing world live in slums; in the United States, the European Union, Japan, and Australia, more than 60 million households are financially stretched by housing costs. Cities need to think more broadly and creatively about a housing ladder that includes affordable housing but accommodates citizens of all income groups and their changing needs.
Key Findings:
The housing affordability gap is equivalent to $650 billion per year, or 1 percent of global GDP. In some of the least affordable cities, the gap exceeds 10 percent of local GDP. The housing affordability gap is defined as the amount of income greater than 30% of household income spent on housing costs. Housing is generally considered affordable if it costs 30% or less of household income. Any amount over 30% of income spent on housing is “unaffordable” and becomes part of the housing affordability gap.
To replace today’s substandard housing and build additional units needed by 2025 would require an investment of $9 trillion to $11 trillion for construction; with land, the total cost could be $16 trillion. Of this, $1 trillion to $3 trillion may have to come from public funding.
There are four key levers to reduce the cost of delivering affordable housing by 20 to 50 percent: unlock land at the right location (the most important lever), reduce construction costs through value engineering and industrial approaches, increase operations and maintenance efficiency, and reduce financing costs for buyers and developers.
Affordable housing is an overlooked opportunity for developers, investors, and financial institutions. Building units for 106 million more poor urban households by 2025 could require more than $200 billion a year and account for 7 percent of mortgage originations.
Addressing the Housing Affordability Crisis in San Diego and Beyond
San Diego Housing Commission | November 25, 2015 | Page 82 of 96
National
2. Althea Arnold, Sheila Crowley, Elina Bravve, Sarah Brundage, and Christine Biddlecombe. Out of Reach 2014. National Low Income Housing Coalition. 2014. http://nlihc.org/sites/default/files/oor/2014OOR.pdf. Accessed 7/24/15.
Summary: This is an annual report published by the Low Income Housing Coalition. Today, housing is still out of reach for far too many, and the gap between what people earn and the price of decent housing continues to grow. The Housing Wage is an estimate of the full time hourly wage that a household must earn to afford a decent apartment at HUD’s estimated Fair Market Rent (FMR), while spending no more than 30% of income on housing costs. The data in Out of Reach illustrates the gap between wages and rents across the country. In 13 states and D.C. the 2015 Housing Wage is more than $20 per hour. Many renters earn far less than the Housing Wage in their community and struggle to find an affordable place to live. This edition of Out of Reach highlights some of the economic challenges facing low income renters, including lagging wages, inconsistent job growth, and the rising cost of living. Undoubtedly, the lack of affordable housing remains the overarching problem for low-income households, a problem made worse by these economic challenges. Expanding and preserving the supply of quality, affordable housing is essential to any strategy to end homelessness, poverty, and economic inequality. Key Findings:
In order to afford a modest, two-bedroom apartment in the U.S., renters need to earn a wage of $19.35 per hour. In 13 states and the District of Columbia they need to earn more than $20 per hour.
The Housing Wage for a two-bedroom unit is more than two and a half times the federal minimum wage of $7.25, and $4 more than the estimated average wage of $15.16 earned by renters nationwide.
3. Chaing-Tai Hsieh, & Enrico Moretti. Why Do Cities Matter? Local Growth and Aggregate Growth (No. 21154) National Bureau of Economic Research. 2015. Retrieved from http://www.nber.org/papers/w21154.
Summary: When cities create barriers to development of housing, there is an impact on labor productivity because those cities cannot grow if their workforce cannot find housing. This equates to an impact on GDP of approximately 9.5%, according to Hsieh and Moretti’s calculations. Key Findings:
NIMBYism and strict planning regulations are creating a drag on GDP.
Cities with limited housing supply have lower labor productivity rates.
If major cities such as San Jose, San Francisco and New York were to build more housing, US GDP could increase by 9.5%.
High wage cities are contributing less to national GDP because of the large amount of money paid toward housing costs and lower disposable income.

Addressing the Housing Affordability Crisis in San Diego and Beyond
San Diego Housing Commission | November 25, 2015 | Page 83 of 96
4. Josh Leopold, Liza Getsinger, Pamela Blumenthal, Katya Abazajian and Reed Jordan. The Housing Affordability Gap for Extremely Low Income Renters in 2013. The Urban Institute. June 2015. Summary: Since 2000 rents have risen while the number of renters who need low priced housing has increased. These two pressures make finding affordable housing even tougher for very poor households in America. Nationwide, only 28 adequate and affordable units are available for every 100 renter households with incomes at or below 30 percent of the area median income. Not a single county in the United States has enough affordable housing for all its extremely low-income (ELI) renters. The number of affordable rental homes for every 100 ELI renters ranges from 7 in Osceola County, Florida, to 76 in Worcester County, MD. Key Findings:
The provision of adequate affordable housing for ELI households requires more than federal funding. It requires a functioning local housing market and ecosystem.
The key factors are: local resource commitments, resource targeting, state support and federal legacy investments.
5. Matthew Rognlie. A note on Piketty and diminishing returns to capital. June 15, 2015. http://www.mit.edu/~mrognlie/piketty_diminishing_returns.pdf.
Summary: Rognlie’s thesis is that recent trends in capital, wealth and income inequality are driven almost entirely by housing, with underlying mechanisms quite different from those emphasized in Capital in the Twenty-First Century by Thomas Piketty. In Piketty’s 2014 framework, slower growth will produce a rise in the ratio of capital to income. This, in turn, will bring about an expansion in capital’s share of income. Meanwhile, as the growth rate g dwindles and the return on capital r holds relatively steady, the gap r-g will expand, allowing existing accumulations of wealth to grow more rapidly relative to the economy as a whole. This will aggravate inequality in the wealth distribution. Rognile’s model proposes that there are diminishing returns to capital, powerful enough that further capital accumulation will cause a decline in net capital income, rather than an expansion. However, income inequality will continue to increase due to continual increases in land values, partially caused by the artificial scarcity created by land use regulation. Key Findings:
If the return on capital falls quickly enough when more capital is accumulated, capital’s share of income will fall rather than rise—so that even as the balance sheets of capital owners expand, their claim on aggregate output will shrink, decreasing income inequality in the future.
Income inequality has been driven not by return on capital generally but by return on housing capital, primarily large increases in land values.
A natural first step to combat the role of housing wealth in increasing income inequality would be to reexamine land use regulations in order to expand the housing supply.

Addressing the Housing Affordability Crisis in San Diego and Beyond
San Diego Housing Commission | November 25, 2015 | Page 84 of 96
6. Thomas Piketty. Capital in the Twenty-First Century. Harvard University Press. 2014
Summary: Piketty argues that when the rate of return on capital is greater than the rate of economic growth, wealth becomes concentrated amongst very few, and must be redistributed through a tax on the wealthy in order to avoid social and economic instability. According to Piketty, this wealth concentration threatens the democratic order of society. Key Findings:
Proposes a global wealth tax of up to 2% and a progressive income tax to reduce inequality
Argues that failing to redistribute the wealth through a taxation system will eventually result in lower rates of overall economic growth
7. Sean Capperis, Ingrid Gould Ellen and Brian Karfunkel. Renting in America’s Largest Cities. NYU Furman Center for Real Estate and Urban Studies. May 2015.
Summary: The study analyzes rental housing affordability trends in the central cities of the 11 largest metropolitan areas in the U.S. (New York, Los Angeles, Chicago, Houston, Philadelphia, Dallas, San Francisco, Washington, D.C., Boston, Atlanta and Miami) . This study analyzes recent trends in rent levels, rent burdens, affordable units, and the gap between the number of low-income households in need of affordable housing and the number of existing affordable units. Data analysis is based on data from the U.S. Census Bureau, including data from the American Community Survey from 2006 through 2013, and uses geographic information from the Missouri Census Data Center.
Key Findings:
In 2006, the majority of the population in just five of the largest 11 U.S. cities lived in rental housing; in 2013, that number increased to nine.
As demand for rental housing grew faster than available supply, rental vacancy rates declined in all but two of the 11 cities, making it harder to find units for rent.
Rents outpaced inflation in almost all of the 11 cities. Rents increased most in DC, with a 21 percent increase in inflation-adjusted median gross rent, and least in Houston, where rents were stable.
In all 11 cities, an overwhelming majority of low- income renters were severely rent-burdened, facing rents and utility costs equal to at least half of their income.
Even in the most affordable cities in the study, low-income renters could afford no more than 11 percent of recently available units.
In five major cities, including New York, Los Angeles, San Francisco, Boston and Miami, moderate-income renters could afford less than a third of recently available units in 2013.

Addressing the Housing Affordability Crisis in San Diego and Beyond
San Diego Housing Commission | November 25, 2015 | Page 85 of 96
8. Statement of the National Association of Realtors for Hearing Entitled: Inequality, Opportunity and the Housing Market. United States Senate Committee on Banking, Housing and Urban Affairs, Subcommittee on Housing Transportation and Community Development. December 9, 2014.
Summary: Tight credit is increasing inequality and inhibiting opportunity in the housing market. Access to affordable credit remains a huge problem for prospective homebuyers, those wishing to refinance, and our economy overall. The homeownership rate has fallen almost to levels last seen in 1990. Today, the number of homes purchased annually remains less than half of what was purchased prior to the real estate bubble and subsequent collapse. The number of first-time buyers entering the market is at the lowest point since 1987, despite historically low mortgage rates. Key Findings:
Homeownership is an important source of wealth creation for American families. Homeowners have always enjoyed more net worth than renters; in the recovery from the great recession, the wealth of owners grew by $20,900 from 2010 to 2013 as compared to just $300 for renters. The median net worth of a homeowner in 2013 was $195,400 versus $5,400 for renters.
National Association of Realtors (NAR) supports reducing the Government Sponsored Enterprises guarantee fees and Federal Housing Administration premiums to increase access to financing for first time homebuyers.
NAR supports extending Mortgage Forgiveness Tax Relief Act, which eliminates taxes on principal forgiveness, a modification approach to prevent foreclosures.
9. The State of the Nation’s Housing 2015. Joint Center for Housing Studies of Harvard University. Harvard University. http://bit. ly/1kKwpkW. June 24, 2015. Summary: Nationally, homeownership rates are at a 20-year low, and the single-family market is still in its recovery stages. As a result, the rental market is booming, and while supply has increased, the supply has not kept up with the demand. Rental rates are rising and more households are extremely rent-burdened because of the tight supply. Key Findings:
National apartment vacancy rate is below 7.6%, its lowest point in 20 years.
While millennials accounted for a large number of the growth in renters nationally, those ages 45-64 accounted for twice the amount of renter growth of the millennials.
It is unclear whether the millennials will catch up to the baby boomers in homeownership.

Addressing the Housing Affordability Crisis in San Diego and Beyond
San Diego Housing Commission | November 25, 2015 | Page 86 of 96
10. Tracey Ross. No Place Like Home: Addressing Poverty and Homelessness in the United States. Center for American Progress. 2103.
Summary: This report provides a summary of the state of homelessness and poverty in the United States; gives an overview of federal and local efforts to end homelessness; and offers recommendations for serving homeless individuals and families, increasing access to affordable housing, and addressing income inequality.
Key Findings:
The acute shortage of affordable housing units has been getting increasing worse over the past decade. This makes it more difficult for homeless families to find adequate housing.
Nationwide only one in four households eligible for rental subsidies actually receives assistance due to overwhelming demand.
The number of low-income renter households whose housing costs them more than 50 percent of their incomes increased by 14 percent from 2010 to 2012, as rents have gone up while incomes have remained stagnant.
As a result of the foreclosure crisis and struggling housing market, more and more middle- class households are entering an already strained rental market, increasing the competition for affordable housing resources.
Key recommendations include: aligning homeless and mainstream services, expanding affordable housing and addressing income inequality.
11. Understanding Whom the LIHTC Program Serves: Tenants in LIHTC Units as of December 31,
2012. US Department of Housing & Urban Development. December 2014.
Summary: As mandated through the Housing and Economic Recovery Act (HERA) of 2008, state agencies administering the Low-Income Housing Tax Credit (LIHTC) Program are now required to submit demographic and economic data on LIHTC tenants to the U.S. Department of Housing and Urban Development (HUD). HUD’s Office of Policy Development and Research has been working with states to develop a process for compiling, transmitting, and now releasing the tenant data. This report marks the first release of that national data on LIHTC tenants. Key Findings:
The overall median annual income was $17,066, although the median income varied considerably across states.
Overall, approximately three-fourths of reported households include disability status for at least one household member.
Overall, more than one-third (36.4 percent) of reported LIHTC households had at least one member under 18 years old.
Nearly 33 percent of reported LIHTC households have an elderly member, and more than one-fourth (28.6 percent) of reported LIHTC households have a head of household at least 62 years old.
Addressing the Housing Affordability Crisis in San Diego and Beyond
San Diego Housing Commission | November 25, 2015 | Page 87 of 96
State
12. Affordable Housing Cost Study: Analysis of the Factors that Influence the Cost of Building Multi-Family Affordable Housing in California. California Department of Housing & Community Development, California Tax Credit Allocation Committee, California State Housing Finance Agency & California Debt Limit Allocation Committee. October 6, 2014.
Summary: The study analyzed data from hundreds of multi- family projects completed in California during the past decade, resulting in the largest and most comprehensive data set of its kind ever assembled for the state. The analysis employed widely accepted statistical techniques to identify several factors that are correlated with raising or lowering the costs of developing affordable housing in California. Key Findings:
Projects with podium or subterranean parking cost 6 percent more, on average, relative to other developments without this type of parking.
Building quality and durability add to costs. For each 10% increase in the quality measure (e.g., from “low” to “medium”) costs increased by about 15 percent, on average.
Affordable housing is characterized by economies of scale. For each 10 percent increase in the number of units, the cost per unit declines by 1.7 percent.
Different types of units have different development costs. SROs were approximately 31 percent less expensive per unit to construct relative to large family units, while units for seniors were about 18 percent less expensive per unit relative to large family units.
Land costs influence the cost of developing affordable housing even when the land costs themselves are excluded from the development cost measure itself.
Some developers built projects less expensively than others even after controlling for building type, quality, and location. If the techniques used by these developers could be identified, encouraged and even replicated by all developers of affordable housing (perhaps by creating stronger incentives for cost efficiency), costs per unit could be lowered while maintaining the same level of quality.
13. Betsy Baum Block, Henry Gascon, Peter Manzo and Adam D. Parker. Struggling To Get By:
The Real Cost Measure in California 2015. United Way of California. 2015.
Summary: The federal government’s official poverty measure vastly understates poverty. Established over 45 years ago, the Federal Poverty Level (FPL) is based primarily on the cost of food, but in the decades since, the costs of housing, transportation, childcare, health care and other family necessities have risen far more rapidly than food costs. Further, the FPL neglects regional variations in cost of living, and most Californians live in high-cost areas. As a result, the true extent of families contending with deprivation is hidden. Many of these hidden poor find they earn too much income to qualify for most supports, yet they still struggle to meet their most basic needs, especially as the costs of housing, health care, and other necessities continue to rise faster than wages. Struggling to Get By introduces the Real Cost Measure, a basic needs budget approach, to better understand the challenges families face.
Addressing the Housing Affordability Crisis in San Diego and Beyond
San Diego Housing Commission | November 25, 2015 | Page 88 of 96
Key Findings:
One in three California households (31%) do not have sufficient income to meet their basic costs of living. This is nearly three times the number officially considered poor according to the Federal Poverty Level.
Families with inadequate incomes are found throughout California, but are most concentrated in the northern coastal region, the Central Valley, and in the southern metropolitan areas.
14. California Housing Partnership Corporation, How California’s Housing Market is Failing to
Meet the Needs of Low-Income Families: Recommendations to the Leaders of the State of California. February 2014. Summary: The private market is not providing an adequate number of homes affordable to low and moderate-income households. The shortage is particularly acute in the rental housing market. As the affordability crisis intensifies, investment in affordable housing by the state and local governments has been reduced by $1.5 billion annually. Strong state action is needed to restore balance in the housing market. Key Findings:
There is a shortage of 956,461 homes affordable and available to California’s lowest income households.
Median rents in California increased by over 20% from 2000 to 2012, while median income dropped 8%.
The foreclosure crisis greatly increased the number of renter households, driving up rents yet failing to make homeownership accessible to low-income households.
15. Jennifer Hernandez, David Friedman, & Stephanie DeHerrera. In the Name of the
Environment: How Litigation Abuse Under the California Environmental Quality Act Undermines California’s Environmental, Social Equity and Economic Priorities - and How to Protect CEQA From Litigation Abuse. Holland & Knight. (2015)
Summary: A 3-year study of all CEQA claims found that most CEQA lawsuits target publically funded projects and are not brought for environmental reasons. Hernandez argues for CEQA reform in three areas: 1) require those filing CEQA lawsuits to disclose their identity and environmental or non-environmental interests; 2) Eliminate duplicative lawsuits against EIRs that have been certified; and 3) restrict invalidation of project approvals due to technical errors in the EIR. Key Findings:
Costs of CEQA litigation could be reduced substantially by enacting three simple administrative fixes to the current CEQA regulations.
CEQA related costs impose significant delays and additional costs on affordable housing development.
CEQA litigation abuse is widespread and often used as a tactic to delay projects.
Addressing the Housing Affordability Crisis in San Diego and Beyond
San Diego Housing Commission | November 25, 2015 | Page 89 of 96
50% of all CEQA lawsuits target taxpayer projects.
80% CEQA lawsuits target infill projects.
16. John Husing. Misuse of CEQA and Prevailing Wage Workers. Economics & Politics, Inc. Retrieved from http://ceqaworkinggroup.com/wpcontent/uploads/2013/09/FinalHusing-Report.pdf. (2013).
Summary: This study reviews seven case studies that negatively affected union workers due to CEQA litigation. While CEQA is often talked about as a tool for labor unions to negotiate prevailing wage contracts, this report analyzes the negative impacts CEQA lawsuits can have on labor unions that would have been put to work during the timeframe of litigation. Key Findings:
3,245 prevailing wage jobs were delayed or eliminated due to CEQA litigation on the projects studied.
On average, that equates to $100,502 in wages and benefits per worker.
Total annual wages and benefits affected are $326.1 million. 17. Mac Taylor. California’s High Housing Costs: Causes and Consequences. Legislative Analyst’s
Office. March 17, 2015.
Summary: California’s average home price is $440,000, about 2.5 times the national average of $180,000. California’s average monthly rent is about $1,240, 50% higher than the national average of $840. Housing supply does not meet demand in CA coastal communities due to community resistance, environmental policies, lack of fiscal incentives for local governments to approve housing and limited land availability. The supply shortage bids up prices and pushes people inland, which then bids up prices inland as well. High housing costs cause low income households to spend a large percentage of income on housing, push homeownership out of reach, increase commuting times and make it more likely that families live in crowded housing. Key Findings:
The state has adopted targeted affordable housing programs by subsidizing construction of affordable housing through bond funds, tax credits and other resources. These programs have historically accounted only for a very small share of new housing built each year and could not alone meet the housing needs for CA.
In addition to the 100,000 to 140,000 housing units CA is expected to build each year, an additional 100,000 units would need to be built annually in CA coastal communities to reasonably meet demand.
Recommends that the legislature facilitate more private construction of single and multi-family homes.

Addressing the Housing Affordability Crisis in San Diego and Beyond
San Diego Housing Commission | November 25, 2015 | Page 90 of 96
Local
18. Keyser Marston Associates, Inc. Affordable Housing Construction Cost Comparison Study (Memorandum). 2015.
Summary: Keyser Marston Associates was retained by the San Diego Housing Commission to determine cost reasonableness of building affordable housing units, compare costs in San Diego to the rest of California, and to make recommendations for containing cost and increasing production. Keyser Marston Associates found three principal categories that affect cost: 1) requirements of the tax credit program, 2) community goals, and 3) revitalization efforts. Key Findings: Medium to high cost savings elements related to affordable housing include:
Adopt Specific Plans and Community Plans with Master EIRs
Expand CEQA Streamlining for Infill Projects to cover affordable housing
Reduce or eliminate Site Amenities requirements in 9% application scoring
Reduce or eliminate commercial space
Eliminate prevailing wage requirements for affordable rental developments
Establish separate funding source for extraordinary off-site improvements 19. Opening San Diego’s Door to Lower Housing Costs. Fermanian Business and Economic
Institute at Point Loma Nazarene University. 2015.
Summary: This study quantifies the cumulative economic impact of government fees and regulations on the cost of building new single-family and multi-family housing in San Diego. It also includes recommendations for reducing regulatory costs and improving the regulatory process. The study finds that regulatory costs account for 40% of housing development costs in San Diego. The key analytical finding is that a 3% reduction in regulatory costs would allow an additional 6749 households to afford housing, increase gross regional product by $3.1 billion or 1.7% and add 37,000 jobs to the local economy. Key Findings:
San Diego should aim for a 3% reduction in regulatory costs related to housing development in the near term.
Recommends regulatory reform including: (i) establishing benchmarks for project and permit approval times, (ii) replacing full cost recovery with a flat fee for mapping costs; (iii) standardizing building codes; (iv) disallowing additional challenges and reviews once a project is approved; and (v) establishing a sliding scale for affordable housing requirements.
Recommends cost reduction in construction including: (i) make an in-lieu fee available as an alternative; (ii) sliding scale for affordable housing mandates so smaller developments require a smaller percentage of affordable units; (iii) Incentives or expedited processing for developments exceeding affordable housing requirements; (iv) Allow inclusionary and density bonus units to be built off site from the project that generates the requirement; (v) Allow inclusionary and density bonus units to be aggregated with other affordable units; (vi) Create an affordable housing

Addressing the Housing Affordability Crisis in San Diego and Beyond
San Diego Housing Commission | November 25, 2015 | Page 91 of 96
bank where market rate developers can “purchase” affordable units; (vi) Contribute or sell on favorable terms land that is owned by a city and is suitable for affordable housing. Accept payment out of net cash flow from the project.
20. San Diego Affordable Housing Task Force Executive Summary. San Diego Affordable Housing
Task Force.
Summary: The Affordable Housing Task Force provided six overarching recommendations to increase the supply of affordable housing in San Diego. Key Findings: The recommendations are:
(1) Community Site Identification – Direct each community planning group to designate sites for 2,500 multi-family units over the next 2.5 years. Develop Master Plans or Affordable Housing Overlay Zone and Master Environmental Impact Reviews to expedite regulatory review.
(2) Housing Czar – Appoint a City Housing Czar (3) Investment in Infrastructure – Adopt a $1 billion infrastructure bond paid for by an
approximate $11 per month parcel tax, which requires 2/3 voter approval. (4) Financial Support for Affordable Housing Projects – Increase existing revenue sources
for affordable housing, such as Redevelopment Agency Set-Aside, allocation of Community Development Block Grant funds and reestablishment of Housing Trust Fund Commercial Fees to original levels. Subject to voter approval, adopt a Transient Occupancy Tax and a Car Rental Tax.
(5) Targeted Code Compliance – Allocate $1 million to increase targeted code enforcement efforts using current Rental Unit Tax.
(6) Accessibility – Require 25% of all public development incorporate principals of universal design.
21. San Diego Housing Commission Development Cost Summary - Affordable vs. Market Rate Comparison (Imperial Apartments). San Diego Housing Commission. 2015.
Summary: This analysis compares the cost of development for a specific affordable apartments development – Imperial Apartments - to the estimated cost of similar market rate apartments. The result is that the Imperial Apartments (affordable apartments) cost 47% more than similar market rate apartments to develop. The Imperial affordable units cost a total of $20,420,000 and $324,127 per unit to develop. The similar market rate apartments are estimated to cost a total of $13,825,380 or $219,450 per unit to build. That is an additional cost of $6,594,620 or $104,677 per unit to build the Imperial affordable housing units as compared to market rate units. Key Findings: The largest additional costs for Imperial Apartments affordable housing development were:
(1) $1,830,000 due to prevailing wage regulation; (2) $500,000 in sustainability enhancements (minimum of 30% above Title 24 requirements; designed Green Point Rated 125);
Addressing the Housing Affordability Crisis in San Diego and Beyond
San Diego Housing Commission | November 25, 2015 | Page 92 of 96
(3) $80,000 additional legal fees; (4) $2,085,000 rent reserve required by Permanent Supportive Housing; (5) $172,000 operating reserve of 3 months required by TCAC; and (6) $1,400,000 developer profit allowed by TCAC.
22. San Diego Housing Commission Development Cost Summary - Affordable vs. Market Rate
Comparison (Trolley Residential). San Diego Housing Commission. 2015.
Summary: This analysis compares the cost of development for Trolley Residential affordable apartments to the estimated cost of similar market rate apartments. The result is that the Trolley Residential affordable apartments cost approximately 28% more than the market rate apartments to develop. The Trolley Residential affordable units cost a total of $22,963,066 and $441,597 per unit to develop. The market rate apartments cost an estimated total of $17,889,137 or $344,022 per unit to build. That is an additional cost of $5,073,929 or $97,576 per unit to build the Trolley Residential affordable housing units as compared to market rate units. Key Findings: Additional costs for the Trolley Residential affordable housing development that are not included in the estimated market rate development are:
(1) $2,124,802 due to prevailing wage regulation; (2) $480,976 in sustainability enhancements (minimum of 30% above Title 24 requirements; designed LEED Gold); (3) $201,000 additional legal fees; (4) $113,417 operating reserve of 3 months required by TCAC; (5) $2,000,000 developer profit allowed by TCAC; and (6) 390,475 in contractor overhead and profit per TCAC regulations.
Addressing the Housing Affordability Crisis in San Diego and Beyond
San Diego Housing Commission | November 25, 2015 | Page 93 of 96
Bibliography Affordable Housing Cost Study: Analysis of the Factors that Influence the Cost of Building Multi-Family Affordable Housing in California. California Department of Housing & Community Development, California Tax Credit Allocation Committee, California State Housing Finance Agency & California Debt Limit Allocation Committee. October 6, 2014. Arnold, Althea, Sheila Crowley, Elina Bravve, Sarah Brundage, and Christine Biddlecombe. 2014. Out of Reach 2014. Washington, DC: National Low Income Housing Coalition. http://nlihc.org/sites/default/files/oor/2014OOR.pdf. Block, Betsy Baum, Henry Gascon, Peter Manzo and Adam D. Parker. 2015. Struggling To Get By: The
Real Cost Measure in California 2015. United Way of California.
California Department of Housing and Community Development. 2014 Update Highlights of the State of Housing in California: Affordability Worsens, Supply Problems Remain (p. 16). 2014. Retrieved from http://www.hcd.ca.gov/housing-policy- development/statewide-housing plan/web_hcd_stateofhousing_april2014.pdf
California Housing Partnership Corporation, How California’s Housing Market is Failing to Meet the Needs of Low-Income Families: Recommendations to the Leaders of the State of California. February 2014.
California State Finance Department website, http://www.dof.ca.gov/research/demographic/reports/estimates/e-5/2011-20/view.php (Accessed 09/27/15). Chaing-Tai Hsieh, & Enrico Moretti. Why Do Cities Matter? Local Growth and Aggregate Growth (No. 21154) 2015. National Bureau of Economic Research. Retrieved from http://www.nber.org/papers/w21154.
CBPP (Center on Budget and Policy Priorities). 2013. Section 8 Project-Based Rental Assistance.
Washington, DC: CBPP. http://www.cbpp.org/sites/default/files/atoms/files/PolicyBasics-housing-1-25-
13PBRA.pdf.
Cunningham, Mary, Joshua Leopold, and Pamela Lee. 2014. A Proposed Demonstration of a Flat Rental
Subsidy for Very Low Income Households. Washington, DC: Urban Institute.
http://www.urban.org/research/publication/ proposed-demonstration-flat-rental-subsidy-very-low-
income-households.
Department of Housing and Community Development, California Tax Credit Allocation Committee California Housing Finance Agency, & California Debt Limit Allocation Committee. (2014). Affordable Housing Cost Study: Analysis of the Factors that Influence the Cost of Building Multi-Family Affordable Housing in California. 2014.Retrieved from: http://www.hcd.ca.gov/housing-policy development/docs/finalaffordablehousingcoststudyreport-with-coverv2.pdf
Addressing the Housing Affordability Crisis in San Diego and Beyond
San Diego Housing Commission | November 25, 2015 | Page 94 of 96
Fannie Mae website. http://www.fanniemae.com. (Accessed 09/25/2015).
Freddie Mac website. http://www.freddiemac.com. (Accessed 09/25/2015).
Henry, Meghan, Alvaro Cortes, and Sean Morris. 2013. The 2013 Annual Homeless Assessment Report (AHAR) to Congress. Part 1: Point-in-Time Estimates of Homelessness. Washington, DC: US Department of Housing and Urban Development, Office of Community Planning and Development.
Income in the Past 12 Months. (In 2013 Inflation-Adjusted Numbers). 2011-2013 American Community Survey 3-Year Estimates. American Fact Finder. United States Census Bureau. http://1.usa.gov/1vEz1wK. Accessed September 20, 2015.
Jennifer Hernandez, David Friedman, & Stephanie DeHerrera. (Forthcoming). In the Name of the Environment: How Litigation Abuse Under the California Environmental Quality Act Undermines California’s Environmental, Social Equity and Economic Priorities - and How to Protect CEQA From Litigation Abuse. Holland & Knight. (2015) John Husing. (2013). Misuse of CEQA and Prevailing Wage Workers (p. 13). Economics & Politics, Inc. Retrieved from http://ceqaworkinggroup.com/wp content/uploads/2013/09/Final-Husing-Report.pdf
Jonathan Woetzel, Sangeeth Ram, Jan Mischke, Nicklas Garemo and Shirish Sankhe. A blueprint for addressing the global affordable housing challenge. McKinsey Global Institute. October 2014. Keyser Marston Associates, Inc. San Diego Affordable Housing Construction Cost Comparison Study (Memorandum). 2015.
Kusisto, Laura. 2015. “Rents Rise Faster for Midtier Apartments Than Luxury Ones.” Wall Street Journal, August 16, sec. Economy. http://www.wsj.com/articles/rents-rise-faster-for-midtier-apartments-than-luxury-ones-1439769468?tesla=y. Leopold, Josh, Liza Getsinger, Pamela Blumenthal, Katya Abazajian and Reed Jordan. June 2015. The
Housing Affordability Gap for Extremely Low Income Renters in 2013. Washington D.C.: Urban
Institute.
Mac Taylor. California’s High Housing Costs: Causes and Consequences. Legislative Analyst’s Office. March 17, 2015. Matthew Rognlie. (2014, June 15). A note on Piketty and diminishing returns to capital. Retrieved from http://www.mit.edu/~mrognlie/piketty_diminishing_returns.pdf
Median Monthly Housing Costs (Dollars). 2011-2013 American Community Survey 3-Year Estimates. American Fact Finder. United States Census Bureau. http://1.usa.gov/1vEz1wK. Accessed September 15, 2015.
Opening San Diego’s Door to Lower Housing Costs. Fermanian Business and Economic Institute at Point Loma Nazarene University. 2015.
Addressing the Housing Affordability Crisis in San Diego and Beyond
San Diego Housing Commission | November 25, 2015 | Page 95 of 96
San Diego Affordable Housing Task Force Executive Summary. San Diego Affordable Housing Task Force. 2014. San Diego Housing Commission Development Cost Summary - Affordable vs. Market Rate Comparison (Imperial Apartments). San Diego Housing Commission. 2015. San Diego Housing Commission Development Cost Summary - Affordable vs. Market Rate Comparison (Trolley Residential). San Diego Housing Commission. 2015. San Diego Housing Commission AMI Rent Chart, http://www.sdhc.org/uploadedFiles/Rental_Assistance/pdfs/AMIIncomeRentChart%202015.pdf (Accessed 09/15/2015). Sean Capperis, Ingrid Gould Ellen and Brian Karfunkel. Renting in America’s Largest Cities. NYU Furman Center for Real Estate and Urban Studies. May 2015.
The California Poverty Measure. A New Look at the Social Safety Net. Stanford Center on Poverty and Inequality and Public Policy Institute of California. October 2013. http://bit. ly/1e9DZdq. Accessed August 10, 2015.
The State of the Nation’s Housing. Joint Center for Housing Studies of Harvard University. Harvard University. http://bit. ly/1kKwpkW. June 24, 2015. Trulia website. www.trulia.com. (Accessed 09/25/2015). San Diego Association of Governments Regional Housing Progress Report 2003 to 2013, March 20, 2015. http://www.sandag.org/uploads/publicationid/publicationid_1928_18891.pdf. (Accessed 09/27/2015). Statement of the National Association of Realtors for Hearing Entitled: Inequality Opportunity and the Housing Market. Senate Committee on Banking, Housing and Urban Affairs, Subcommittee on Housing Transportation and Community Development. December 9, 2014.
Thomas Picketty and Arhur Goldhammer. Capital in the Twenty-First Century. Belknap Press. 1st Edition. April 15, 2014.
Tracey Ross. No Place Like Home: Addressing Poverty and Homelessness in the United States. Center for American Progress. 2103. Understanding Whom the LIHTC Program Serves: Tenants in LIHTC Units as of December 31, 2012. US Department of Housing & Urban Development. December 2014. United States Department of the Treasury, Monthly Housing Report. http://www.treasury.gov/initiatives/financial-stability/reports/Pages/Monthly-Housing-Scorecard.aspx. (Accessed July 27, 2015). United States Department of Housing & Urban Development. http://portal.hud.gov/hudportal/HUD?src=/initiatives/Housing_Scorecard. (Accessed 09/25/2015).

Addressing the Housing Affordability Crisis in San Diego and Beyond
San Diego Housing Commission | November 25, 2015 | Page 96 of 96
United States Department of Housing & Urban Development. http://portal.hud.gov/hudportal/HUD?src=/initiatives/Housing_Scorecard. (Accessed 09/25/2015).