ammb holdings berhad (223035-v) (incorporated in malaysia… · 2020-01-05 · ammb holdings berhad...
TRANSCRIPT

AMMB Holdings Berhad (223035-V)Condensed Financial Statements For The Second Quarter Ended 30 September 2019
AMMB HOLDINGS BERHAD(223035-V) (Incorporated in Malaysia)and its subsidiaries
UNAUDITED STATEMENTS OF FINANCIAL POSITIONAS AT 30 SEPTEMBER 2019
Note 30.09.19 31.03.19 30.09.19 31.03.19RM'000 RM'000 RM'000 RM'000
ASSETSCash and short-term funds A8 3,706,642 7,073,744 201,746 81,005 Deposits and placements with banks and other
financial institutions A9 289,798 196,159 - - Derivative financial assets A33 1,000,594 763,923 - - Financial assets at fair value through
profit or loss A10 15,214,398 19,365,595 1,062 1,044 Financial investments at fair value
through other comprehensive income A11 17,599,282 15,709,873 - - Financial investments at amortised cost A12 5,041,068 5,146,316 - - Loans, advances and financing A13 100,737,973 100,544,021 - - Statutory deposits with Bank Negara Malaysia 3,276,386 3,155,541 - - Deferred tax assets 32,178 66,162 - - Investment in subsidiaries and other investments - - 9,640,314 9,640,313 Investment in associates and joint ventures 711,625 710,091 - - Other assets A14 1,966,268 1,983,451 56,034 1,670 Reinsurance assets and other insurance receivables A15 383,662 525,547 - - Property and equipment 256,174 168,221 561 676 Right-of-use assets 329,643 - - - Intangible assets 3,249,380 3,379,727 - - Assets held for sale A31 1,458 5,029 - -
153,796,529 158,793,400 9,899,717 9,724,708
LIABILITIES AND EQUITYDeposits from customers A16 102,713,018 106,915,989 - - Investment accounts of customers 189,588 353,451 - - Deposits and placements of banks and other
financial institutions A17 8,922,554 7,687,719 - - Securities sold under repurchase agreements 5,910,180 5,339,422 - - Recourse obligation on loans and financing sold to
Cagamas Berhad 4,440,006 4,658,353 - - Derivative financial liabilities A33 1,031,657 825,492 - - Term funding 2,015,564 3,634,754 - - Debt capital 3,745,000 4,230,000 - - Redeemable cumulative convertible preference share 226,300 224,229 - - Deferred tax liabilities 95,594 63,702 - - Other liabilities A18 2,961,549 3,476,588 72,155 31,436 Insurance contract liabilities and other insurance payables A19 2,397,823 2,693,249 - -
134,648,833 140,102,948 72,155 31,436
Share capital 5,851,557 5,751,557 5,550,250 5,550,250 Reserves 12,306,280 11,939,396 4,277,312 4,143,022 Equity attributable to equity holders of the Company 18,157,837 17,690,953 9,827,562 9,693,272 Non-controlling interests 989,859 999,499 - - Total Equity 19,147,696 18,690,452 9,827,562 9,693,272
153,796,529 158,793,400 9,899,717 9,724,708
A32 129,739,204 131,016,758 - -
NET ASSETS PER SHARE (RM) 6.02 5.87 3.26 3.22
Company
The unaudited condensed interim financial statements should be read in conjunction with the audited annual financial statements of the Group and the Company for the financial year ended 31 March 2019.
Group
TOTAL LIABILITIES AND EQUITY
Total Liabilities
COMMITMENTS AND CONTINGENCIES
TOTAL ASSETS
1

AMMB Holdings Berhad (223035-V)Condensed Financial Statements For The Second Quarter Ended 30 September 2019
AMMB HOLDINGS BERHAD(223035-V) (Incorporated in Malaysia)and its subsidiaries
UNAUDITED CONSOLIDATED STATEMENT OF PROFIT OR LOSSFOR THE FINANCIAL QUARTER ENDED 30 SEPTEMBER 2019
Group Note 30.09.19 30.09.18 30.09.19 30.09.18RM'000 RM'000 RM'000 RM'000
Operating revenue A27 2,349,315 2,313,966 4,739,717 4,485,257
Interest income A20 1,236,977 1,229,915 2,516,668 2,378,907 Interest expense A21 (764,081) (798,556) (1,575,471) (1,516,175) Net interest income 472,896 431,359 941,197 862,732 Net income from Islamic banking 246,124 235,640 476,100 472,246 Income from insurance business 357,005 343,230 706,177 679,223 Insurance claims and commissions (244,471) (235,586) (472,479) (416,473) Net income from insurance business A22 112,534 107,644 233,698 262,750 Other operating income A23 245,373 225,815 477,727 400,485 Share in results of associates and joint ventures (8,018) 6,666 4,757 22,592 Net income 1,068,909 1,007,124 2,133,479 2,020,805 Other operating expenses A24 (526,239) (505,512) (1,054,804) (1,018,365) Operating profit before impairment losses 542,670 501,612 1,078,675 1,002,440 Allowance for impairment on loans, advances and
financing A25 (105,180) (35,518) (60,269) (25,157) Writeback of allowance/(Allowance) for impairment on:
Financial investments A26 (41,990) 2,822 (40,354) (1,965) Insurance receivables 4,540 1,118 3,532 2,543 Other financial assets A26 227 (3,651) 1,274 (2,043)
Provision for commitments and contingencies 35,910 18,596 23,019 6,068 Other recoveries/(write-offs), net (2,589) 5,678 (3,827) 2,612 Profit before taxation and zakat 433,588 490,657 1,002,050 984,498 Taxation and zakat B5 (80,491) (112,201) (217,363) (222,786) Profit for the financial period 353,097 378,456 784,687 761,712
Attributable to:Equity holders of the Company 319,568 348,153 711,027 695,747 Non-controlling interests 33,529 30,303 73,660 65,965 Profit for the financial period 353,097 378,456 784,687 761,712
EARNINGS PER SHARE (SEN) B11Basic/Diluted 10.62 11.57 23.63 23.13
Individual Quarter Cumulative Quarter
The unaudited condensed interim financial statements should be read in conjunction with the audited annual financial statements of the Group and the Company for the financial year ended 31 March 2019.
2

AMMB Holdings Berhad (223035-V)Condensed Financial Statements For The Second Quarter Ended 30 September 2019
AMMB HOLDINGS BERHAD(223035-V) (Incorporated in Malaysia)and its subsidiaries
UNAUDITED CONSOLIDATED STATEMENT OF COMPREHENSIVE INCOMEFOR THE FINANCIAL QUARTER ENDED 30 SEPTEMBER 2019
Group 30.09.19 30.09.18 30.09.19 30.09.18RM'000 RM'000 RM'000 RM'000
Profit for the financial period 353,097 378,456 784,687 761,712
Other comprehensive income/(loss):
Items that will not be reclassified subsequently to profit or loss
Financial investments at fair value through other comprehensive income ("FVOCI")- net unrealised gain/(losses) on changes in fair value 69,337 - 69,337 -
Tax effect 40 - 40 -
69,377 - 69,377 -
Items that may be reclassified to profit or lossTranslation gain of foreign operations 3,583 13,950 6,922 37,498 Cash flow hedge
- (loss)/gain arising during the financial period (4,888) (47) (11,068) 1,325 - reclassification adjustments for (gain)/loss
included in profit or loss - 7 (66) (136) - amortisation of fair value changes for
terminated hedges (1,227) (2,146) (2,721) (4,268) Financial investments at FVOCI
- net unrealised gains on changes in fair value 62,533 49,419 183,363 500 - net gain reclassified to profit or loss (50,385) (2,021) (61,352) (2,185) - expected credit loss 42,706 (3,629) 41,090 1,005 - foreign exchange differences (2) (122) - 341
Tax effect relating to the components of other comprehensive (income)/loss- cash flow hedge 1,467 525 3,325 739 - financial investments at FVOCI (2,413) (10,935) (27,604) 620
Share of reserve movements in equity accountedjoint ventures (14,327) 11,995 686 5,446
37,047 56,996 132,575 40,885 Other comprehensive income for the financial period,
net of tax 106,424 56,996 201,952 40,885 Total comprehensive income for the financial period 459,521 435,452 986,639 802,597
Total comprehensive income for the financial periodattributable to:
Equity holders of the Company 425,992 405,150 912,979 736,632 Non-controlling interests 33,529 30,302 73,660 65,965
459,521 435,452 986,639 802,597
Individual Quarter Cumulative Quarter
The unaudited condensed interim financial statements should be read in conjunction with the audited annual financial statements of the Group and the Company for the financial year ended 31 March 2019.
3
AMMB Holdings Berhad (223035-V)Condensed Financial Statements For The Second Quarter Ended 30 September 2019
AMMB HOLDINGS BERHAD(223035-V) (Incorporated in Malaysia)and its subsidiaries
UNAUDITED STATEMENT OF PROFIT OR LOSSFOR THE FINANCIAL QUARTER ENDED 30 SEPTEMBER 2019
Company Note 30.09.19 30.09.18 30.09.19 30.09.18RM'000 RM'000 RM'000 RM'000
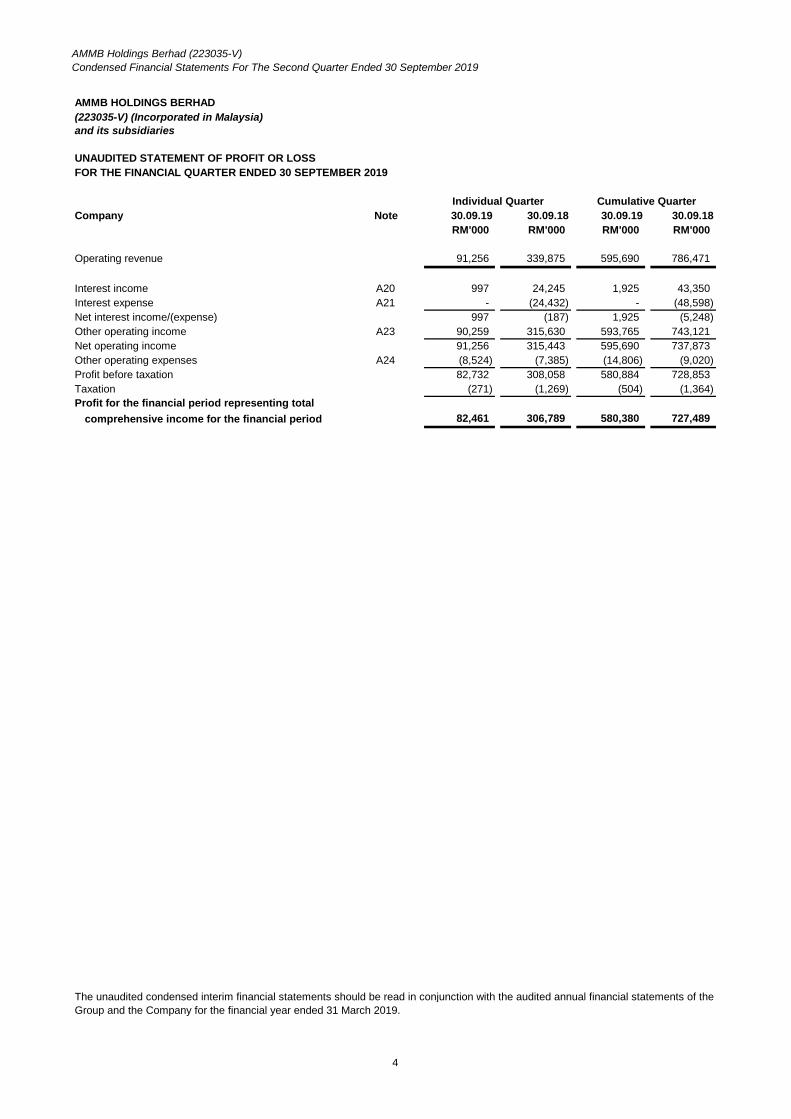
Operating revenue 91,256 339,875 595,690 786,471
Interest income A20 997 24,245 1,925 43,350 Interest expense A21 - (24,432) - (48,598) Net interest income/(expense) 997 (187) 1,925 (5,248) Other operating income A23 90,259 315,630 593,765 743,121 Net operating income 91,256 315,443 595,690 737,873 Other operating expenses A24 (8,524) (7,385) (14,806) (9,020) Profit before taxation 82,732 308,058 580,884 728,853 Taxation B5 (271) (1,269) (504) (1,364) Profit for the financial period representing total
comprehensive income for the financial period 82,461 306,789 580,380 727,489
The unaudited condensed interim financial statements should be read in conjunction with the audited annual financial statements of the Group and the Company for the financial year ended 31 March 2019.
Individual Quarter Cumulative Quarter
4

AMMB Holdings Berhad (223035-V)Condensed Financial Statements For The Second Quarter Ended 30 September 2019
AMMB HOLDINGS BERHAD(223035-V) (Incorporated in Malaysia)and its subsidiaries
UNAUDITED CONSOLIDATED STATEMENTS OF CHANGES IN EQUITYFOR THE FINANCIAL QUARTER ENDED 30 SEPTEMBER 2019
Distributable
Cash Foreign Executives' SharesFair flow currency share held Non- Non-
Group Share Regulatory AFS value hedging translation scheme in trust participating controlling Totalcapital reserve deficit reserve reserve reserve reserve for ESS funds Total interests equity
RM'000 RM'000 RM'000 RM'000 RM'000 RM'000 RM'000 RM'000 RM'000 RM'000 RM'000 RM'000 RM'000At 01.04.18 5,551,557 702,734 (58,628) - 3,174 61,600 17,428 (41,620) 45,715 10,233,645 16,515,605 1,144,405 17,660,010
Effects of adopting MFRS 9 at 1 April 2018 - (406,513) 58,628 412,919 - - - - - (27,404) 37,630 48 37,678 Restated balance at 1 April 2018 5,551,557 296,221 - 412,919 3,174 61,600 17,428 (41,620) 45,715 10,206,241 16,553,235 1,144,453 17,697,688Profit for the financial period - - - - - - - - - 695,747 695,747 65,965 761,712 Other comprehensive income/(loss), net - - - 5,727 (2,340) 37,498 - - - - 40,885 - 40,885 Total comprehensive income/(loss) for
- - - 5,727 (2,340) 37,498 - - - 695,747 736,632 65,965 802,597
Purchase of shares pursuant to - - - - - - - (183) - - (183) - (183) - - - - - - (10,565) - - - (10,565) - (10,565)
ESS shares vested to employees - - - - - - (6,863) 10,320 - - 3,457 - 3,457 Transfer of ESS shares recharged
- - - - - - - - - (3,348) (3,348) (109) (3,457) Dividend for ESS shares not vested - - - - - - - - - 5,629 5,629 - 5,629 Transfer to regulatory reserve - 148,947 - - - - - - - (148,947) - - - Transfer from Retained Earnings arising -
from redemption of preference shares - by a subsidiary 200,000 - - - - - - - - (200,000) - - -
Dividends paid - - - - - - - - - (301,418) (301,418) (242,060) (543,478) Transactions with owners and
200,000 148,947 - - - - (17,428) 10,137 - (653,713) (312,057) (242,169) (548,597)
At 30.09.18 5,751,557 445,168 - 418,646 834 99,098 - (31,483) 45,715 10,253,904 16,983,439 968,249 17,951,688
Non-Distributable
Executives' Share Scheme ("ESS")1
Attributable to Equity Holders of the Company
the financial period
other equity movements
Share-based payment under ESS, net
Retained Earnings
- difference on purchase price for shares vested
5

AMMB Holdings Berhad (223035-V)Condensed Financial Statements For The Second Quarter Ended 30 September 2019
AMMB HOLDINGS BERHAD(223035-V) (Incorporated in Malaysia)and its subsidiaries
UNAUDITED CONSOLIDATED STATEMENTS OF CHANGES IN EQUITYFOR THE FINANCIAL QUARTER ENDED 30 SEPTEMBER 2019
Distributable
Cash Foreign Executives' SharesFair flow currency share held Non- Non-
Group Share Regulatory value hedging translation scheme in trust participating controlling Totalcapital reserve reserve deficit reserve reserve for ESS funds Total interests equity
RM'000 RM'000 RM'000 RM'000 RM'000 RM'000 RM'000 RM'000 RM'000 RM'000 RM'000 RM'000At 01.04.19 5,751,557 450,158 479,970 (12,074) 94,089 5,295 (31,483) 45,715 10,907,726 17,690,953 999,499 18,690,452
Profit for the financial period - - - - - - - - 711,027 711,027 73,660 784,687 Other comprehensive income/(loss), net - - 205,560 (10,530) 6,922 - - - - 201,952 - 201,952 Total comprehensive income/(loss) for
- - 205,560 (10,530) 6,922 - - - 711,027 912,979 73,660 986,639
Share-based payment under ESS, net - - - - - 6,038 - - - 6,038 - 6,038 Transfer of ESS shares recharged
- difference on purchase price - - - - - - - - (5) (5) - (5)
Transfer to regulatory reserve - 140,039 - - - - - - (140,039) - - - Transfer from Retained Earnings arising
from redemption of preference sharesby a subsidiary 100,000 - - - - - - - (100,000) - - -
Dividends paid - - - - - - - - (452,128) (452,128) (83,300) (535,428) Transactions with owners and
other equity movements 100,000 140,039 - - - 6,038 - - (692,172) (446,095) (83,300) (529,395)
At 30.09.19 5,851,557 590,197 685,530 (22,604) 101,011 11,333 (31,483) 45,715 10,926,581 18,157,837 989,859 19,147,696
Non-DistributableAttributable to Equity Holders of the Company
the financial period
The unaudited condensed interim financial statements should be read in conjunction with the audited annual financial statements of the Group and the Company for the financial year ended 31 March 2019.
for shares vested
Retained Earnings
6

AMMB Holdings Berhad (223035-V)Condensed Financial Statements For The Second Quarter Ended 30 September 2019
AMMB HOLDINGS BERHAD(223035-V) (Incorporated in Malaysia)and its subsidiaries
UNAUDITED STATEMENTS OF CHANGES IN EQUITY
Distributable
Executives' SharesOrdinary share held
share scheme in trust Retained TotalCompany capital reserve for ESS earnings equity
RM'000 RM'000 RM'000 RM'000 RM'000
At 01.04.18 5,550,250 17,428 (41,620) 3,525,115 9,051,173
Profit for the financial period - - - 727,489 727,489 Total comprehensive income for
the financial period - - - 727,489 727,489
Purchase of shares pursuant to ESS1 - - (183) - (183) Share-based payment under ESS, net - (10,565) - - (10,565) ESS shares vested to employees - (6,863) 10,320 (236) 3,221 Dividend for ESS shares not vested - - - 5,629 5,629 Dividends paid - - - (301,418) (301,418) Transactions with owners and
other equity movements - (17,428) 10,137 (296,025) (303,316)
At 30.09.18 5,550,250 - (31,483) 3,956,579 9,475,346
Distributable
Executives' SharesOrdinary share held
share scheme in trust Retained TotalCompany capital reserve for ESS earnings equity
RM'000 RM'000 RM'000 RM'000 RM'000
At 01.04.19 5,550,250 5,295 (31,483) 4,169,210 9,693,272
Profit for the financial period - - - 580,380 580,380 Total comprehensive income for
the financial period - - - 580,380 580,380
Share-based payment under ESS, net - 6,038 - - 6,038 Dividends paid - - - (452,128) (452,128) Transactions with owners and
other equity movements - 6,038 - (452,128) (446,090)
At 30.09.19 5,550,250 11,333 (31,483) 4,297,462 9,827,562
1 Represents the purchase of 48,350 of the Company's issued ordinary shares from the open market by a trustee appointed bythe ESS committee at an average price of RM3.79 per share.
The unaudited condensed interim financial statements should be read in conjunction with the audited annual financial statementsof the Group and the Company for the financial year ended 31 March 2019.
Non-Distributable
FOR THE FINANCIAL QUARTER ENDED 30 SEPTEMBER 2019
Attributable to Equity Holders of the CompanyNon-Distributable
Attributable to Equity Holders of the Company
7

AMMB Holdings Berhad (223035-V)Condensed Financial Statements For The Second Quarter Ended 30 September 2019
AMMB HOLDINGS BERHAD(223035-V) (Incorporated in Malaysia)and its subsidiaries
UNAUDITED CONDENSED STATEMENTS OF CASH FLOWSFOR THE FINANCIAL QUARTER ENDED 30 SEPTEMBER 2019
30.09.19 30.09.18 30.09.19 30.09.18RM'000 RM'000 RM'000 RM'000
Profit before taxation and zakat 1,002,050 984,498 580,884 728,853 (Less)/Add adjustments for:Net (accretion of discount)/amortisation of premium for securities (45,943) (142,548) - - Allowance for expected credit losses on loans, advances
and financing, net 273,233 276,062 - - Dividend income (3,726) (2,172) (592,928) (742,992) Net gain on revaluation of derivatives (41,641) (369,671) - - Net (gain)/loss on revaluation of financial assets
at fair value through profit or loss (66,127) 5,815 - - Net gain on sale of financial investments
at fair value through other comprehensive income (61,352) (2,185) - - Net gain on sale of financial assets
at fair value through profit or loss (52,425) (6,508) - - Other non-operating and non-cash items 152,447 123,588 115 199 Operating profit/(loss) before working capital changes 1,156,516 866,879 (11,929) (13,940) Decrease/(Increase) in operating assets:Deposits and placements with banks and other
financial institutions 3,284 (439,832) - - Financial assets at fair value through profit or loss 4,305,029 (1,332,594) (18) (18) Loans, advances and financing (467,185) (3,912,421) - - Statutory deposits with Bank Negara Malaysia (120,845) (262,387) - - Other assets 71,166 313,093 (53,723) (5,366) Reinsurance assets and other insurance receivables 145,417 39,071 - - Increase/(Decrease) in operating liabilities:Deposits from customers (4,202,971) 4,977,338 - - Investment accounts of customers (163,864) 57,906 - - Deposits and placements of banks and other
financial institutions 1,234,836 3,377,414 - - Securities sold under repurchase agreements 570,758 1,036,499 - - Recourse obligation on loans and financing sold to
Cagamas Berhad (218,347) 1,314,011 - - Term funding (1,641,771) 408,553 - - Other liabilities (814,218) (92,799) 46,757 8,251 Insurance contract liabilities and other insurance payables (295,426) (102,531) - - Cash generated from/(used) in operations (437,621) 6,248,200 (18,913) (11,073) Taxation and zakat (paid)/refunded, net (229,873) 14,306 (1,146) (313) Net cash generated from/(used) in operating activities (667,494) 6,262,506 (20,059) (11,386)
Cash flows from investing activities Purchase of shares for ESS by appointed trustee - (183) - (183) Dividend/Distribution income received 7,635 6,006 592,928 742,992 Subscription of shares in subsidiaries - - - (177,257) Proceeds from disposal of property and equipment 76 1,936 - - Net purchase of financial investments (1,516,451) (4,353,520) - - Purchase of property and equipment and intangible assets (49,318) (58,566) - - Net cash (used in)/generated from investing activities (1,558,058) (4,404,327) 592,928 565,552
carried forward
Group Company
8

AMMB Holdings Berhad (223035-V)Condensed Financial Statements For The Second Quarter Ended 30 September 2019
AMMB HOLDINGS BERHAD(223035-V) (Incorporated in Malaysia)and its subsidiaries
UNAUDITED CONDENSED STATEMENTS OF CASH FLOWSFOR THE FINANCIAL QUARTER ENDED 30 SEPTEMBER 2019 (CONT'D.)
30.09.19 30.09.18 30.09.19 30.09.18RM'000 RM'000 RM'000 RM'000
Net cash (used in)/generated investing activitiesbrought forward (1,558,058) (4,404,327) 592,928 565,552
Net proceeds from disposal of assets held for sale (properties) 5,433 4,410 - - Net cash (used in)/generated from investing activities (1,552,625) (4,399,917) 592,928 565,552
Cash flows from financing activities Dividends paid by Company to its shareholders (452,128) (301,418) (452,128) (301,418) Repayment of lease liabilities (36,801) - - - Dividends paid to non-controlling interests by
subsidiaries (83,300) (242,060) - - Dividends refunded by Trustee for ESS shares not vested - 5,629 - 5,629 Debt capital - net issuance/(repayment) (485,000) (600,000) - - Net cash used in financing activities (1,057,229) (1,137,849) (452,128) (295,789)
Net increase/(decrease) in cash and cash equivalents (3,277,348) 724,740 120,741 258,377 Cash and cash equivalents at beginning of the financial year 7,270,046 5,715,856 81,005 79,080 Effect of exchange rate changes 4,884 225 - - Cash and cash equivalents at end of the financial period 3,997,582 6,440,821 201,746 337,457
30.09.19 30.09.18 30.09.19 30.09.18RM'000 RM'000 RM'000 RM'000
Cash and short-term funds 3,706,642 6,438,341 201,746 337,457 Deposits and placements with banks and other financial institutions 289,798 455,204 - -
3,996,440 6,893,545 201,746 337,457 Less: Deposits with original maturity of more than three months - (455,434) - -
3,996,440 6,438,111 201,746 337,457 Add:Allowances for expected credit loss ("ECL") for cash and cash
equivalents 1,142 2,710 - - Cash and cash equivalents 3,997,582 6,440,821 201,746 337,457
Cash and cash equivalents included in the statements of cash flows comprise the following amounts:
The unaudited condensed interim financial statements should be read in conjunction with the audited annual financial statements of the Group and the Company for the financial year ended 31 March 2019.
Group Company
Group Company
9

AMMB Holdings Berhad (223035-V)Condensed Financial Statements For The Second Quarter Ended 30 September 2019
AMMB HOLDINGS BERHAD(223035-V) (Incorporated in Malaysia)and its subsidiaries
EXPLANATORY NOTES :
A1. BASIS OF PREPARATION
A1.1 Significant Accounting Policies
------
(a) MFRS 16 Leases
As a lessee, the Group previously classified each of its leases as operating leases (off balance sheet) in accordancewith MFRS 117 Leases if the arrangements do not transfer substantially all the risks and rewards incidental toownership of the leased assets to the Group; otherwise, they were classified as finance leases (on balance sheet).
MFRS 16, which supersedes MFRS 117, eliminates the classification of leases by the lessee as either financeleases or operating leases. MFRS 16 requires a lessee to account for all leases under a single on balance sheetmodel similar to the accounting for a finance lease under MFRS 117 which involves the recognition of a “right-of-use” of the underlying asset and a lease liability reflecting future lease payments.
These condensed interim financial statements have been prepared in accordance with MFRS 134 Interim Financial Reportingissued by the Malaysian Accounting Standards Board (“MASB”) and paragraph 9.22 of the Listing Requirements of BursaMalaysia. These financial statements also comply with IAS 34 Interim Financial Reporting issued by the InternationalAccounting Standards Board.
These condensed interim financial statements do not include all of the information required for full annual financial statements,and should be read in conjunction with the annual financial statements of the Group and the Company for the financial yearended 31 March 2019 which are available upon request from the Company’s registered office at Level 22, Bangunan AmBankGroup, No. 55, Jalan Raja Chulan, 50200 Kuala Lumpur.
The condensed interim financial statements incorporate those activities relating to Islamic banking which have been undertakenby the Group. Islamic banking refers generally to the acceptance of deposits, granting of financing and dealing in Islamicsecurities under Shariah principles.
The accounting policies adopted are consistent with those of the previous financial year except for the adoption of thefollowing new standards, amendments to published standards, and new interpretation which became effective for the firsttime for the Group and the Company on 1 April 2019:
MFRS 16 LeasesIC Interpretation 23 Uncertainty over Income Tax Treatments
Plan Amendment, Curtailment or Settlement (Amendments to MFRS119)Annual Improvements to MFRSs 2015-2017 Cycle
Prepayment Features with Negative Compensation (Amendments to MFRS 9)Long-term interests in Associates and Joint Ventures (Amendments to MFRS 128)
The adoption of these new standards, amendments to published standards and new interpretation did not have anymaterial impact on the financial statements of the Group and the Company except for those arising from the adoption ofMFRS 16 as disclosed below. Other than the adoption of new accounting policies as disclosed in Note A1.2, the Groupand the Company did not have to change its accounting policies or make retrospective adjustments as a result ofadopting these amendments to published standards and new interpretation.
The nature of the new standards, amendments to published standards and new intepretation relevant to the Group andthe Company are described below:
10

AMMB Holdings Berhad (223035-V)Condensed Financial Statements For The Second Quarter Ended 30 September 2019
A1. BASIS OF PREPARATION (CONT'D.)
A1.1 Significant Accounting Policies (Cont'd.)
(a)
(i)
(ii)
(iii)
(iv)
(b)
(c)
The right-of-use asset is depreciated in accordance with the principle in MFRS 116 ‘Property, Plant and Equipment’and the lease liability is accreted over time with interest expense recognised in the statement of profit or loss.
MFRS 16 Leases (Cont'd.)
IC Interpretation 23 Uncertainty over Income Tax Treatments
The Group has elected not to recognise a right-of-use asset and a lease liability for short-term leases, i.e. leaseswithout purchase option with a lease term of 12 months or less from the commencement date. Similarly, the Groupwill not recognise a right-of-use asset and a lease liability on leases for which the underlying asset is of low value.
Prepayment Features with Negative Compensation (Amendments to MFRS 9)
Initial direct costs were excluded from the measurement of the right-of-use assets at the date of initialapplication.
The financial impact of the adoption of MFRS 16 on the financial statements of the Group are as disclosed in NoteA38.
The Interpretation provides guidance on how to recognise and measure deferred and current income tax assets andliabilities in situations where there is uncertainty over whether the tax treatment applied by an entity will be acceptedby the tax authority. If it is probable that the tax authority will accept an uncertain tax treatment that has been takenor is expected to be taken on a tax return, the accounting for income taxes shall be determined consistently with thattax treatment. If an entity concludes that it is not probable that the treatment will be accepted, it should reflect theeffect of the uncertainty in its income tax accounting in the period in which that determination is made, by applyingthe most likely amount method or the expected value method. The adoption of this Interpretation did not have anymaterial financial impact to the Group and the Company.
Under the current MFRS 9 requirements, the "solely payments of principal and interest on the principal amountoutstanding" ("SPPI") condition is not met if the lender has to make a settlement payment in the event of earlytermination by the borrower. The existing requirements are amended to enable entities, to measure at amortisedcost or at fair value through other comprehensive income (depending on the business model), some prepayablefinancial assets with negative compensation if the negative compensation is a reasonable compensation for earlytermination of the contract. An example of such reasonable compensation is an amount that reflects the effect of thechange in the relevant benchmark rate of interest at the time of termination; the calculation of this compensationpayment must be the same for both the case of an early repayment penalty and the case of a early repayment gain.The adoption of these amendments did not result in any impact as the Group and the Company do not hold anyprepayable financial asset with negative compensation.
The Group has adopted MFRS 16 for the first time since 1 April 2019. In its transition to MFRS 16, the Group haselected to apply the simplified transition approach whereby the comparative amounts were not restated. For leasespreviously classified as operating leases with remaining lease term greater than 12 months from the date of initialapplication, the Group recognised the lease liabilities at the date of initial application which were measured at thepresent value of the remaining lease payments, discounted using the incremental borrowing rate at the date of initialapplication. Correspondingly, the Group recognised the right-of-use assets at an amount equal to the lease liabilitiesand hence the Group did not make any adjustment to the opening retained earnings. In addition, the Group hasmade use of the following transitional practical expedients for recognition and measurement purposes at the date ofinitial application:
The Group has elected not to reassess whether an agreement is, or contains a lease at the date of initialapplication. Instead, for agreements entered into before the transition date, the Group relied on its previousassessments made in accordance with MFRS 117 and IC Interpretation 4 Determining whether anArrangement contains a Lease.
Lease agreements for which the remaining lease term ends within 12 months from the date of initial applicationare accounted as short-term leases whereby the Group has elected not to recognise the associated right-of-use assets and lease liabilities.
A single discount rate was applied for those portfolio of leases with reasonably similar characteristics, such asleases with a similar remaining lease term for a similar class of underlying asset in a similar economicenvironment.
11

AMMB Holdings Berhad (223035-V)Condensed Financial Statements For The Second Quarter Ended 30 September 2019
A1. BASIS OF PREPARATION (CONT'D.)
A1.1 Significant Accounting Policies (Cont'd.)
(d)
(e)
(f)
(i)
(ii)
(iii)
(iv) MFRS 123 Borrowing Costs
Annual Improvements to MFRSs 2015-2017 Cycle
The Annual Improvements to MFRSs 2015-2017 Cycle include minor amendments affecting 4 MFRSs, assummarised below:
MFRS 3 Business Combinations
MFRS 11 Joint Arrangements
MFRS 112 Income Taxes
Long-term Interests in associates and Joint Ventures (Amendments to MFRS 128)
Plan Amendment, Curtailment or Settlement (Amendments to MFRS 119)
The amendments clarify that MFRS 9 including its impairment requirements shall be applied to long-term interests inan associate or joint venture that form part of the net investment in the associate or joint venture but to which theequity method is not applied. The adoption of these amendments did not result in any impact as the Group's netinvestments in the associates and joint ventures do not include any long-term financial assets that are in the scopeof MFRS 9.
Currently, MFRS 119 did not specify how current service cost and net interest should be determined for theremainder of the period after a plan amendment, curtailment or settlement. The standard has been amended tomandate the use of updated assumptions from the remeasurement of net defined benefit liability or asset upon achange to the plan to determine current service cost and net interest for the remainder of the period after the changeto the plan. The adoption of these amendments did not result in any impact as there is no plan amendment,settlement or curtailment that occurred during the financial quarter ended 30 September 2019.
The amendments clarified that obtaining control of a business that is a joint operation is a businesscombination achieved in stages. The acquirer shall remeasure its previously held interest in the joint operationat fair value at the acquisition date. The amendment has no impact as the Group does not hold interest in anyjoint operation.
The amendments clarified that the party obtaining joint control of a business that is a joint operation shall notremeasure any previously held interest in the joint operation. The amendment has no impact as the Groupdoes not hold interest in any joint operation.
The amendments clarified that the income tax consequences of dividends on financial instruments classifiedas equity should be recognised according to where the past transactions or events that generated thedistributable amounts were recognised. Hence the tax consequences are recognised in profit or loss onlywhen an entity determines payments on such instruments are distributions of profits. The amendment did nothave any material financial impact to the Group and the Company.
The amendments clarified that if any specific borrowing remains outstanding after the related asset is ready forits intended use or sale, that borrowing becomes part of the funds that an entity borrows generally whencalculating the capitalisation rate on general borrowings. The amendment did not have any material financialimpact to the Group and the Company.
12

AMMB Holdings Berhad (223035-V)Condensed Financial Statements For The Second Quarter Ended 30 September 2019
A1. BASIS OF PREPARATION (CONT'D.)
A1.1 Significant Accounting Policies (Cont'd.)
Description
-----
The amendments, affecting nine published standards and five published interpretations, were issued as aconsequence to the issuance of the revised Conceptual Framework for Financial Reporting ("ConceptualFramework") on 30 April 2018. The references and quotations in these published standards and interpretations tothe Conceptual Framework have been updated so as to clarify the version of the Conceptual Framework thesepublished standards and interpretations refer to. The amendments are effective for annual periods beginning on orafter 1 January 2020 for entities that develop an accounting policy by reference to the Conceptual Framework.
MFRS 17 Insurance Contracts 1 January 2021
1 January 2020Amendments to References to the Conceptual Framework in MFRS Standards
Standards issued but not yet effective
Effective for annual periods beginning on or after
Definition of a Business (Amendments to MFRS 3) 1 January 2020
Amendments to References to the Conceptual Framework in MFRS Standards
The amendments revised the definition of a business, whereby the term "outputs" is narrowed to focus on goodsand services provided to customers, as well as generation of investment income and other income from ordinaryactivities; returns in the form of lower costs and other economic benefits are no longer considered. In addition, a newframework is added to help evaluate when an input and a substantive process are present.
The amendments are applied prospectively to business combinations and asset acquisitions that occur on or afterthe beginning of the first annual reporting period beginning on or after 1 January 2020. Early adoption is permitted.
Definition of Material (Amendments to MFRS 101 and MFRS 108)
The amendments clarified the definition of material and how it should be applied through the addition of definitionguidance. In addition, the explanations accompanying the definition have been improved and aligned across allMFRS standards to make it easier for entities to make materiality judgments. The amendments are appliedprospectively from annual reporting period beginning on or after 1 January 2020. Early adoption is permitted.
Definition of Material (Amendments to MFRS 101 and MFRS 108) 1 January 2020
Definition of a Business (Amendments to MFRS 3)
Sale or Contribution of Assets between an Investor and its Associate or JointVenture (Amendments to MFRS 10 and MFRS 128) To be determined by MASB
The nature of the new standards, amendments to published standards and new interpretation that are issued but not yeteffective are described below. The Group and the Company are assessing the financial effects of their adoption.
(a) Standards effective for financial year ending 31 March 2021
13

AMMB Holdings Berhad (223035-V)Condensed Financial Statements For The Second Quarter Ended 30 September 2019
A1. BASIS OF PREPARATION (CONT'D.)
A1.1 Significant Accounting Policies (Cont'd.)
-
-
MFRS 17 is effective for annual periods beginning on or after 1 January 2021. Nevertheless, the effective date ofMFRS 17 may be deferred by a year to 1 January 2022, subject to the standard setter's consultations. Earlyapplication is permitted provided MFRS 9 and MFRS 15 are also applied. A full retrospective application is required;an entity is permitted to choose between a modified retrospective approach and the fair value approach if fullretrospective application is impracticable.
The Group plans to adopt MFRS 17 on the required effective date and a Project Steering Committee has beenformed to oversee the implementation of MFRS 17. The Group expects that MFRS 17 will result in an importantchange to the accounting policies for insurance contract liabilities of the Group and is likely to have a significantimpact on profit and total equity of its Insurance business segment.
gains and losses resulting from transactions involving the sale or contribution to an associate of a joint ventureof assets that constitute a business is recognised in full.
(c) Standard effective on a date to be determined by MASB
Sale or Contribution of Assets between an Investor and its Associate or Joint Venture (Amendments toMFRS 10 and MFRS 128)
The amendments clarify that:gains and losses resulting from transactions involving assets that do not constitute a business, betweeninvestor and its associate or joint venture are recognised in the entity’s financial statements only to the extentof unrelated investors’ interests in the associate or joint venture; and
(b) Standards effective for financial year ending 31 March 2022
MFRS 17 Insurance Contracts
MFRS 17 supersedes MFRS 4 Insurance Contracts.
Standards issued but not yet effective (Cont'd.)
MFRS 17 requires a current measurement model, where estimates are remeasured in each reporting period. Themeasurement is based on the building blocks of discounted, probability-weighted cash flows, a risk adjustment anda contractual service margin ("CSM") representing the unearned profit of the contract. A simplified premiumallocation approach is permitted for the liability for the remaining coverage if it provides a measurement that is notmaterially different from the general model or if the coverage period is one year or less. However, claims incurredwill need to be measured based on the building blocks of discounted, risk-adjusted, probability weighted cash flows.
Changes in cash flows related to future services should be recognised against the CSM. The CSM cannot benegative, so changes in future cash flows that are greater than the remaining CSM are recognised in profit or loss.Interest is accreted on the CSM at rates locked in at initial recognition of a contract. To reflect the service provided,the CSM is released to profit or loss in each period on the basis of passage of time. Entities have an accountingpolicy choice to recognise the impact of changes in discount rates and other assumptions that relate to financialrisks either in profit or loss or in other comprehensive income.
14

AMMB Holdings Berhad (223035-V)Condensed Financial Statements For The Second Quarter Ended 30 September 2019
A1. BASIS OF PREPARATION (CONT'D.)
A1.2
(a)
(i)
(ii)
Summary of Significant Accounting Policies Applied from 1 April 2019
Leases
The determination of whether an arrangement is, or contains, a lease is based on whether the arrangement conveysa right to control the use the asset, even if that right is not explicitly specified in an arrangement.
The Group as a lessee (before 1 April 2019)
Leases that transfer to the Group substantially all the risks and benefits incidental to ownership of the leaseditem are classified as finance leases, and are capitalised at the commencement of the lease at the fair value ofthe leased property or, if lower, at the present value of the minimum lease payments. Any initial direct costsare also added to the amount capitalised. The corresponding lease obligations, net of finance charges, areincluded in other short-term and long-term payables. Lease payments are apportioned between financecharges and reduction of the lease liability so as to achieve a constant rate of interest on the remainingbalance of the liability.
A leased asset is depreciated over the useful life of the asset. However, if there is no reasonable certainty thatthe Group will obtain ownership by the end of the lease term, the asset is depreciated over the shorter of theestimated useful life of the asset and the lease term.
Leases that do not transfer to the Group substantially all the risks and benefits incidental to ownership of theleased items are operating leases. Operating lease payments are recognised as an operating expense in profitor loss on a straight-line basis over the lease term. The aggregate benefits of incentives provided by the lessorare recognised as a reduction of rental expenses over the lease term on a straight-line basis.
The Group as a lessee (from 1 April 2019)
Leases are recognised as a right-of-use asset and a corresponding lease liability at the date at which theleased asset is available for use by the Group.
At the commencement date of the lease, the Group recognises lease liabilities measured at the present valueof lease payments to be made over the lease term. The lease payments include fixed payments (including in-substance fixed payments) less any lease incentives receivable, variable lease payments that depend on anindex or a rate, and amounts expected to be paid under residual value guarantees. The lease payments alsoinclude the exercise price of a purchase option reasonably certain to be exercised by the Group and paymentsof penalties for terminating a lease, if the lease term reflects the Group exercising the option to terminate. Thevariable lease payments that do not depend on an index or a rate are recognised as expense in the period onwhich the event or condition that triggers the payment occurs.
In calculating the present value of lease payments, the Group uses the incremental borrowing rate at the leasecommencement date if the interest rate implicit in the lease is not readily determinable. After thecommencement date, the amount of lease liabilities is increased to reflect the accretion of interest and reducedfor the lease payments made. In addition, the carrying amount of lease liabilities is remeasured if there is amodification, a change in the lease term, a change in the in-substance fixed lease payments or a change in theassessment to purchase the underlying asset.
The significant accounting policies adopted in preparing these condensed interim financial statements are consistent withthose as disclosed in the annual financial statements of the Group and the Company for the financial year ended 31March 2019 except for the following new accounting policies which has been applied from 1 April 2019 following theadoption of MFRS 16:
15

AMMB Holdings Berhad (223035-V)Condensed Financial Statements For The Second Quarter Ended 30 September 2019
A1. BASIS OF PREPARATION (CONT'D.)
A1.2
(a)
(ii)
(ii)
A1.3 Significant Accounting Judgments, Estimates and Assumptions
Lease term of agreements with renewal options
The Group determines the lease term as the non-cancellable term of the lease, together with any periods covered by anoption to extend the lease if it is reasonably certain to be exercised.
The Group has the option, under some of its leases to lease the assets for additional terms of three to twelve years. Theextension options held are exercisable only by the Group and not by the respective lessor. In determining the lease term,the Group considers all facts and circumstances that create an economic incentive to exercise an extension option.Factors considered include historical lease durations and the costs and business disruption required to replace theleased asset. After the commencement date, the Group reassesses the lease term if there is a significant event orchange in circumstances that is within its control and affects its ability to exercise (or not to exercise) the option to renew.The Group included the renewal period as part of the lease term for most of its leases of premises due to thesignificance of these assets to its operations.
The preparation of the condensed interim financial statements in accordance with MFRS requires management to makejudgments, estimates and assumptions that affect the application of accounting policies and reported amounts ofrevenue, expenses, assets and liabilities, the accompanying disclosures and the disclosure of contingent liabilities.Judgments, estimates and assumptions are continually evaluated and are based on the past experience, reasonableexpectations of future events and other factors. Uncertainty about these assumptions and estimates could result inoutcomes that require a material adjustment to the carrying amount of assets or liabilities affected in future periods.
Summary of Significant Accounting Policies Applied from 1 April 2019 (Cont'd.)
Leases in which the Group does not transfer substantially all the risks and benefits of ownership of the assetare classified as operating leases. Rental income is recognised over the term of the lease on a straight-linebasis. Initial direct costs incurred in negotiating an operating lease are added to the carrying amount of theleased asset and recognised over the lease term on the same basis as rental income. Contingent rents arerecognised as revenue in the period in which they are earned.
Leases (Cont'd.)
The Group as a lessor
Right-of-use assets are measured at cost, less any accumulated depreciation and impairment losses, andadjusted for any remeasurement of lease liabilities. The cost of right-of-use assets includes the amount oflease liabilities recognised, initial direct costs incurred, and lease payments made at or before thecommencement date less any lease incentives received. Unless the Group is reasonably certain to obtainownership of the underlying asset at the end of the lease term, the recognised right-of-use assets aredepreciated on a straight-line basis over the shorter of its estimated useful life and the lease term. If the Groupis reasonably certain to obtain ownership of the underlying asset at the end of the lease term, the right-of-useasset is depreciated over the underlying asset’s useful life. Right-of-use assets are assessed for impairmentwhenever there is an indication that the right-of-use assets may be impaired.
The Group applies the short-term lease recognition exemption to its short-term leases, i.e. those leases thathave a lease term of 12 months or less from the commencement date and do not contain a purchase option. Italso applies the lease of low-value assets recognition exemption to leases of office equipment that areconsidered of low value, i.e. those with a value of RM20,000 or less when new. Lease payments on short-termleases and leases of low-value assets are recognised as expense on a straight-line basis over the lease term.
In the process of applying the Group's and the Company's accounting policies, the significant judgments, estimates andassumptions made by management were the same as those applied to the annual financial statements for the financialyear ended 31 March 2019, as well as the following:
The Group as a lessee (from 1 April 2019) (Cont'd.)
16

AMMB Holdings Berhad (223035-V)Condensed Financial Statements For The Second Quarter Ended 30 September 2019
A2. AUDIT QUALIFICATION
There was no audit qualification in the annual financial statements for the financial year ended 31 March 2019.
A3. SEASONALITY OR CYCLICALITY OF OPERATIONS
A4. UNUSUAL ITEMS DUE TO THEIR NATURE, SIZE OR INCIDENCE
A5.
A6.
Redemption of debt securities
a)
b)
A7. DIVIDENDS PAID
The final single-tier dividend of 15.0 sen per share for the financial year ended 31 March 2019 which amounted to approximately RM452,127,727 was paid on 5 July 2019 to shareholders whose names appear in the record of Depositors as at 26 June 2019 .
Other than as disclosed above, there were no new share issuance, repayment of debt securities, share buy-backs, sharecancellations, shares held as treasury shares nor resale of treasury shares by the Group and the Company during the financialquarter and period.
The operations of the Group and the Company are not materially affected by any seasonal or cyclical fluctuation in the currentfinancial quarter and period.
There were no unusual items during the current financial quarter and period.
CHANGES IN ESTIMATES
There was no material change in estimates of amounts reported in the prior financial years that have a material effect on thefinancial quarter ended 30 September 2019 except for the reversal of approximately RM51.2 million relating to the provision forestimated expediture in respect of the Group's obligations to repurchase loans/financing. The Group's commercial bankingsubsidiaries, AmBank (M) Berhad ("AmBank") and AmBank Islamic Berhad had entered into Supplemental Sales and PurchaseAgreements (“Supplemental SPAs”) with the purchasers of non-performing loans/financing, Aiqon Amanah Sdn Bhd and AiqonIslamic Sdn Bhd respectively on 30 August 2019. The Supplemental SPAs for variation of terms and conditions of the originalSales and Purchase Agreements had included a limit of RM18.0 million to the Group's liabilities for repurchase ofloans/financing.
ISSUANCE, REPURCHASE AND REPAYMENT OF DEBT AND EQUITY SECURITIES
On 3 July 2019, AmBank repaid in full the debt securities of USD400.0 million (equivalent to approximately RM1,655.0million) nominal value issued under its Euro Medium-Term Note programme of up to USD2.0 billion in nominal value (orits equivalent).
On the first call date of 19 August 2019, AmBank redeemed Tranche 1 of the Innovative Tier 1 Capital Securities ofRM300.0 million in nominal value issued under its RM500.0 million Innovative Tier 1 Capital Securities Programme("RMIT1 Programme"). On the first call of 30 September 2019, AmBank redeemed Tranche 2 of RM185.0 million innominal value issued under its RMIT1 Programme and cancelled the programme after this final redemption.
17

AMMB Holdings Berhad (223035-V)Condensed Financial Statements For The Second Quarter Ended 30 September 2019
A8. CASH AND SHORT-TERM FUNDS
30.09.19 31.03.19 30.09.19 31.03.19RM'000 RM'000 RM'000 RM'000
financial institutions 1,361,889 1,468,715 201,746 81,005
Licensed banks 1,156,192 3,767,374 - - Bank Negara Malaysia 1,176,400 1,826,000 - - Other financial institutions 13,191 13,006 - -
2,345,783 5,606,380 - -
3,707,672 7,075,095 201,746 81,005
(1,030) (1,351) - - 3,706,642 7,073,744 201,746 81,005
Movements in allowances for ECL are as follows:
Stage 2Stage 1 Lifetime ECL
12-month not credit Group ECL impaired Total30.09.19 RM'000 RM'000 RM'000
Balance at beginning of the financial year 1,320 31 1,351 (Writeback) of/allowances for ECL: (317) 5 (312) Transfer from deposits and placements with banks and
other financial institutions (Note A9) 4,034 - 4,034 New financial assets originated 449 - 449 Financial assets derecognised (4,620) - (4,620) Net remeasurement of allowances (180) 5 (175) Exchange difference (9) - (9) Balance at end of the financial period 994 36 1,030
Stage 1 Stage 212-month 12-month
Group ECL ECL Total31.03.19 RM'000 RM'000 RM'000
Balance at beginning of the financial year- as previously stated - - - - effects of adoption of MFRS 9 983 - 983 Balance at beginning of the financial year, as restated 983 - 983 Allowances for ECL: 298 32 330 Net remeasurement of allowances 298 32 330 Exchange difference 39 (1) 38 Balance at end of the financial year 1,320 31 1,351
A9.
30.09.19 31.03.19 30.09.19 31.03.19RM'000 RM'000 RM'000 RM'000
Licensed banks 289,910 198,234 - - 289,910 198,234 - -
(112) (2,075) - - 289,798 196,159 - -
Deposits and placements with maturity more than
Group Company
DEPOSITS AND PLACEMENTS WITH BANKS AND OTHER FINANCIAL INSTITUTIONS
Cash and balances with banks and other
Deposit placements maturing within one month:
Less : Allowances for ECL
Allowances for ECL
Group Company
Less :
one month
18

AMMB Holdings Berhad (223035-V)Condensed Financial Statements For The Second Quarter Ended 30 September 2019
A9.
Movements in allowances for ECL are as follows:
Stage 112-month
Group ECL30.09.19 RM'000
Balance at beginning of the financial year 2,075 (Writeback) of/allowances for ECL: (1,963) Transfer to cash and short term funds (Note A8) (4,034) New financial assets originated 2,174 Net remeasurement of allowances (103)
Balance at end of the financial period 112
Stage 112-month
Group ECL31.03.19 RM'000
Balance at beginning of the financial year- as previously stated - - effects of adoption of MFRS 9 - Balance at beginning of the financial year, as restated - Net remeasurement of allowances 2,075 Balance at end of the financial year 2,075
DEPOSITS AND PLACEMENTS WITH BANKS AND OTHER FINANCIAL INSTITUTIONS (CONT'D.)
19

AMMB Holdings Berhad (223035-V)Condensed Financial Statements For The Second Quarter Ended 30 September 2019
A10. FINANCIAL ASSETS AT FAIR VALUE THROUGH PROFIT AND LOSS
30.09.19 31.03.19 30.09.19 31.03.19RM'000 RM'000 RM'000 RM'000
At Fair Value
Money Market Instruments:Malaysian Treasury Bills 1,343,113 689,738 - - Malaysian Islamic Treasury Bills 835,385 164,980 - - Malaysian Government Securities 5,426,335 3,670,874 - - Malaysian Government Investment Issues 2,153,605 3,430,028 - - Cagamas bonds 102,010 101,181 - - Bank Negara Monetary Notes 1,260,278 6,388,520 - -
11,120,726 14,445,321 - -
Quoted Securities: In Malaysia:
Shares 380,254 369,730 - - Unit trusts 333,572 194,376 1,062 1,044 Corporate bonds and sukuk 37,382 37,937 - -
Outside Malaysia:Shares 123,477 117,962 - -
874,685 720,005 1,062 1,044
Unquoted Securities: In Malaysia:
Shares 2,766 2,813 - - Corporate bonds and sukuk 3,216,221 4,197,456 - -
3,218,987 4,200,269 - -
Total 15,214,398 19,365,595 1,062 1,044
Group Company
20

AMMB Holdings Berhad (223035-V)Condensed Financial Statements For The Second Quarter Ended 30 September 2019
A11. FINANCIAL INVESTMENTS AT FAIR VALUE THROUGH OTHER COMPREHENSIVE INCOME
30.09.19 31.03.19RM'000 RM'000
At Fair Value
Money Market Instruments:Malaysian Government Securities 3,408,522 2,841,636 Malaysian Government Investment Issues 4,026,601 2,776,050 Negotiable instruments of deposit - 299,979 Islamic negotiable instruments of deposit 199,334 -
7,634,457 5,917,665
Unquoted Securities: In Malaysia:
Shares 593,049 523,665 Corporate bonds and sukuk 9,268,859 9,161,866
Outside Malaysia:Shares 501 548 Corporate bonds and sukuk 102,416 106,129
9,964,825 9,792,208
Total 17,599,282 15,709,873
Stage 2Lifetime Stage 3
Stage 1 ECL Lifetime12-month not credit ECL
ECL impaired impaired Total30.09.19 RM'000 RM'000 RM'000 RM'000
Balance at beginning of the financial year 11,872 21,830 - 33,702 (Writeback) of/allowances for ECL during the financial period: (2,619) (4,536) 48,245 41,090 - Transfer to 12-month ECL (Stage 1) 998 (1,539) - (541) - Transfer to Lifetime ECL not credit impaired
(Stage 2) (527) 667 - 140 - Transfer to Lifetime ECL credit impaired
(Stage 3) - (260) 48,245 47,985 New financial assets originated 6,351 - - 6,351 Financial assets derecognised (6,563) - - (6,563) Net remeasurement of allowances (2,878) (3,404) - (6,282)
Balance at end of the financial period 9,253 17,294 48,245 74,792
Group
Movements in allowances ECL are as follows:
21

AMMB Holdings Berhad (223035-V)Condensed Financial Statements For The Second Quarter Ended 30 September 2019
A11. FINANCIAL INVESTMENTS AT FAIR VALUE THROUGH OTHER COMPREHENSIVE INCOME (CONT'D.)
Stage 2 Stage 3Lifetime Lifetime
Stage 1 ECL ECL12-month not credit credit
ECL impaired impaired Total31.03.19 RM'000 RM'000 RM'000 RM'000
Balance at beginning of the financial year- as previously stated - - 7,318 7,318 - effects of adoption of MFRS 9 14,797 7,264 (2,318) 19,743 Balance at beginning of the financial year,
as restated 14,797 7,264 5,000 27,061 (Writeback) of/allowances for ECL during the year (3,265) 14,566 - 11,301 - Transfer to Lifetime ECL not credit impaired
(Stage 2) (2,929) 16,379 - 13,450 New financial assets originated 21,563 1,972 - 23,535 Financial assets derecognised (8,483) (4,244) - (12,727) Net remeasurement of allowances (13,416) 459 - (12,957) Financial assets written-off - - (5,000) (5,000) Exchange difference 340 - - 340 Balance at end of the financial year 11,872 21,830 - 33,702
Movements in allowances ECL are as follows (Cont'd.):
22

AMMB Holdings Berhad (223035-V)Condensed Financial Statements For The Second Quarter Ended 30 September 2019
A12. FINANCIAL INVESTMENTS AT AMORTISED COST
30.09.19 31.03.19RM'000 RM'000
At Amortised Cost
Money Market Instruments:Malaysian Government Securities 472,241 472,186
Unquoted Securities: In Malaysia:
Corporate Bonds and sukuk 4,573,489 4,679,528 5,045,730 5,151,714
Less: Allowances for ECL (4,662) (5,398) Total 5,041,068 5,146,316
Movements in allowances for ECL are as follows:
Stage 3Stage 1 Lifetime ECL
12-Month creditECL impaired Total
30.09.19 RM'000 RM'000 RM'000
Balance at beginning of the financial year 5,398 - 5,398 Writeback of allowances for ECL during the financial period: (736) - (736) Net remeasurement of allowances (736) - (736)
Balance at end of the financial period 4,662 - 4,662
Stage 3Stage 1 Lifetime ECL
12-Month creditECL impaired Total
31.03.19 RM'000 RM'000 RM'000
Balance at beginning of the financial year- as previously stated - 2,550 2,550 - effects of adoption of MFRS 9 3,403 - 3,403 Balance at beginning of the financial year, as restated 3,403 2,550 5,953 Allowances for/(writeback of allowances for) ECL during the year: 1,995 (1,459) 536 Net remeasurement of allowances 1,995 - 1,995 Financial assets derecognised - (1,459) (1,459) Amount written off - (1,091) (1,091) Balance at end of the financial year 5,398 - 5,398
Group
23

AMMB Holdings Berhad (223035-V)Condensed Financial Statements For The Second Quarter Ended 30 September 2019
A13. LOANS, ADVANCES AND FINANCING
30.09.19 31.03.19RM'000 RM'000
At Amortised Cost:
Loans, advances and financing:Term loans/financing 27,144,558 26,421,666 Revolving credit 12,077,820 12,720,054 Housing loans/financing 31,603,223 30,463,942 Hire-purchase receivables 15,257,141 16,496,256 Card receivables 2,208,316 2,228,984 Overdraft 4,181,509 4,271,329 Claims on customers under acceptance credits 5,322,351 5,322,723 Trust receipts 1,949,342 1,872,490 Bills receivables 1,559,049 1,572,401 Staff loans 95,423 97,711 Others 578,263 377,006
Gross loans, advances and financing 101,976,995 101,844,562
Allowance for impairment on loans, advances and financing:Allowances for ECL: - Stage 1 - 12 month ECL (237,950) (275,818) - Stage 2 - Lifetime ECL not credit impaired (504,746) (622,411) - Stage 3 - Lifetime ECL credit impaired (496,326) (402,312)
(1,239,022) (1,300,541)
Net loans, advances and financing 100,737,973 100,544,021
(a) Gross loans, advances and financing analysed by type of customer are as follows:
30.09.19 31.03.19RM'000 RM'000
Domestic banking institutions 414 124,371 Domestic non-bank financial institutions 2,268,217 2,457,535 Domestic business enterprises:
- Small and medium enterprises 20,331,748 20,238,234 - Others 22,841,080 22,473,666
Government and statutory bodies 553,490 551,785 Individuals 54,586,690 54,660,848 Other domestic entities 20,241 19,296 Foreign individuals and entities 1,375,115 1,318,827
101,976,995 101,844,562
Group
Group
24

AMMB Holdings Berhad (223035-V)Condensed Financial Statements For The Second Quarter Ended 30 September 2019
A13. LOANS, ADVANCES AND FINANCING (CONT'D.)
(b) Gross loans, advances and financing analysed by geographical distribution are as follows:
30.09.19 31.03.19RM'000 RM'000
In Malaysia 101,641,349 101,566,469 Outside Malaysia 335,646 278,093
101,976,995 101,844,562
(c) Gross loans, advances and financing analysed by interest rate/rate of return sensitivity are as follows:
30.09.19 31.03.19RM'000 RM'000
Fixed rate:- Housing loans/financing 407,393 443,683 - Hire purchase receivables 14,433,839 15,434,981 - Other loans/financing 10,489,375 9,941,797
Variable rate:- Base rate and lending/financing rate plus 48,274,038 46,723,728 - Cost plus 21,164,568 22,156,095 - Other variable rates 7,207,782 7,144,278
101,976,995 101,844,562
(d) Gross loans, advances and financing analysed by sector are as follows:
30.09.19 31.03.19RM'000 RM'000
Agriculture 3,238,862 3,284,337 Mining and quarrying 1,924,030 1,705,878 Manufacturing 12,308,469 11,770,889 Electricity, gas and water 355,074 442,498 Construction 4,486,150 4,422,781 Wholesale and retail trade and hotels and restaurants 6,861,080 6,793,566 Transport, storage and communication 2,776,893 2,741,298 Finance and insurance 2,292,045 2,603,147 Real estate 7,403,199 8,289,464 Business activities 2,427,966 2,279,216 Education and health 2,057,648 1,571,964 Household of which: 55,576,691 55,688,901
Purchase of residential properties 30,964,419 29,884,774 Purchase of transport vehicles 13,712,299 15,065,225 Others 10,899,973 10,738,902
Others 268,888 250,623 101,976,995 101,844,562
Group
Group
Group
25
AMMB Holdings Berhad (223035-V)Condensed Financial Statements For The Second Quarter Ended 30 September 2019
A13. LOANS, ADVANCES AND FINANCING (CONT'D.)
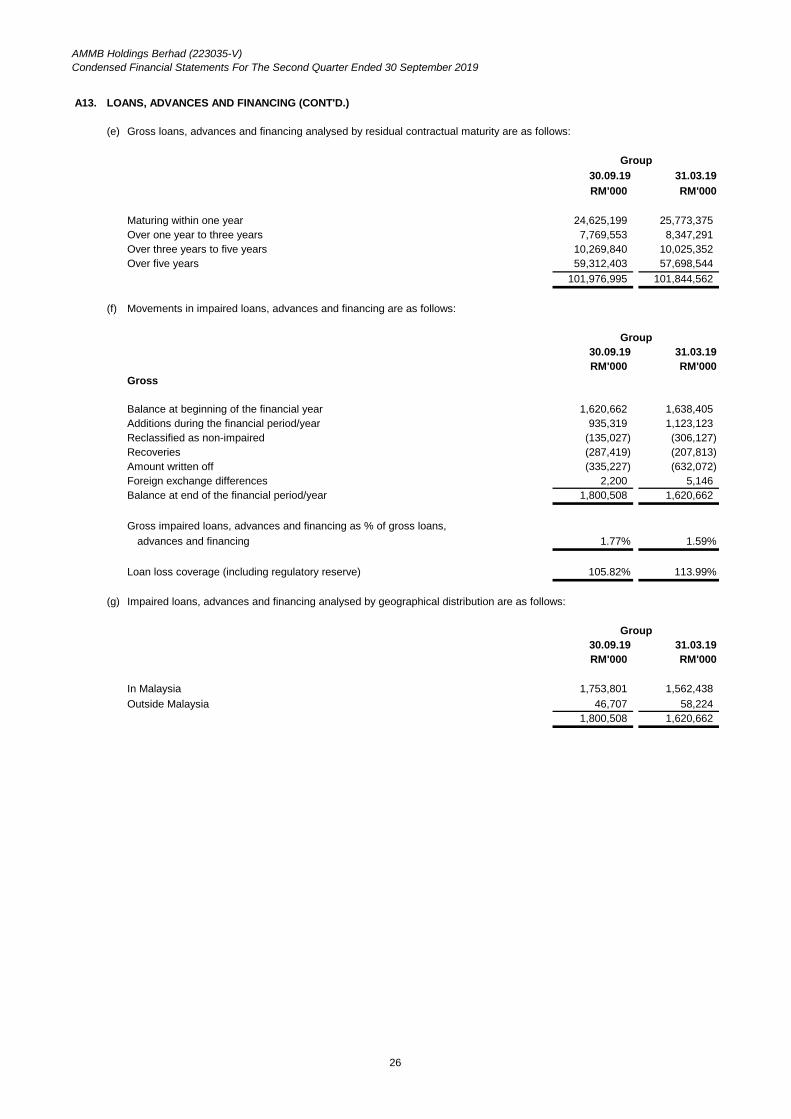
(e) Gross loans, advances and financing analysed by residual contractual maturity are as follows:
30.09.19 31.03.19RM'000 RM'000
Maturing within one year 24,625,199 25,773,375 Over one year to three years 7,769,553 8,347,291 Over three years to five years 10,269,840 10,025,352 Over five years 59,312,403 57,698,544
101,976,995 101,844,562
(f) Movements in impaired loans, advances and financing are as follows:
30.09.19 31.03.19RM'000 RM'000
Gross
Balance at beginning of the financial year 1,620,662 1,638,405 Additions during the financial period/year 935,319 1,123,123 Reclassified as non-impaired (135,027) (306,127) Recoveries (287,419) (207,813) Amount written off (335,227) (632,072) Foreign exchange differences 2,200 5,146 Balance at end of the financial period/year 1,800,508 1,620,662
Gross impaired loans, advances and financing as % of gross loans, advances and financing 1.77% 1.59%
Loan loss coverage (including regulatory reserve) 105.82% 113.99%
(g) Impaired loans, advances and financing analysed by geographical distribution are as follows:
30.09.19 31.03.19RM'000 RM'000
In Malaysia 1,753,801 1,562,438 Outside Malaysia 46,707 58,224
1,800,508 1,620,662
Group
Group
Group
26

AMMB Holdings Berhad (223035-V)Condensed Financial Statements For The Second Quarter Ended 30 September 2019
A13. LOANS, ADVANCES AND FINANCING (CONT'D.)
(h) Impaired loans, advances and financing analysed by sector are as follows:
30.09.19 31.03.19(Restated)(Note A38)
RM'000 RM'000
Agriculture 11,195 554 Mining and quarrying 54,827 78,964 Manufacturing 301,532 164,731 Electricity, gas and water 407 140 Construction 95,191 23,265 Wholesale and retail trade and hotels and restaurants 97,764 58,976 Transport, storage and communication 89,262 73,255 Finance and insurance - 1 Real estate 303,256 503,656 Business activities 48,903 14,831 Education and health 14,567 11,418 Household of which: 783,604 690,871
Purchase of residential properties 450,727 374,701 Purchase of transport vehicles 192,721 193,826 Others 140,156 122,344
1,800,508 1,620,662
(i) Movements in allowances for ECL are as follows:
Stage 2 Stage 3Stage 1 Lifetime ECL Lifetime ECL
12-Month not credit creditGroup ECL impaired impaired Total30.09.19 RM'000 RM'000 RM'000 RM'000
Balance at beginning of the financial year 275,818 622,411 402,312 1,300,541 (Writeback) of/allowances for ECL
during the financial period: (37,992) (117,753) 428,978 273,233 - Transfer to 12 month ECL (Stage 1) 14,246 (111,437) (3,476) (100,667) - Transfer to Lifetime ECL not credit impaired (Stage 2) (29,592) 170,012 (30,345) 110,075 - Transfer to Lifetime ECL credit impaired (Stage 3) (2,688) (35,551) 201,676 163,437 New financial assets originated 54,067 26,775 1,347 82,189 Net remeasurement of allowances (31,863) (128,373) 324,744 164,508 Modification of contractual cash flows
of financial assets (1,948) 75 202 (1,671) Financial assets derecognised (47,263) (35,725) (66,727) (149,715) Changes to model assumptions and
methodologies 7,049 (3,529) 1,557 5,077 Foreign exchange differences 124 88 263 475 Amount written off - - (335,227) (335,227) Balance at end of the financial period 237,950 504,746 496,326 1,239,022
Group
27

AMMB Holdings Berhad (223035-V)Condensed Financial Statements For The Second Quarter Ended 30 September 2019
A13. LOANS, ADVANCES AND FINANCING (CONT'D.)
(i) Movements in allowances for ECL are as follows (Cont'd.):
Stage 2 Stage 3Stage 1 Lifetime ECL Lifetime ECL
12-Month not credit creditGroup ECL impaired impaired Total31.03.19 RM'000 RM'000 RM'000 RM'000
Balance at beginning of the financial year- as previously stated - - - 943,330 - effects of adoption of MFRS 9 - - - 455,893 Balance at beginning of the financial year,
as restated 268,685 689,245 441,293 1,399,223 (Writeback) of/allowances for ECL
during the financial year: 6,889 (66,898) 596,106 536,097 - Transfer to 12 month ECL (Stage 1) 12,698 (135,350) (6,903) (129,555) - Transfer to Lifetime ECL not credit impaired (Stage 2) (23,638) 206,313 (25,259) 157,416 - Transfer to Lifetime ECL credit impaired (Stage 3) (2,898) (35,316) 243,125 204,911 New financial assets originated 74,555 179,608 12,774 266,937 Net remeasurement of allowances (9,077) (222,774) 457,461 225,610 Modification of contractual cash flows
of financial assets (1,141) (693) 112 (1,722) Financial assets derecognised (43,610) (58,686) (85,204) (187,500) Foreign exchange differences 244 64 (3,015) (2,707) Amount written off - - (632,072) (632,072) Balance at end of the financial year 275,818 622,411 402,312 1,300,541
28

AMMB Holdings Berhad (223035-V)Condensed Financial Statements For The Second Quarter Ended 30 September 2019
A14. OTHER ASSETS
30.09.19 31.03.19 30.09.19 31.03.19RM'000 RM'000 RM'000 RM'000
Trade receivables 213,602 435,443 - - Other receivables, deposits and prepayments 562,484 569,727 54,677 955 Interest/Profit receivable 460,687 443,227 - - Fee receivable 27,312 29,656 - - Amount due from originators - 18,350 - - Amount due from agents and brokers 34,744 54,399 - - Foreclosed properties 2,600 2,596 - - Tax recoverable 116,784 52,111 1,357 715 Collateral pledged for derivative transactions 556,604 386,679 - -
1,974,817 1,992,188 56,034 1,670 Accumulated impairment losses (8,548) (8,733) - - Allowances for ECL - Stage 1 - 12 months ECL (1) (4) - -
1,966,268 1,983,451 56,034 1,670
A15. REINSURANCE ASSETS AND OTHER INSURANCE RECEIVABLES
30.09.19 31.03.19Note RM'000 RM'000
Reinsurance assets from general insurance business (i) 331,864 464,854 Other insurance receivables (ii) 51,798 60,693
383,662 525,547
(i) Movements in allowances for impairment are as follows:
Balance at beginning of the financial year 2,639 7,514 Writeback for the financial year - (4,875) Balance at end of the financial period/year 2,639 2,639
(ii) Other insurance receivables
Due premiums including agents/brokers and co-insurers' balances 76,800 82,329 Amount owing by reinsurance and cedants 4,444 11,342 Accumulated impairment losses (29,446) (32,978)
51,798 60,693
Movements in allowances for impairment are as follows:
Balance at beginning of the financial year 32,978 32,194 - effects of adoption of MFRS 9 - 870 Restated balance at beginning of the financial year 32,978 33,064 Writeback for the financial period/year (3,532) (86) Balance at end of the financial period/year 29,446 32,978
Group
CompanyGroup
29

AMMB Holdings Berhad (223035-V)Condensed Financial Statements For The Second Quarter Ended 30 September 2019
A16. DEPOSITS FROM CUSTOMERS
30.09.19 31.03.19RM'000 RM'000
Demand deposits 17,769,025 19,464,525 Savings deposits 5,602,481 5,407,991 Term/Investment deposits 73,896,536 78,033,665 Negotiable instruments of deposits 5,444,976 4,009,808
102,713,018 106,915,989
The maturity structure of term/investment deposits and negotiable instruments of deposits is as follows:
30.09.19 31.03.19RM'000 RM'000
Due within six months 66,162,386 60,434,612 Six months to one year 10,401,160 18,760,401 Over one year to three years 2,284,499 1,819,272 Over three years to five years 493,467 1,029,188
79,341,512 82,043,473
The deposits are sourced from the following types of customers:
30.09.19 31.03.19RM'000 RM'000
Government and statutory bodies 3,810,768 4,916,717 Business enterprises 47,597,551 48,942,882 Individuals 41,584,919 45,673,217 Others 9,719,780 7,383,173
102,713,018 106,915,989
A17. DEPOSITS AND PLACEMENTS OF BANKS AND OTHER FINANCIAL INSTITUTIONS
30.09.19 31.03.19RM'000 RM'000
Licensed banks 6,463,360 5,018,484 Licensed investment banks 399,761 808,355 Bank Negara Malaysia 130,240 124,231 Other financial institutions 1,929,193 1,736,649
8,922,554 7,687,719
Group
Group
Group
Group
30

AMMB Holdings Berhad (223035-V)Condensed Financial Statements For The Second Quarter Ended 30 September 2019
A18. OTHER LIABILITIES
30.09.19 31.03.19 30.09.19 31.03.19
RM'000 RM'000 RM'000 RM'000
Trade payables 204,731 445,075 - - Other payables and accruals 1,084,350 1,584,142 68,796 23,303 Interest payable on deposits and borrowings 925,237 966,826 - - Lease deposits and advance rental 38,800 33,620 - - Provision for commitments and contingencies 26,266 81,779 - - Allowances for ECL on loan commitments and financial guarantees 76,092 96,749 - - Lease liabilities 314,608 - - - Provision for reinstatement for leased properties 21,189 - - - Amount due to subsidiaries - - 3,359 8,133 Provision for taxation 53,512 44,294 - - Collateral received for derivative transactions 134,112 140,104 - - Deferred income 82,652 83,999 - -
2,961,549 3,476,588 72,155 31,436
Movements in allowances for ECL on loan commitments and financial guarantees are as follows:
Stage 2 Stage 3Stage 1 Lifetime ECL Lifetime ECL
12-Month not credit creditGroup ECL impaired impaired Total30.09.19 RM’000 RM’000 RM’000 RM’000
Balance at beginning of the financial year 51,703 34,141 10,905 96,749 (Writeback) of/allowances for ECL: (13,129) 885 (8,501) (20,745) - Transfer to 12 month ECL (Stage 1) 1,530 (11,521) - (9,991) - Transfer to Lifetime ECL not credit impaired (Stage 2) (1,712) 11,960 - 10,248 - Transfer to Lifetime ECL credit impaired (Stage 3) (133) (1,060) 17,587 16,394 New exposures originated 13,398 7,661 - 21,059 Net remeasurement of allowances (4,478) 4,312 108 (58) Exposures derecognised (15,116) (7,039) (26,196) (48,351) Changes to model assumptions and methodologies (6,618) (3,428) - (10,046) Foreign exchange differences 98 (3) (7) 88 Balance at the end of the financial period 38,672 35,023 2,397 76,092
Group Company
31

AMMB Holdings Berhad (223035-V)Condensed Financial Statements For The Second Quarter Ended 30 September 2019
A18. OTHER LIABILITIES (CONT'D.)
Movements in allowances for ECL on loan commitments and financial guarantees are as follows (Cont'd.):
Stage 2 Stage 3Stage 1 Lifetime ECL Lifetime ECL
12-Month not credit creditGroup ECL impaired impaired Total31.03.19 RM’000 RM’000 RM’000 RM’000
Balance at beginning of the financial year- as previously stated - - - 72,711 - effects of adoption of MFRS 9 - - - 31,551 Balance at beginning of the financial year,
as restated 58,069 45,950 243 104,262 (Writeback) of/allowances for ECL: (6,472) (11,774) 10,661 (7,585) - Transfer to 12 month ECL (Stage 1) 1,337 (14,395) - (13,058) - Transfer to Lifetime ECL not credit impaired (Stage 2) (2,031) 10,414 - 8,383 - Transfer to Lifetime ECL credit impaired (Stage 3) (136) (217) 10,893 10,540 New exposures originated 19,512 13,733 - 33,245 Net remeasurement of allowances (7,737) (9,622) (232) (17,591) Exposures derecognised (17,417) (11,687) - (29,104) Foreign exchange difference 106 (35) 1 72 Balance at the end of the financial year 51,703 34,141 10,905 96,749
A19. INSURANCE CONTRACT LIABILITIES AND OTHER INSURANCE PAYABLES
Group30.09.19 31.03.19
Note RM'000 RM'000
Insurance contract liabilities (i) 2,350,934 2,527,045 Other insurance payables (ii) 46,889 166,204
2,397,823 2,693,249
(i) Insurance contract liabilities
Gross contract Reinsurance Net contractliabilities assets liabilities
RM'000 RM'000 RM'000
General insurance business 2,350,934 (331,864) 2,019,070
Gross contract Reinsurance Net contractliabilities assets liabilities
RM'000 RM'000 RM'000
General insurance business 2,527,045 (464,854) 2,062,191
(ii) Other insurance payables30.09.19 31.03.19RM'000 RM'000
Amount due to agents and intermediaries 20,657 29,184 Amount due to reinsurers and cedants 26,232 137,020
46,889 166,204
31.03.19
30.09.19
32

AMMB Holdings Berhad (223035-V)Condensed Financial Statements For The Second Quarter Ended 30 September 2019
A20. INTEREST INCOME
30.09.19 30.09.18 30.09.19 30.09.18RM'000 RM'000 RM'000 RM'000
Short-term funds and deposits and placements with banks and other financial institutions 11,882 26,580 33,479 43,233
Financial assets at fair value through profit or loss 113,265 120,823 238,353 227,400
Financial investments at fair value through other comprehensive income 129,493 79,212 257,380 136,559
Financial investments at amortised cost 35,652 36,469 71,614 69,907 Loans and advances 940,703 956,378 1,902,219 1,881,519 Impaired loans and advances 1,064 3,944 4,533 7,299 Others 4,918 6,509 9,090 12,990
1,236,977 1,229,915 2,516,668 2,378,907
Short-term funds and deposits and placements with banks and other financial institutions 997 5,509 1,925 6,082
Financial investments at amortised cost - 18,736 - 37,268 997 24,245 1,925 43,350
A21. INTEREST EXPENSE
30.09.19 30.09.18 30.09.19 30.09.18RM'000 RM'000 RM'000 RM'000
Deposits from customers 572,620 615,239 1,184,255 1,176,203 Deposit and placements of banks and other
financial institutions 48,866 35,202 93,362 61,969 Senior notes 8,340 33,692 29,792 62,315 Credit linked Notes 1,928 1,914 3,824 3,800 Securities sold under repurchase agreements 43,349 7,440 83,660 8,107 Recourse obligation on loans sold to Cagamas Berhad 41,586 46,264 84,955 86,118 Subordinated bonds and notes 33,064 31,077 65,771 61,770 Medium term notes - - - 822 Tier 1 capital securities 7,127 21,428 17,103 42,623 Other structured products and others 7,201 6,300 12,749 12,448
764,081 798,556 1,575,471 1,516,175
Senior notes - 5,671 - 11,280 Subordinated notes - 18,761 - 37,318
- 24,432 - 48,598
Cumulative QuarterIndividual Quarter
Company
Group
Company
Individual Quarter Cumulative Quarter
Group
33

AMMB Holdings Berhad (223035-V)Condensed Financial Statements For The Second Quarter Ended 30 September 2019
A22. NET INCOME FROM INSURANCE BUSINESS
Note 30.09.19 30.09.18 30.09.19 30.09.18RM'000 RM'000 RM'000 RM'000
Income from insurance business: (a)Premium income from general insurance
business 357,005 343,230 706,177 679,223 357,005 343,230 706,177 679,223
Insurance claims and commissions: (b)Insurance commission1 34,632 34,920 67,859 56,913 General insurance claims 209,839 200,666 404,620 359,560
244,471 235,586 472,479 416,473
Total income from insurance business, net 112,534 107,644 233,698 262,750
(a) Income from insurance businessGross Premium - insurance contract 391,534 373,422 769,133 734,333 - change in unearned premium provision (35) (6,954) 4,713 87
391,499 366,468 773,846 734,420 Premium ceded- insurance contract (33,337) (29,333) (65,429) (60,176) - change in unearned premium provision (1,157) 6,095 (2,240) 4,979
(34,494) (23,238) (67,669) (55,197) 357,005 343,230 706,177 679,223
(b) Insurance claims- gross benefits and claims paid 250,887 232,010 510,301 452,328 - claims ceded to reinsurers (19,827) (26,282) (65,033) (42,073) - change in contract liabilities - insurance contract (112,631) (29,900) (171,398) (78,758) - change in contract liabilities ceded to reinsurers
- insurance contract 91,410 24,838 130,750 28,063 209,839 200,666 404,620 359,560
1
Individual Quarter
Group
Cumulative Quarter
Net of bancassurance commission paid/payable to other subsidiaries of the Group of RM7,698,000 (30 September 2018:RM6,352,000) eliminated upon consolidation.
34

AMMB Holdings Berhad (223035-V)Condensed Financial Statements For The Second Quarter Ended 30 September 2019
A23. OTHER OPERATING INCOME
30.09.19 30.09.18 30.09.19 30.09.18RM'000 RM'000 RM'000 RM'000
Fee and commission income:Fees on loans and securities 45,542 35,528 84,060 82,362 Corporate advisory 4,225 3,310 13,624 7,406 Guarantee fees 13,393 14,746 27,152 30,046 Underwriting commission - - 323 525 Portfolio management fees 8,751 11,558 16,407 20,351 Unit trust fees, commission and charges 32,197 22,053 60,089 47,998 Property trust management fees 1,843 1,871 3,677 3,729 Brokerage fees and commission 7,332 8,316 15,689 19,132 Bancassurance commission 3,423 2,970 6,275 5,923 Wealth management fees 5,798 2,684 12,733 5,721 Remittances 6,565 5,237 12,363 10,611 Fees, service and commission charges 6,617 8,816 14,299 16,209 Others 5,141 4,460 10,239 8,811
140,827 121,549 276,930 258,824
Investment and trading income:Net gain from sale of financial assets
at fair value through profit or loss 35,339 14,055 44,442 4,787 Net gain from sale of financial investments
at fair value through other comprehensive income 45,717 2,021 53,687 2,186 Net gain/(loss) on revaluation of financial assets
at fair value through profit or loss 6,226 35,453 65,763 (5,703) Net gain on foreign exchange 8,459 47,596 32,145 94,151 Net loss on derivatives (7,707) (14,356) (26,744) (18,579) Dividend income from:
Financial assets at fair value through profit or loss 4,730 6,884 7,590 12,610
Financial assets at fair value through other comprehensive income 1,116 362 3,726 2,172
Others 493 53 (306) 2,554 94,373 92,068 180,303 94,178
Group
Cumulative QuarterIndividual Quarter
35

AMMB Holdings Berhad (223035-V)Condensed Financial Statements For The Second Quarter Ended 30 September 2019
A23. OTHER OPERATING INCOME (CONT'D.)
30.09.19 30.09.18 30.09.19 30.09.18RM'000 RM'000 RM'000 RM'000
Other income:Net non-trading foreign exchange gain 236 356 652 518 Net gain on disposal of property and equipment 412 1,522 475 3,034 Rental income 1,117 1,569 2,648 2,943 Profit from sale of goods and services 4,565 4,957 8,926 9,970 (Loss)/Gain on disposal of foreclosed properties - - (1) 21,653 Others 3,843 3,794 7,794 9,365
10,173 12,198 20,494 47,483 245,373 225,815 477,727 400,485
30.09.19 30.09.18 30.09.19 30.09.18RM'000 RM'000 RM'000 RM'000
Investment and trading income:Dividend income from:
Subsidiaries 89,782 315,525 592,928 742,992 Financial assets at fair value through
profit or loss 9 9 18 18 89,791 315,534 592,946 743,010
Other income:Others 468 96 819 111
468 96 819 111
90,259 315,630 593,765 743,121
Individual Quarter
Cumulative Quarter
Cumulative Quarter
Individual Quarter
Company
36
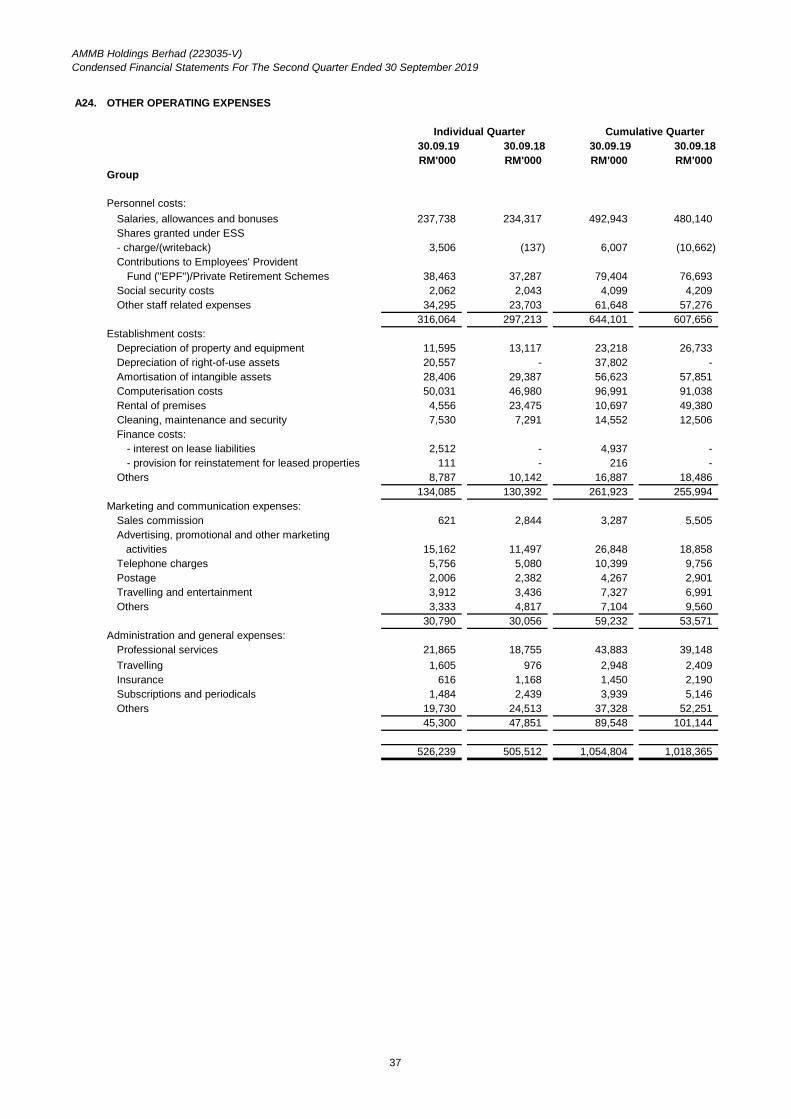
AMMB Holdings Berhad (223035-V)Condensed Financial Statements For The Second Quarter Ended 30 September 2019
A24. OTHER OPERATING EXPENSES
30.09.19 30.09.18 30.09.19 30.09.18RM'000 RM'000 RM'000 RM'000
Salaries, allowances and bonuses 237,738 234,317 492,943 480,140 Shares granted under ESS- charge/(writeback) 3,506 (137) 6,007 (10,662) Contributions to Employees' Provident
Fund ("EPF")/Private Retirement Schemes 38,463 37,287 79,404 76,693 Social security costs 2,062 2,043 4,099 4,209 Other staff related expenses 34,295 23,703 61,648 57,276
316,064 297,213 644,101 607,656 Establishment costs:
Depreciation of property and equipment 11,595 13,117 23,218 26,733 Depreciation of right-of-use assets 20,557 - 37,802 - Amortisation of intangible assets 28,406 29,387 56,623 57,851 Computerisation costs 50,031 46,980 96,991 91,038 Rental of premises 4,556 23,475 10,697 49,380 Cleaning, maintenance and security 7,530 7,291 14,552 12,506 Finance costs:
- interest on lease liabilities 2,512 - 4,937 - - provision for reinstatement for leased properties 111 - 216 -
Others 8,787 10,142 16,887 18,486 134,085 130,392 261,923 255,994
Marketing and communication expenses:Sales commission 621 2,844 3,287 5,505 Advertising, promotional and other marketing activities 15,162 11,497 26,848 18,858 Telephone charges 5,756 5,080 10,399 9,756 Postage 2,006 2,382 4,267 2,901 Travelling and entertainment 3,912 3,436 7,327 6,991 Others 3,333 4,817 7,104 9,560
30,790 30,056 59,232 53,571 Administration and general expenses:
Professional services 21,865 18,755 43,883 39,148 Travelling 1,605 976 2,948 2,409 Insurance 616 1,168 1,450 2,190 Subscriptions and periodicals 1,484 2,439 3,939 5,146 Others 19,730 24,513 37,328 52,251
45,300 47,851 89,548 101,144
526,239 505,512 1,054,804 1,018,365
Personnel costs:
Group
Cumulative QuarterIndividual Quarter
37

AMMB Holdings Berhad (223035-V)Condensed Financial Statements For The Second Quarter Ended 30 September 2019
A24. OTHER OPERATING EXPENSES (CONT'D.)
30.09.19 30.09.18 30.09.19 30.09.18RM'000 RM'000 RM'000 RM'000
Personnel costs:Salaries, allowances and bonuses - 3,252 - 8,079 Shares granted under ESS- writeback - - - (968) Contributions to EPF/Private Retirement Scheme - 412 - 1,178 Social security costs - 1 - 3 Other staff related expenses 23 130 (27) 216
23 3,795 (27) 8,508 Establishment costs:
Depreciation of property and equipment 58 58 115 149 Computerisation costs 58 - 173 3 Others - 2 - 3
116 60 288 155 Marketing and communication expenses:
Advertising, promotional and other marketing activities 94 227 341 357 Telephone charges 2 6 5 11 Travelling and entertainment 12 28 48 85 Others 1 87 1 90
109 348 395 543 Administration and general expenses:
Professional services 981 750 1,101 947 Travelling - 5 1 12 Insurance 5 (1) - 18 Subscriptions and periodicals - 5 3 15 Others 635 1,027 1,689 1,980
1,621 1,786 2,794 2,972
Service transfer pricing expense/(income), net 6,655 1,396 11,356 (3,158)
8,524 7,385 14,806 9,020
A25. ALLOWANCE FOR IMPAIRMENT ON LOANS, ADVANCES AND FINANCING
30.09.19 30.09.18 30.09.19 30.09.18RM'000 RM'000 RM'000 RM'000
Impaired loans, advances and financing:Allowances for ECL 225,594 169,799 273,233 276,062
Impaired loans, advances and financing:Recovered, net (120,414) (134,281) (212,964) (250,905)
105,180 35,518 60,269 25,157
Group
Cumulative Quarter
Individual Quarter Cumulative Quarter
Individual Quarter
Company
38

AMMB Holdings Berhad (223035-V)Condensed Financial Statements For The Second Quarter Ended 30 September 2019
A26. ALLOWANCE/(WRITEBACK OF ALLOWANCE) FOR IMPAIRMENT ON FINANCIAL INVESTMENTS AND OTHER FINANCIAL ASSETS
30.09.19 30.09.18 30.09.19 30.09.18RM'000 RM'000 RM'000 RM'000
Financial investmentsFinancial investments at fair value
through other comprehensive income 42,706 (3,629) 41,090 1,005 Financial investments at amortised cost (716) 807 (736) 960
41,990 (2,822) 40,354 1,965
Other financial assetsCash and short-term funds 165 2,067 (312) 1,425 Deposits and placements with banks and other financial institutions (1,292) (101) (1,963) 231 Other assets 900 1,685 1,001 387
(227) 3,651 (1,274) 2,043
Cumulative QuarterIndividual Quarter
Group
39

AMMB Holdings Berhad (223035-V)Condensed Financial Statements For The Second Quarter Ended 30 September 2019
A27. BUSINESS SEGMENT ANALYSIS
(a) Retail Banking
(b) Business Banking
(c)
(i)
(ii)
(d)
(e)
(f)
(g)
(i)
(ii)
(iii)
Segment information is presented in respect of the Group’s business segments. The business segment information is preparedbased on internal management reports, which are regularly reviewed by the chief operating decision-maker in order to allocateresources to segment and to assess its performance. The Group comprises the following main business segments:
Wholesale Banking comprises Corporate Banking and Group Treasury & Markets.
Group Treasury & Markets includes proprietary trading as well as providing full range of products and servicesrelating to treasury activities, including foreign exchange, derivatives, fixed income and structured warrants.
Group Funding and Others comprises activities to maintain the liquidity of the Group as well as support operations of itsmain business units and non-core operations of the Group.
Retail Banking continues to focus on building mass affluent, affluent and small business customers. Retail Banking offersproducts and financial solutions which includes auto finance, mortgages, personal loans, credit cards, small businessloans, priority banking services, wealth management, remittance services and deposits.
Investment BankingInvestment Banking offers investment banking solutions and services, encompassing capital markets (primary) activities,broking, private banking services, corporate advisory and fund raising services (equity and debt capital).
Note:
Group Funding and Others
Insurance segment offers a broad range of general insurance products, namely motor, personal accident, property andhousehold. It also offers life insurance and takaful products namely wealth protection/savings, health and medicalprotection and family takaful solutions provided through our joint venture operations.
Corporate Banking offers a full range of products and services of corporate lending, trade finance, offshore banking,and cash management solutions to wholesale banking clients;
Wholesale Banking
Fund ManagementFund Management comprises the asset and fund management services, offering a variety of investment solutions forvarious asset classes to retail, corporate and institutional clients.
Insurance
The revenue generated by a majority of the operating segments substantially comprise finance income. The ChiefOperating Decision Maker relies primarily on the net finance income information to assess the performance of, and tomake decisions about resources to be allocated to these operating segments.
Business Banking (“BB”) focuses on the small and medium sized enterprises segment, which comprises EnterpriseBanking and Commercial Banking. Solutions offered to Enterprise Banking customers encompass Capital Expenditure(“CAPEX”) financing, Working Capital financing and Cash Management, and while Commercial Banking offers the samesuite of products, it also provides more sophisticated structures such as Contract Financing, Development Loans andProject Financing.
The comparatives have been restated with current business realignment.
The financial information by geographical segment is not presented as the Group's activities are principally conducted inMalaysia.
40

AMMB Holdings Berhad (223035-V)Condensed Financial Statements For The Second Quarter Ended 30 September 2019
A27. BUSINESS SEGMENT ANALYSIS (CONT'D.)
Group
Group GroupRetail Business Corporate Treasury & Investment Fund funding
For the financial period ended banking banking banking Markets banking management Insurance and others Total 30 September 2019 RM'000 RM'000 RM'000 RM'000 RM'000 RM'000 RM'000 RM'000 RM'000
External revenue 1,623,858 343,902 970,091 807,137 103,583 54,683 849,315 (12,852) 4,739,717 Revenue from other segments (119,556) (86,276) (469,627) 342,428 (11,400) - - 344,431 - Total operating revenue 1,504,302 257,626 500,464 1,149,565 92,183 54,683 849,315 331,579 4,739,717
Net interest income 601,319 134,426 326,834 112,948 22,416 520 68,587 81,650 1,348,700 Other income 124,718 42,385 83,076 113,530 61,627 54,051 289,718 10,917 780,022 Share in results of associates
and joint ventures 618 - - - - - 605 3,534 4,757 Net income 726,655 176,811 409,910 226,478 84,043 54,571 358,910 96,101 2,133,479 Other operating expenses (425,428) (73,242) (107,875) (36,454) (57,762) (32,359) (170,751) (150,933) (1,054,804) of which:
Depreciation of property andequipment (9,348) (356) (559) (59) (365) (141) (5,023) (7,367) (23,218)
Depreciation of right-of-use assets - - - - (138) - (7,632) (30,032) (37,802) Amortisation of intangible assets (10,277) (38) (2,989) (615) (367) (86) (9,219) (33,032) (56,623)
Profit/(loss) before impairment losses 301,227 103,569 302,035 190,024 26,281 22,212 188,159 (54,832) 1,078,675 Writeback of allowance/(Allowance) for
loans, advances and financing (95,929) (44,655) 77,219 (68) 510 - - 2,654 (60,269) Writeback of allowance/(Allowance) for
impairment (5) - (42,971) 7,940 (869) (125) 3,532 (3,050) (35,548) Provision for commitments and contingencies
-writeback 240 4,075 16,415 17 - - - 2,272 23,019 Other recoveries/(write-offs), net 28 - - - - - (3,855) - (3,827) Profit/(loss) before taxation and zakat 205,561 62,989 352,698 197,913 25,922 22,087 187,836 (52,956) 1,002,050 Taxation and zakat (49,168) (14,602) (84,216) (43,162) (5,469) (4,508) (37,175) 20,937 (217,363) Profit/(loss) for the financial period 156,393 48,387 268,482 154,751 20,453 17,579 150,661 (32,019) 784,687
Other information
Total segment assets 57,730,499 10,303,866 34,072,326 40,223,040 1,918,103 99,635 5,248,334 4,200,726 153,796,529 Total segment liabilities 47,958,081 6,319,903 9,905,552 56,550,163 995,741 19,472 3,232,085 9,667,836 134,648,833 Cost to income ratio 58.5% 41.4% 26.3% 16.1% 68.7% 59.3% 47.6% 157.1% 49.4%Gross loans, advances and financing 57,561,803 10,424,619 32,501,420 - 1,594,939 - 851 (106,637) 101,976,995 Net loans, advances and financing 56,718,253 10,299,650 32,233,662 - 1,593,199 - 781 (107,572) 100,737,973 Impaired loans, advances and financing 868,192 262,253 668,323 - 1,740 - - - 1,800,508 Total deposits 47,144,956 6,195,864 9,704,414 48,597,215 774,800 - - (781,677) 111,635,572 Additions to:
Property and equipment 8,775 220 324 6 226 72 1,212 10,021 20,856 Intangible assets 6,305 23 194 386 56 75 4,177 17,246 28,462
Wholesale banking
41

AMMB Holdings Berhad (223035-V)Condensed Financial Statements For The Second Quarter Ended 30 September 2019
A27. BUSINESS SEGMENT ANALYSIS (CONT'D.)
Group
Group GroupRetail Business Corporate Treasury & Investment Fund funding
For the financial period ended banking banking banking Markets banking management Insurance and others Total 30 September 2018 (Restated) RM'000 RM'000 RM'000 RM'000 RM'000 RM'000 RM'000 RM'000 RM'000
External revenue 1,640,297 287,506 1,031,546 595,663 98,926 49,387 784,152 (2,220) 4,485,257 Revenue from other segments (73,632) (71,027) (514,666) 333,777 (16,049) - - 341,597 - Total operating revenue 1,566,665 216,479 516,880 929,440 82,877 49,387 784,152 339,377 4,485,257
Net interest income 592,329 114,850 327,522 57,741 23,405 570 68,030 105,514 1,289,961 Other income 131,051 38,392 111,162 50,880 51,854 48,636 265,683 10,594 708,252 Share in results of associates
and joint ventures 1,072 - - - - - 17,698 3,822 22,592 Net income 724,452 153,242 438,684 108,621 75,259 49,206 351,411 119,930 2,020,805 Other operating expenses (415,574) (62,342) (102,693) (34,395) (55,547) (31,117) (168,934) (147,763) (1,018,365) of which:
Depreciation of property andequipment (11,081) (265) (332) (183) (536) (182) (6,054) (8,100) (26,733)
Amortisation of intangible assets (9,734) (25) (884) (1,416) (350) (114) (10,587) (34,741) (57,851)
Profit/(Loss) before impairment losses 308,878 90,900 335,991 74,226 19,712 18,089 182,477 (27,833) 1,002,440 Writeback of allowance/(Allowance) for
loans, advances and financing (72,448) (5,348) 55,034 - 5,621 - - (8,016) (25,157) Writeback of allowance/(Allowance) for
-(loss)/writeback 1,122 - (7,202) 2,835 (577) (173) 2,543 (13) (1,465) Provision for commitments and contingencies
impairment 10,152 2,293 (5,949) - - - - (428) 6,068 Other recoveries/(write-offs), net 26 - 5,683 - 11 - (3,314) 206 2,612 Profit/(loss) before taxation and zakat 247,730 87,845 383,557 77,061 24,767 17,916 181,706 (36,084) 984,498 Taxation and zakat (59,179) (18,665) (89,062) (16,970) (5,115) (3,602) (30,049) (144) (222,786) Profit/(loss) for the financial period 188,551 69,180 294,495 60,091 19,652 14,314 151,657 (36,228) 761,712
Other information
Total segment assets 56,755,020 8,502,359 34,827,304 35,919,380 2,493,055 91,536 5,492,662 4,131,671 148,212,987 Total segment liabilities 55,101,669 5,179,941 9,739,671 44,627,050 1,241,168 14,784 3,503,430 10,853,586 130,261,299 Cost to income ratio 57.4% 40.7% 23.4% 31.7% 73.8% 63.2% 48.1% 123.2% 50.4%Gross loans, advances and financing 56,456,289 8,582,541 33,333,401 - 1,651,517 - 1,413 (86,459) 99,938,702 Net loans, advances and financing 55,686,523 8,498,255 32,860,637 - 1,649,498 - 1,343 (128,557) 98,567,699 Impaired loans, advances and
financing 744,736 216,800 756,263 - 2,016 - - - 1,719,815 Total deposits 54,236,136 5,101,910 9,484,900 39,624,380 838,528 - - (1,693,336) 107,592,518 Additions to:
Property and equipment 5,011 1,065 1,269 9 194 29 1,309 3,398 12,284 Intangible assets 9,063 16 7,900 - 150 74 7,098 21,981 46,282
Wholesale banking
42

AMMB Holdings Berhad (223035-V)Condensed Financial Statements For The Second Quarter Ended 30 September 2019
A28. VALUATION OF PROPERTY AND EQUIPMENT
Property and equipment are stated at cost less accumulated depreciation and impairment losses.
A29. EVENTS SUBSEQUENT TO REPORTING DATE
A30. CHANGES IN THE COMPOSITION OF THE GROUP AND THE COMPANY
a) Dissolution of subsidiary
b) Winding-up of subsidiaries
(i)
(ii)
A31. ASSETS HELD FOR SALE
30.09.19 31.03.19RM'000 RM'000
Assets held for saleProposed disposal of property and equipment 1,458 5,029
Group
Other than as disclosed above, there were no material changes in the composition of the Group and the Company for the currentfinancial quarter.
AMBB Capital (L) Ltd which commenced Members' voluntary liquidation on 17 March 2017 was dissolved on 8 April 2019.
On 15 October 2019, as part of the Group's ongoing corporate exercise to transfer all retail related investment/business to theCompany's wholly-owned subsidiary, AmBank, MBF Cards (M’sia) Sdn Bhd, another wholly-owned subsidiary disposed itsentire 33.33% equity interest in Bonuskad Loyalty Sdn Bhd (“Bonuskad”) to AmBank for a consideration of approximatelyRM32.3 million. The transfer of Bonuskad will not have any impact to the Group's financial statements for the financial yearending 31 March 2020 as the share of results of Bonuskad will continue to be equity accounted by the Group.
There has not arisen in the interval between the end of the financial year and the date of this report any items, transaction orevent of a material and unusual nature likely, in the opinion of the directors, to affect substantially the results of the operations ofthe Group for the current financial quarter and period.
An indirect wholly-owned dormant subsidiary, AmFraser International Pte Ltd (“AmFraser”) (incorporated inSingapore) had at its Extraordinary General Meeting ("EGM") held on 30 August 2019, resolved that it be wound upby way of a members’ voluntary winding up, pursuant to Section 290(1) of the Companies Act (Cap. 50) of Singapore.
AmFraser is a non-operating company and there is no plan for AmFraser to undertake any business activity. Thewinding up will not have any material effect on the earnings and net assets of the Group for the financial year ending31 March 2020.
An indirect wholly-owned subsidiary, AmPremier Capital Berhad (“AmPremier”) had, at its Extraordinary GeneralMeeting (“EGM”) held on 25 October 2019, resolved that it be wound up by way of a member's voluntary winding uppursuant to Section 439(1)(b) of the Companies Act, 2016.
The winding up of AmPremier will not have any material effect on the earnings and net assets of AMMB for thefinancial year ending 31 March 2020.
43
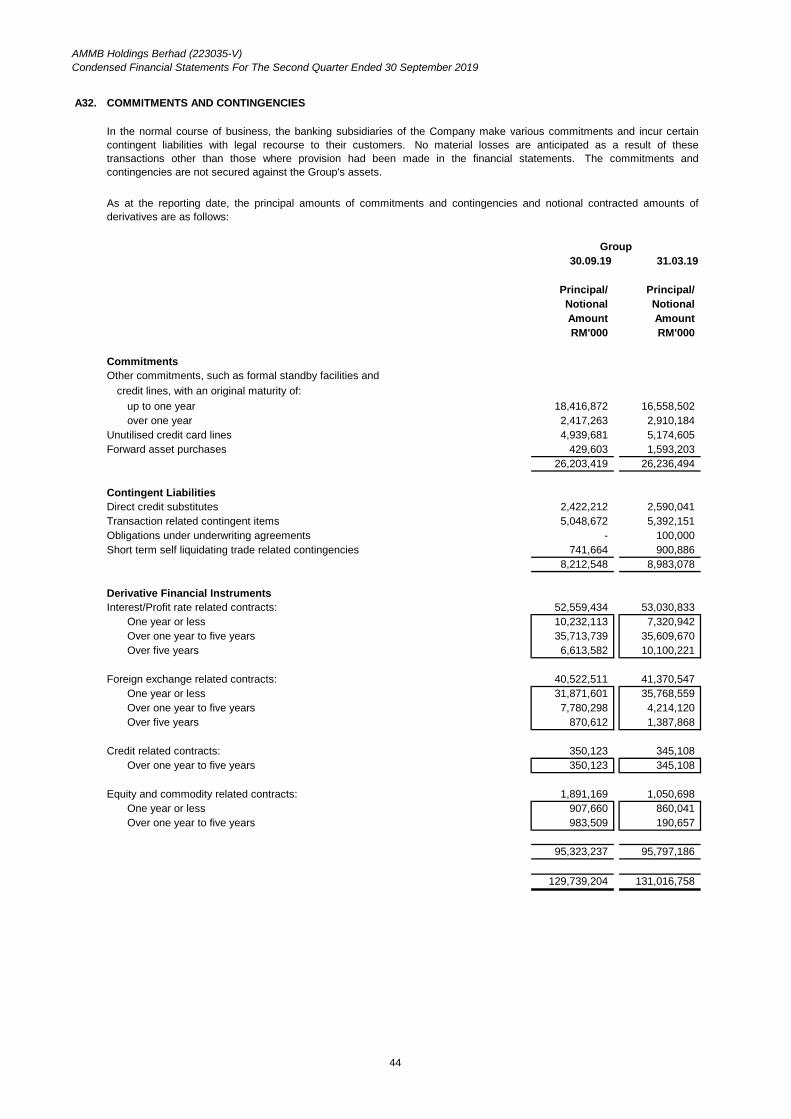
AMMB Holdings Berhad (223035-V)Condensed Financial Statements For The Second Quarter Ended 30 September 2019
A32. COMMITMENTS AND CONTINGENCIES
Principal/ Principal/Notional NotionalAmount AmountRM'000 RM'000
CommitmentsOther commitments, such as formal standby facilities and
credit lines, with an original maturity of:up to one year 18,416,872 16,558,502 over one year 2,417,263 2,910,184
Unutilised credit card lines 4,939,681 5,174,605 Forward asset purchases 429,603 1,593,203
26,203,419 26,236,494
Contingent LiabilitiesDirect credit substitutes 2,422,212 2,590,041 Transaction related contingent items 5,048,672 5,392,151 Obligations under underwriting agreements - 100,000 Short term self liquidating trade related contingencies 741,664 900,886
8,212,548 8,983,078
Derivative Financial InstrumentsInterest/Profit rate related contracts: 52,559,434 53,030,833
One year or less 10,232,113 7,320,942 Over one year to five years 35,713,739 35,609,670 Over five years 6,613,582 10,100,221
Foreign exchange related contracts: 40,522,511 41,370,547 One year or less 31,871,601 35,768,559 Over one year to five years 7,780,298 4,214,120 Over five years 870,612 1,387,868
Credit related contracts: 350,123 345,108 Over one year to five years 350,123 345,108
Equity and commodity related contracts: 1,891,169 1,050,698 One year or less 907,660 860,041 Over one year to five years 983,509 190,657
95,323,237 95,797,186
129,739,204 131,016,758
In the normal course of business, the banking subsidiaries of the Company make various commitments and incur certaincontingent liabilities with legal recourse to their customers. No material losses are anticipated as a result of thesetransactions other than those where provision had been made in the financial statements. The commitments andcontingencies are not secured against the Group's assets.
30.09.19 31.03.19Group
As at the reporting date, the principal amounts of commitments and contingencies and notional contracted amounts ofderivatives are as follows:
44

AMMB Holdings Berhad (223035-V)Condensed Financial Statements For The Second Quarter Ended 30 September 2019
A32. COMMITMENTS AND CONTINGENCIES (CONT'D.)
(a)
(b)
(c)
The Company has given an unsecured guarantee amounting to RM50.0 million (31 March 2019: RM70.0 million) onbehalf of AmInvestment Bank Berhad ("AmInvestment Bank") for the payment and discharge of all monies due ontrading accounts maintained by Morgan Stanley & Co. International Plc. in respect of its futures trading activity withAmInvestment Bank.
AmMetLife Insurance Berhad ("AmMetLife") had received complaints from 66 policyholders relating to the alleged mis-selling of certain insurance product of AmMetLife. The Company and Metlife International Holdings, Inc ("Metlife") areworking jointly in the process of investigating these complaints and assessing any financial impact thereon.
Under the terms for the sale by the Company to MetLife of shares in AmMetLife, the Group would fully indemnify MetLifeor AmMetLife from any losses arising from incidences of mis-selling of certain specified insurance products occurringprior to the share sale.
The Malaysia Competition Commission ("MyCC")’s Proposed Decision ("PD") against PIAM and its 22 members(including AmGeneral Insurance Berhad, a subsidiary)
As at the reporting date, updates on other commitments and contingencies of the Group and of the Company are as follows:
On 13 May 2019, AmGeneral Insurance Berhad’s legal counsel delivered 3rd oral representations to MyCC and followedup with Members of Commissioner (“MOC”) on the proposed undertakings which is, reiterating its position that it has notinfringed Section 4(2)(a) of the CA 2010 and that no infringement penalties should be imposed. Although MOC has notreached a decision, AmGeneral Insurance Berhad will continue to follow up on this matter. There is no final finding oninfringement or non-infringement by MyCC as at the reporting date.
45

AMMB Holdings Berhad (223035-V)Condensed Financial Statements For The Second Quarter Ended 30 September 2019
A33. DERIVATIVE FINANCIAL INSTRUMENTS
Contract/ Contract/Notional Notional
Group Amount Assets Liabilities Amount Assets LiabilitiesRM'000 RM'000 RM'000 RM'000 RM'000 RM'000
Trading derivativesInterest/Profit rate related contracts: 50,714,434 446,731 505,684 50,375,833 271,496 282,274 - One year or less 9,632,114 23,021 17,819 6,990,942 5,238 5,625 - Over one year to three years 18,655,063 70,631 86,557 19,781,143 57,841 62,843 - Over three years 22,427,257 353,079 401,308 23,603,748 208,417 213,806
Foreign exchange related contracts: 40,522,511 484,678 419,905 41,370,547 471,135 487,177 - One year or less 31,871,601 126,834 118,829 35,768,559 133,011 188,279 - Over one year to three years 4,806,586 127,385 133,625 3,471,372 69,209 109,736 - Over three years 3,844,324 230,459 167,451 2,130,616 268,915 189,162
Credit related contracts: 350,123 4,883 1,289 345,108 5,417 768 - Over one year to three years 350,123 4,883 1,289 345,108 5,417 768
Equity and commodity relatedcontracts: 1,891,169 64,302 66,303 1,050,698 15,875 16,692 - One year or less 907,660 21,625 23,454 860,041 12,886 13,703 - Over one year to three years 912,405 38,966 39,138 190,657 2,989 2,989 - Over three years 71,104 3,711 3,711 - - -
93,478,237 1,000,594 993,181 93,142,186 763,923 786,911
Hedging derivativesInterest rate related contracts:
Interest rate swaps:Cash flow hedge 1,495,000 - 22,931 2,305,000 - 27,240 - One year or less 600,000 - 5,211 330,000 - 484 - Over one year to three years 495,000 - 8,263 1,095,000 - 12,660 - Over three years 400,000 - 9,457 880,000 - 14,096
Fair value hedge 350,000 - 15,545 350,000 - 11,341 - Over three years 350,000 - 15,545 350,000 - 11,341
Total 95,323,237 1,000,594 1,031,657 95,797,186 763,923 825,492
Fair Value Fair Value
30.09.19 31.03.19
The following summarises the notional contracted amounts of derivatives held for trading and derivative designated in hedgeaccounting relationships of the Group and the revalued derivative financial instruments as at the reporting date:
46

AMMB Holdings Berhad (223035-V)Condensed Financial Statements For The Second Quarter Ended 30 September 2019
A34. FAIR VALUE MEASUREMENTS OF FINANCIAL INSTRUMENTS
Determination of fair value and fair value hierarchy
Level 1: quoted prices (unadjusted) in active markets for identical assets or liabilities;Level 2:
Level 3:
Group Level 1 Level 2 Level 3 Total30.09.19 RM'000 RM'000 RM'000 RM'000
Derivative financial assets 3,136 997,458 - 1,000,594 Financial assets at fair value through profit or loss
- Money market securities - 11,120,726 - 11,120,726 - Shares 503,731 - 2,766 506,497 - Unit trusts 39,585 293,987 - 333,572 - Quoted corporate bonds and sukuk - 37,382 - 37,382 - Unquoted corporate bonds and sukuk - 3,216,221 - 3,216,221
Financial investments at fair value through other comprehensive income- Money market securities - 7,634,457 - 7,634,457 - Shares - - 593,550 593,550 - Unquoted corporate bonds and sukuk - 9,371,275 - 9,371,275
546,452 32,671,506 596,316 33,814,274
Derivative financial liabilities 5,555 1,026,102 - 1,031,657
About 1.8% (31 March 2019: 1.5%) of the Group's total financial assets recorded at fair value, are based on estimates andrecorded as Level 3 investments. Where estimates are used, these are based on a combination of independent third-partyevidence and internally developed models, calibrated to market observable data where possible. While such valuations aresensitive to estimates, it is believed that changing one or more of the assumptions to reasonably possible alternativeassumptions would not change the fair value significantly.
other techniques for which all inputs which have a significant effect on the recorded fair value are observable, eitherdirectly or indirectly;techniques which use inputs which have a significant effect on the recorded fair value that are not based onobservable market data.
The Group and the Company measure fair value using the following fair value hierarchy, which reflects the significance of theinputs used in making the measurements.
Financial assets and liabilities measured using a valuation technique based on assumptions that are supported by prices fromobservable current market transactions are assets and liabilities for which pricing is obtained via pricing services, but whereprices have not been determined in an active market, financial assets with fair values based on broker quotes, investments inprivate equity funds with fair values obtained via fund managers and assets that are valued using the Group’s and theCompany's own models whereby the majority of assumptions are market observable.
For assets and liabilities measured at fair value that are recognised on a recurring basis, the Group and the Company determinewhether transfers have occurred between Levels in the hierarchy by re-assessing categorisation (based on the lowest level inputthat is significant to the fair value measurement as a whole) at the end of each reporting period.
The following tables show the Group's and the Company's financial instruments that are measured at fair value at the reportingdate analysed by levels within the fair value hierarchy.
Non market observable inputs means that fair values are determined, in whole or in part, using a valuation technique (model)based on assumptions that are neither supported by prices from observable current market transactions in the same instrument,nor are they based on available market data. The main asset classes in this category are unlisted equity investments and debtinstruments. Valuation techniques are used to the extent that observable inputs are not available, thereby allowing for situationsin which there is little, if any, market activity for the asset or liability at the measurement date. However, the fair valuemeasurement objective remains the same, that is, an exit price from the perspective of the Group and the Company. Therefore,unobservable inputs reflect the Group’s and the Company's own assumptions about the assumptions that market participantswould use in pricing the asset or liability (including assumptions about risk). These inputs are developed based on the bestinformation available, which might include the Group’s and the Company's own data.
47

AMMB Holdings Berhad (223035-V)Condensed Financial Statements For The Second Quarter Ended 30 September 2019
A34. FAIR VALUE MEASUREMENTS OF FINANCIAL INSTRUMENTS (CONT'D.)
Company Level 1 Level 2 Level 3 Total30.09.19 RM'000 RM'000 RM'000 RM'000
Financial assets at fair value through profit or loss- Unit trusts - 1,062 - 1,062
- 1,062 - 1,062
Group Level 1 Level 2 Level 3 Total31.03.19 RM'000 RM'000 RM'000 RM'000
Derivative financial assets 655 763,268 - 763,923 Financial assets at fair value through profit or loss
- Money market securities - 14,445,321 - 14,445,321 - Shares 487,692 - 2,813 490,505 - Unit trusts 33,563 160,813 - 194,376 - Quoted corporate bonds and sukuk - 37,937 - 37,937 - Unquoted corporate bonds and sukuk - 4,197,456 - 4,197,456
Financial investments at fair value through other comprehensive income- Money market securities - 5,917,665 - 5,917,665 - Shares - - 524,213 524,213 - Unquoted corporate bonds and sukuk - 9,267,995 - 9,267,995
521,910 34,790,455 527,026 35,839,391
Derivative financial liabilities 1,300 824,192 - 825,492
Company31.03.19
Financial assets at fair value through profit or loss- Unit trusts - 1,044 - 1,044
- 1,044 - 1,044
48
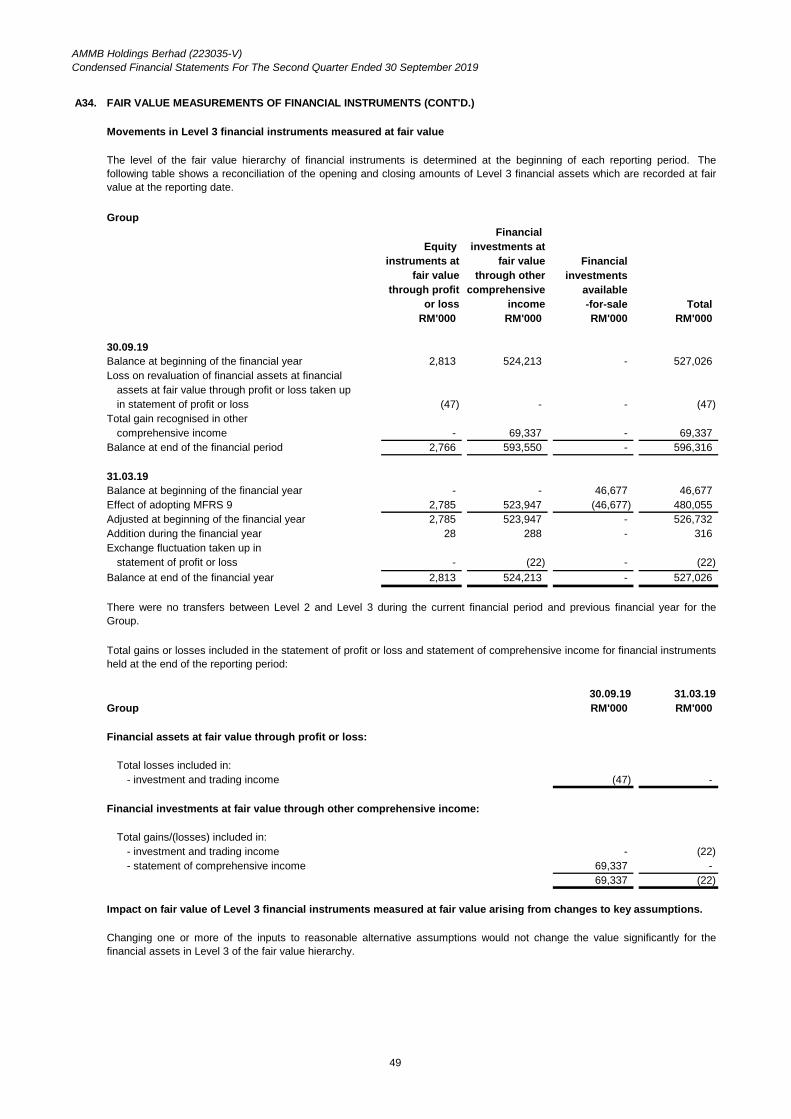
AMMB Holdings Berhad (223035-V)Condensed Financial Statements For The Second Quarter Ended 30 September 2019
A34. FAIR VALUE MEASUREMENTS OF FINANCIAL INSTRUMENTS (CONT'D.)
Movements in Level 3 financial instruments measured at fair value
GroupFinancial
Equity investments atinstruments at fair value Financial
fair value through other investmentsthrough profit comprehensive available
or loss income -for-sale TotalRM'000 RM'000 RM'000 RM'000
30.09.19Balance at beginning of the financial year 2,813 524,213 - 527,026 Loss on revaluation of financial assets at financial
assets at fair value through profit or loss taken up in statement of profit or loss (47) - - (47)
Total gain recognised in othercomprehensive income - 69,337 - 69,337
Balance at end of the financial period 2,766 593,550 - 596,316
31.03.19Balance at beginning of the financial year - - 46,677 46,677 Effect of adopting MFRS 9 2,785 523,947 (46,677) 480,055 Adjusted at beginning of the financial year 2,785 523,947 - 526,732 Addition during the financial year 28 288 - 316 Exchange fluctuation taken up in
statement of profit or loss - (22) - (22) Balance at end of the financial year 2,813 524,213 - 527,026
30.09.19 31.03.19Group RM'000 RM'000
Total losses included in:- investment and trading income (47) -
Total gains/(losses) included in:- investment and trading income - (22) - statement of comprehensive income 69,337 -
69,337 (22)
Changing one or more of the inputs to reasonable alternative assumptions would not change the value significantly for thefinancial assets in Level 3 of the fair value hierarchy.
Financial investments at fair value through other comprehensive income:
The level of the fair value hierarchy of financial instruments is determined at the beginning of each reporting period. Thefollowing table shows a reconciliation of the opening and closing amounts of Level 3 financial assets which are recorded at fairvalue at the reporting date.
Total gains or losses included in the statement of profit or loss and statement of comprehensive income for financial instrumentsheld at the end of the reporting period:
Impact on fair value of Level 3 financial instruments measured at fair value arising from changes to key assumptions.
There were no transfers between Level 2 and Level 3 during the current financial period and previous financial year for theGroup.
Financial assets at fair value through profit or loss:
49

AMMB Holdings Berhad (223035-V)Condensed Financial Statements For The Second Quarter Ended 30 September 2019
A35.
(a) The capital adequacy ratios of the Group and banking subsidiaries are as follows:
AmBank AmInvestmentAmBank Islamic Bank Group
Before deducting proposed dividends:Common Equity Tier 1 ("CET1") Capital ratio 12.228% 11.348% 58.492% 12.758%Tier 1 Capital ratio 12.228% 11.348% 58.492% 12.758%Total Capital ratio 16.865% 16.466% 59.104% 16.229%
After deducting proposed dividends:CET1 Capital ratio 12.070% 11.178% 56.618% 12.582%Tier 1 Capital ratio 12.070% 11.178% 56.618% 12.582%Total Capital ratio 16.707% 16.296% 57.230% 16.054%
AmBank AmInvestment
AmBank Islamic Bank Group Before deducting proposed dividend:
CET1 Capital ratio 11.752% 11.654% 43.711% 12.328%Tier 1 Capital ratio 12.406% 11.654% 43.711% 12.328%Total Capital ratio 17.038% 16.836% 44.174% 15.864%
After deducting proposed dividend:CET1 Capital ratio 11.323% 11.084% 41.539% 11.890%Tier 1 Capital ratio 11.977% 11.084% 41.539% 11.890%Total Capital ratio 16.609% 16.267% 42.001% 15.426%
Notes:
(1)
(2)
(3)
(a) a Capital Conservation Buffer ("CCB") of 2.5%; and(b) a Countercyclical Capital Buffer ("CCyB") determined as the weighted-average of the prevailing CCyB rates applied in
the jurisdictions in which the banking institution has credit exposures.
Pursuant to the BNM's guidelines on Capital Adequacy Framework (Capital Components) issued, a financial institution isrequired to hold and maintain, at all times, minimum capital adequacy ratios at 4.5% for CET1 capital, 6.0% for Tier 1 capitaland 8.0% for Total capital ratio. In addition, a financial institution is also required to hold and maintain capital buffers in theform of CET1 Capital above the minimum CET1 Capital, Tier 1 Capital and Total Capital adequacy levels. The capital buffersshall comprise the sum of the following:
CAPITAL ADEQUACY
30.09.19
31.03.19
The capital adequacy ratios are computed in accordance to BNM’s guidelines on Capital Adequacy Framework (CapitalComponents) and Capital Adequacy Framework for Islamic Banks (Capital Components) issued by Bank Negara Malaysiaon 2 February 2018, which is based on the Basel III capital accord. The Group has adopted the Standardised Approach forCredit and Market Risks and the Basic Indicator Approach for Operational Risk, based on BNM’s Guidelines on CapitalAdequacy Framework (Basel II - Risk Weighted Assets) and Capital Adequacy Framework for Islamic Banks (Risk WeightedAssets) issued on 2 February 2018.
The Company, being a financial holding company ("FHC") i.e. a financial holding company approved pursuant to section112(3) of the FSA or section 124(3) of the IFSA and holds investment directly or indirectly in corporations that are engagedpredominantly in banking business or Islamic banking business, has complied with BNM guidelines on minimum capitaladequacy ratios and capital buffer requirements at the consolidated level effective 1 January 2019.
For regulatory capital reporting purposes, the consolidated level comprise the consolidation of all its financial and non-financial subsidiaries, excluding investments in insurance subsidiaries as per BNM's guidelines on Capital AdequacyFramework (Capital Components). Under the guidelines, investments in insurance subsidiaries shall be deducted in thecalculation of CET1 Capital ratio.
50
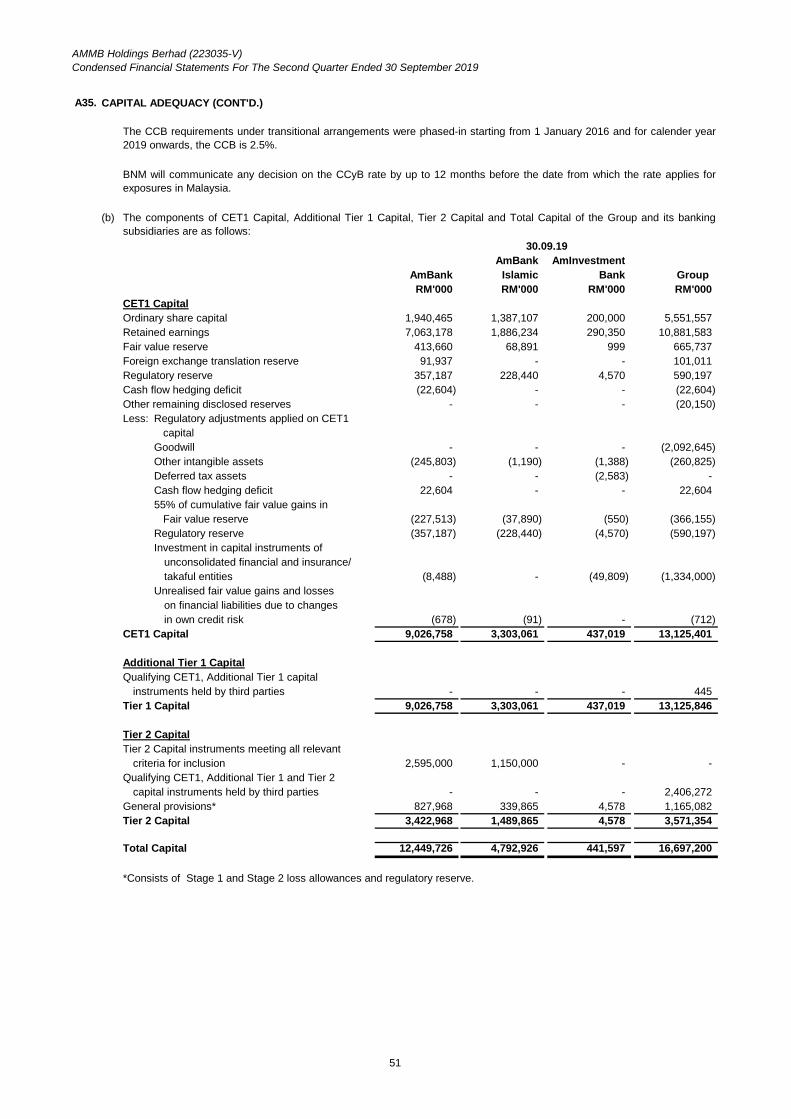
AMMB Holdings Berhad (223035-V)Condensed Financial Statements For The Second Quarter Ended 30 September 2019
A35.
(b)
AmBank AmInvestmentAmBank Islamic Bank Group RM'000 RM'000 RM'000 RM'000
CET1 CapitalOrdinary share capital 1,940,465 1,387,107 200,000 5,551,557 Retained earnings 7,063,178 1,886,234 290,350 10,881,583 Fair value reserve 413,660 68,891 999 665,737 Foreign exchange translation reserve 91,937 - - 101,011 Regulatory reserve 357,187 228,440 4,570 590,197 Cash flow hedging deficit (22,604) - - (22,604) Other remaining disclosed reserves - - - (20,150) Less: Regulatory adjustments applied on CET1
capitalGoodwill - - - (2,092,645) Other intangible assets (245,803) (1,190) (1,388) (260,825) Deferred tax assets - - (2,583) - Cash flow hedging deficit 22,604 - - 22,604 55% of cumulative fair value gains in Fair value reserve (227,513) (37,890) (550) (366,155) Regulatory reserve (357,187) (228,440) (4,570) (590,197) Investment in capital instruments of
unconsolidated financial and insurance/takaful entities (8,488) - (49,809) (1,334,000)
Unrealised fair value gains and losseson financial liabilities due to changesin own credit risk (678) (91) - (712)
CET1 Capital 9,026,758 3,303,061 437,019 13,125,401
Additional Tier 1 CapitalQualifying CET1, Additional Tier 1 capital
instruments held by third parties - - - 445 Tier 1 Capital 9,026,758 3,303,061 437,019 13,125,846
Tier 2 CapitalTier 2 Capital instruments meeting all relevant
criteria for inclusion 2,595,000 1,150,000 - - Qualifying CET1, Additional Tier 1 and Tier 2
capital instruments held by third parties - - - 2,406,272 General provisions* 827,968 339,865 4,578 1,165,082 Tier 2 Capital 3,422,968 1,489,865 4,578 3,571,354
Total Capital 12,449,726 4,792,926 441,597 16,697,200
*Consists of Stage 1 and Stage 2 loss allowances and regulatory reserve.
BNM will communicate any decision on the CCyB rate by up to 12 months before the date from which the rate applies forexposures in Malaysia.
The CCB requirements under transitional arrangements were phased-in starting from 1 January 2016 and for calender year2019 onwards, the CCB is 2.5%.
CAPITAL ADEQUACY (CONT'D.)
The components of CET1 Capital, Additional Tier 1 Capital, Tier 2 Capital and Total Capital of the Group and its bankingsubsidiaries are as follows:
30.09.19
51

AMMB Holdings Berhad (223035-V)Condensed Financial Statements For The Second Quarter Ended 30 September 2019
A35.
(b)
AmBank AmInvestmentAmBank Islamic Bank Group RM'000 RM'000 RM'000 RM'000
Credit RWA 66,237,468 28,713,218 499,593 93,378,338 Less: Credit RWA absorbed by Profit
Sharing Investment Account - (1,524,032) - (171,779) Total Credit RWA 66,237,468 27,189,186 499,593 93,206,559 Market RWA 2,790,885 437,972 2,133 3,005,760 Operational RWA 4,100,360 1,480,593 245,423 5,980,231 Large exposure risk RWA for equity holdings 689,906 - - 690,252 Total RWA 73,818,619 29,107,751 747,149 102,882,802
AmBank AmInvestmentAmBank Islamic Bank GroupRM'000 RM'000 RM'000 RM'000
CET1 CapitalShare capital 1,940,465 1,387,107 200,000 5,551,557 Retained earnings 7,014,840 1,933,885 296,696 10,773,243 Fair value reserve 245,836 39,151 1,089 460,863 Foreign exchange translation reserve 85,109 - - 94,089 Regulatory reserve 280,556 164,928 4,674 450,158 Cash flow hedging deficit (12,074) - - (12,074) Other remaining disclosed reserves - - - (26,188) Less: Regulatory adjustments applied on CET1
capitalGoodwill - - - (2,092,645) Other intangible assets (368,654) (1,351) (1,750) (386,109) Deferred tax assets (57,589) - (3,051) (53,957) Cash flow hedging deficit 12,074 - - 12,074 55% of cumulative fair value gains in Fair value reserve (135,210) (21,533) (599) (253,475) Regulatory reserve (280,556) (164,928) (4,674) (450,158) Investment in capital instruments of
unconsolidated financial and insurance/takaful entities (8,488) - (49,809) (1,334,000)
CET1 Capital 8,716,309 3,337,259 442,576 12,733,378
Additional Tier 1 CapitalAdditional Tier 1 Capital instruments
(subject to gradual phase-out treatment) 485,000 - - - Qualifying CET1, Additional Tier 1 capital
instruments held by third parties - - - 439 Tier 1 Capital 9,201,309 3,337,259 442,576 12,733,817
The components of CET1 Capital, Additional Tier 1 Capital, Tier 2 Capital and Total Capital of the Group and its bankingsubsidiaries are as follows (Cont'd.):
The breakdown of the risk weighted assets ("RWA") in various categories of risk is as follows:
30.09.19
31.03.19
CAPITAL ADEQUACY (CONT'D.)
52

AMMB Holdings Berhad (223035-V)Condensed Financial Statements For The Second Quarter Ended 30 September 2019
A35.
(b)
AmBank AmInvestmentAmBank Islamic Bank GroupRM'000 RM'000 RM'000 RM'000
Tier 2 CapitalTier 2 Capital instruments meeting all relevant
criteria for inclusion 2,595,000 1,150,000 - - Qualifying CET1, Additional Tier 1 and Tier 2
capital instruments held by third parties - - - 2,476,745 General provisions* 840,495 334,015 4,684 1,175,912 Tier 2 Capital 3,435,495 1,484,015 4,684 3,652,657
Total Capital 12,636,804 4,821,274 447,260 16,386,474
The breakdown of the risk weighted assets ("RWA") in various categories of risk is as follows:
Credit RWA 67,239,575 28,526,091 732,342 94,407,762 Less: Credit RWA absorbed by Profit
Sharing Investment Account - (1,804,893) - (334,809) Total Credit RWA 67,239,575 26,721,198 732,342 94,072,953 Market RWA 2,358,358 475,926 28,644 2,807,287 Operational RWA 4,037,878 1,439,025 251,510 5,880,399 Large exposure risk RWA for equity holdings 531,402 - - 531,792 Total RWA 74,167,213 28,636,149 1,012,496 103,292,431
A36.
30.09.19 31.03.19RM'000 RM'000
Outstanding credit exposures with connected parties 3,107,454 2,299,375 Percentage of outstanding credit exposures to connected parties - as a proportion of total credit exposures 2.66 1.98 - which is non-performing or in default 0.004 0.010
Group
The disclosure on Credit Transaction and Exposures with Connected Parties above is presented in accordance with para 9.1 ofBank Negara Malaysia's revised Guidelines on Credit Transactions and Exposures with Connected Parties.
CREDIT EXPOSURE ARISING FROM CREDIT TRANSACTIONS WITH CONNECTED PARTIES
CAPITAL ADEQUACY (CONT'D.)
The components of CET1 Capital, Additional Tier 1 Capital, Tier 2 Capital and Total Capital of the Group and its bankingsubsidiaries are as follows (Cont'd.):
31.03.19
53

AMMB Holdings Berhad (223035-V)Condensed Financial Statements For The Second Quarter Ended 30 September 2019
A37. INSURANCE BUSINESS
30.09.19 31.03.19 30.09.19 31.03.19RM'000 RM'000 RM'000 RM'000 RM'000 RM'000
ASSETSCash and short-term funds 144,851 245,368 202,987 70,496 347,838 315,865 Deposits and placements with banks
and other financial institutions 17,297 15,241 - - 17,297 15,241 Financial assets at fair value
through profit or loss 2,264,911 2,405,241 4,435,434 4,547,707 3,424,364 3,602,272 Loans and advances 781 904 - - 781 904 Deferred tax assets 25,177 25,778 - - 25,177 25,778 Investment in a subsidiary - - 1,808,733 1,908,733 - - Other assets 981,409 791,058 68,898 63,436 106,337 134,223 Reinsurance assets and other
insurance receivables 383,662 525,547 - - 383,662 525,547 Property and equipment 20,265 25,535 978 978 21,243 26,513 Right-of-use assets 24,822 - - - 24,822 - Intangible assets 52,139 55,180 64,846 66,867 895,911 900,973 Assets held for sale 1,458 5,029 - - 1,458 5,029 TOTAL ASSETS 3,916,772 4,094,881 6,581,876 6,658,217 5,248,890 5,552,345
LIABILITIES AND EQUITYRedeemable cumulative convertible
preference share - - 461,837 457,609 461,837 457,609 Deferred tax liabilities - - 66,523 70,187 66,523 70,186 Other liabilities 298,369 277,646 951,069 736,742 305,909 294,558 Insurance contract liabilities and
other insurance payables 2,397,823 2,693,249 - - 2,397,823 2,693,249 Total Liabilities 2,696,192 2,970,895 1,479,429 1,264,538 3,232,092 3,515,602
Share capital** - - 5,668,749 5,795,760 1,699,148 1,599,148 Reserves 1,220,580 1,123,986 (566,302) (402,081) 317,650 437,595 Equity attributable to equity holders of
the Company 1,220,580 1,123,986 5,102,447 5,393,679 2,016,798 2,036,743 3,916,772 4,094,881 6,581,876 6,658,217 5,248,890 5,552,345
** Comprising:Ordinary share capital 1,230,000 1,230,000 Preference share capital 169,148 169,148 Transfer from Retained Earnings arising from redemption of preference shares 300,000 200,000
1,699,148 1,599,148
Note:
30.09.19 31.03.19
TOTAL LIABILITIES AND EQUITY
* after elimination on consolidation
Shareholders' funds and Others comprise the results of AmGeneral Holdings Berhad and collective investment schemes of its insurance subsidiary.
AmGeneral Holdings Berhad and its subsidiary
(I) CONSOLIDATED STATEMENT OF FINANCIAL POSITION AS AT 30 SEPTEMBER 2019
General insurance fund
Shareholders' fund and Others Total*
54

AMMB Holdings Berhad (223035-V)Condensed Financial Statements For The Second Quarter Ended 30 September 2019
A37. INSURANCE BUSINESS (CONT'D.)
(II)
Group 30.09.19 30.09.18 30.09.19 30.09.18 30.09.19 30.09.18
Interest income 2,083 1,970 76,732 75,976 78,815 77,946 Interest expense - - (10,228) (9,916) (10,228) (9,916) Net interest income 2,083 1,970 66,504 66,060 68,587 68,030
706,177 679,223 - - 706,177 679,223
(480,177) (422,825) - - (480,177) (422,825)
business 226,000 256,398 - - 226,000 256,398 Other operating income 83,921 56,565 300,365 235,719 63,718 9,285 Net income 312,004 314,933 366,869 301,779 358,305 333,713 Other operating expenses (165,295) (163,244) (5,457) (5,690) (170,752) (168,934) Operating profit 146,709 151,689 361,412 296,089 187,553 164,779
Reinsurance assets and insurance receivables 3,532 2,543 - - 3,532 2,543
(3,855) (3,314) - - (3,855) (3,314) Profit before taxation 146,386 150,918 361,412 296,089 187,230 164,008 Taxation (49,792) (26,844) 12,618 (3,205) (37,174) (30,049) Profit for the financial period 96,594 124,074 374,030 292,884 150,056 133,959
* **
for impairment:
Includes commission paid/payable to related companies of the Group of RM7,698,000 (30 September 2018:RM6,352,000)
Other write-offs, net
after elimination on consolidation
Writeback of allowance
AmGeneral Holdings Berhad and its subsidiary
CONSOLIDATED STATEMENT OF PROFIT OR LOSS FOR THE FINANCIAL QUARTER ENDED 30 SEPTEMBER 2019
General insurance fund
Shareholders' fund and Others Total*
Income from insurance businessInsurance claims and
commissions**Net income from insurance
55

AMMB Holdings Berhad (223035-V)Condensed Financial Statements For The Second Quarter Ended 30 September 2019
A38. CHANGES IN ACCOUNTING POLICIES AND RESTATEMENT OF COMPARATIVE INFORMATION
Adoption of MFRS 16 Leases
1. The adoption of MFRS 16 resulted in the following financial effects:
(a) Impacted line items in the statement of financial position of the financial statements of the Group:
Effects ofadoption of
31.03.19 MFRS 16 01.04.19RM'000 RM'000 RM'000
ASSETSRight-of-use assets - 303,547 303,547
LIABILITIES AND EQUITYOther liabilities* 3,476,588 303,547 3,780,135
* includes provision for reinstatement costs
(b) Capital Adequacy Ratios Effects of
adoption of31.03.19 MFRS 16 01.04.19
RM'000CET1 capital 12,733,378 - 12,733,378 Tier 1 capital 12,733,817 - 12,733,817 Total capital 16,386,474 3,449 16,389,923
Risk-weighted assets 103,292,431 275,940 103,568,371
Before deducting proposed dividendCET1 capital ratio (%) 12.328% -0.033% 12.295%Tier 1 capital ratio (%) 12.328% -0.033% 12.295%Total capital ratio (%) 15.864% -0.039% 15.825%
After deducting proposed dividendCET1 capital ratio (%) 11.890% -0.032% 11.858%Tier 1 capital ratio (%) 11.890% -0.031% 11.859%Total capital ratio (%) 15.426% -0.037% 15.389%
2. During the current financial period, the Group conducted a review of the reporting of its impaired loans, advances andfinancing portfolio. The review did not result in any changes to impaired loans, advances and financing balances orimpairment allowances for loans, advances and financing except for certain amendments in disclosure of impaired loans,advances and financing by sector as at 31 March 2019 as reflected in the restated disclosure in Note A13(h).
56

AMMB Holdings Berhad (223035-V)Condensed Financial Statements For The Second Quarter Ended 30 September 2019
A39. OPERATIONS OF ISLAMIC BANKING
UNAUDITED CONSOLIDATED STATEMENT OF FINANCIAL POSITIONAS AT 30 SEPTEMBER 2019
30.09.19 31.03.19Note RM'000 RM'000
ASSETSCash and short-term funds 233,410 1,568,699 Derivative financial assets 41,085 43,136 Financial assets at fair value through profit or loss 2,462,199 5,113,974 Financial investments at fair value through other comprehensive income 4,389,503 3,492,140 Financial investments at amortised cost 1,684,776 1,705,455 Financing and advances (a) 29,313,548 28,922,092 Statutory deposit with Bank Negara Malaysia 968,000 970,000 Deferred tax assets 246 240 Other assets 485,799 443,210 Right-of-use assets 227 - Property and equipment 520 580 Intangible assets 1,190 1,351 TOTAL ASSETS 39,580,503 42,260,877
Deposits from customers (b) 29,520,220 31,139,936 Investment accounts of customers (c) 189,588 353,451 Deposits and placements of banks and other financial institutions 1,879,021 2,536,724 Investment account due to a licensed bank (d) 1,348,341 1,465,539 Recourse obligation on financing sold to Cagamas Berhad 400,000 518,350 Derivative financial liabilities 58,226 55,519 Term funding 1,034,662 1,080,000 Subordinated Sukuk 1,150,000 1,150,000 Deferred tax liabilities 21,867 7,511 Other liabilities (e) 306,950 330,069
35,908,875 38,637,099
Share capital/Capital funds 1,417,107 1,417,107 Reserves 2,254,521 2,206,671 TOTAL ISLAMIC BANKING FUNDS 3,671,628 3,623,778
39,580,503 42,260,877
14,311,508 11,593,921
TOTAL LIABILITIES AND ISLAMIC BANKING FUNDS
COMMITMENTS AND CONTINGENCIES
LIABILITIES AND ISLAMIC BANKING FUNDS
TOTAL LIABILITIES
Group
57

AMMB Holdings Berhad (223035-V)Condensed Financial Statements For The Second Quarter Ended 30 September 2019
A39. OPERATIONS OF ISLAMIC BANKING (CONT'D.)
UNAUDITED CONSOLIDATED STATEMENT OF PROFIT OR LOSSFOR THE FINANCIAL QUARTER ENDED 30 SEPTEMBER 2019
30.09.19 30.09.18 30.09.19 30.09.18RM'000 RM'000 RM'000 RM'000
Income derived from investment of depositors' funds 437,366 437,370 889,832 851,929 Income derived from investment of investment account funds 19,690 26,198 39,762 57,469 Income derived from Islamic Banking Funds 49,994 45,538 97,819 94,661 Allowance on financing and advances (25,600) (51,908) (56,969) (75,624) Writeback of allowance/(Allowance) on:
-Financial investments 2,012 (1,440) 2,683 (1,906) -Other financial assets - (452) 3 (452)
Provision for commitments and contingencies-charge/(writeback) 2,309 278 1,831 (2,010)
Total distributable income 485,771 455,584 974,961 924,067 Income attributable to the depositors and others (245,019) (256,021) (504,956) (495,786) Income attributable to the investment account holders (16,948) (23,298) (35,741) (48,484) Total net income 223,804 176,265 434,264 379,797 Operating expenses (74,930) (68,556) (150,418) (155,086) Finance costs (25,986) (24,343) (51,690) (48,422) Profit before zakat and taxation 122,888 83,366 232,156 176,289 Zakat and taxation (26,622) (18,531) (50,904) (38,957) Profit for the financial period 96,266 64,835 181,252 137,332
UNAUDITED CONSOLIDATED STATEMENT OF COMPREHENSIVE INCOMEFOR THE FINANCIAL QUARTER ENDED 30 SEPTEMBER 2019
30.09.19 30.09.18 30.09.19 30.09.18RM'000 RM'000 RM'000 RM'000
Profit for the financial period 96,266 64,835 181,252 137,332
Other comprehensive income/(loss):
Items that may be reclassified subsequently to profit or loss
Financial investments at fair value through other comprehensive income: - net unrealised gain/(loss) for changes in fair value 24,426 17,141 50,226 3,619 - expected credit loss (1,966) 1,367 (2,606) 1,822 - net (gain)/loss reclassified to profit or loss (4,669) - (7,665) 1 - income tax effect (4,742) (4,114) (10,215) (869) Other comprehensive income for the financial
period, net of tax 13,049 14,394 29,740 4,573 Total comprehensive income for the financial period 109,315 79,229 210,992 141,905
Group
Individual Quarter Cumulative QuarterGroup
Cumulative QuarterIndividual Quarter
58

AMMB Holdings Berhad (223035-V)Condensed Financial Statements For The Second Quarter Ended 30 September 2019
A39. OPERATIONS OF ISLAMIC BANKING (CONT'D.)
UNAUDITED CONSOLIDATED STATEMENT OF CHANGES IN EQUITYFOR THE FINANCIAL QUARTER ENDED 30 September 2019
Distributable
Share Available-capital/ Regulatory for sale Fair value Retained Total
Group Capital funds reserve deficit reserve earnings EquityRM'000 RM'000 RM'000 RM'000 RM'000 RM'000
At 1 April 2018- as previously stated 1,417,107 327,683 (5,492) - 1,838,734 3,578,032 - effects of adopting MFRS 9 at 1 April 2018 - (162,530) 5,492 15,535 38,894 (102,609) Restated balance at 1 April 2018 1,417,107 165,153 - 15,535 1,877,628 3,475,423
Profit for the financial period - - - - 137,332 137,332 Other comprehensive income, net - - - 4,573 - 4,573 Total comprehensive income for the financial period - - - 4,573 137,332 141,905
Transfer to retained earnings - (1,966) - - 1,966 - Transfer of ESS shares recharged - difference on purchase price of shares vested - - - - (70) (70)
- (1,966) - - 1,896 (70)
At 30 September 2018 1,417,107 163,187 - 20,108 2,016,856 3,617,258
At 1 April 2019 1,417,107 164,928 - 39,151 2,002,592 3,623,778
Profit for the financial period - - - - 181,252 181,252 Other comprehensive income, net - - - 29,740 - 29,740 Total comprehensive income for the financial period - - - 29,740 181,252 210,992
Transfer to regulatory reserve - 63,512 - - (63,512) - Dividend on ordinary shares - - - (163,142) (163,142)
- 63,512 - - (226,654) (163,142)
At 30 September 2019 1,417,107 228,440 - 68,891 1,957,190 3,671,628
Non-Distributable
59

AMMB Holdings Berhad (223035-V)Condensed Financial Statements For The Second Quarter Ended 30 September 2019
A39. OPERATIONS OF ISLAMIC BANKING (CONT'D.)
(a) Financing and Advances
Financing and advances by type and Shariah contracts are as follows:
Bai' Bithaman Musharakah Al-Ijarah ThummahGroup Ajil Murabahah Mutanaqisah Al-Bai' (AITAB) Bai' Al-Inah Others Total30.09.19 RM'000 RM'000 RM'000 RM'000 RM'000 RM'000 RM'000
At amortised cost:Cash lines - 499,741 - - 984,572 - 1,484,313 Term financing 708,147 6,934,985 9,915 - 2,019,630 52,579 9,725,256 Revolving credit 42,073 3,131,103 - - 1,535,462 - 4,708,638 Housing financing 2,892,828 3,841,845 47,804 - - - 6,782,477 Hire purchase receivables 4 - - 4,313,946 - - 4,313,950 Bills receivables - 128,405 - - - 37,522 165,927 Credit card receivables - - - - - 533,335 533,335 Trust receipts - 173,124 - - - - 173,124 Claims on customers under
acceptance credits - 1,546,201 - - - 255,546 1,801,747 Staff financing - 1,617 - - - - 1,617 Gross financing and advances* 3,643,052 16,257,021 57,719 4,313,946 4,539,664 878,982 29,690,384 Allowance for impairment on
financing and advances- Stage 1 - 12 months ECL (76,774)
- Stage 2 - Lifetime ECL not credit impaired (174,384) - Stage 3 - Lifetime ECL credit impaired (125,678) Net financing and advances 29,313,548
60

AMMB Holdings Berhad (223035-V)Condensed Financial Statements For The Second Quarter Ended 30 September 2019
A39. OPERATIONS OF ISLAMIC BANKING (CONT'D.)
(a) Financing and Advances (Cont'd.)
Financing and advances by type and Shariah contracts are as follows (Cont'd.):
Bai' Bithaman Musharakah Al-Ijarah ThummahGroup Ajil Murabahah Mutanaqisah Al-Bai' (AITAB) Bai' Al-Inah Others Total31.03.19 RM'000 RM'000 RM'000 RM'000 RM'000 RM'000 RM'000
At amortised cost:Cash lines - 426,594 - - 1,050,183 - 1,476,777 Term financing 805,258 5,816,040 10,130 - 2,419,348 56,637 9,107,413 Revolving credit 42,075 3,478,539 - - 1,592,275 - 5,112,889 Housing financing 2,970,696 3,235,311 49,022 - - - 6,255,029 Hire purchase receivables 4 - - 4,618,823 - - 4,618,827 Bills receivables - 88,416 - - - 15,992 104,408 Credit card receivables - - - - - 533,122 533,122 Trust receipts - 324,347 - - - - 324,347 Claims on customers under
acceptance credits - 1,558,829 - - - 236,875 1,795,704 Staff financing - 1,197 - - - - 1,197 Gross financing and advances* 3,818,033 14,929,273 59,152 4,618,823 5,061,806 842,626 29,329,713 Allowance for impairment on
financing and advances- Stage 1 - 12 months ECL (80,362)
- Stage 2 - Lifetime ECL not credit impaired (204,632) - Stage 3 - Lifetime ECL credit impaired (122,627) Net financing and advances 28,922,092
* Included in financing and advances are exposures to the Restricted Investment Account ("RA") arrangements between AmBank Islamic and AmBank. Under the RA contract, the profit isshared based on a pre-agreed ratio. AmBank is exposed to the risks and rewards on the RIA financing and it had accounted for all allowance for impairment arising from the RA financing.
61

AMMB Holdings Berhad (223035-V)Condensed Financial Statements For The Second Quarter Ended 30 September 2019
A39. OPERATIONS OF ISLAMIC BANKING (CONT'D.)
(a) Financing and Advances (Cont'd.)
(i) Movements in impaired financing and advances are as follows:
30.09.19 31.03.19RM'000 RM'000
Balance at beginning of the financial year 572,549 582,538 Additions during the financial period/year 230,152 376,962 Reclassified to non-impaired financing (40,996) (131,055) Recoveries (21,761) (27,839) Amount written off (134,686) (228,057) Balance at end of the financial period/year 605,258 572,549
Gross impaired financing and advances as % of total gross financing and advances (including Islamic financing sold to Cagamas Berhad) 2.04% 1.95%
Financing loss coverage (including regulatory reserve) 102.7% 103.2%
(ii) Movements in allowances for ECL are as follows:
Group Stage 2 Stage 330.09.19 Stage 1 Lifetime ECL Lifetime ECL
12-month Not Credit CreditECL Impaired Impaired Total
RM'000 RM'000 RM'000 RM'000
Balance at beginning of the financial year 80,362 204,632 122,627 407,621 (Writeback) of/allowances for ECL during the period: (3,589) (30,248) 137,737 103,900 - Transfer to 12 month ECL (Stage 1) 3,727 (27,551) (1,250) (25,074) - Transfer to Lifetime ECL not credit impaired
(Stage 2) (10,087) 51,168 (11,426) 29,655 -Transfer to Lifetime ECL credit impaired (Stage 3) (789) (8,274) 32,820 23,757 New financial assets originated 19,796 8,480 137 28,413 Net remeasurement of allowances Note 1 (10,832) (41,028) 140,659 88,799 Changes to model assumptions and methodologies 3,109 (1,170) 378 2,317 Modification of contractual cash flows
of financial assets (59) 38 - (21) Financial assets derecognised (8,454) (11,911) (23,581) (43,946) Foreign exchange differences 1 - - 1 Amount written-off - - (134,686) (134,686) Balance at end of the financial period* Note 2 76,774 174,384 125,678 376,836
Note:
1
2
Group
As at 30 September 2019, the gross exposure (including profit receivable) relating to RA financing amounted toRM1,352.3 million (31 March 2019: RM1,470.1 million). ECL allowance for the RA financing which amounted to RM1.0million (31 March 2019: RM3.7 million) is taken up by AmBank.
Included ECL previously taken up by AmBank transferred in arising from early redemption of investment accountcontracts by AmBank which amounted to RM2.5 million (31 March 2019:RM3.7 million).
62

AMMB Holdings Berhad (223035-V)Condensed Financial Statements For The Second Quarter Ended 30 September 2019
A39. OPERATIONS OF ISLAMIC BANKING (CONT'D.)
(a) Financing and Advances (Cont'd.)
(ii) Movements in allowances for ECL are as follows (Cont'd.):
Group Stage 2 Stage 331.03.19 Stage 1 Lifetime ECL Lifetime ECL
12-month Not Credit CreditECL Impaired Impaired Total
RM'000 RM'000 RM'000 RM'000
Balance at beginning of financial year- as previously stated - - - 258,586 - effects of adoption of MFRS 9 - - - 143,964 Restated balance at beginning of the financial year 72,384 204,922 125,244 402,550 (Writeback) of/allowances for ECL during the year: 7,974 (290) 225,440 233,124 - Transfer to 12 month ECL (Stage 1) 3,319 (33,489) (2,064) (32,234) - Transfer to Lifetime ECL not credit impaired
(Stage 2) (7,165) 55,244 (8,080) 39,999 - Transfer to Lifetime ECL credit impaired (Stage 3) (939) (8,674) 85,704 76,091 New financial assets originated 22,540 67,790 5,309 95,639 Net remeasurement of allowances Note 1 (27) (61,345) 172,865 111,493 Modification of contractual cash flows of financial assets (30) 37 - 7 Financial assets derecognised (9,724) (19,853) (28,294) (57,871) Foreign exchange differences 4 - - 4 Amount written-off - - (228,057) (228,057) Balance at end of the financial year* 80,362 204,632 122,627 407,621
(b) Deposits From Customers
30.09.19 31.03.19RM'000 RM'000
By type of deposit:Savings deposits
Commodity Murabahah 2,035,336 2,002,816 Qard 74,720 15,041
Demand depositsCommodity Murabahah 5,711,974 6,935,337 Qard 598,528 15,375
Term depositsCommodity Murabahah 20,917,259 20,771,281 Qard 182,403 402,099
Negotiable instruments of depositsBai' Bithaman Ajil - 997,987
29,520,220 31,139,936
The deposits are sourced from the following types of customers:
30.09.19 31.03.19RM'000 RM'000
Business enterprises 16,100,190 15,833,377 Government and statutory bodies 3,078,335 4,030,053 Individuals 9,598,214 10,223,309 Others 743,481 1,053,197
29,520,220 31,139,936
Group
Group
63

AMMB Holdings Berhad (223035-V)Condensed Financial Statements For The Second Quarter Ended 30 September 2019
A39. OPERATIONS OF ISLAMIC BANKING (CONT'D.)
(b) Deposits From Customers (Cont'd.)
The maturity structure of term deposits and negotiable instruments of deposits are as follows:
30.09.19 31.03.19RM'000 RM'000
Due within six months 18,050,362 16,032,555 Over six months to one year 1,935,658 4,994,369 Over one year to three years 979,900 602,241 Over three years to five years 133,742 542,202
21,099,662 22,171,367
(c) Investment Accounts Of Customers
30.09.19 31.03.19RM'000 RM'000
Unrestricted investment accounts: Without maturity - Wakalah 17,809 18,643 With maturity - Mudarabah 171,779 334,808
189,588 353,451
The investment accounts are sourced from the following types of customers:
30.09.19 31.03.19RM'000 RM'000
Business enterprises 152,628 335,052 Individuals 36,960 18,399
189,588 353,451
30.09.19 31.03.19RM'000 RM'000
Investment asset:Interbank placement (Wakalah) 17,809 18,643 Housing financing (Mudarabah) 171,779 334,808 Total investment 189,588 353,451
AverageAverage Performance
profit sharing Average rate incentiveratio of return fee
(%) (%) (%)
30.09.19Maturity
less than 3 months 77.20 3.21 3.07 over 3 months to 1 year 85.82 3.94 -
31.03.19Maturity
less than 3 months 79.16 2.98 3.25 over 3 months to 1 year 87.59 4.04 -
Investment account holder
Group
Average Rate of Return and Average Performance Incentive Fee for the investment accounts are as follows:
Group
Group
Group
64

AMMB Holdings Berhad (223035-V)Condensed Financial Statements For The Second Quarter Ended 30 September 2019
A39. OPERATIONS OF ISLAMIC BANKING (CONT'D.)
(d) Investment Account Due to A Licensed Bank
30.09.19 31.03.19RM'000 RM'000
Restricted investment account- Mudarabah Muqayyadah 1,348,341 1,465,539
Investment asset:Financing 1,348,341 1,465,539 Total investment 1,348,341 1,465,539
Profit sharing Average rate Profit sharing Average rateratio of return ratio of return(%) (%) (%) (%)
Maturity:over 1 year to 2 years - - 46 2.36 over 2 years to 5 years 89 4.19 90 4.62 more than 5 years 90 3.92 77 3.86
(e) Other Liabilities
30.09.19 31.03.19RM'000 RM'000
Other payables and accruals 253,554 270,183 Deferred income 14,934 14,566 Lease liabilities 204 - Provision for reinstatement for leased properties 30 - Provision for zakat and taxation 8,369 6,016 Provision for commitments and contingencies 5,500 15,724 Allowances for expected credit loss on financing commitments and
financial guarantees 16,396 18,230 Advance rental 7,963 5,350
306,950 330,069
Group
30.09.19 31.03.19
Group
The RA is a contract based on the Shariah concept of Mudarabah between two parties, that is, capital provider andentrepreneur to finance a business venture where the business venture is managed solely by AmBank Islamic as theentrepreneur. The profit of the business venture is shared between both parties based on a pre-agreed ratio. Losses shallbe borne solely by the capital provider. The capital provider for the RA contracts is AmBank, a related company.
As at 30 September 2019, the tenure of the RA contracts is for a period ranging between 2 months to 10 years (31 March2019: 8 months to 11 years).
Profit Sharing Ratio and Average Rate of Return for the investment account based on original contractual maturity are asfollows:
During the current financial quarter, AmBank early redeemed a contract on 27 August 2019 which amounted to RM188.2million. The expected credit losses on the financing funded by this contract is now taken up in AmBank Islamic asdisclosed in Note A39(a)(ii).
65

AMMB Holdings Berhad (223035-V)Condensed Financial Statements For The Second Quarter Ended 30 September 2019
B1. PERFORMANCE REVIEW ON THE RESULTS OF THE GROUP
Table 1: Financial review for current quarter and financial year to date
Financial year to date - Cumulative period ended 30 September 2019 compared to 30 September 2018
Fee based income recorded an increase of RM20.4 million. Market based income increased from gains on trading/liquidation ofsecurities and revaluation of trading securities offset by decrease in gain from trading in foreign exchange. Decrease in otherincome was attributable to a significant gain on disposal of foreclosed property in prior period.
Net income from insurance business decreased mainly due to higher commission expense and insurance claims despiteincrease in net earned premium.
The Group's share of profits from associates and joint ventures reduced mainly due to the insurance-based joint ventures whichrecorded higher reserving mitigated by higher investment and trading income from revaluation of securities.
Part B - Explanatory Notes Pursuant to Appendix 9B of the Bursa Malaysia Securities Berhad Listing Requirements
Funding costs increased for securities sold under repurchase agreements, customer deposits and financial institutions due to theincrease in average balances. Net interest margin ("NIM") declined to 1.89% compared to 1.97% for the corresponding periodlast year.
Interest income from securities grew mainly from trading and hold to collect and sell securities. Interest income from customerlending increased from term loans, trade financing and mortgages offset by reduction from hire purchase.
Profit before taxation and zakat for the current financial period was higher compared to a year ago at RM1,002.1 million, anincrease of RM17.6 million (1.8%). Profit for the financial period increased by RM23.0 million to RM784.7 million compared tosame period last year.
Credit costs recorded a higher charge for this financial period, attributable to lower recoveries from loans, advances andfinancing and higher impairment allowance on securities.
Total operating expenses increased by 3.6% compared to same period last year. Personnel expenses increased due to sharebased payment expenses compared to a writeback same period last year, higher salaries, allowances and bonus and trainingexpenses. General and administrative expenses were controlled with a reduction of 11.5% in expenses. Overall, the Group's cost to income ratio improved to 49.4% from 50.4% a year ago.
For the financial period under review, the Group generated revenue of RM4,739.7 million, a growth of RM254.5 million (5.7%)compared to same period last year. Fund based income from interest bearing assets increased mainly from interest on fixedincome securities and customer lending. Non-interest income recorded substantial increase compared to same period last year.
30.09.19 30.09.18 Amount % 30.09.19 30.09.18 Amount %RM'000 RM'000 RM'000 RM'000 RM'000 RM'000
Operating revenue 2,349,315 2,313,966 35,349 1.5 4,739,717 4,485,257 254,460 5.7 Operating profit
before impairment losses 542,670 501,612 41,058 8.2 1,078,675 1,002,440 76,235 7.6
Profit before taxation and zakat 433,588 490,657 (57,069) (11.6) 1,002,050 984,498 17,552 1.8
Profit for thefinancial period 353,097 378,456 (25,359) (6.7) 784,687 761,712 22,975 3.0
Profit attributable to equity holders of the Company 319,568 348,153 (28,585) (8.2) 711,027 695,747 15,280 2.2
Group GroupIndividual Quarter Changes Cumulative Quarter Changes
66

AMMB Holdings Berhad (223035-V)Condensed Financial Statements For The Second Quarter Ended 30 September 2019
B1. PERFORMANCE REVIEW ON THE RESULTS OF THE GROUP (CONT'D.)
Commentary on key components of financial position
Liquidity and capital strength
Retail Banking (Year to date ("YTD") FY2020: RM205.6 million vs YTD FY2019: RM247.7 million)
Business Banking (YTD FY2020: RM63.0 million vs YTD FY2019: RM87.8 million)
Corporate Banking (YTD FY2020: RM352.7 million vs YTD FY2019: RM383.6 million)
Investment Banking (YTD FY2020: RM25.9 million vs YTD FY2019: RM24.8 million)
The Group's core interest bearing assets namely loans, advances and financing recorded a growth in gross balances byRM132.4 million from 31 March 2019 to RM102.0 billion. The Group's impaired loans ratio was at 1.8%.
Deposits from customers was lower compared to 31 March 2019 at RM102.7 billion. Low cost deposits constituted 22.8% of totaldeposits from customers, a decrease compared to 23.3% as at 31 March 2019.
Higher net impairment mainly on loans, advances and financing due to lower recoveries post debt sale, coupled with lowerwriteback from provision for commitments and contingencies.
PBT decreased by RM24.8 million due higher other operating expense and net impairment, offset by higher net income.
Net income increased by RM117.9 million driven by higher net finance income due to higher margin and volume, along withhigher other income mainly from gain on disposal of money market securities and bonds.
The Group is well-positioned to meet and comply with regulatory requirements. Its banking subsidiaries recorded LiquidityCoverage ratios in excess of minimum requirements. The Group's capital adequacy ratio is strong at 16.05% at the end of thereporting period.
Divisional performance
Retail deposits dropped by 13.1% to RM47.1 billion attributed to lower fixed deposits, while gross loans, advances and financinggrew RM1.1 billion to close at RM57.6 billion mainly from mortgages and Retail SME.
Corporate Banking deposits increased by 2.3% to close at RM9.7 billion, while gross loans, advances and financing dropped by2.5% to close at RM32.5 billion.
Higher other operating expense mainly due to higher service transfer pricing and personnel costs. Higher net impairment mainlyon loans, advances and financing and lower recoveries, while higher net income arising from higher business volume.
Profit before tax ("PBT") decreased by RM42.1 million due to higher other operating expenses and higher net impairment, offsetby higher income.
Net income increased mainly due higher net finance income from higher volume impact, partially offset by lower fee incomefrom Retail SME and Cards.
Net income decreased by 6.6% mainly arising from gain on disposal of foreclosed property in YTD FY2019, coupled with lowernet finance income from lower volume.
PBT grew RM120.8 million from higher net income and higher writeback of impairment.
PBT increased by RM1.1 million from higher advisory fees, partly offset by higher other operating expenses and lower writebackof impairment on loans, advances and financing.
PBT decreased by RM30.9 million from lower net income and higher other operating expense, offset by higher writeback ofimpairment and recoveries.
Business Banking deposits increased by 21.4% to RM6.2 billion from both fixed deposits and current accounts, while grossloans, advances and financing grew by RM1.8 billion to close at RM10.4 billion.
Group Treasury and Markets (YTD FY2020: RM197.9 million vs YTD FY2019: RM77.1 million)
67

AMMB Holdings Berhad (223035-V)Condensed Financial Statements For The Second Quarter Ended 30 September 2019
B1.
Fund Management (YTD FY2020: RM22.1 million vs YTD FY2019: RM17.9 million)
Insurance (YTD FY2020: RM187.8 million vs YTD FY2020: RM187.1 million)
Group Funding & Others (YTD FY2020: Loss of RM53.0 million vs YTD FY2019: Loss of RM36.1 million)
B2.
Table 2: Financial review for current quarter compared with immediate preceding quarter
Current quarter compared to immediate preceding quarter
PERFORMANCE REVIEW ON THE RESULTS OF THE GROUP (CONT'D.)
For the financial quarter under review, the Group generated revenue of RM2,349.3 million, a decrease of 1.7% over last quarter.Fund based income from interest bearing assets decreased mainly fom interest on customer lending and interest income onsecurities. Non-interest income increased driven by increase in trading and investment income.
Insurance PBT increased by 3.4% mainly driven by higher investment income, partially offset by lower premium and higher otheroperating expenses.
Credit costs increased attributable to higher impairment allowances for loans, advances and financing mitigated by higherrecoveries from loans, advances and financing.
Higher loss before tax attributed to lower net income and higher other operating expenses, partially offset by writeback ofimpairment.
Total operating expenses decreased marginally by 0.4% compared to preceding quarter.
REVIEW OF MATERIAL CHANGES IN PROFIT BEFORE TAXATION
Divisional performance (Cont'd.)
Funding costs decreased attributable to lower interest on deposits from customers offset by increase in interest for deposits andplacements from banks and other financial institutions. For this quarter, net interest margin improved to 1.91% compared to1.87% in the preceding quarter.
Against the preceding quarter, profit before taxation and zakat for the current quarter is lower at RM433.6 million, a decrease ofRM134.9 million (23.7%). Profit for the quarter decreased by RM78.5 million to RM353.1 million compared to preceding quarter.
Overall other operating income increased for this quarter compared to preceding quarter driven by increase in gains fromdisposal of securities, lower loss on derivatives offset by lower gains on revaluation of securities.
PBT increased by RM4.2 million from higher management fee, offset by higher other operating expenses.
30.09.19 30.06.19 Amount %RM'000 RM'000 RM'000
Operating revenue 2,349,315 2,390,402 (41,087) (1.7) Operating profit before impairment losses 542,670 536,005 6,665 1.2 Profit before taxation and zakat 433,588 568,462 (134,874) (23.7) Profit for the financial quarter 353,097 431,590 (78,493) (18.2) Profit attributable to equity holders of the Company 319,568 391,459 (71,891) (18.4)
GroupIndividual Quarter Changes
68

AMMB Holdings Berhad (223035-V)Condensed Financial Statements For The Second Quarter Ended 30 September 2019
B3.
For FY2020, our financial priorities will be centred on the following:
1.
2.
3.
4.
The Gross Domestic Products ("GDP") grew in 3Q2019 by 4.4% year-on-year ("y/y") from a strong 4.9% y/y supported by privateconsumption which continued to report a credible growth of 7.0% y/y from 7.8% y/y in 2Q2019 on the back of sustained incomegrowth. Services and manufacturing sectors continued to grow by 5.9% y/y and 3.6% y/y. For the full year of 2019, GDP is morelikely to stay around 4.5% with our global GDP projected at 3.0%. Outlook for 2020 will continued to be influenced by externalchallenges and domestic activities. With our base case global GDP growth projected at 2.8%, the local economy should growaround 4.3% in 2020. Downside risk on global GDP and also Malaysia’s growth remains.
Digital Banking: We aim to provide digital solutions that seamlessly integrate into and improve customers' day-to-daylives. Our digital transformation investment plan in FY2020 will continue to pave way for the digitalisation of our productsand solutions, focus on enhancing digital mobile platform, building infrastructure and application programming interfacereadiness, partnerships with key financial technology players and the use of big data analytics to capture alternativesources of business and drive internal efficiencies.
Business efficiency transformation (BET 300): Moving into the third year of our BET300 programme, we will continue tomaintain a tight rein on cost and pacing our investments while driving operational efficiencies through digitalisation andstreamlining of processes.
Capital accretive growth: We aim to further strengthen our capital position and deliver sustainable dividend payout to ourshareholders, focusing on managing returns on capital employed and risk-weighted assets.
Banks have sufficient liquid assets with an industry liquidity coverage ratio of 144% as at end of September 2019, well above theregulatory requirement of 100.0%. Funding profiles of banks have been well diversified with the industry's loan-to-fund ratio andloan-to-fund and equity ratio standing at 82.9% and 72.5% respectively as at September 2019.
Inflation grew 0.6% on average for the first nine months of the year with core inflation for the same period being flat. Upside toinflation remains weak in view of low demand driven pressures added with limited cost driven impact. For the full year of 2019,inflation is likely to hover around 0.8-0.9% while in 2020 it could reach 2.0% partly due to low base impact.
In 2018, the banking system's loans expanded by 7.7%. For 2019, loans is projected to grow around 4.6% based on our viewthat GDP will continue to expand by 4.5%.
PROSPECTS FOR FINANCIAL YEAR ENDING 31 MARCH 2021
Revenue growth: We will continue to drive our income growth momentum, in line with our key segments and productsstrategies, especially in the areas of transaction banking, foreign exchange, SME and wealth management.
On the Overnight Policy Rate ("OPR") outlook, BNM is expected to maintain the 3.00% throughout 2019. However, following thesurprise Statutory Reserve Requirement cut by 50bps to 3.00%, added with a slower 3Q2019 GDP of 4.4%, it now points to anincreasing chance for a OPR cut end January 2020 by 25bps from the current 3.00%. BNM's decision will remain data-dependent.
69

AMMB Holdings Berhad (223035-V)Condensed Financial Statements For The Second Quarter Ended 30 September 2019
B4.
This is not applicable to the Group.
B5. TAXATION AND ZAKAT
30.09.19 30.09.18 30.09.19 30.09.18RM'000 RM'000 RM'000 RM'000
Estimated current tax payable 81,797 118,089 174,422 176,585 Deferred tax (2,013) (6,499) 41,517 50,600
79,784 111,590 215,939 227,185 Over provision of current taxation in
respect of prior years - (29) - (5,679) Taxation 79,784 111,561 215,939 221,506 Zakat 707 640 1,424 1,280 Taxation and zakat 80,491 112,201 217,363 222,786
B6. CORPORATE PROPOSALS
1.
2.
Individual Quarter Cumulative Quarter
As at 30 September 2019, the trustee of the ESS held 4,951,750 ordinary shares (net of ESS shares vested toemployees) representing 0.16% of the total number of issued and paid-up ordinary shares capital of the Company. Theseshares are held at a carrying amount of RM31,482,900.
The total tax charge of the Group for the financial period ended 30 September 2019 reflects an effective tax rate which is lowerthan the statutory tax rate mainly due to income not subject to tax. The total tax charge of the Group for the financial periodended 30 September 2018 reflects an effective tax rate which is lower than the statutory tax rate mainly due to income notsubject to tax and overprovision of income tax.
On 8 July 2019, the Board of Directors of the Company announced that the Company intends to seek the approval of itsshareholders for the proposed authority for the Company to purchase up to three percent (3%) of the total number of itsissued shares at the general meeting of the Company scheduled on 31 July 2019. The ordinary resolution as set out inthe Notice of Extraordinary General Meeting of the Company held on 31 July 2019 was duly passed by way of poll.
Group
VARIANCE FROM PROFIT FORECAST AND SHORTFALL FROM PROFIT GUARANTEE
70

AMMB Holdings Berhad (223035-V)Condensed Financial Statements For The Second Quarter Ended 30 September 2019
B7. BORROWINGS AND DEBT SECURITIES
Group
Foreign RM Foreign RM Foreign RMdenomination denomination denomination denomination denomination denomination
USD'000 RM'000 USD'000 RM'000 USD'000 RM'00030.09.19UnsecuredTerm funding - 182,354 ^ - 1,833,210 - 2,015,564 Debt capital - 3,745,000 - - - 3,745,000 30.09.18Unsecured
- 2,519,613 ^ 400,000 2,330,015 400,000 4,849,628 Debt capital - 4,964,658 - - - 4,964,658
^
*
Weighted Net interest/average profit savings
Month of Note/ Nominal interest / per annum for Issuance/ Sukuk type value profit redemptionRedemption Entity and tenor RM'000 rate % RM'000October 2018 - Issuance AmBank Subordinated 500,000 4.88 -
Islamic Sukuk Tier 2 - 10 years
November 2018 - Issuance AmBank Subordinated 1,000,000 4.98 - Note Tier 2 - 10 years
December 2018 - Redemption The Company Senior Notes 500,000 4.50 22,500 - 7 years
December 2018 - Redemption AmBank Subordinated 400,000 5.20 20,800 Note Tier 2 - 10 years
February 2019 - Redemption AmBank Non-Innovative 200,000 9.00 18,000 Tier 1 capital- 10 years
February 2019 - Redemption AmBank Subordinated 200,000 5.07 10,140 Islamic Sukuk Tier 2
- 10 yearsMarch 2019 - Redemption AmBank Senior Notes 600,000 4.30 25,800
- 4 yearsMarch 2019 - Redemption AmBank Non-Innovative 300,000 9.00 27,000
Tier 1 capital- 10 years
March 2019 - Redemption AmBank Subordinated 150,000 5.05 7,575 Islamic Sukuk Tier 2
- 10 yearsJuly 2019 - Redemption AmBank Euro Medium 1,655 3.13 51,789
Term Notes- 5 years
August 2019 - Redemption AmBank Innovative 300,000 8.25 24,750 Tier 1 capital- 10 years
Included here an amount of RM1,654.6 million related to the USD400.0 million Medium Term Note outstanding as at 30September 2018 translated at exchange rate of 4.1365.
Borrowings denominated in foreign currencies have not been hedged to RM; AmBank’s US Dollar debts are maintained in theoriginating currency for purpose of funding the US Dollar balance sheet.
Term funding
Detailed explanations on the material changes to the borrowings (excluding structured deposits and Credit Linked Notes) anddebt securities as at the current year to-date compared with the corresponding period in the immediate preceding year:
remaining contractual maturity
Long term* Short term* Total
71

AMMB Holdings Berhad (223035-V)Condensed Financial Statements For The Second Quarter Ended 30 September 2019
B7. BORROWINGS AND DEBT SECURITIES (CONT'D.)
B8. MATERIAL LITIGATION
B9. DIVIDENDS
(i)
(ii)(iii)(iv)
B10. DERIVATIVE FINANCIAL INSTRUMENTS
Please refer to Note A33.
B11. EARNINGS PER SHARE (SEN)
(a) Basic/Diluted earnings per share
30.09.19 30.09.18 30.09.19 30.09.18
Net profit attributable to equity holders of the Company (RM'000) 319,568 348,153 711,027 695,747
Weighted average number of ordinary shares in issue ('000) 3,009,233 3,008,582 3,009,233 3,008,582
Basic/diluted earnings per share (Sen) 10.62 11.57 23.63 23.13
A proposed interim cash dividend of 6.0 Sen per share for the financial year ending 31 March 2020 has beenrecommended by the directors;
Cumulative Quarter
Previous corresponding period: 5.0 Sen;
In respect of ordinary share capital, entitlement to the dividend will be determined on the basis of the Record ofDepositors as at the close of business on the date to be determined and announced at a later date.
Payment date: To be determined and announced at a later date; and
The Group and the Company do not have any material litigation which would materially affect the financial position of the Groupand the Company. For other litigations, please refer to Note A32.
Individual Quarter
The basic/diluted earnings per share of the Group is calculated by dividing the net profit attributable to equity holders ofthe Company by the weighted average number of ordinary shares in issue during the financial quarter.
Net interestWeighted savings per
Month of Nominal average annum for Issuance/ Note type value interest redemptionRedemption Entity and tenor RM'000 rate % RM'000September 2019 - Redemption AmBank Innovative 185,000 8.25 15,263
Tier 1 capital- 10 years
Detailed explanations on the material changes to the borrowings and debt securities as at the current year to-date compared withthe corresponding period in the immediate preceding year (Cont'd.):
Borrowing and debt securities issued are for purposes of working capital, investment, enhancing capital position and othergeneral funding requirements of the Company and its banking subsidiaries.
72