ameu convention durban 16 october 2007 eskom universal access to electricity business plan anton...
TRANSCRIPT
AMEU Convention
Durban 16 October 2007
ESKOM UNIVERSAL ACCESS TO
ELECTRICITY BUSINESS PLAN
Anton Theron Peter Sebola
1. CONTENTS
Introduction
UAP Context
Methodology
Results
Critical Success Factors
Conclusion
2. INTRODUCTION
Our state president, in his state of the nation address in May 2004, set a target for all South Africans to have access to electricity by 2012.
Universal Access is not a new concept, been on government’s agenda since the 90’s.
However, in 2004 a committed timetable was officially extended to the nation.
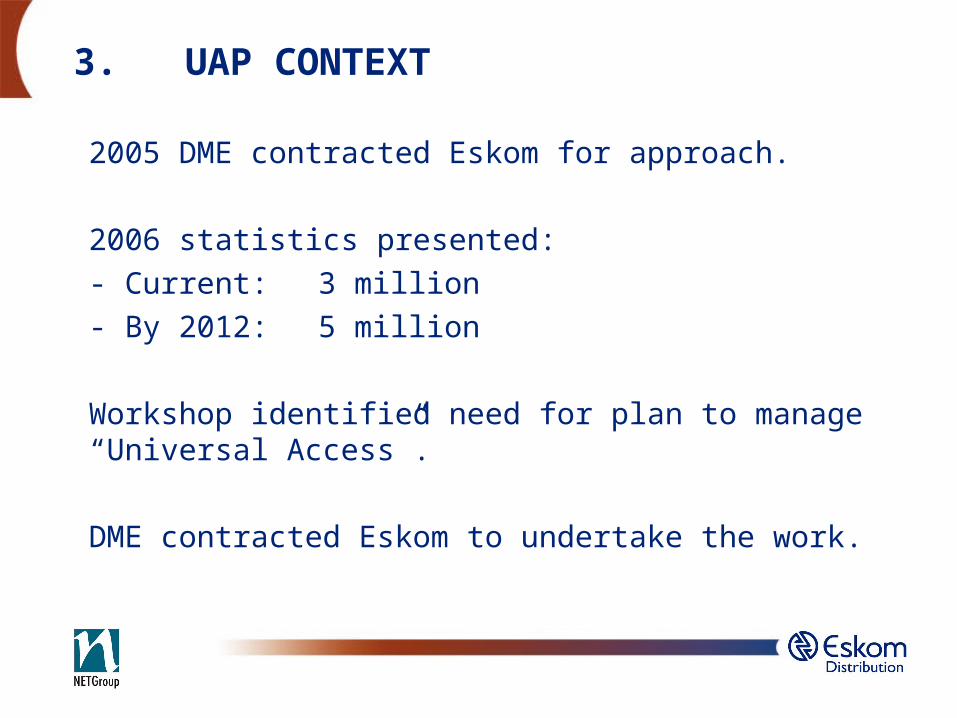
3. UAP CONTEXT
2005 DME contracted Eskom for approach.
2006 statistics presented:
- Current: 3 million
- By 2012: 5 million
Workshop identified need for plan to manage “Universal Access”.
DME contracted Eskom to undertake the work.
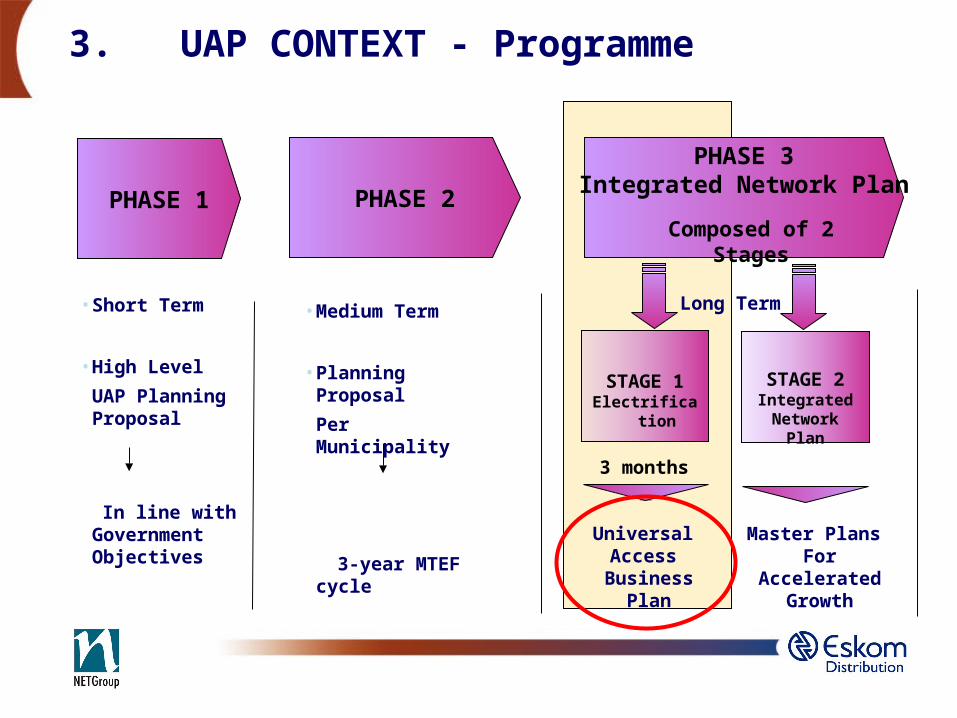
3. UAP CONTEXT - Programme
PHASE 1
• Medium Term
• Planning Proposal
Per Municipality
3-year MTEF cycle
PHASE 3Integrated Network Plan
PHASE 2
• Short Term
• High Level
UAP Planning Proposal
In line with Government Objectives
3 months
STAGE 1Electrification
Universal Access
Business Plan
Master Plans For Accelerated
Growth
Composed of 2 Stages
STAGE 2Integrated
Network Plan
Long Term
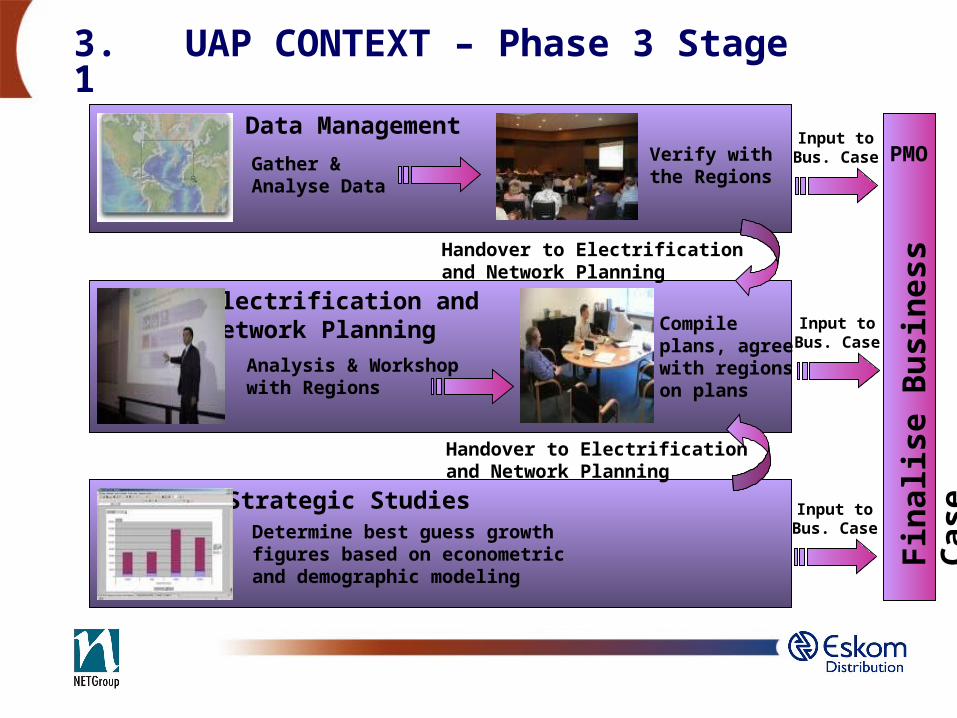
Data ManagementVerify with the Regions
Gather & Analyse Data
Handover to Electrification and Network Planning
Electrification and Network Planning
Analysis & Workshop with Regions
Compile plans, agree with regions on plans
Strategic StudiesDetermine best guess growth figures based on econometric and demographic modeling
PMO
Fin
alis
e B
usi
nes
s C
ase
Handover to Electrification and Network Planning
Input to Bus. Case
Input to Bus. Case
Input to Bus. Case
3. UAP CONTEXT – Phase 3 Stage 1
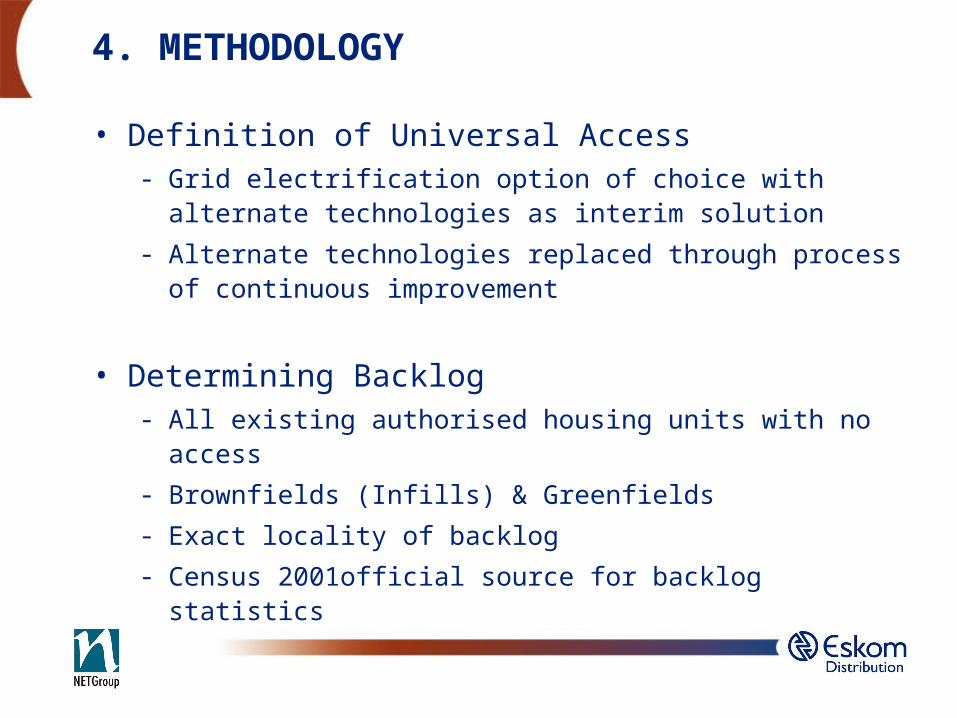
4. METHODOLOGY
• Definition of Universal Access- Grid electrification option of choice with alternate technologies
as interim solution
- Alternate technologies replaced through process of continuous improvement
• Determining Backlog- All existing authorised housing units with no access
- Brownfields (Infills) & Greenfields
- Exact locality of backlog
- Census 2001official source for backlog statistics
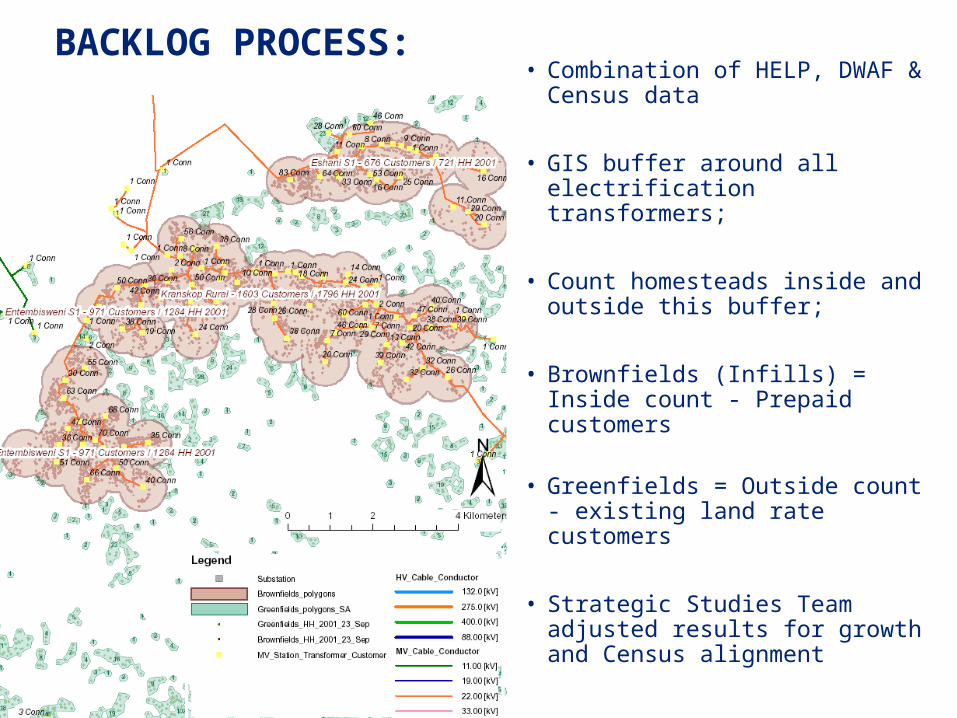
BACKLOG PROCESS:• Combination of HELP, DWAF
& Census data
• GIS buffer around all electrification transformers;
• Count homesteads inside and outside this buffer;
• Brownfields (Infills) = Inside count - Prepaid customers
• Greenfields = Outside count - existing land rate customers
• Strategic Studies Team adjusted results for growth and Census alignment
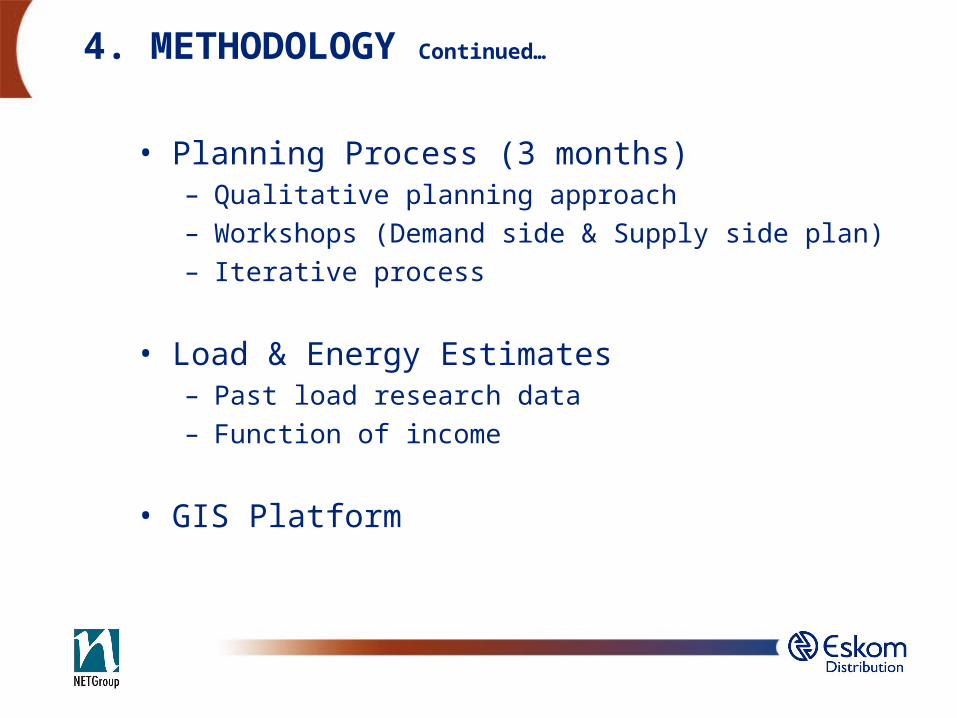
4. METHODOLOGY Continued…
• Planning Process (3 months)– Qualitative planning approach– Workshops (Demand side & Supply side plan)– Iterative process
• Load & Energy Estimates– Past load research data– Function of income
• GIS Platform
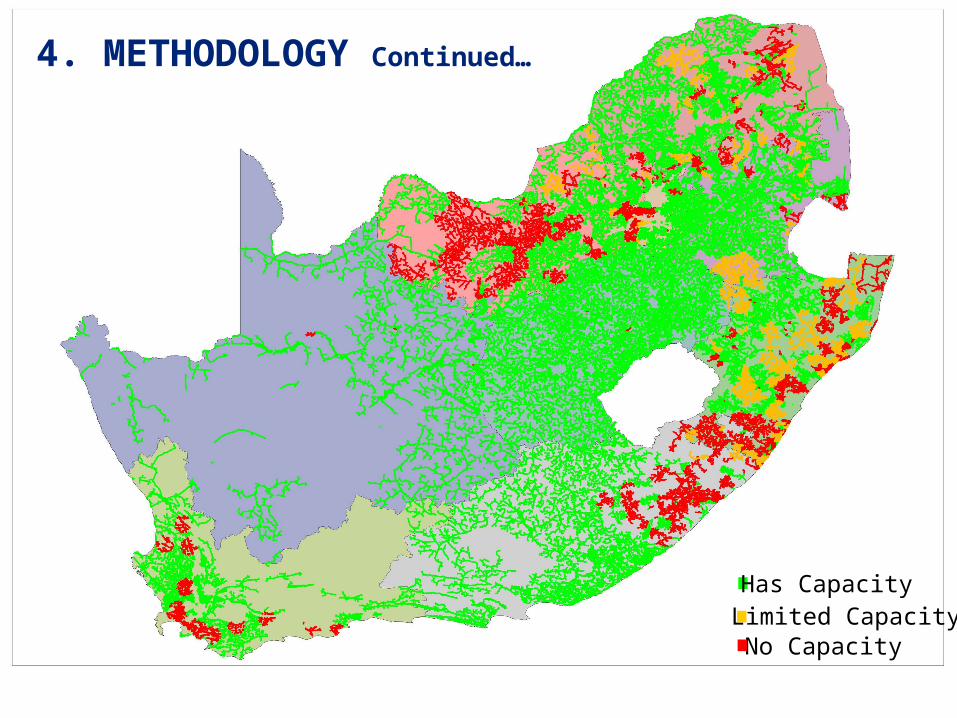
Has CapacityLimited CapacityNo Capacity
4. METHODOLOGY Continued…
0
100,000
200,000
300,000
400,000
500,000
600,000
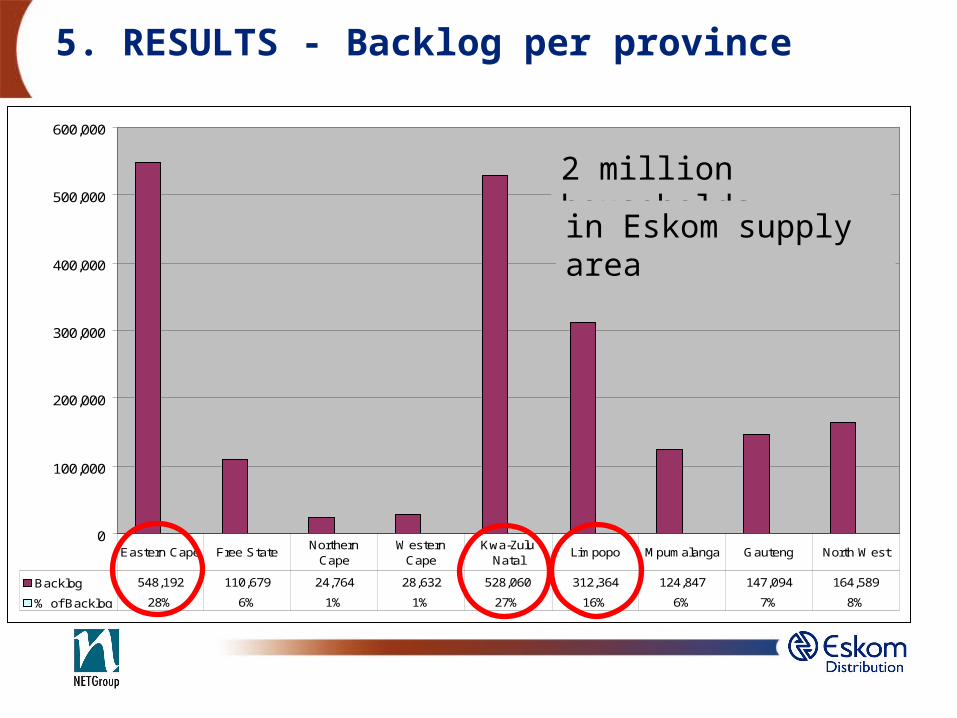
Backlog 548,192 110,679 24,764 28,632 528,060 312,364 124,847 147,094 164,589
% of Backlog 28% 6% 1% 1% 27% 16% 6% 7% 8%
Eastern Cape Free StateNorthern
CapeWestern
CapeKwa-Zulu
NatalLimpopo Mpumalanga Gauteng North West
5. RESULTS - Backlog per province
2 million households
in Eskom supply area
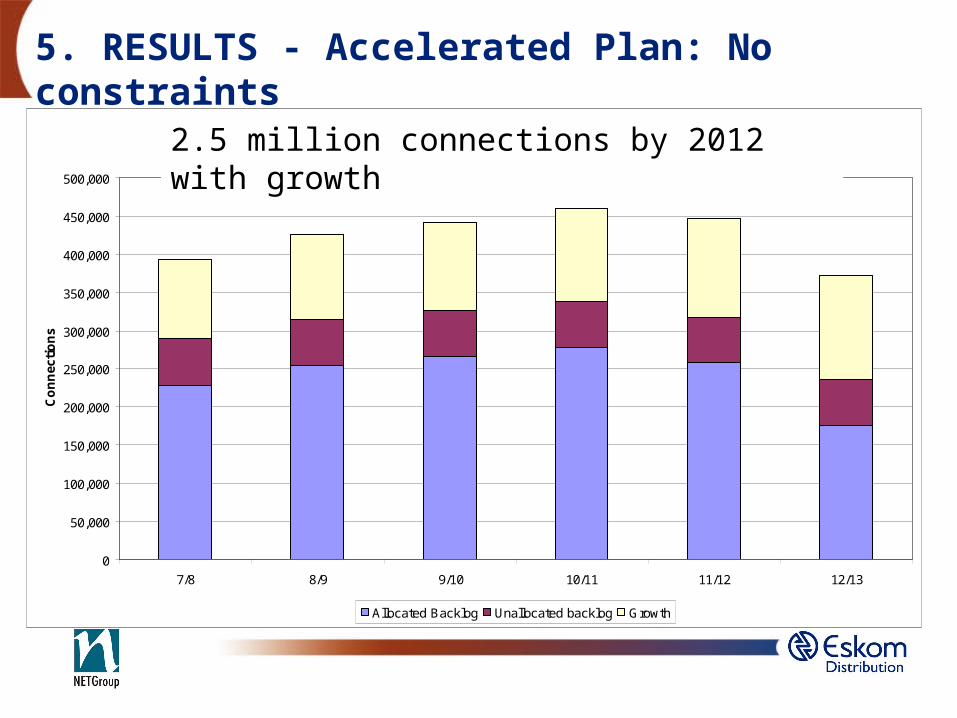
5. RESULTS - Accelerated Plan: No constraints
Accelerated Plan
0
50,000
100,000
150,000
200,000
250,000
300,000
350,000
400,000
450,000
500,000
7/8 8/9 9/10 10/11 11/12 12/13
Co
nn
ecti
on
s
Allocated Backlog Unallocated backlog Growth
2.5 million connections by 2012 with growth
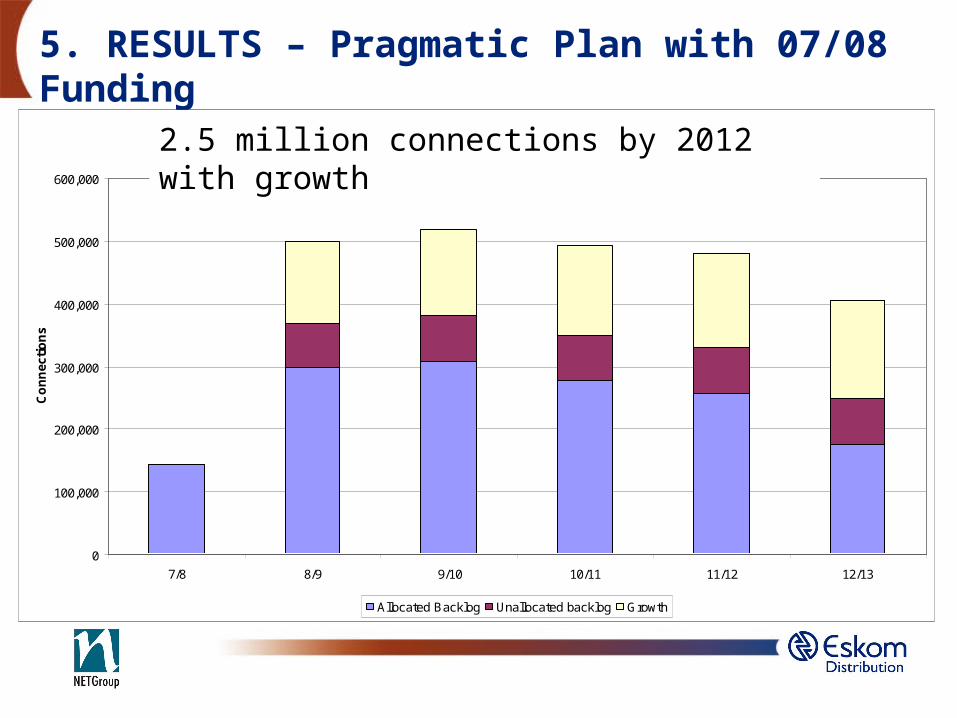
5. RESULTS – Pragmatic Plan with 07/08 Funding
Accelerated Plan
0
100,000
200,000
300,000
400,000
500,000
600,000
7/8 8/9 9/10 10/11 11/12 12/13
Co
nn
ecti
on
s
Allocated Backlog Unallocated backlog Growth
2.5 million connections by 2012 with growth
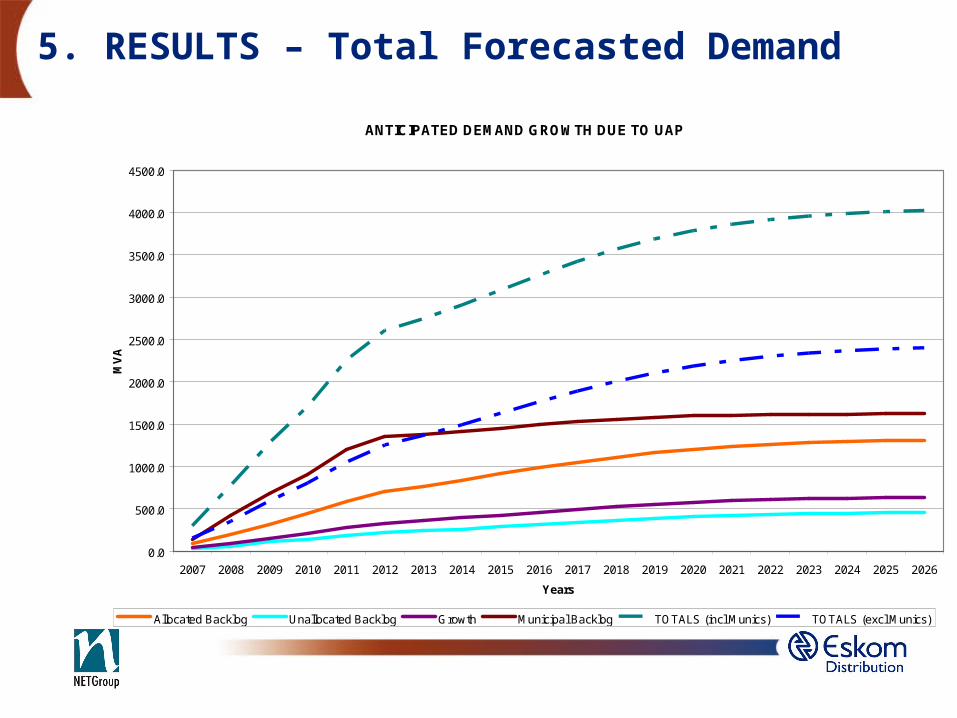
5. RESULTS – Total Forecasted Demand
ANTICIPATED DEMAND GROWTH DUE TO UAP
0.0
500.0
1000.0
1500.0
2000.0
2500.0
3000.0
3500.0
4000.0
4500.0
2007 2008 2009 2010 2011 2012 2013 2014 2015 2016 2017 2018 2019 2020 2021 2022 2023 2024 2025 2026
Years
MV
A
Allocated Backlog Unallocated Backlog Growth Municipal Backlog TOTALS (incl Munics) TOTALS (excl Munics)
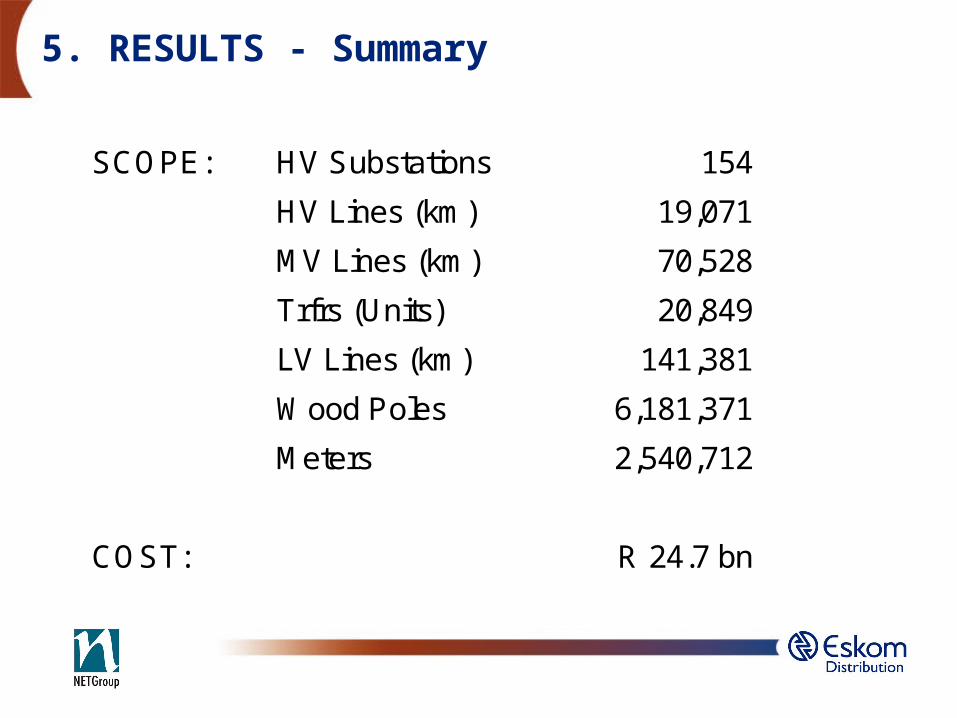
5. RESULTS - Summary
SCOPE: HV Substations 154
HV Lines (km) 19,071
MV Lines (km) 70,528
Trfrs (Units) 20,849
LV Lines (km) 141,381
Wood Poles 6,181,371
Meters 2,540,712
COST: R 24.7 bn
6. CRITICAL SUCCESS FACTORS
• Inclusion of municipal backlog areas
• Data update (satellite imagery)
• Maintain geospatial planning platform
• Stage 2 to proceed
• Detailed Industry supplier capacity assessment
• Understanding of REDS impact
• Operational expansion
7. CONCLUSION
• UAP shows that although great strides have already been made, much work still lies ahead to provide universal access to electricity
• Task is not limited to electrification projects only as we remember it in the 90’s but also requires substantial upstream network expansion & strengthening
Thank You
Q’s ?