american millionaires and multi-millionaires: a comparative statistical study
TRANSCRIPT

American Millionaires and Multi-Millionaires: A Comparative Statistical StudyAuthor(s): Pitirim SorokinSource: Journal of Social Forces, Vol. 3, No. 4 (May, 1925), pp. 627-640Published by: Oxford University PressStable URL: http://www.jstor.org/stable/3005057 .
Accessed: 15/06/2014 18:47
Your use of the JSTOR archive indicates your acceptance of the Terms & Conditions of Use, available at .http://www.jstor.org/page/info/about/policies/terms.jsp
.JSTOR is a not-for-profit service that helps scholars, researchers, and students discover, use, and build upon a wide range ofcontent in a trusted digital archive. We use information technology and tools to increase productivity and facilitate new formsof scholarship. For more information about JSTOR, please contact [email protected].
.
Oxford University Press is collaborating with JSTOR to digitize, preserve and extend access to Journal ofSocial Forces.
http://www.jstor.org
This content downloaded from 195.78.108.60 on Sun, 15 Jun 2014 18:47:06 PMAll use subject to JSTOR Terms and Conditions

The Journal of Social Forces 627
AMERICAN MILLIONAIRES AND MULTI-MILLIONAIRES
A COMPARATIVE STATISTICAL STUDY
PlTIRIM SOROKIN
Wealthy
men as a specific social group have been studied very little up to this time. There are books dealing with this
subject but the greater part of this literature is far from scientific. Scientific monographs and researches such as F. Taussig's Inventors and
Money-Makers, Sombart's Der Bourgeois or T. Veblen's The Theory of the Leisure Class deal
mostly with the psychology and the character of life of rich people. On the other hand, such studies as the researches of Bertillion, Stuart, Gini, Heron, Pearson, Powys and other statisti- cians concern only some problems of vital sta? tistics of well-to-do classes and do not classify separately the wealthiest group of people. And there is even greater reason for saying this about American millionaires and multimillionaires. As far as I know they have not been seriously studied. Meanwhile this social group is interest?
ing in many respects and from many points of view. My paper is a modest attempt at statistical
description of some characteristics of this social
group. It is very far from being complete and exhaustive. First of all, it is based on limited material?on the study of only a little over six hundred of America's wealthiest men. Second, the necessary data have not been secured from
the rich men directly but from indirect sources
pointed out later. Though in general these sources are reliable, they may not be quite com?
plete in some cases; in others, not quite accurate.
Third, the nature of the problem itself is such
that, as we shall see below, many characteristics
of the rich men could be defined only approxi-
mately. This explains why the conclusions drawn
could be only tentative. Nevertheless, in my
opinion, this does not make them valueless.
Even though conclusions are drawn from only six
hundred cases, we must not forget that the num?
ber of the wealthiest men in any country is not
very large. Further, similar studies of men of
science by Galton and De Candoll, that of the
royal families by Savorgnan, Sundbaerg and F.
Woods, that of literary men by H. Ellis and
Odin were practically based upon the number of
cases fluctuating between one hundred and eight
hundred. Such cases indicate that six hundred cases provide a basis for approximate results.
Comparing the data given in different sources and
eliminating all inconsistent cases, I have made these data more or less reliable. It was more difficult to ascertain some of the facts indicated below but even these difficulties have scarcely been greater than the difficulties which were encountered by the authors mentioned above.
Only millionaires and multimillionaires are
included in the group studied.1 If some men who
are worth a little less than one million happened to slip in, they are few enough and wealthy
enough not to spoil the results of the study. The
problem of whether or not a man is a millionaire
and whether or not he should be included in my list was decided in the following way: First of
all, men like Henry Ford, John D. Rockefeller, Andrew Carnegie, A. Mellon, G. F. Baker, J. P.
Morgan, E. Harriman, Guggenheimer, and so on, whose wealth above one million dollars is well
known and quite certain were listed. Among the deceased and the living generations there are no less than one hundred and fifty names of that kind. For the living generation a criterion of
wealth satisfactory for my purpose has been given by income tax payments published in The New York Times in October and November of 1924.
Although these payments do not furnish an un-
disputed basis upon which to estimate a man's wealth it is generally accepted that he who pays an income tax of forty thousand dollars or more is probably a millionaire or at any rate a rich
man. All men whose tax was not less than forty thousand dollars and about whom I could find the
necessary data composed the second part of my list. Finally, in the sources indicated some data
1The principal sources for my study have been as follows: 1. The Encyclopedia Americana, Vols. I-XXX. 2. Appleton's Cyclopaedia of American Biography, Vols. I-IX. 3. The National Cyclopaedia of American Biography, published
by James T. White Co., Vols. I-XVII. 4. Biographical Dictionary of Notable Americans, published by
The Biographical Society, Vols. I-X. 5. Press Reference Library. Notables of Southwest 6. Who's Who in America, all volumes. 7. Who's Who in New York, 1914 and 1924. 8. Many monographs such as My Life and Work, H. Ford;
Random Reminiscences of Men and Events, J. Rockefeller; *_..-!..-.!.- a-j- Carnegie; Financtal Giants of etc Autobiograjbhy, Andrew (
America, G. E. Redmond;
This content downloaded from 195.78.108.60 on Sun, 15 Jun 2014 18:47:06 PMAll use subject to JSTOR Terms and Conditions

628 The Journal of Social Forces
are given showing the amount of wealth of many rich men. This gave me additional criteria for
including or not including a man in the group studied. It will be seen, therefore, that I was not obliged to do any estimating as many authors
already mentioned were obliged to do, in compos- ing their lists of geniuses or great scientists and
writers, which gives this study added value. The men studied are divided into two principal
groups: those living and those who are deceased. This was done in order to ascertain some dynamic tendencies taking place in the course of time within this social group. The following figures show the difference in time between the living and deceased groups, as well as the composition of each of them.
DECEASED GENERATIONS
DECEASED GENERATIONS
LIVING GENERATION
It is easy to see that among the deceased mil- lionaires 92.4 per cent were born between 1790 and 1860 and 93.4 per cent died between 1861 and 1924. The living generation is composed principally of those who were born between 1841 and 1900. There is about a generation's differ? ence between the two groups.2
Duration of Life of American Millionaires
Two hundred and seventy-eight deceased
wealthy men (the data are not quite available for ten) lived a total of 19,235 years which gives 69.19 years as the average duration of life of an American millionaire. This figure is very near the 70.65 years given by Professor J. McKeen Cattel as the average duration of life of the manufactur- ers who were the fathers of American men of
science,8 and it is equal to the average duration of life of the Presidents of the United States
(69.2 years).4 The distribution of ages within this group is as follows:
These figures show that 61.1 per cent of the millionaires died between sixty and seventy-nine years of age. The per cent is also high of those who died between eighty and eighty-nine years of age. I do not have the figures for the entire
population of the United States5 to compare them 1 Among the deceased there are seven men born between 1761
and 1790. They are included because they were the founders of the wealthiest families (e. g. John Jacob Astor, 1st, Jacob Barker and other similar men) and because the greater number of them died after 1840. Besides they are almost counterbal* anced by those among the living group who were born between 1821 and 1840.
* See J. McKeen Cattel, Families of American Men of Science,. American Men of Science, 3d edition, 1921. 4 The data for the Presidents of the United States were col- lected by Miss V. Kennedy in connection with her work in my seminar.
'According to L. I. Dublin the average expectation of life at birth in the United States was in 1901, 49.24 years; in 1910? 51.49 years; in 1920, 56.32 years. It is evident, however, that we have no right to compare these data with the figures given for the rich men because they concern quite a different age group and have a different meaning. For the same reason it is im- possible to compare the given distribution of ages with that given in the Census of the United States for the whole population. For the average expectation of life see L. Dublin, The Possibility of Extending Human Life, in Metron, Vol. III, No. 2, 1924.
This content downloaded from 195.78.108.60 on Sun, 15 Jun 2014 18:47:06 PMAll use subject to JSTOR Terms and Conditions
The Journal of Social Forces 629
with the given data but it seems the millionaire's duration of life, as well as the age distribution
among them is not lower than the duration of life and the distribution of ages among the total male population of the United States over twenty years of age.
Marital Condition of Rich American Men
Out of 245 deceased men with regard to whom it was possible to get reliable data, 237 were mar?
ried, 8 were unmarried. This gives 3.38 unmar- ried men of wealth for every 100 married. Out of 334 living millionaires over 42 years of age, 316 are married; 18, unmarried. This gives 5.7 unmarried for every 100 married men of wealth
over 42 years of age. The difference between the
two groups is probably due to the difference of
exhausted and unexhausted possibility of marri?
age.
According to the 1920 Census of the United
States there were among the males 65 years of
age and over 7.9 unmarried for every 100 mar?
ried; in 1910, 6.6; 6.1 unmarried in 1900, and
6.0 in 1890.6 If we compare these figures with
the per cent of unmarried among the deceased
group of wealthy men we have to conclude that
the per cent of unmarried is considerably lower
than that of the male population of the United
States. The same conclusion is reached by com-
paring in this respect the living group with many
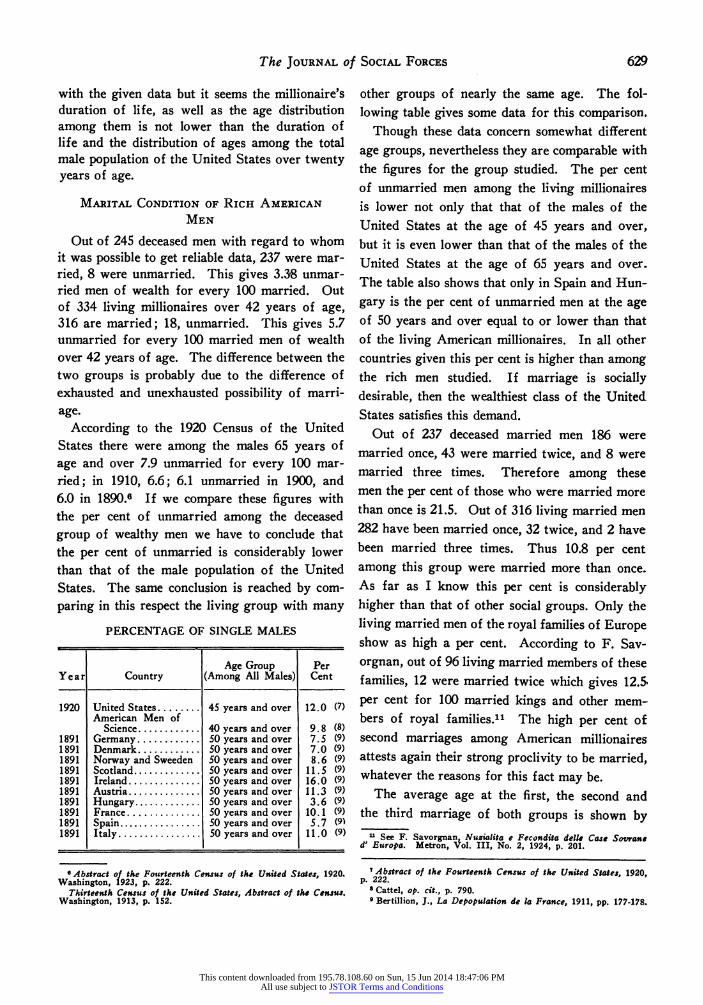
PERCENTAGE OF SINGLE MALES
Year Country Age Group
(Among All Males) Per Cent
1920
1891 1891 1891 1891 1891 1891 1891 1891 1891 1891
United States. American Men of
Science. Germany. Denmark. Norway and Sweeden Scotland. Ireland. Austria. Hungary. France. Spain. Italy.
45 years and over
40 years 50 years 50 years 50 years 50 years 50 years 50 years 50 years 50 years 50 years 50 years
and over and over and over and over and over and over and over and over and over and over and over
12.0 (7)
9.8 (8) 7.5 (9) 7.0 (9) 8.6 (9)
(9) (9)
11.5 16.0 11.3 (9) 3.6 (9)
10.1 5.7
(9) (9)
11.0 (9)
other groups of nearly the same age. The fol?
lowing table gives some data for this comparison.
Though these data concern somewhat different
age groups, nevertheless they are comparable with
the figures for the group studied. The per cent
of unmarried men among the living millionaires
is lower not only that that of the males of the
United States at the age of 45 years and over,
but it is even lower than that of the males of the
United States at the age of 65 years and over.
The table also shows that only in Spain and Hun-
gary is the per cent of unmarried men at the age of 50 years and over equal to or lower than that
of the living American millionaires. In all other
countries given this per cent is higher than among the rich men studied. If marriage is socially
desirable, then the wealthiest class of the United
States satisfies this demand.
Out of 237 deceased married men 186 were
married once, 43 were married twice, and 8 were
married three times. Therefore among these
men the per cent of those who were married more
than once is 21.5. Out of 316 living married men
282 have been married once, 32 twice, and 2 have
been married three times. Thus 10.8 per cent
among this group were married more than once.
As far as I know this per cent is considerably
higher than that of other social groups. Only the
living married men of the royal families of Europe show as high a per cent. According to F. Sav-
orgnan, out of 96 living married members of these
families, 12 were married twice which gives 12.S
per cent for 100 married kings and other mem?
bers of royal families.11 The high per cent of
second marriages among American millionaires
attests again their strong proclivity to be married, whatever the reasons for this fact may be.
The average age at the first, the second and the third marriage of both groups is shown by
6 Abstract of the Fourteenth Census of the United States, 1920. Washington, 1923, p. 222.
Thirteenth Census of the United States, Abstract of the Census. Washington, 1913, p. 152.
u See F. Savorgnan, Nusialita e Fecondita delle Case Sovrane d' Europa. Metron, Vol. III, No. 2, 1924, p. 201.
' Abstract of the Fourteenth Census of the United States, 1920, p. 222. ?Cattel, op. cit., p. 790. ? Bertillion, J., La Depopulation de la France, 1911, pp. 177-178.
This content downloaded from 195.78.108.60 on Sun, 15 Jun 2014 18:47:06 PMAll use subject to JSTOR Terms and Conditions

630 The Journal of Social Forces
the following figures to which some other data
are added for the sake of comparison.
AVERAGE AGE AT MARRIAGE
Summing up these data we can say that the age
at the first marriage of the deceased Americans
of wealth is not higher than that of all groups
given above except the population of Serbia. The
age at the first marriage of the living millionaires
is higher in comparison with the population of
Serbia and that of Germany, France, England
and Italy.16 It is either the same or lower in
comparison with other groups. If in the Old
World the age of marriage of the well to do classes
is higher than that of the poorer classes the same
tendency, it seems, exists in the United States.
Comparing the deceased and the living million?
aires we see that the age of all marriages of the
second group is higher than that of the deceased
generations. This fact manifests a general tend?
ency of postponing the age of marriage which has
been taking place during the last decades in some
countries. Comparing the living millionaires with
the living American men of science and the de?
ceased rich men with the fathers of the men of
science we see that among the millionaires and the
men of science the rate of postponement is prac?
tically the same.
Divorces
Out of 237 deceased married men three were
divorced which gives 1.27 divorced for every 100
married men. Out of 316 living married men
seven are divorced. This gives 2.21 divorced
for every 100 married men of this group.
According to the Census of the United States in
1920 we had 21,247,277 white married and wid-
owed men and 207,663 divorced, or about one
divorced for every 100 married men. In 1890 there
were 0.4 divorced for 100 white married men.16
Comparing 0.4 with the per cent of the divorced
among the deceased group (1.21) and 1.0 with
the per cent of the divorced among the living
group (2.21) we must conclude that divorces
among the millionaires occur more than twice as
often as among the white married male population of the United States. This means that family life
of American millionaires is less stable and more
disintegrated than that of the general American
population. This conclusion is corroborated by a
higher per cent of divorces among the well to do
classes of some other countries in comparison with
that of the general population.17 Only the royal
families, it seems, show a rate of divorce even
higher than that of the millionaires. Out of 100
marriages studied by Savorgnan, there were ten
divorces.18 If this exceptionally high per cent of
divorces among the royal families of Europe is
typical it is due not only to personal whims of the
royal aristocracy but also to dynastic interests de-
manding divorce in case of a childless marriage.
u Cattel, op. cit., p. 792. u Savorgnan, op. cit., p. 204. "Powys, A. Oy Data for the Problem of Evolution in Mant
JB-ometrika, Vol. IV, pt. III, p. 283. ?? Annuaire International de Statisque, 1917, pp. 28-29.
16 Abstract of the Fourteenth Census of the U. S., p. 216. 17 See I. von Mayr, op. cit., p. 187. *? Savorgnan, op. cit.. p. 200. G. Sundbaerg who studied the
royal families of an earlier period than that studied by Savorgnan gives only 0.17 per cent of divorces per 100 marriages. This gives reason to think that Savorgnan's figures are rather unrepre- sentative caused by the limited number of the cases studied. See Sundbaerg, Maisons Souveraines de VEurope en 1841-90, in Ekonomisk Tidskrift, 1909, Vol. 6, pp. 195-237.
This content downloaded from 195.78.108.60 on Sun, 15 Jun 2014 18:47:06 PMAll use subject to JSTOR Terms and Conditions

The Journal of Social Forces 631
Not having this excuse and at the same time being the partisans of social stability, in many respects the millionaires are pioneers in undermining this
stability in the way of the distintegration of the
family?the real corner stone of any social order.
Comparing divorce rates of the deceased and
living group we find that in the course of time it
has increased from 1.27 to 2.21 per cent. This
is a manifestation of a general European and
American tendency toward an increase of divorces
during the last decades.19 It is interesting to
note that the rapidity of the increase of divorces
among the white male population of America
from 1890 to 1920 is somewhat greater than that
among the wealthy group. While divorces among the white male population have increased from
0.4 to 1.0 per cent they have increased among the rich class only from 1.27 to 2.21. It may be,
however, that this difference of the rate of in?
crease of divorce is due to the fact that the inter-
val of time between the two groups of millionaires
is not quite identical with the interval from 1890
to 1920.
Fecundity
It has been impossible to get the entire number
of children born to the millionaires. What I ob-
tained was the number of children at the age of
18 years and over of 222 deceased and that of
150 living married men of wealth. The corre-
sponding results are as follows:
CHILDREN OF MILLIONAIRES
These data furnish a basis for the following conclusions:
1. The fecundity of the deceased rich Ameri- cans was somewhat higher than that of the fath- ers of American scientists, (the average number of their total offspring was 4.74 per family)21 and of the Presidents of the United States (the average number of their total offspring is 4 per family).
2. The fecundity of the living millionaires is
higher than that of American men of science and the graduates of Harvard University (classes of
1871-72) and that of Yale (classes of 1869-86). While the millionaires have an average of 2.56
surviving children per man, the Harvard gradu? ates have only 1.99, and the Yale graduates from 1.7 to 2.2 per man.
3. For a comparison of fecundity of the
groups studied with that of the white population of the United States, I do not have identical data. The average size of the American white family or the average number of children per white American mother would give only a very approxi- mate basis for such a comparison. With this reservation we have the following results of this
comparison. Adding two parents to the average number of surviving children we have:
Average size of family: Deceased millionaires. 5.84 Living millionaires. 4.56
19 See figures in Mayr, Moralstatistik and Statistik und Gesell- schaftslehre, 1909, Vol. III, pt. I, p. 198. Bosco, Divorzi e Separazioni Personali dei Conjugi, Roma, 1903, p. 33ff. Annuaire International de Statistique, 1916. pp. 40-103. Sorokin. P., A Svstem of Sociology>9 1920, Vol. II, pp. 378-382 (Russian).
10 According to Powys the percentage of living children to total offspring in Australia was 75.4 in 1901-1902. In England in the first half of the nineteenth century among the fathers of Eng? lish scientists this percentage was (for children 30 years and over) 76.2, in the United States according to the census of 1919, it was 87.5. In my calculation I took the percentage of hving to total offspring of the deceased group as equal to 75, that of the living millionaires as equal to 80 per cent. These per cents are scarcely far from actual conditions. See Powys, op. cit. p. 281; Galton, English Men of Science. New York: Appleton, 1875, pp. 28-30; The World Almanac and Book of Facts, 1924, p. 359.
?Cattel, op. cit., pp. 792, 793, 799.
This content downloaded from 195.78.108.60 on Sun, 15 Jun 2014 18:47:06 PMAll use subject to JSTOR Terms and Conditions

632 The Journal of Social Forces
Census of the U. S., 1860. 5.3 Census of the U. S., 1880. 5.0 Census of the U. S., 1900. 4.7 Census of the U. S., 1920.4.3"
Average number of surviving children per "native white mother" in U. S. in 1919. 2.8
Average number of surviving children per "foreign white mother" in 1919. 3.4
If these data are comparable we must conclude that the fecundity of the rich Americans is not
lower than that of the American population. This conclusion stands in contradiction of the fact
proved many times that the fecundity of well-to- do classes in Europe is lower than that of Euro?
pean population in general.28 This fact, however, cannot have any decisive meaning in our case. First of all, even in Europe the indicated regu- larity has many exceptions.24 Second, lower fer-
tility has generally been found among compar- atively well-to-do classes but not especially among the wealthiest class, and it may be that in many cases this group which does not feel the economic
necessity for artificially restricting the number of
offspring may have a fecundity higher than that of the well-to-do classes in general. Third, American millionaires, as we shall see further, have been, so to speak, "upstarts" who have be? come rich recently and have not had many gener? ations of wealthy forefathers. Therefore biolog? ical, as well as traditional, factors leading to
diminished fecundity may not yet have begun to
play their role here. These reasons are sufficient
for not giving a decisive significance to the con?
tradiction pointed out. However, in view of the
comparatively limited number of cases studied
and the slightly different bases of comparison I
cannot firmly insist upon the results of the given
comparison as decisive. The fecundity of the
deceased group is close to that of English scien-
tists who lived at approximately the same time
and who had an average of 4.7 children of five
years of age and over.25 It is near the fecundity of the New South Wales Commercial and Indus?
trial classes with 3.5 and 3.8 living children per
family in 190126 as well as to that of the well-to-
do classes of Holland with 4.18 total offspring
per family.27 It is higher than the fecundity of
the French Commercial and Industrial group which had in 1909 an average of 1.7 living chil?
dren per family;28 higher than the fecundity of
living royal families which show a total of 3.18 children born per family ;29 than that of the aris-
tocracy of Sweden with 3.10 children born per family; or that of Finland with 3.12 children born per family; than that of Copenhagen which shows 3.44 children born per family; or the
wealthy class of Budapest with 3.65 children born
per family; and is not lower than the fertility of the population of Europe in the years from 1891 to 1910 which showed from 3.5 to 4 children as
the offspring per family. The fecundity of living millionaires of America
is lower than that of the well to do classes of Holland and New South Wales and it is near the
fecundity of all groups mentioned above.
Finally, though the fecundity of the living mil? lionaires is not exhausted, nevertheless, it is lower than the fecundity of the deceased group. This fact is a partial manifestation of the general tendency of diminution of fecundity taking place throughout Europe and America during the last decades.80
The sex distribution of the children of the de? ceased generation?if we ignore 26 children whose sex is unknown?shows that the percentage of
males to that of females in this group is consid-
erably higher than that of the whole white popu? lation of the United States. Among the latter
per 100 females there were 103.2 males in 1820, 105.3 in 1860, and 104.6 in 1910. But taking into consideration that this percentage fluctuates greatly from state to state we must not regard the fact indicated as something exceptional. In this re?
spect the per cent of boys among the children of the fathers of American scientists studied by Pro? fessor Cattel was higher even than that of the children of the deceased millionaires (166.2 males
per 100 females). More interesting is the fact that the percentage of males among the children of the living group is considerably lower than
among the children of the deceased group (103.4 males instead of 123.4 per 100 females). This
? The World Almanac for 1924, pp. 359, 369. " See resume of corresponding data in C Gini's II Diverso
Accrescimento Delle Classi Soctali, Giornale degli economisti, January, 1909.
*See Cauderlier, La Loi de la Population, 1901; L. March, "Fertility of Marriage According to Profession and Social Posi? tion," in Problems of Eugenics, 1912, pp. 208-220. *Galton, op. cit., pp. 30-31. *?Powys, op. cit., p. 281.
** Savorgnan, op. cit., pp. 207-208. * Bertillion, op. cit., p. 139. ?Savorgnan, ibid., pp. 207-208. 80 See Nicolai, Sur la Fecondite des Marriages et le Nombre
des Enfants par Famille. in Institut Intern. de Statistique, XIV. Session, 1913, Rapport N 19. See Bulletin de I'Institut Intern. de Statistique, Vol. XVIII, pt. II, Sorokin, System of Sociology, Vol. II, pp. 382-84.
This content downloaded from 195.78.108.60 on Sun, 15 Jun 2014 18:47:06 PMAll use subject to JSTOR Terms and Conditions

The Journal of Social Forces 633
fact is identical with the phenomenon indicated
by Cattel among the offspring of American men of science; among their children the per cent of males is much lower than among their fathers' children (107.2 males instead of 166.2 per 100
females).81 As far as I know the causes of this fact have not been ascertained. Perhaps it is the result of the limited number of cases studied, but it may also be?and in my opinion, this hy? pothesis is more probable?that here we have the fact indicated by Fahlbeck that subsequent and later generations of nobility and it seems also of wealthy and intellectual classes are charac- terized by an increase of females among their children.82 Whether this fact is happening often or not?as far as I know it is very far from
being general?in our cases we have something like this. The living group of millionaires, as we shall see further, is composed principally of the
offspring of rich parents. Therefore this hy?
pothesis could be applied to it.
blrthplace and stock of american Millionaires
According to birthplace the deceased and the
living groups of the rich Americans show the fol?
lowing figures to which are added figures show?
ing the per cent of foreign born among Ameri?
can scientists and among the population of the
United States.
These figures show, first, that the per cent of
foreign born among the living millionaires is less than among the deceased group?American mil? lionaires are becoming more and more American.
Second, the per cent of foreign born millionaires of the deceased group is close to that of the for?
eign born among the leading American men of science and among the population of the United States. The corresponding per cent among the
living rich men is less than among the population and scientists of the United States.
The foreign born millionaires, according to their birthplace, belong to the following countries.
BIRTHPLACE OF FOREIGN--BORN MILLIONAIRES
Country Living Group
England.. . Scotland. . . Ireland. . . . Germany... Canada.... France. Hungary. . . Switzerland Austria. . . . Holland.... Spain. Russia.
Total .
BIRTHPLACE OF FOREIGN BORN SCIENTISTS U5)
Country Number in 1910
Per Cent in 1860
(36)
Per Cent in 1920
(37)
England. Scotland. Ireland. Germany. Canada. France. Hungary. Switzerland. Austria Hungary Austria. Holland. Spain. Russia. Other Countries.
Total.
26 9 3
19 34 0 0 8 6 0 0 1 6
14
126
10.5 2.6
38.9 30.8 6.0 2.7 0 1.3 0.6 0 0.7 0.4 0.1
5.8 1.8 7.5
12.1 8.2 1.1 2.9 0.9 0 4.1 0.9 0.1 10.1
This table indicates that the per cent of Ger? man foreign born among the living millionaires is
"Cattel, op. cit., pp. 804-05. Third Edition.) 81 Fahlbeck, La Noblesse de Suede. "Cattel, op. cit., p. 555 (2d Ed.). * Statistical Abstract of the United States, 1921, p. 73.
MCattel, op. cit., p. 555. M Abstract of the Fourteenth Census of the United States,
Washington, 1923, pp. 302, 303. w Per cent of the foreign born according to country of birth
among the total foreign population of the U. S. taken as 100 per cent
This content downloaded from 195.78.108.60 on Sun, 15 Jun 2014 18:47:06 PMAll use subject to JSTOR Terms and Conditions

634 The Journal of Social Forces
considerably higher than among the deceased gen- eraton, while the per cent of English, Scotch and Irish foreign born rich American men among the
living group is considerably lower than among the deceased group. Germany (principally Ger? man Jews) has been gaining, England, Ireland
and Scotland have been losing. The added figures
showing the percentage of foreign born popula? tion of each country among the total foreign born
population of the United States in 1860 and 1920 indicate that this change cannot be explained by a
change of the ratio of immigrants from these countries from 1860 to 1920. The distribution of native born American millionaires and that of native born American scientists according to the
states in which they were born is as follows:
BIRTHPLACE OF NATIVE-BORN AMERICAN MILLIONAIRES AND NATIVE-BORN
AMERICAN SCIENTISTS
States Millionaires
Deceased Group
Living Group
Scientists (1910)
New York. Massachusetts.... Pennsylvania. Ohio.. Illinois.. Connecticut. Vermont. Maryland. Rhode Island. Washington, D. C Virginia. New Hampshire.. New Jersey.. South Carolina. . . Iowa. Indiana. Kentucky. Texas.... .,. West Virginia Oregon... Mississippi. Georgia. Delaware. Louisiana. Arkansas. Michigan. California. Wisconsin. Montana. Alabama. Maine.... Minnesota. Colorado. Missouri. North Carolina. .. Utah. Other States.
Total.
78 44 29 14 6
11 11 8 5 5 5 4 4 4 2 2 2 2 1 1 1 1 1 1 1 0 0 0 0 0 0 0 0 0 0 0 0
104 29 40 26 23 5 5 7 5 1 4 1* 7 2 2 7 4 0 3 0 1 2 3 2 1
14 10 9 4 2 2 2 1 1 1 1 0
183 134 66 75 42 40 0
26 0 3 13 0
28 5
20 28 8 3 1 0 1 3 2 1 0
27 11 35 0 2
29 4 3
14 5 0
55
243 331 867 (38)
These figures show that three states?New
York, Massachusetts and Pennsylvania?pro? duced 51.7 per cent of the deceased millionaires, 47.9 per cent of the living millionaires and 44.2
per cent of the leading scientists of the United States.89 Whether this fact is due to the influence of heredity or to that of social environment I cannot say. It is more probable that both of these factors are cooperating in producing this phe- nomenon. Which is the more important? The data do not give any certain basis for answering this question. The definite conclusions made by the partisans of "heredity" as well as those of "nurture" on the bases of similar data are purely speculative and ought not be imitated. The second fact given by the above figures is the increase of millionaires among the living gener? ation, born in the central and far western states.
Ohio, Illinois, Indiana, Michigan, California, Wisconsin and Montana are definitely gaining in this respect. Parallel to the process of indus- trialization of the West is the increasing number of rich men produced by this part of the United States. This fact is identical to that which has been indicated by Professor Cattel concerning American men of science. From 1903 to 1910 the number of leading. scientists also increased in these states,?in Ohio from 32 to 45, in Indiana from 21 to 34, in Illinois from 24 to 30, in
Michigan from 36 to 74, in Wisconsin from 45 to 54, in Minnesota from 23 to 59, and in Iowa from 30 to 34.40 It seems the process of intensi- fication of economic life in the West is going on parallel to that of cultural and scientific activi? ties having as a result the increase of the scientists and millionaires in this part of the United States.
The outstanding feature of these figures is the decrease of the percentage of the millionaires of
English-Scotch-Irish stock and a very consider- able increase of the millionaires of Jewish stock in the living group. The latter have been gaining decidedly while the former have been losing. If this fact is not a result of the limited number of cases studied it indicates the process of a racial transformation of the richest class of America.
The stock of wealthy men of whom there is
given corresponding information, according to their fathers, is as follows:
"American Men of Science, 2d Ed., pp. 554-555.
89 Similar data are obtained by Scott Nearing who studied the younger generation of American Genius. See Nearing, The Younger Generation of American Genius, The Scientific Monthly, January, 1916.
49 American Men of Science, 2d Ed., p. 570.
This content downloaded from 195.78.108.60 on Sun, 15 Jun 2014 18:47:06 PMAll use subject to JSTOR Terms and Conditions

The Journal of Social Forces 635
STOCK OF WEALTHY MEN (ACCORDING TO THEIR FATHERS)
Stock Deceased Group
No. Per Cent
Living Group
No. Per Cent
English. Scotch. Irish. German. French. Dutch. Jewish. Swiss. Spanish. Portugese. . . Hungarian. . Scandinavian
Total..
1091 24 ? 17 J 19 14 10 9
?i
71.8
9.1 6.7 4.8 4.3
3.3
209 100.0
861 12 r 15J 22 12
30 41 0
2
195
57.9
11.3 6.1 4.1 15.4
5.2
100.0
Occupations of the Fathers of American Men of Wealth and Caste Trend in
the Rich American Class
According to their principal occupations the fathers of American men of wealth belong to the
following occupational groups:
OCCUPATIONAL GROUPS OF THE FATHERS OF RICH AMERICAN MEN
The above table shows in this case as in many other "similia similibus curantur," the principal classes which have been producing wealthy men are: First, manufacturers, merchants, bankers and business men; second, farmers and land owners. All other occupational groups furnished
only 23 per cent of the rich men of the deceased
group and 17.7 per cent of the living group, while
farmers gave 24.6 per cent of the deceased mil? lionaires and 7.3 per cent of the living million? aires. Corresponding figures for the group of
merchants, manufacturers, bankers, etc, are 52.2
per cent for the deceased and 75.0 per cent for the living group. The table also shows an inter?
esting secular trend,?the percentage of the living millionaires whose fathers followed "money-mak- ing" occupations is much higher than that of the deceased group. This fact taken together with some further data gives a basis to state that the
ivealthy class of the United States is becoming less and less open, more and more closed, and is
tending to be transformed into a caste-like group. This conclusion is supported by the percentage
of hereditary transmission of occupation from father to son in both groups. While in the de? ceased group only about 49 per cent of the rich men had the same or a similar occupation to that of their fathers, among the living group this per? cent is about 72. Furthermore we shall see that the percentage of those who started their money- making career as wealthy men is also much higher in the living than in the deceased group. If these data are not a result of the limited number of cases studied, they are doubtless the surest marks of the increase of social "rigidity" of the rich American class. The indicated percentage of
hereditary transmission of occupation among the deceased as well as among the living group is
worthy of our attention for many reasons. We used to think that in the United States "social
mobility,, was greatest and that a caste tendency and conforming hereditary transmission of oc?
cupation from father to children was lowest in
comparison with other societies. And it seems this opinion has been correct up to this time with
respect to the general population of the United States. The data published by L. J. Dublin shows that 58.5 per cent of the wage earners changed their occupation in a few years.41 The same re? sults are obtained by some other investigators.42 These data show that shifting from occupation to occupation is still extensive in American so?
ciety and the percentage of hereditary transmis? sion of occupation is not yet high. With these conditions it is stranger to find that the percentage of hereditary transmission of occupation among
4XSee L. J. Dublin, Shifting of Occupations Among Wage Earners, Monthly Labor Review, April, 1924. 4" See E. Young, The Movement of Farm Population, Bulletin of the Cornell University Agricultural Experiment Station, March, 1924.
This content downloaded from 195.78.108.60 on Sun, 15 Jun 2014 18:47:06 PMAll use subject to JSTOR Terms and Conditions

636 The Journal of Social Forces
America's wealthiest group is no less than in other
European societies and is still growing. In order to provide material for a comparison I will in- clude some comparative data. According to E. Perrin who studied 3,000 cases?1,500 from Who's Who and 1,500 from the Dictionary of Na? tional Biographies?in only 72 cases out of 357, sons of men of commerce, (about 20 per cent.) do we find hereditary transmission of occupa- tion.43 According to F. Chessa out of 17 bankers and manufacturers in Rome in 1908 only three had fathers who had the same occupation. Only the group of proprietors gives a per cent of
hereditary transmission of occupation near that of living American millionaries,?49 men or 65
per cent out of 75 persons of this group.44 The
percentage of hereditary transmission of occupa? tion is also high among the Mannheim Com? mercial Group; it is about 50 per cent.46 The total percentage of hereditary transmission of
occupation in the 3,000 cases studied by Perrin is about 34 per cent (1,017 cases out of 3,000) ;46 that of 3,067 cases studied by C. Gini in Rome is about 24.5 per cent.47 Granting that in money making occupations and among rich classes this
percentage is comparatively higher than in many other occupational groups, as F. Chessa tried to
show,48 nevertheless we must recognize that this
percentage is too high among the group of living American millionaires and, what is more impor? tant, this percentage contrary to the general rule49 is not diminishing but still growing. Such a fact
?if it is not due to the limited number of cases
studied?means thrt the period of the de facto
"open door" for social circulation of the indi?
viduals in the United States is passing and the
stage of class-differentiation with the wealthy class is becoming more and more hereditary and
is more and more closing its door to newcomers. American society is being transformed?at least
in its upper stratum?into a society with rigid classes and well outlined class divisions. This is
the conclusion indicated by our data. If we take
into consideration that shifting from occupation to occupation and social mobility, as a rule, are
increasing in the periods of economic "booms" and social cataclysms like revolutions and wars,60 and if we agree that by the end of the nineteenth
century such "booms" have practically ceased in
the history of the United States due to the dimi- nution of natural resources of the country and the increase of population, then perhaps the con? clusion indicated may appear quite natural. As this fact is very important American sociologists and economists will have to study it more at-
tentively to find out whether the tendency indi? cated does exist or not.
Economic Starting Point of American Millionaires
In order to verify my hypothesis about the increase of rigidity of the wealthy American
class I have tried to find out what percentage of the rich men of both groups have been rich or poor at the beginning of their careers.
It is not necessary to say that data of this kind are very dinicult to get and they are inevitably
only approximate. The results of this research are as follows:
These figures confirm once more what has been said above about the increase of rigidity of the rich American class. The percentage of those who started their careers being poor is twice as
high in the deceased as in the living group. The
percentage of those who started their careers being rich is also almost twice as high in the living as in the deceased group. I willingly admit the 48 E. Perrin, On the Contingency Between Occupation in the
Case of Fathers and Sons, Biometrica, Vol. III, pp. 467-69. 44 F. Chessa, La Transmissione Ereditaria delle Professioni,
Torino, 1912, pp. 116-18. ? Ibid., p. 120. 49 Perrin, op. cit., p. 467. ? Chessa, ibid., p. 117. 49 Ibid., ch. IV. 49 Ibid., ch. IV.
60 See Sorokin, The Sociology of Revolution, Lippincott Co., 1925, pt. III.
Kolabinska, La Circulation des Elites en France, Lausanne, 1912, passim.
51 In this group are included the sons of prosperous farmers, small merchants, prominent citizens, prominent state officials, the sons of influential clergymen, physicians with good practice, pros? perous dealers in various commercial and economic enterprises.
This content downloaded from 195.78.108.60 on Sun, 15 Jun 2014 18:47:06 PMAll use subject to JSTOR Terms and Conditions

The Journal of Social Forces 637
possibility of a considerable error in the per- centages but I do not think it is so great as to
destroy the secular trend itself. In the light of these figures we must recognize as only partially true the statements of many wealthy men that "there is always room at the top, and young men can today find excellent positions with lucrative salaries if they persevere,,; (S. W. Winslow) that "the young man now still does have a chance" ;62 or statements like this, "One often hears the men of this new generation say that they do not have the chances that their fathers and grandfathers had. How little they know of the disadvantages from which we suffered."53 It is true that there is still room at the top of the economic pyramid of American society?and the above figures giv? ing 19.6 per cent for those of the living million? aires who began their careers being poor confirm that?but on the other hand this space is becoming narrower and narrower and at the present time it is considerably smaller than it was a generation ago.
Education and "Climbing the Ladder" of Rich American Men
Out of 631 rich men of both groups 341 have had college education (54.0 per cent), 117 or 18.5
per cent had high school or similar education, 152 or 24.1 per cent had only elementary education, and 21 or 3.4 per cent did not have any education
except self-education obtained independently of
any school attendance. Side by side with these data we find the existence of a correlation be? tween education and financial status at the advent of their careers. This correlation is shown by the following figures.
These figures show, first, that going from the
poor group to the rich we have a systematic in? crease of high school and college education; second, that only 11.7 per cent of those rich men who began their careers being poor had college education while 80.4 per cent of the rich men who were rich at the beginning of their careers are
college graduates. It is interesting to compare the extent of edu?
cation of these captains of finance and industry with that of other American leaders in different fields of activity. The results of this comparison are as follows:
This means that perhaps Andrew Carnegie was
partially right in saying that "college education is not necessary to business success."55 The fact that 88.3 per cent of the richest men who were
poor at the beginning of their careers did not have college education is a convincing fact attest-
ing that, at least up to the present time, such education has not been necessary for making money.30 At the present moment it seems the conditions are somewhat different and demand, as has been pointed out by R. J. Walsh,57 if not a college education then at any rate a business school education. In other forms of human ac-
"Andrew Carnegie, The Empire of Business, 1902, p. 105 ff. 58 John D. Rockefeller, Random Reminiscences of Men and
Events, 1909, pp. 69-70.
M See Scott Nearing, The Younger Generation of American Gemus, The Scientific Monthly, January 1916.
MAndrew Carnegie, op. cit., p. 111. 86The reasons for Carnegie's statement are as follows: "The almost total absence of the graduate from high position in the business world seems to justify the conclusion that college edu? cation as it exists seems almost fatal to success in this domain. The captains of industry entered for the race invariably in their teens (14-20) while the college student has been learning little about the barbarians and petty squabbles of a far distant-
past, or trying to master languages which are dead?such knowl? edge as seems adapted for life upon another planet than this, as far as business affairs are concerned?the future captain of in? dustry is hotly engaged in the school of experience obtaining the very knowledge required for his future triumph. Entering at twenty the graduate has little chance." Op. cit., pp. 110-112. " See his articles in The Century, December 1924, January
This content downloaded from 195.78.108.60 on Sun, 15 Jun 2014 18:47:06 PMAll use subject to JSTOR Terms and Conditions

638 The Journal of Social Forces
tivity it seems college education has been a very important condition of success and leadership.58
It is interesting to know the time required to climb to the top of the pyramid or the ladder of wealth. Up to this time the sociologists have
paid little attention to the processes of social as- cent and descent and especially to the velocities of these processes. Meanwhile a close study of these movements could contribute a great deal toward the understanding of social events and their causes. I have tried, as far as the sources have given the necessary data, to find out, though approximately, at what age those who started their careers being poor became rich?worth at least three hundred thousand dollars?and at what age those who started rich became promi? nent figures in the business and financial world,
assuming the position of president or vice-presi- dent of a big bank or corporation or a big com? mercial firm or economic enterprise. The results are given by the following figures:
AGE AMERICANS STARTING POOR OR MIDDLE CLASS BECAME RICHOR STARTING RICH
BECAME RESPONSIBLE MANAGERS OFBIG ENTERPRISES
As those born poor have many more steps to climb to the top to the pyramid than those born
rich it is natural they need more time than the latter. The table above shows this very clearly. 75 per cent of the millionaires born poor became
rich only at the age of forty-one and above while 77 per cent of those born rich became captains of
industry and finance between twenty and forty
58 See accurate* conclusions about this in Scott Nearing's article indicated above.
years of age. This difference is due not to heredi?
tary advantages of those born into wealthy fami? lies. Captains of finance and industry who were born poor happened, in many cases, to be more
conspicuous giants than the former, but to social
advantages. The race is much longer and the obstacles to be surmounted more numerous for those born into poor families; naturally they necessarily reach the goal later than those born
wealthy. The same phenomenon is noticed (W. Spill-
man) in the climbing of the agricultural ladder
by the sons of the prosperous farmers and by the
poor hired men. While the former are becom-
ing the owners of farms at the age of 26.5 years the latter own farms only at the age of 36
years.59 The table also shows that more than 80
per cent of the rich men became prominent "cap? tains" at an age below fifty years, principally be? tween thirty and fifty. Thirty-five per cent of
those who became rich above the age of fifty were born poor. It is interesting to notice that the average age of twenty-eight presidents of the United States at the time of assuming the
presidency was 55 years. Seven were between
forty-three and fifty years of age, sixteen be? tween fifty-one and sixty years, and five between
sixty-one and seventy years. This means that the
average time necessary to get to the presidency? for those who could attain it?is a little higher than the average time necessary to become a mil? lionaire. The corresponding time necessary to be? come a farm owner in the United States, as we have seen, is considerably lower than that to be? come the president of the United States or an American millionaire. Finally, the greater num? ber of leading American scientists have gained their recognition between thirty and forty-four years of age, a slightly lower age than that for
becoming a captain of industry and finance and
considerably lower than the age for attaining the
presidency of the United States.60
The Roads to Wealth and Some Additional Notes
Who are they, these millionaires ? What occu?
pations or forms of activity are leading to wealth ?
w See W. Spillman, The Agricultural Ladder, The American Economic Review, Vol. IX, No. 1, Supplement, pp. 170-179. 60 American Men of Science, 2d Ed., pp. 575-581. The average age of receiving Ph.D. in the U. S. is 30.2 years. Cf. Higher Degrees of College Professors, by K. T. Hobzinger. Journ. of the Amer. Stat. Association, Vol. XVIII, pp. 878-888.
This content downloaded from 195.78.108.60 on Sun, 15 Jun 2014 18:47:06 PMAll use subject to JSTOR Terms and Conditions

The Journal of Social Forces 639
The following figures answer these questions to
some extent. According to the principal activi? ties in which they have made their money Ameri?
can millionaires belong to the following occupa- tional groups:61
AMERICAN MILLIONAIRES ACCORDING TO OCCUPATION
These figures show that 85 per cent of the rich
men belong to the first seven forms of money- making activities. In these occupations it seems men find the greatest opportunity to become rich.
In conclusion I am adding to the above some
short notes characterizing some other traits, prin-
cipally psychological, of the social group studied.
1. Thorstein Veblen in his interesting book, The Theory of the Leisure Class, tried to give a
psychological interpretation of a class which it
seems is similar to the wealthy class studied. I
do not want to discuss all the principal statements
of Professor Veblen but I desire to point out that, inasmuch as he stressed "conspicuous leisure" as
one of the principal characteristics of this class, I
think that this trait could scarcely be applied to
American men of wealth.62 I think it is difficult
to find any social group which would be as busy and as energetic in activity as American money makers. W. Sombart and F. W. Taussig who
stressed this trait of money makers are quite 61 American captains of finance and industry are exceedingly
many-sided in their occupational activities. The greater part of them manage, either at the same or different moments of their lives many various businesses. Therefore it is somewhat diffi? cult to classify them according to this or that principal activity. This could be done only roughly. Such a rough classification is the table given.
right in this respect.68 I also do not think Veb- len is right in explaining the psychology of the leisure class by "pecuniary emulation,, only. Such a theory is nothing but a simplification and a dis-
figuring of much more complex reality. Taussig showed that the motives of money making activity and the stimuli of the behavior of the rich class are more complicated and more numerous and
considerably different from those which were
given by Veblen. Finally, it is scarcely fair to characterize the total activity of the rich class as
"socially non-productive," as "predatory'' and
exploitative. Perhaps in some future society where conditions and human beings are quite dif? ferent from the present society and human crea-
tures, it will be so, if such a society should come into existence. But from the standpoint of ex?
isting conditions I do not think Veblen is right. It is true that some of these men made their money in quite a "predatory" and socially harmful way. But the greater part of them made their fortune
performing many socially useful services and functions. Perhaps from the standpoint of social benefit it is necessary and useful to incessantly blame the rich class in order to bridle its "pre? datory" trend, but from a purely scientific view?
point such a characterization is one-sided and
subjective. 2. It is interesting to note some tendencies in
those rich American families which have existed
through three or more generations. As far as
my sources permit it we see the following changes in the latest generations. In comparison with the founder of a rich family the men of the third and later generations are less energetic, less active in business and less conspicuous than their grand- father or forefathers. Mere and more, these gen? erations leave "hard business" and more and more dedicate themselves to "fine arts" and liter? ature and partially to political and scientific activ?
ity, becoming art amateurs, art collectors and art
connoisseurs, novelists and writers, sculptors and
artists, scientists and scholars, philanthropists and
diplomats, statesmen and politicians. Very rarely,
?* See Thorstein Veblen, The Theory of the Leisure Class, ch. III and passim.
63 See W. Sombart, Der Bourgeois. F. W. Taussig,. Inventors and Money-Makers, 1915. See also G. T. W. Patrick, The Psy? chology of Social Reconstruction, 1920, ch. II and III. I must say that the conception of Veblen's The Leisure Class is some? what vague and indefinite and. it seems to me, suffers from what in formal logic is styled "quarternio terminorum." There? fore my remarks concern his theory only as far as his "leisure class" is a wealthy class.
This content downloaded from 195.78.108.60 on Sun, 15 Jun 2014 18:47:06 PMAll use subject to JSTOR Terms and Conditions

640 The Journal of Social Forces
however, do they produce in these fields anything really valuable or standing above the average level. These generations sometimes show the traits of Veblen's "conspicuous leisure" and that of "dolce fareniente." Not their forefathers but these gen? erations manifest a weakness and longing for "titles" and "artistocratic manners," for "con?
spicuous consumption" and luxury, for a "pecuni- ary standard of living" and pecuniary canons of taste." They are to some extent "efreminated" and weakened, being at the same time more sen- sual and more capricious in their sexual life. There are many exceptions to these somewhat
general remarks, nevertheless the tendencies in?
dicated, it seems, do exist. As the rich American class is comparatively young and as the percent-
age of "newcomers" in it is still considerable, these tendencies of "degeneration" are still very weak. But if the increase of "rigidity" and "so?
cial seclusion," as indicated above, is growing, then it may be that these tendencies will become
stronger and stronger followed by all the social disasters connected with them until such a class as a socially harmf ul one will be destroyed in this
or that way and be superseded by another more efficient and more useful. As such "historical
operations" are always very "expensive" not only for the wealthy class itself, usually costing its life, but also for society, it is, therefore, perhaps worth while to pay greater attention to these tendencies in order to prevent their increase and their dis- astrous results.
This content downloaded from 195.78.108.60 on Sun, 15 Jun 2014 18:47:06 PMAll use subject to JSTOR Terms and Conditions