american journal of orthodontics · american journal of orthodontics ... frinkel appliance,...
TRANSCRIPT
American Journal of ORTHODONTICS Founded in 1915 Volume 88 Number 2 August, 1985
Copyright 0 1985 by The C. V. Mosby Company
ORIGINAL ARTICLES
Skeletal and dental changes following functional regulator therapy on Class II patients ,
James A. McNamara, Jr., D.D.S., Ph.D.,* Fred L. Bookstein, Ph.D.,** and Timothy G. Shaughnessy, D.D.S.*** Ann Arbor, Mich., and Chapel Hill, N.C.
Craniofacial growth in 100 patients treated with the functional regulator of Frankel for about 24 months was compared with craniofacial growth seen in a matched group of untreated persons with Class II malocclusion. Both conventional and geometric cephalometric analyses were used to evaluate the skeletal and dental adaptations. This study shows several clear effects of treatment in either of two age ranges considered. The principal skeletal effect was advancement of the mandible along the direction of the facial axis. This advancement resulted in increases in mandibular length and in vertical facial dimensions. There was little effect of treatment upon maxillary skeletal structures with the exception of point A, which moved slightly posteriorly. Dentoalveolar adaptations due to treatment included a decrease in the normal forward movement of the upper molar and an increase in the normal vertical movement of the lower molar. There was a 2-mm posterior movement of the tip of the upper incisor but minimal anterior tipping of the lower incisor.
Key words: Frinkel appliance, cephalometrics, growth, treatment effect
0 ne appliance used for correcting a Class II malocclusion is the functional regulator of FrHnkel.‘-’ Unlike most other types of functional appliance, this appliance uses the buccal vestibule as its base of op- eration. The vestibular shields and the lower labial pads
This research was supported in part by United States Public Health Service Grants DE-03610 and DE-05410. *Rofessor of Anatomy and Cell Biology, Professor of Dentistry (Orthodontics), and Research Scientist, Center for Human Growth and Development, The University of Michigan. **Research Scientist, Center for Human Growth and Development, and Pro- gram in Developmental and Reproductive Biology, The University of Michigan. ***Resident, Department of Orthodontics, University of North Carolina.
of the appliance restrain the musculature and remove restricting forces from the dentition. There is little doubt that this appliance can be used to bring about a cor- rection of the Class II condition, but considerable un- certainty exists about the mechanism of this correction. Whether or not the Frlnkel appliance alters craniofacial skeletal form in particular is a matter of some contro- versy.
LITERATURE REVIEW
In this review of previous studies, we will examine the treatment effect reported for various types of ortho- dontic therapy. A treatment effect will be considered
91
92 McNamuru, Bookstein, and Shaughnessy
the difference between the growth that one observes in treated cases and the growth that one expects over the same period in the absence of treatment, as observed in an appropriately matched untreated sample.
Treatment effects on maxillary growth
The application of heavy extraoral force to the max- illary complex restricts the development of maxillary structures; it may also cause posterior movement of these structures.8-‘0 The combination of extraoral trac- tion with an activator type of appliance can produce similar effects. 11,12 Activator therapy alone also can re- strict maxillary development. D’* However, there is little literature concerning the effect of the functional regu- lator, and that which exists is contradictory. For ex- ample, Creekmore and Radney” note reduced forward growth of the maxilla in patients treated with the Frln- kel appliance, while Righellis,*’ Robertson,*’ and Bookstein’* report that there is no appreciable treatment effect on the position of the maxilla.
Treatment effects on maxillary dentition
Tooth movement (or, in some cases, inhibition of tooth movement) also can be an important factor in the correction of a Class II malocclusion. For example, the posterior movement of the upper posterior teeth follow- ing the interarch mechanics of Wilson and Wilson*’ may correct a Class II molar relationship. Pancherz24 reports that more than 40% of the correction achieved with the banded Herbst appliance can be attributed to posterior repositioning of the upper posterior teeth. Har- vold and Vargervik’” state that a Class II molar rela- tionship may be corrected by inhibiting the downward migration of the maxillary teeth while permitting erup- tion of the mandibular teeth.
Schulhof and Engel*’ note that in activator cases the upper molar was restricted in its downward and forward movement but observed little difference in upper molar movement between persons treated with the Frankel appliance and normal persons. In contrast, Creekmore and Radney” note that the maxillary molars in their FrHnkel sample moved forward significantly less than those of their untreated control sample. Righellis*’ notes no statistically significant retardation of upper molar eruption in patients treated with either the Frankel ap- pliance or the activator, although both groups showed a little less vertical eruption than did the untreated con- trols. On the other hand, Bjijrk,26 Softley,*’ and Freunthaller16 claim that the activator affects the den- toalveolar areas in many cases.
Schulhof and Engel,*’ Creekmore and Radney,” and Robertson*’ note retroclination of the upper incisors during the course of FrHnkel treatment.
Treatment effect on mandibular dentition
A Class II malocclusion may also be corrected by the mesial migration of the lower dentition. While Janson reports that this process is a principal effect of the bionator, Schulhof and Engelz5 come to the op- posite conclusion about the bionator, although they no- tice a mesial movement of the mandibular molars during activator treatment.
Schulhof and Enge125 indicate that Frlnkel treatment involves additional mesial movement of the lower molar over what is expected during normal growth. Creek- more and Radney’” and Righellis*’ report significant additional vertical movement of the lower molars in Frankel samples.
There seems to be agreement about the effect of Frankel therapy on lower incisor position; the incisors are proclined as compared to those of untreated con- trols, 1Y.21.25 2’)
Treatment effect on mandibular growth
What is the effect of functional appliance therapy on mandibular growth? Some researchers’X~2h~3” state that activators do not produce any alterations in man- dibular form beyond that which would have occurred without treatment. However, others3’*32 note a signifi- cantly higher rate of mandibular growth in patients treated with activators than in untreated patients. Many researchers’3,‘3-“6 believe or hint that mandibular growth can be affected by activator treatment.
Until recently, few studies have examined whether the functional regulator of FrPnkel can cause an increase in mandibular growth that would not have occurred without treatment. Frankel and Reiss3’ and Righellis*’ find that mandibular growth can be increased during Frankel therapy, but Schulhof and Engel,” Creekmore and Radney, I’) and Robertson” have been unable to detect any increase.
Treatment effect on lower facial height
Schulhof and Enge125 note no significant change in the facial axis angle with either the activator or the bionator, but they do report an increase in the facial axis angle in patients treated with the FrPnkel appliance. This indicates a larger increase in lower anterior facial height than in posterior facial height. Franke14 also re- ports an increase in the vertical dimension of the lower face after functional regulator treatment, while Rig- hellis”’ reports no change in comparison to untreated controls. Bookstein’* finds that the treatment effect on facial form involves considerable increase in both an- terior and posterior facial height, together with some shrinking of growth anteroposteriorly; the combination of these effects leaves corpus length unaltered.

Volume 88 Number 2
Skeletal and dental changes following functional regulator therapy 93
Critique
These contradictions among clinical studies of func- tional regulator therapy must be interpreted in the light of many factors.
Nature of the treated sample. Schulhof and Engel” used 37 cases; Creekmore and Radney” used only 11 of these same cases for their Class II Frankel sample. The other 26 cases were eliminated because they were Class I, lacked skeletal growth or had unreadable ceph- alograms . In fact, small sample sizes seem to have been characteristic of most Frankel studies. Gianelly and co-workers3’ used 10 cases, Robertsot?’ used 12, Righellis” used 16, and Adams*’ used 19. Frankel and Reiss37 used 64 cases in their study.
Previous publications also have been vague about the clinician’s basis for selection of patients from a given practitioner and selection of films for a given patient. For instance, in some studies’9,25 only “suc- cessfully treated” patients were considered.
Nature of controls. In most of the literature, the changes observed in cases treated with the Frankel appliance are compared with published2’,3s or un- published” cephalometric standards. Creekmore and Radney” used untreated children as controls; 80% of these had Class I occlusion. Only Righellis” and Bookstein** used persons with untreated Class II mal- occlusion as controls.
Variation in treatment technique. Fdnkel’s treat- ment method requires notching of the posterior decid- uous teeth. Robertson*’ and Creekmore and Radney” state, and Schulhof and Enge125 imply, that their sam- ples had no such notching. The lack of notching may lead to an unfavorable tipping of the upper incisors in a posterior direction and a restraint of maxillary growth. The possible amount of mandibular advancement pro- duced by the appliance may thus be reduced.4.40 In the mature dentition the shape of the permanent canines and premolars provides adequate stabilization of the appliance, and notching is not required.
Another factor that may be related to the effect of the appliance on the lower anterior teeth is the position of the lower labial pads of the FR-2 appliance. Pad positioning that is too far superior to the depth of the vestibule and too far anterior to the mandibular alveolus can lead to incisor proclination because the pads have a lip-bumper effect on the orbicularis oris muscle rather than the desired restrictive effect on mentalis activity.5
Choice of measurements. The studies that we have reviewed measure many aspects of maxillary and man- dibular skeletal and dental changes using many differ- ent sets of landmarks and variables. There is no uni- versally accepted way of relating different definitions
of, for example, mandibular length or facial height. The articles also vary in their authors’ ideas of what constitutes a measure of change. For instance, Schulhof and Engelz5 compute mean ratios of linear changes of separate measures; this is an unacceptable statistical maneuver, because the variance of ratios with small, noisy denominators, such as change scores of slowly changing measures, is extremely high.
The present study attempts to correct these endemic flaws as much as possible. The cases analyzed in this study represent a sample of patients all treated with a reasonably consistent orthodontic technique. The basis for assessment of treatment effect is a fairly well- matched group of untreated controls. The sample is large enough for us to assay the interaction of age with treatment effect, and the cephalometric summaries that we computed include not only conventional measures but also a mean tensor analysis that is independent of all predetermined distances or angles. One major flaw remains: because the data presented in this study were gathered retrospectively, the study still is subject to possible unconscious practitioner bias, a lack of sys- tematic gathering of treatment records on all potential patients, and the other familiar limitations of this con- venient study design.
MATERIALS AND METHODS Treated sample
Records of 100 patients treated with the functional regulator of FrHnkel were gathered, traced, and digi- tized during the summers of 1982 and 1983. The records were solicited from the private practices of eight ortho- dontists (James A. McNamara, 21 cases; J. Michael Dierkes, 20 cases; Thomas A. Laboe, 20 cases; Ray- mond P. Howe, 16 cases; Roy D. McAnnally, 13 cases; John J. Sammann and Robert P. Scholz, 7 cases; Robert B. Julius, 3 cases). All of these clinicians were judged by the senior author to be experienced and competent in Frlnkel treatment.
The records of approximately 150 patients were sub- mitted by the private practitioners. The practitioners withheld other cases from us only for one or more of the following reasons:
1. The clinician judged that the patient’s cooper- ation was poor. This judgment was based not on the success of treatment but, rather, on reports from parents or patients or on the lack of evidence of hyperemia of any of the soft tissues of the oral region. To be included in this study, the patients must have been judged to have worn the appliance for at least 18 hours a day during the first 18 months of the study period.
2. The patient did not have a Class II malocclusion, that is, at least an end-to-end molar or canine relation-
94 McNumaru, Bookstein, and Shaughneq
ship. Several of the clinicians used the FR-2 in some Class I cases.
3. The patient had a severe retroclination of the upper incisors, as in a Class II, Division 2 maloc- clusion.
4. The initial lateral headfilm was taken more than 2% months before the onset of Frankel treatment andi or the second film was taken more than 1 month after the end of Frankel treatment. These cases were elimi- nated because the cephalometric records included a sub- stantial amount of growth during a period when the appliance was not being worn. This exclusion crite- rion eliminated the majority of cases from one practi- tioner (J.M.D.).
Almost all of the patients considered in this study completed the FR-2 phase of treatment during 198 1 and 1982. None of the patients had worn fixed or removable appliances prior to Fdnkel treatment. Although vir- tually all patients had a phase of fixed appliance therapy following Frankel treatment, the interval between the two cephalometric films included only that phase of treatment during which the Frankel appliance was worn. Treatment success was not a criterion for selection.
Upon receipt of the records from the practitioners, we once again applied the exclusionary rules described above and eliminated approximately 25 of the 150 cases. We then applied two additional exclusionary rules, eliminating an additional 25 cases:
1. The anatomic landmarks necessary for the anal- ysis were not readily identifiable on the radiograph (ap- proximately 20 cases eliminated).
2. There was a 2- to 3-mm difference between films in the distance between the anterior border of the atlas and the closest point on the posterior border of the ramus. This indicated a difference in mandibular po- sition between the two films (approximately 5 cases eliminated).
In 71 of the children in the treated group, one or more maxillary deciduous teeth were present at the start of treatment. In 57 (80%) of these patients the maxillary posterior teeth were notched as part of the treatment protocol.
The appliances used in this study were fabricated according to the principles of FrankeP and Mc- Namara.4’~43 The mandible was brought forward 3 to 5 mm, leaving just enough vertical opening for adequate interocclusal clearance of the crossover wires to the lower lingual shield.
Control sample
Changes over the course of treatment were com- pared with changes recorded for a sample of untreated Class II children from The University of Michigan El-
ementary and Secondary Growth Study.” These control subjects included all the dental Class 11 subjects in the Michigan sample for whom longitudinal cephalometric records were available for the age ranges studied. Where appropriate, the subjects in the control sample were subjected to the same exclusionary rules as those applied to the treatment sample. This resulted in the selection of records from 41 untreated Class II cases.
Division of samples by age
In order to study the interaction of age with the effect of Frankel therapy, the sample was divided by age at the start of treatment according to the two age ranges commonly treated with the Frankel appliance. The younger age range includes children in the early to mid-mixed dentition group, and the older age range includes persons in the late mixed and early permanent dentitions. Fifty-one patients (20 boys, 3 1 girls) who began treatment at less than 10.5 years of age made up the younger group; the 49 patients (23 boys, 26 girls) who began treatment at age 10.5 years or older made up the older group. The average age of the younger group was 8.8 years when the initial headfilm was taken; the older patients averaged 11.6 years of age at this time. The average interval between films in the younger group was 23 months, and in the older group it was 25 months.
Seventeen of the Class 11 children from the Uni. versity School Study had cephalometric records that spanned both the younger and older age intervals. Thesr children were used in both control groups. Thus, there are records from 36 children ( 17 boys, 19 girls) in the younger control group and records from 21 children (8 boys, 13 girls) in the older control group. The average age of the persons in the younger control group was 8.4 years for the pretreatment film, and the average age of the older controls was 11 .O years. The average in- terval between films was 26 months for the younger control group and 22 months for the older group.
Each film was traced by two of the authors (J. A. M. and T. G. S.) to verify anatomic outline determinations and landmark placement. Landmark lo- cations were thendigitizedon a Summagraphics digitizing tablet.
Methods of analysis
The effect of Frankel treatment on the growth of the craniofacial region was determined according to two independent cephalometric analyses, one conventional and one not. The conventional analysis used is an ex- tension of that devised by McNamara.44.45 It comprises a predetermined set of measurements of angles and distances that are applied to each cephalometric tracing;
Volume 88 Number 2
Skeletal and dental changes following functional regulator therapy 95
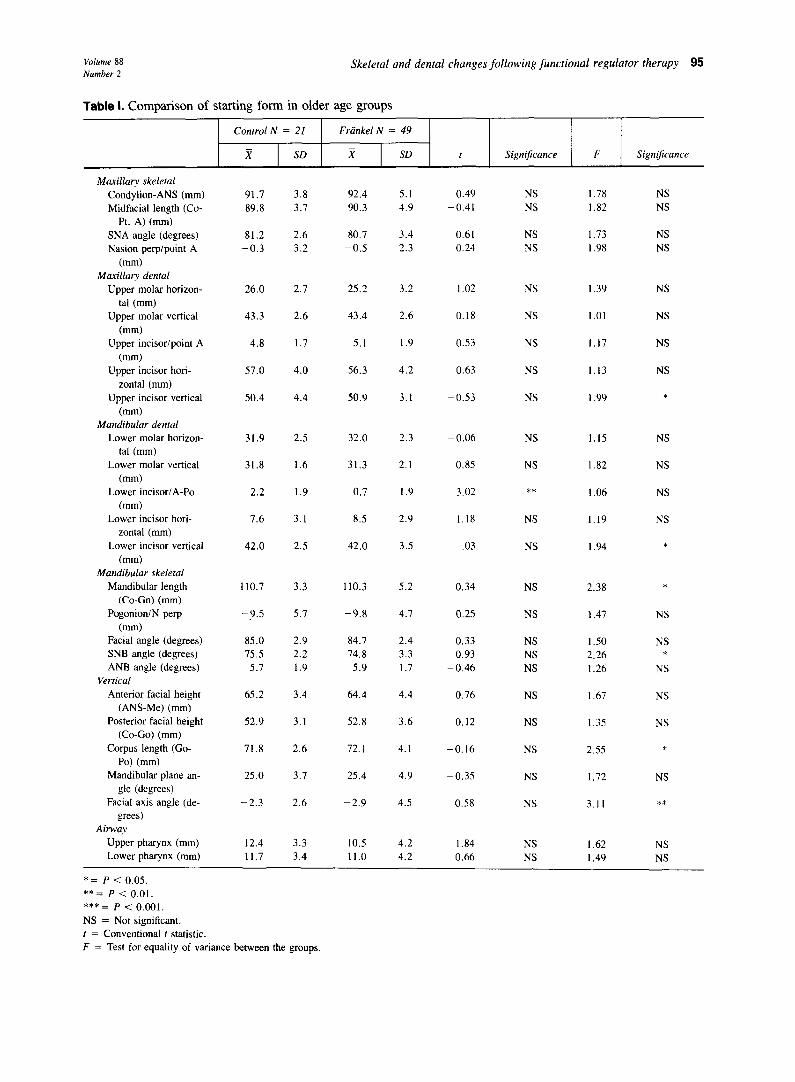
Table 1. Comparison of starting form in older age groups
Control N = 21 Friinkel N = 49
51 SD x SD t Significance F Significance
Maxillary skeletal Condylion-ANS (mm) Midfacial length (Co-
Pt. A) (mm) SNA angle (degrees) Nasion perplpoint A
(mm) Maxillary dental
Upper molar horizon- tal (mm)
Upper molar vertical (mm)
Upper incisor/point A (mm)
Upper incisor hori- zontal (mm)
Upper incisor vertical (mm)
Mandibular dental Lower molar horizon-
tal (mm) Lower molar vertical
(mm) Lower incisor/A-PO
(mm) Lower incisor hori-
zontal (mm) Lower incisor vertical
(mm) Mandibular skeletal
Mandibular length (Co-Cn) (mm)
PogonioniN perp (mm)
Facial angle (degrees) SNB angle (degrees) ANB angle (degrees)
Vertical Anterior facial height
(ANS-Me) (mm) Posterior facial height
(Co-Go) (mm) Corpus length (Go-
PO) (mm) Mandibular plane an-
gle (degrees) Facial axis angle (de-
grees) Airway
Upper pharynx bm) Lower pharynx (mm)
91.7 89.8
3.8 92.4 3.7 90.3
2.6 80.7 3.2 -0.5
5.1 4.9
1.78 NS 1.82 NS
81.2 -0.3
3.4 2.3
0.49 NS -0.41 NS
0.61 NS 0.24 NS
1.73 NS 1.98 NS
26.0 2.7 25.2 3.2 1.39 NS
43.3 2.6 43.4 2.6
1.02 NS
-0.18 NS 1.01 NS
4.8 1.7 5.1 1.9 NS 1.17
57.0 4.0 56.3 4.2
0.53
0.63 NS 1.13
NS
NS
50.4 4.4 50.9 3.1 -0.53 NS 1.99 *
31.9
31.8
2.5 32.0 2.3
1.6 31.3 2.1
NS
NS
1.15
1.82
2.2
1.6
1.9 0.7 1.9
- 0.06
0.85
3.02
1.18
.03
** 1.06
3.1 8.5 2.9 NS 1.19
NS
NS
NS
NS
42.0 2.5 42.0 3.5 NS 1.94 *
110.7 3.3 110.3 5.2 NS 2.38 *
-95
85.0 75.5
5.7
5.7 -9.8 4.7 NS 1.47
2.9 84.7 2.4 2.2 74.8 3.3 1.9 5.9 1.7
0.34
0.25
0.33 0.93
-0.46
0.76
0.12
-0.16
-0.35
NS 1.50 NS 2.26 NS 1.26
NS
NS *
NS
65.2
52.9
3.4 64.4 4.4 NS 1.67
3.1 52.8 3.6 NS 1.35
NS
NS
71.8
25.0
2.6 72.1 4.1 NS 2.55 *
3.7 25.4 4.9 NS 1.72 NS
-2.3 2.6 -2.9 4.5 0.58 NS 3.11 **
12.4 3.3 10.5 4.2 1.84 NS 1.62 NS 11.7 3.4 11.0 4.2 0.66 NS 1.49 NS
- *= P < 0.05. **= P < 0.01. ***= P < 0.001. NS = Not significant. f = Conventional t statistic. F = Test for equality of variance between the groups.
96 McNamura, Bookstein, and Shaughnessy
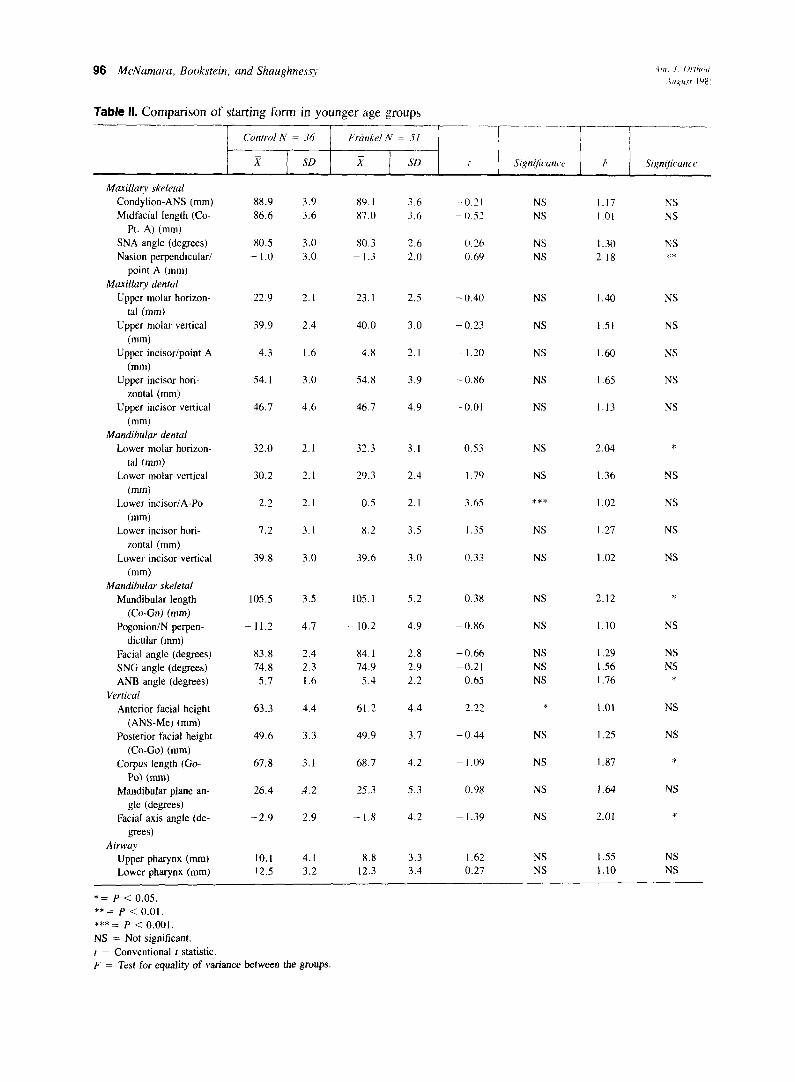
Table II. Comparison of starting form in younger age groups
Control N = 36 Frijnkrl N = 51 -
x SD x SD
Maxihry skeierai Condylion-ANS (mm) Midfacial length (Co-
Pt. A) (mm) SNA angle (degrees) Nasion perpendicular/
point A (mm) Maxillary dental
Upper molar horizon- tal (mm)
Upper molar vertical (mm)
Upper incisor/point A (mm)
Upper incisor hori- zontal (mm)
Upper incisor vertical
(mm) Mandibular dental
Lower molar horizon- tal (mm)
Lower molar vertical
(mm) Lower incisor/A-PO
(mm) Lower incisor hori-
zontal (mm) Lower incisor vertical
(mm) Mandibular skeletal
Mandibular length (Co-Gn) (mm)
Pogonion/N perpen- dicular (mm)
Facial angle (degrees) SNG angle (degrees) ANB angle (degrees)
Vertical Anterior facial height
(AN.%Me) (mm) Posterior facial height
(Co-Go) (mm) Corpus length (Go-
PO) (mm) Mandibular plane an-
gle (degrees) Facial axis angle (de-
grees) Airway
Upper pharynx (mm) Lower pharynx (mm)
88.9 3.9 89.1 3.6 -0.21 NS I.17 NS 86.6 3.6 87.0 3.6 -O.S.? NS 1.01 NS
80.5 3.0 80.3 2.6 0.26 NS 1.30 NS - I.0 3.0 ~ 1.3 2.0 0.69 NS 2.18 **
22.9 2.1 23. I 2.5 - 0.40 NS 1.40 NS
39.9 2.4 40.0 3.0 -0.23 NS 1.51 NS
4.3 I.6 4.8 2.1 - 1.20 NS 1.60 NS
54.1 3.0 54.8 3.9 -0.86 NS 1.65 NS
46.7 4.6 46.7 4.9 -0.01 NS 1.13 NS
32.0 2.1 32.3 3.1 0.53 NS 2.04 *
30.2 2.1 29.3 2.4 I .79 NS 1.36 NS
2.2 2.1 0.5 2. I 3.65 *** 1.02 NS
7.2 3.1 8.2 3.5 1.35 NS 1.27 NS
39.8 3.0 39.6 3.0 0.33 NS 1.02 NS
105.5 3.5 105.1 5.2 0.38 NS 2.12 ‘F
-11.2 4.7 - 10.2 4.9 -0.86 NS 1.10
83.8 2.4 84.1 2.8 -0.66 NS I .29 74.8 2.3 74.9 2.9 -0.21 NS 1.56
5.7 1.6 5.4 2.2 0.65 NS 1.76
NS
NS NS
*
63.3 4.4 61.2 4.4 2.22 * 1.01
49.6 3.3 49.9 3.7 -0.44 NS I .25
NS
NS
67.8 3.1 68.7 4.2 ~ 1.09 NS *
26.4 A.2 25.3
-2.9 2.9 - 1.8
5.3
4.2
0.98 NS NS
- 1.39 NS
1.87
1.64
2.01 *
10.1 4.1 8.8 3.3 1.62 NS 1.55 NS 12.5 3.2 12.3 3.4 0.27 NS 1.10 NS
*= P < 0.05. ** = P < 0.01. ***= P < 0.001. NS = Not significant. t = Conventional t statistic. F = Test for equality of variance between the groups.
Volume 88 Number 2
Skeletal and dental changes following functional regulator therapy 97
it may or may not provide an optimal evaluation of the effects in which we are interested. Bookstein argues that such approaches should be superseded by a new method-the mean tensor analysis-which constructs the measures to be used only after the shape change has, in fact, been analyzed. We analyzed the effect of FrHnkel treatment by both of these methods, and the results are compared in the Discussion section of this article.
We corrected for variation in intervals between films by reporting all changes for a fixed time interval of 24 months.
The nature of mean tensor analysis
Conventional and tensor analyses are similar in that both use the same data base of stored cephalometric landmarks. Whereas conventional cephalometric meth- ods then require the measurement of predetermined lengths, angles, and ratios, the tensor method constructs the specific measures of change only after the analysis has been completed.
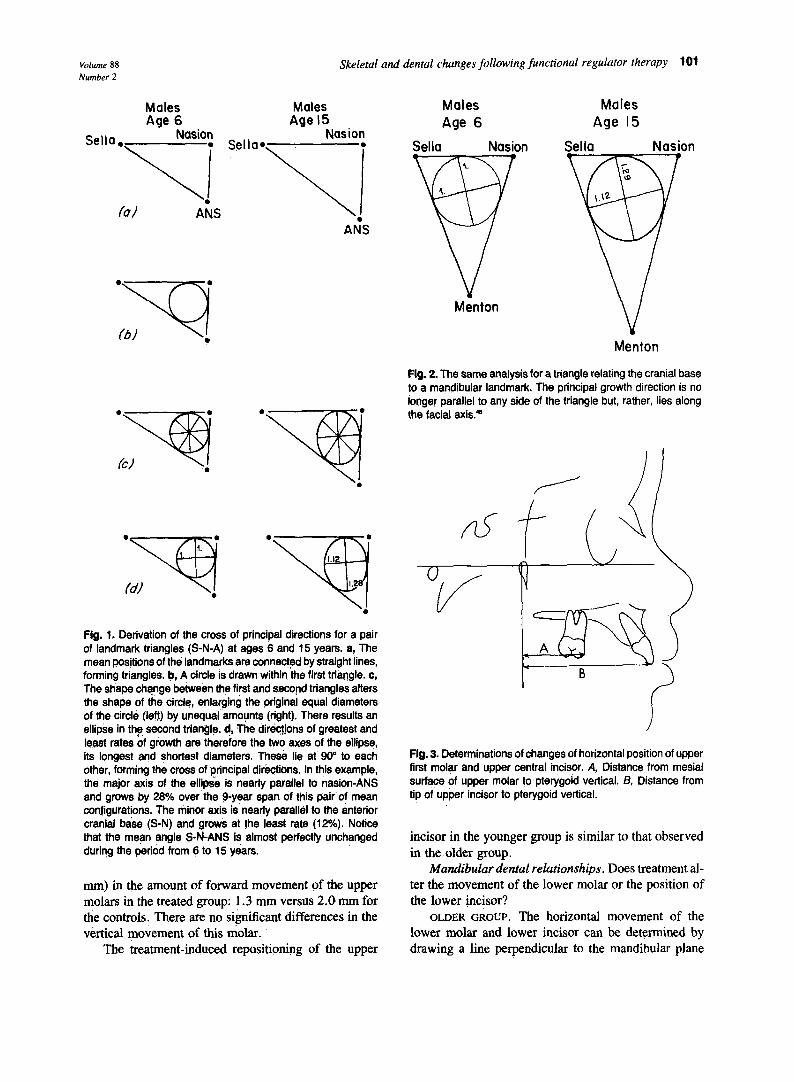
The tensor method requires the construction of tri- angles from sets of three cephalometric landmarks. These triangles are observed in matched pairs, such as initial and final, pretreatment and posttreatment. For example, the landmarks sella (S), nasion (N), and an- terior nasal spine (ANS) can be used to construct pairs of triangles (Fig. 1, A). Represented here are mean forms in The University of Michigan Growth Study” for normal boys at ages 6 and 15.
Inside the first triangle can be drawn a circle that touches the three sides (Fig. 1, B). Inside the circle, all diameters have the same length. The distances be- tween the landmarks increase disproportionately with time, changing the shape of the triangle formed by the landmarks. This shape change, from the first triangle to the second, enlarges the diameters of the original circle by differing amounts (Fig. 1, C), depending on the direction of the diameter measured. The effect of this change in the dimensions of the circle is to distort or transform the circle into an exact ellipse.
There are two facts about the shape of an ellipse that summarize the geometry of shape change. An ellipse has two axes that are at 90” to one another- one the longest and one the shortest diameter. In the transformation of a circle into an ellipse as its associated triangle increases disproportionately in size, the largest rate of growth occurs in the direction of the long axis, and the smallest rate of growth occurs along the short axis. As mentioned earlier, these axes are at 90” to one another.
In the example shown in Fig. 1, D, both axes are parallel to the sides of the triangle. In general, however,
the axes are oblique to the sides of the triangle, as can be seen in Fig. 2 for the triangle sella-nasion-menton.
Both Figs. 1 and 2 show shape changes of relatively large proportions (10% to 20%) over a long period of time (9 years), so that the shape change transforms the circle into something that is obviously not a circle but, rather, an ellipse. The shape changes studied in the course of assessing treatment are much more subtle in magnitude (2% to 4%, corresponding to a few milli- meters of relative movement), as they occur over only about 2 years. Because of the smaller magnitude of change, the transformation from a circle to an ellipse is less obvious; nevertheless, it is there.
To use the tensor method in the specific context of our study and in a general research context, three ad- ditional steps are necessary.46q4s
1. In the study of a growing population, we must study average growth. We do this by deriving a direc- tion of greatest average growth rate and a direction of least average growth rate.
2. We contrast average growth in one population (for example, Frankel patients) with average growth in another population (for example, untreated Class II pa- tients) by a pair of directions. One is the direction of greatest excess growth in the first population compared to that in the second, and the other is the direction of least excess growth (or greatest deficit) in the first pop- ulation compared to that of the second.
3. Statistical methods exist for testing the signifi- cance of any apparent differences in growth as observed in this way.46 The actual statistic computed, a Hotel- ling’s T’, may be reported as an approximate t-ratio with a 5% significance level of about 2.0. Any effect found to be statistically significant is ultimately reported with the use of customized cephalometric variables con- structed for just this purpose: distance measures, angles, and ratios that optimally express the mean shape change or shape comparison actually observed.*
RESULTS Equivalence of starting forms
Before we compare serial changes observed in the treatment groups with those observed in the controls of the same age range, it is necessary to verify that the groups were equivalent in starting form at the beginning of the study. In this part of the article the term srutisticaE significance always refers to the 0.05 level of the con- ventional t statistic. The F statistic of the tables is not the alternate version of this t-test but a test for equality of variance between the groups.
*For further explanation of the mean tensor method, see references 22. 47, and 48.
98 McNumara, Bookstein, und Shuughness\
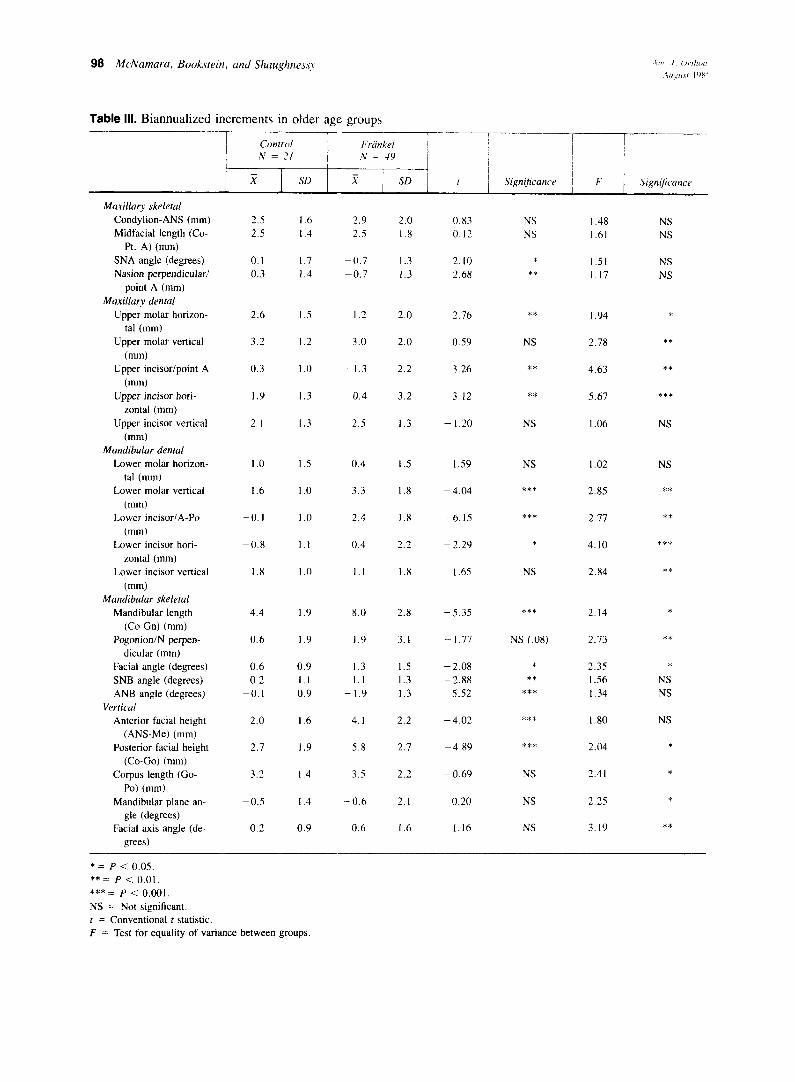
Table III. Biannualized increments in older age groups --
Control Friinkel N = 21 N = 4Y
2 SD x SD t Signijicance b Signijcunce
Maxillary skeletal Condylion-ANS (mm) Midfacial length (Co-
Pt. A) (mm) SNA angle (degrees) Nasion perpendicular/
point A (mm) Maxillary dental
Upper molar horizon- tal (mm)
Upper molar vertical (mm)
Upper incisor/point A (mm)
Upper incisor hori- zontal (mm)
Upper incisor vertical (mm)
Mandibular dental Lower molar horizon-
tal (mm) Lower molar vertical
(mm) Lower incisor/A-PO
(mm) Lower incisor hori-
zontal (mm) Lower incisor vertical
(mm) Mandibular skeletal
Mandibular length (Co-G) (mm)
Pogonion/N perpen- dicular (mm)
Facial angle (degrees) SNB angle (degrees) ANB angle (degrees)
Vertical Anterior facial height
(ANS-Me) (mm) Posterior facial height
(Co-Go) (mm) Corpus length (Go-
PO) (mm) Mandibular plane an-
gle (degrees) Facial axis angle (de-
grees)
2.5 1.6 2.9 2.0 0.83 NS 2.5 I .4 2.5 1.8 0.12 NS
0.1 1.7 -0.7 1.3 2.10 1: 0.3 1.4 -0.7 1.3 2.68 **
2.6 1.5 1.2 2.0 2.16 **
3.2 1.2 3.0 2.0 0.59 NS
0.3 1.0 - 1.3 2.2 3.26 **
1.9 1.3 -0.4 3.2 3.12 **
2.1 1.3 2.5 1.3 - 1.20 NS
I.0 1.5 0.4 1.5 I .59 NS
1.6 1 .o 3.3 1.8 - 4.04 ***
-0.1 1.0 2.4 1.8 -6.15 ***
-0.8 1.1 0.4 2.2 -2.29 1;
1.8 1.0 1.1 1.8 1.65 NS
4.4 1.9 8.0 2.8 -5.35 ***
0.6
0.6 0.2
-0.1
1.9 1.9 3.1 - 1.71
0.9 1.3 1.5 -2.08 1.1 1.1 1.3 -2.88 0.9 - 1.9 1.3 5.52
NS (.08)
* **
***
2.0 1.6 4.1 2.2 -4.02 ***
2.7 5.8 2.7 -4.89 ***
3.2
1.9
I .4
I .4
0.9
3.5 2.2 - 0.69 NS
-0.5
0.2
-0.6 2.1 0.20 NS
0.6 1.6 I.16 NS
I .48 NS 1.61 NS
I .5l NS I. 17 NS
1.94 *
2.78 **
4.63 **
5.67 ***
I .06 NS
1.02 NS
2.85 **
2.77 **
4.10 ***
2.84 **
2.14 *
2.73 **
2.35 *
1.56 NS I .34 NS
1.80 NS
2.04 *
2.41 *
2.25 *
3.19 **
*= P < 0.05. ** = P < 0.01. *** = P < 0.001. NS = Not significant. t = Conventional t statistic. F = Test for equality of variance between groups
Volume 88 Number 2
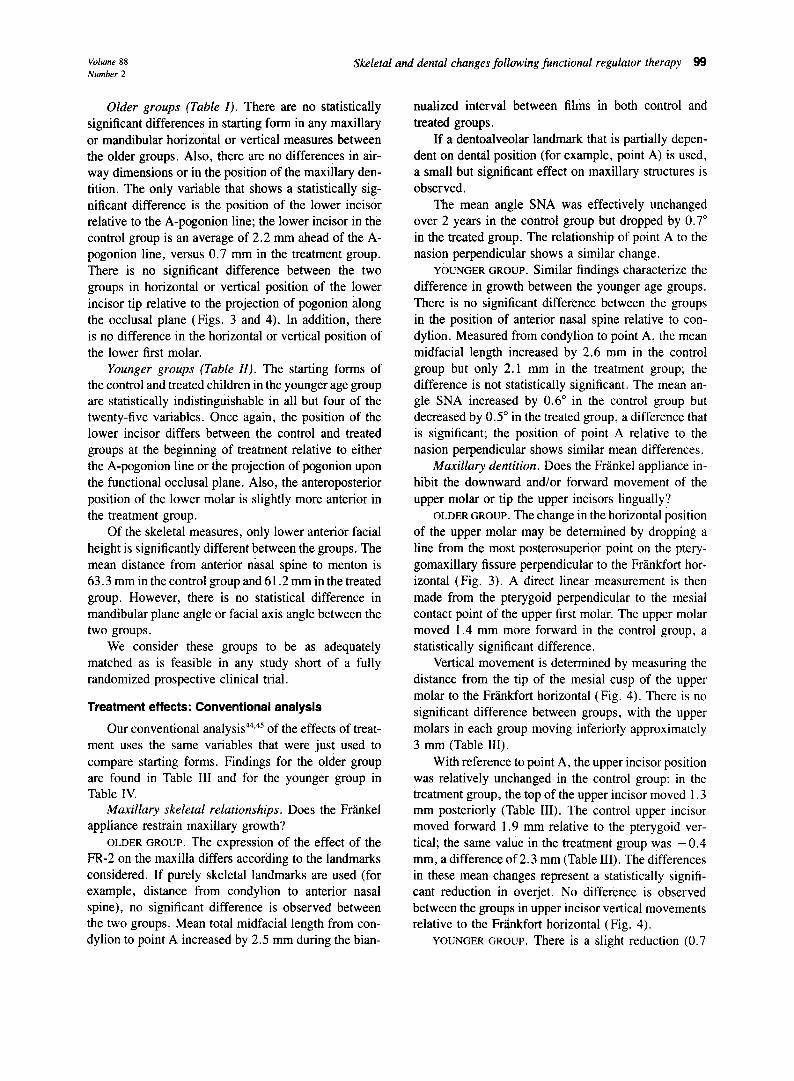
Skeletal and dental changes following functional regulator therapy 99
Older groups (Table I). There are no statistically significant differences in starting form in any maxillary or mandibular horizontal or vertical measures between the older groups. Also, there are no differences in air- way dimensions or in the position of the maxillary den- tition. The only variable that shows a statistically sig- nificant difference is the position of the lower incisor relative to the A-pogonion line; the lower incisor in the control group is an average of 2.2 mm ahead of the A- pogonion line, versus 0.7 mm in the treatment group. There is no significant difference between the two groups in horizontal or vertical position of the lower incisor tip relative to the projection of pogonion along the occlusal plane (Figs. 3 and 4). In addition, there is no difference in the horizontal or vertical position of the lower first molar.
Younger groups (Table ZZ). The starting forms of the control and treated children in the younger age group are statistically indistinguishable in all but four of the twenty-five variables. Once again, the position of the lower incisor differs between the control and treated groups at the beginning of treatment relative to either the A-pogonion line or the projection of pogonion upon the functional occlusal plane. Also, the anteroposterior position of the lower molar is slightly more anterior in the treatment group.
Of the skeletal measures, only lower anterior facial height is significantly different between the groups. The mean distance from anterior nasal spine to menton is 63.3 mm in the control group and 6 1.2 mm in the treated group. However, there is no statistical difference in mandibular plane angle or facial axis angle between the two groups.
We consider these groups to be as adequately matched as is feasible in any study short of a fully randomized prospective clinical trial.
Treatment effects: Conventional analysis
Our conventional analysisU’45 of the effects of treat- ment uses the same variables that were just used to compare starting forms. Findings for the older group are found in Table III and for the younger group in Table IV.
Maxillary skeletal relationships. Does the Frankel appliance restrain maxillary growth?
OLDER GROUP. The expression of the effect of the FR-2 on the maxilla differs according to the landmarks considered. If purely skeletal landmarks are used (for example, distance from condylion to anterior nasal spine), no significant difference is observed between the two groups. Mean total midfacial length from con- dylion to point A increased by 2.5 mm during the bian-
nualized interval between films in both control and treated groups.
If a dentoalveolar landmark that is partially depen- dent on dental position (for example, point A) is used, a small but significant effect on maxillary structures is observed.
The mean angle SNA was effectively unchanged over 2 years in the control group but dropped by 0.7” in the treated group. The relationship of point A to the nasion perpendicular shows a similar change.
YOUNGER GROUP. Similar findings characterize the difference in growth between the younger age groups. There is no significant difference between the groups in the position of anterior nasal spine relative to con- dylion. Measured from condylion to point A, the mean midfacial length increased by 2.6 mm in the control group but only 2.1 mm in the treatment group; the difference is not statistically significant. The mean an- gle SNA increased by 0.6“ in the control group but decreased by 0.5” in the treated group, a difference that is significant; the position of point A relative to the nasion perpendicular shows similar mean differences.
Maxillary dentition. Does the Frankel appliance in- hibit the downward and/or forward movement of the upper molar or tip the upper incisors lingually?
OLDER GROUP. The change in the horizontal position of the upper molar may be determined by dropping a line from the most posterosuperior point on the ptery- gomaxillary fissure perpendicular to the Frankfort hor- izontal (Fig. 3). A direct linear measurement is then made from the pterygoid perpendicular to the mesial contact point of the upper first molar. The upper molar moved 1.4 mm more forward in the control group, a statistically significant difference.
Vertical movement is determined by measuring the distance from the tip of the mesial cusp of the upper molar to the Frankfort horizontal (Fig. 4). There is no significant difference between groups, with the upper molars in each group moving inferiorly approximately 3 mm (Table III).
With reference to point A, the upper incisor position was relatively unchanged in the control group; in the treatment group, the top of the upper incisor moved 1.3 mm posteriorly (Table III). The control upper incisor moved forward 1.9 mm relative to the pterygoid ver- tical; the same value in the treatment group was -0.4 mm, a difference of 2.3 mm (Table III). The differences in these mean changes represent a statistically signifi- cant reduction in overjet. No difference is observed between the groups in upper incisor vertical movements relative to the Frankfort horizontal (Fig. 4).
YOUNGER GROUP. There is a slight reduction (0.7
100 M<,Namarct, Bookstein, and Shaughnesq
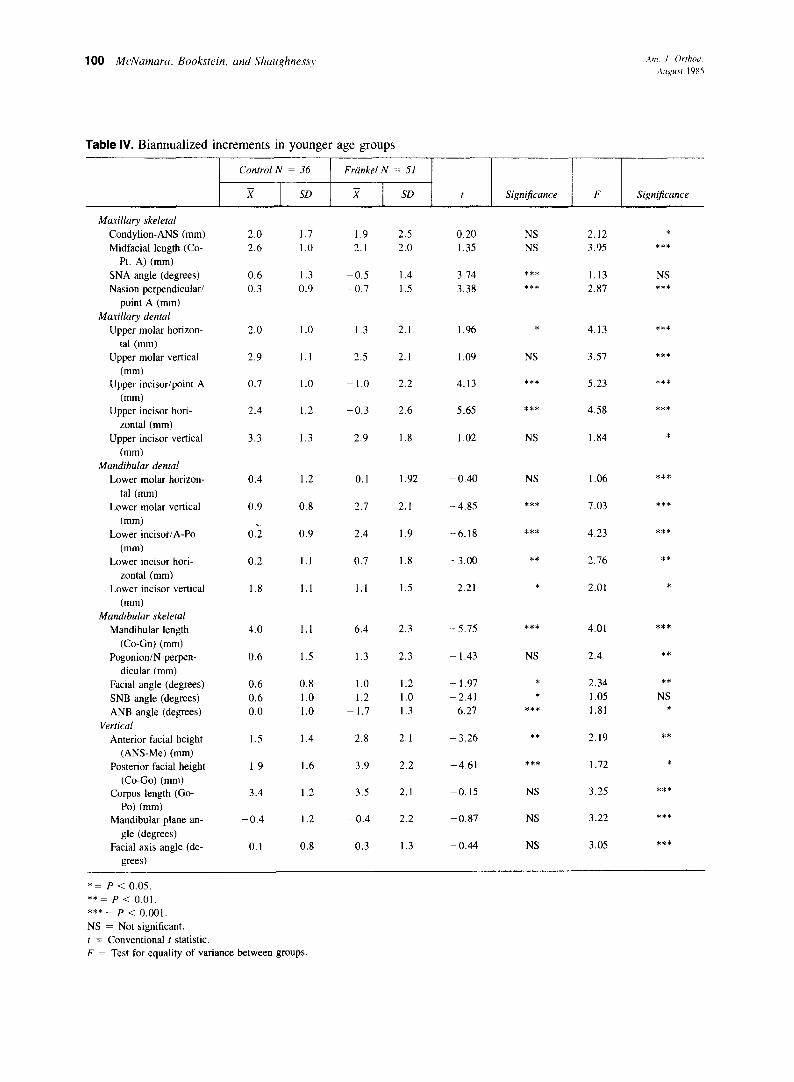
Table IV. Biannuaiized increments in younger age groups
Control N = 36 Friinkel N = 51
j? SD x SD t Significance F Significance
Maxillary skeletal Condylion-ANS (mm) Midfacial length (Co-
Pt. A) (mm) SNA angle (degrees) Nasion perpendicular/
point A (mm) Maxillary dental
Upper molar horizon- tal (mm)
Upper molar vertical
(mm) Upper incisor/point A
(mm) Upper incisor hori-
zontal (mm) Upper incisor vertical
(mm) Mandibular dental
Lower molar horizon- tal (mm)
Lower molar vertical (mm)
Lower incisor/A-PO (mm)
Lower incisor hori- zontal (mm)
Lower incisor vertical (mm)
Mandibular skeletal Mandibular length
(Co-Gn) (mm) Pogonion/N perpen-
dicular (mm) Facial angle (degrees) SNB angle (degrees) ANB angle (degrees)
Vertical Anterior facial height
(ANS-Me) (mm) Posterior facial height
(Co-Go) (mm) Corpus length (Go-
PO) (mm) Mandibular plane an-
gle (degrees) Facial axis angle (de-
grees)
2.0 1.7 1.9 2.5 0.20 NS 2.12 *
2.6 1 .o 2.1 2.0 1.35 NS 3.95 ***
0.6 1.3 -0.5 1.4 3.74 *** 1.13 NS 0.3 0.9 -0.7 1.5 3.38 *** 2.87 ***
2.0 1.0 1.3 2.1 1.96 * 4.13 ***
2.9 1.1 2.5 2.1 1.09 NS 3.57 ***
0.7 1.0 - I.0 2.2 4.13 *** 5.23 ***
2.4 1.2 -0.3 2.6 5.65 *** 4.58 ***
3.3 1.3 2.9 1.8 1.02 NS 1.84 *
0.4 1.2 0.1 1.92 -0.40 NS 1.06 ***
0.9
0.2
0.8 2.7 2.1 -4.85 *** 7.03 ***
0.9 2.4 -6.18 *** 4.23 ***
0.2 1.1 0.7
1.9
1.8 -3.00 ** 2.76 **
1.8 1.1 1.1 1.5 2.21 * 2.01 *
4.0 1.1 6.4 2.3 -5.75 *** 4.01 ***
0.6
0.6 0.6 0.0
1.5 - 1.43 NS 2.4 **
0.8 1.0 1.0
1.3 2.3
1.0 1.2 1.2 1.0
- 1.7 1.3
-1.97 * 2.34 **
-2.41 * 1.05 NS 6.21 *** 1.81 *
1.5
1.9
3.4
-0.4
0.1
1.4 2.8 2.1
3.9 2.2
3.5 2.1
-0.4 2.2
0.3 1.3
-3.26 ** 2.19
1.6 -4.61 *** 1.72
1.2 -0.15 3.25
1.2 -0.87
NS
NS
NS
3.22
0.8 -0.44 3.05
**
*
***
***
***
*= P < 0.05. **= P < 0.01. ***= P < 0.001. NS = Not significant. t = Conventional t statistic. F = Test for equality of variance between groups
Volume 88 Number 2
Skeletal and dental changes following functional regulator therapy 101
Males Age 6
Sella. Nasion .
\I Cal Ak
. . w /b/ .
Males Age 15
Nas ion Sella* .
\I A&
Males Age 6
Sella Nasion
M&ton
Males Age I5
Sella Nasion
Menton
Flg. 2. The same analysis for a triangle relating the cranial base to a mandibular landmark. The principal growth direction is no longer parallel to any side of the triangle but, rather, lies along
;B; ‘y the facial axis.”
.
Fig. 1. Derivation of the cross of principal directions for a pair of landmark triangles (S-N-A) at ages 6 and 15 years. a, The mean positions of the landmarks are connected by straight lines, forming triangles. b, A circle is drawn within the first triangle. c, The shape change between the first and’second triangles alters the shape of the circle, enlarging the prlginal equal diameters of the circle (left) by unequal amounts (right). There results an ellipse in the second trian‘gle. d, The direqtjons of greatest and least rates of growth are therefore the two axes of the ellipse, its longest and shortest diameters. These lie at 90” to each other, forming the cross of principal directions. In this example, the major axis of the ellipse is nearly parallel to nasion-ANS and grows by 26% over the g-year span of this pair.of mean configurations. The minor axis is nearly parallel to the anterior cranial base (S-N) and grows at the least rate (12%). Notice that the mean angle S-N-ANS is almost perfectly unchanged during the period from 6 to 15 years.
mm) in the amount of forward movement of the upper molars in the treated group: 1.3 mm versus 2.0 mm for the controls. There are no significant differences in the vertical movement of this molar.
The treatment-induced repositioning of the upper
Fig. 3. Determinations of changes of horizontal position of upper first molar and upper central incisor. A, Distance from mesial surface of upper molar to pterygoid vertical. B, Distance from tip of upfxsr incisor to pterygoid vertical.
incisor in the younger group is similar to that observed in the older group.
Mandibular dental relationships. Does treatment al- ter the movement of the lower molar or the position of the lower incisor?
OLDER GROUP. The horizontal movement of the lower molar and lower incisor can be determined by drawing a line perpendicular to the mandibular plane
102 McNamara, Bookstein, and Shaughnessy
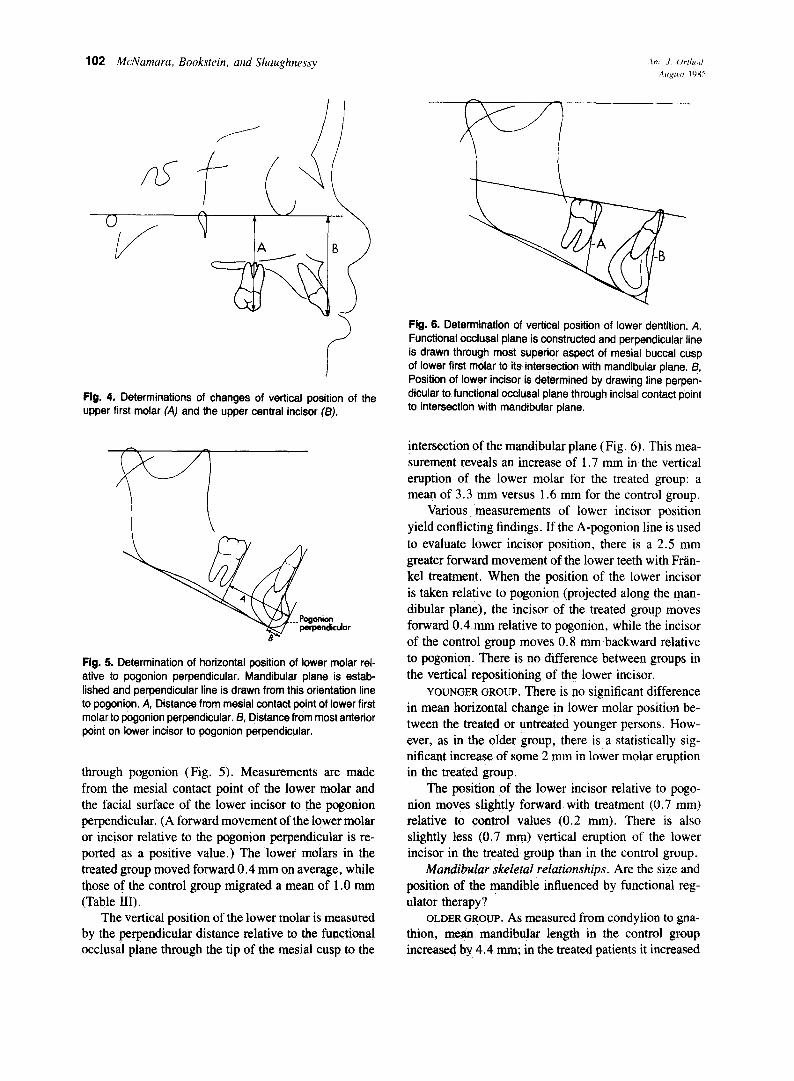
Fig. 4. Determinations of changes of vertical position of the upper first molar (A) and the upper central incisor f/3).
Fig. 5. Determination of horizontal position of lower molar rel- ative to pogonion perpendicular. Mandibular plane is estab- lished and perpendicular line is drawn from this orientation line to pogonion. A, Distance from mesial contact point of lower first molar to pogonion perpendicular. 8, Distance from most anterior point on lower incisor to pogonion perpendicular.
through pogonion (Fig. 5). Measurements are made from the mesial contact point of the lower molar and the facial surface of the lower incisor to the pogonion perpendicular. (A forward movement of the lower molar or incisor relative to the pogonion perpendicular is re- ported as a positive value.) The lower molars in the treated group moved forward 0.4 mm on average, while those of the control group migrated a mean of 1 .O mm (Table III).
The vertical position of the lower molar is measured by the perpendicular distance relative to the functional occlusal plane through the tip of the mesial cusp to the
Fig. 6. Determination of vertical position of lower dentition. A, Functional occlusal plane is constructed and perpendicular line is drawn through most superior aspect of mesial buccal cusp of lower first motar to its intersection with mandibular plane. 6, Position of lower incisor is determined by drawing line perpen- dicular to functional occlusal plane through incisal contact point to intersection with mandibular plane.
intersection of the mandibular plane (Fig. 6). This mea- surement reveals an increase of 1.7 mm in the vertical eruption of the lower molar for the treated group: a mean of 3.3 mm versus 1.6 mm for the control group.
Various measurements of lower incisor position yield conflicting findings. If the A-pogonion line is used to evaluate lower incisor position, there is a 2.5 mm greater forward movement of the lower teeth with Fdn- kel treatment. When the position of the lower incisor is taken relative to pogonion (projected along the man- dibular plane), the incisor of the treated group moves forward 0.4 mm relative to pogonion, while the incisor of the control group moves 0.8 mm backward relative to pogonion. There is no difference between groups in the vertical repositioning of the lower incisor.
YOUNGER GROUP. There is no significant difference in mean horizontal change in lower molar position be- tween the treated or untreated younger persons. How- ever, as in the older group, there is a statistically sig- nificant increase of some 2 mm in lower molar eruption in the treated group.
The position of the lower incisor relative to pogo- nion moves slightly forward with treatment (0.7 mm) relative to control values (0.2 mm). There is also slightly less (0.7 mm) vertical eruption of the lower incisor in the treated group than in the control group.
Mandibular skeletat relationships. Are the size and position of the mandible influenced by functional reg- ulator therapy?
OLDER GROUP. As measured from condylion to gna- thion, mean mandibular length in the control group increased by 4.4 mm; in the treated patients it increased
Volume 88 Number 2
Skeletal and dental changes following functional regulator therapy 103
5.0
5.5 i.5 5:5
Nasion
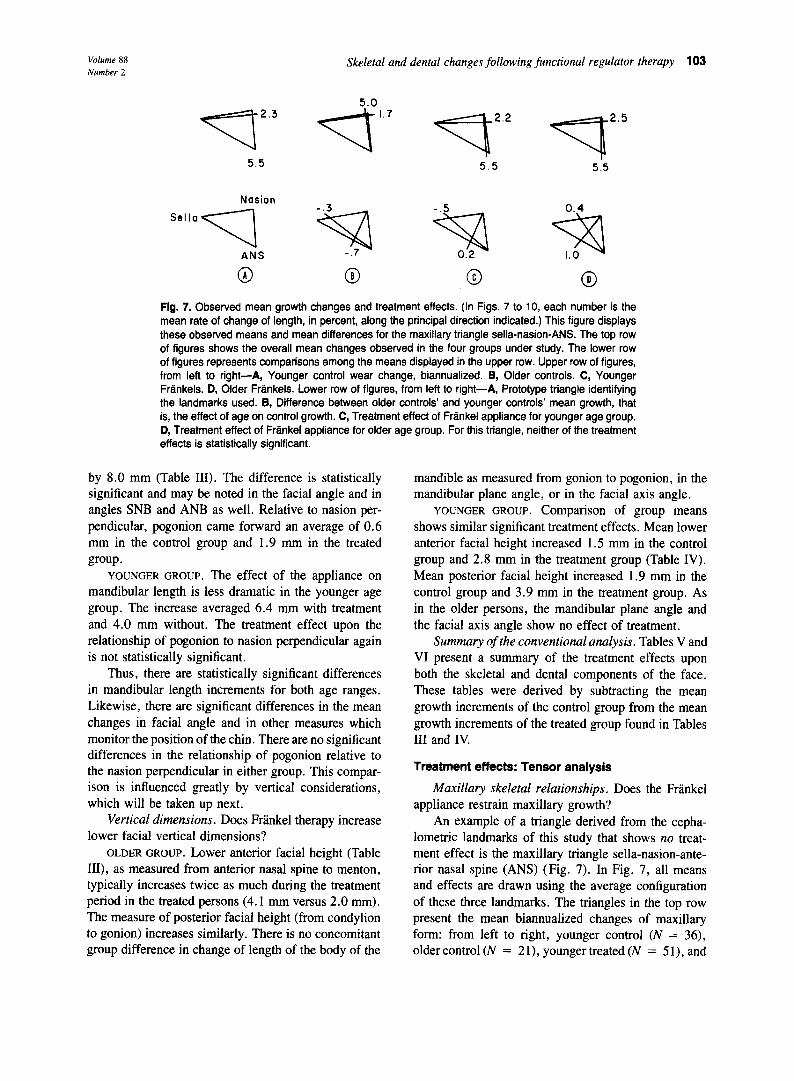
Flg. 7. Observed mean growth changes and treatment effects. (In Figs. 7 to 10, each number is the mean rate of change of length, in percent, along the principal direction indicated.) This figure displays these observed means and mean differences for the maxillary triangle sella-nasion-ANS. The top row of figures shows the overall mean changes observed in the four groups under study. The lower row of figures represents comparisons among the means displayed in the upper row. Upper row of figures, from left to right-A, Younger control wear change, biannualized. B, Older controls. C, Younger Frankels. D, Older Frankels. Lower row of figures, from left to right-A, Prototype triangle identifying the landmarks used. 8, Difference between older controls’ and younger controls’ mean growth, that is, the effect of age on control growth. C, Treatment effect of Frankel appliance for younger age group. D, Treatment effect of Frankel appliance for older age group. For this triangle, neither of the treatment effects is statistically significant.
by 8.0 mm (Table III). The difference is statistically significant and may be noted in the facial angle and in angles SNB and ANB as well. Relative to nasion per- pendicular, pogonion came forward an average of 0.6 mm in the control group and 1.9 mm in the treated group.
YOUNGER GROUP. The effect of the appliance on mandibular length is less dramatic in the younger age group. The increase averaged 6.4 mm with treatment and 4.0 mm without. The treatment effect upon the relationship of pogonion to nasion perpendicular again is not statistically significant.
Thus, there are statistically significant differences in mandibular length increments for both age ranges. Likewise, there are significant differences in the mean changes in facial angle and in other measures which monitor the position of the chin. There are no significant differences in the relationship of pogonion relative to the nasion perpendicular in either group. This compar- ison is influenced greatly by vertical considerations, which will be taken up next.
Vertical dimensions. Does Frankel therapy increase lower facial vertical dimensions?
OLDER GROUP. Lower anterior facial height (Table III), as measured from anterior nasal spine to menton, typically increases twice as much during the treatment period in the treated persons (4.1 mm versus 2.0 mm). The measure of posterior facial height (from condylion to gonion) increases similarly. There is no concomitant group difference in change of length of the body of the
mandible as measured from gonion to pogonion, in the mandibular plane angle, or in the facial axis angle.
YOUNGER GROUP. COmpariSOn Of group IWAl'lS shows similar significant treatment effects. Mean lower anterior facial height increased 1.5 mm in the control group and 2.8 mm in the treatment group (Table IV). Mean posterior facial height increased 1.9 mm in the control group and 3.9 mm in the treatment group. As in the older persons, the mandibular plane angle and the facial axis angle show no effect of treatment.
Summary of the conventional analysis. Tables V and VI present a summary of the treatment effects upon both the skeletal and dental components of the face. These tables were derived by subtracting the mean growth increments of the control group from the mean growth increments of the treated group found in Tables III and IV
Treatment effects: Tensor analysis
Maxillary skeletal relationships. Does the Fr&kel appliance restrain maxillary growth?
An example of a triangle derived from the cepha- lometric landmarks of this study that shows no treat- ment effect is the maxillary triangle sella-nasion-ante- rior nasal spine (ANS) (Fig. 7). In Fig. 7, all means and effects are drawn using the average configuration of these three landmarks. The triangles in the top row present the mean biannualized changes of maxillary form: from left to right, younger control (N = 36), older control (N = 21), younger treated (N = 51), and
104 McNamara, Bookstein, und Shaughness>
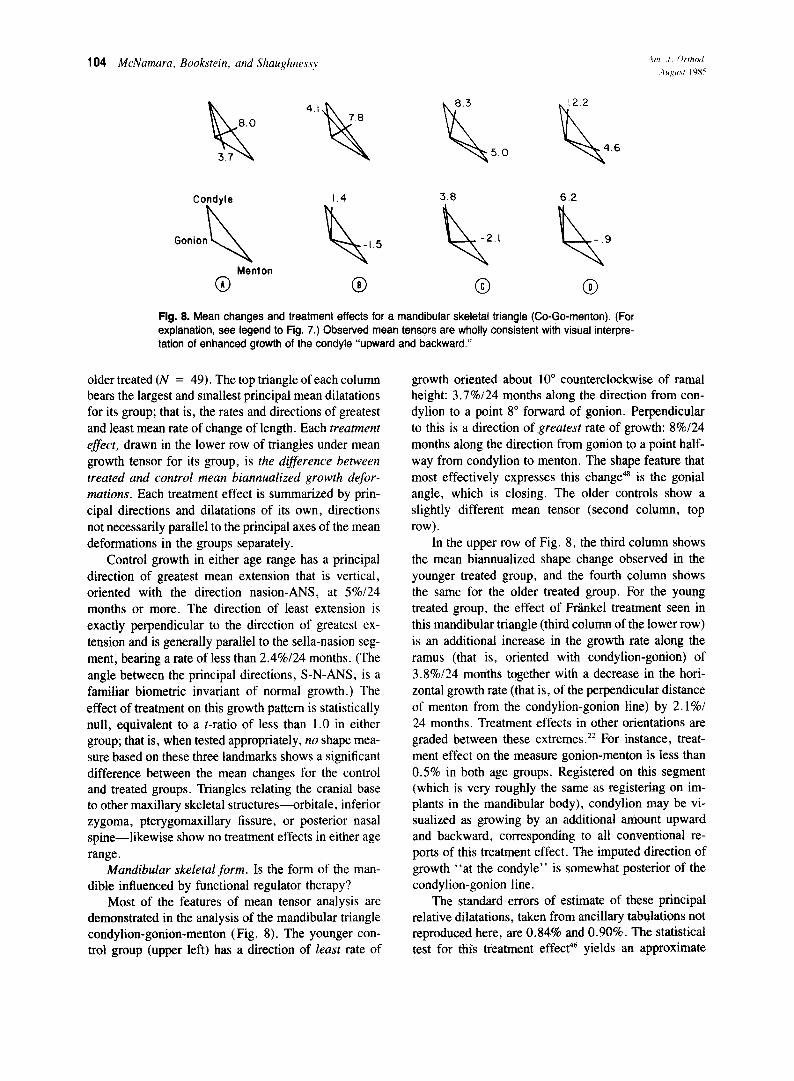
Fig. 8. Mean changes and treatment effects for a mandibular skeletal triangle (Co-Go-menton). (For explanation, see legend to Fig. 7.) Observed mean tensors are wholly consistent with visual interpre- tation of enhanced growth of the condyle “upward and backward.”
older treated (N = 49). The top triangle of each column bears the largest and smallest principal mean dilatations for its group; that is, the rates and directions of greatest and least mean rate of change of length. Each treatment effect, drawn in the lower row of triangles under mean growth tensor for its group, is the dijference between treated and control mean biannualized growth defor- mations. Each treatment effect is summarized by prin- cipal directions and dilatations of its own, directions not necessarily parallel to the principal axes of the mean deformations in the groups separately.
Control growth in either age range has a principal direction of greatest mean extension that is vertical, oriented with the direction nasion-ANS, at 5%/24 months or more. The direction of least extension is exactly perpendicular to the direction of greatest ex- tension and is generally parallel to the sella-nasion seg- ment, bearing a rate of less than 2.4%/24 months. (The angle between the principal directions, S-N-ANS, is a familiar biometric invariant of normal growth.) The effect of treatment on this growth pattern is statistically null, equivalent to a t-ratio of less than 1.0 in either group; that is, when tested appropriately, no shape mea- sure based on these three landmarks shows a significant difference between the mean changes for the control and treated groups. Triangles relating the cranial base to other maxillary skeletal structures-orbitale, inferior zygoma, pterygomaxillary fissure, or posterior nasal spine-likewise show no treatment effects in either age range.
Mandibular skeletal form. Is the form of the man- dible influenced by functional regulator therapy?
Most of the features of mean tensor analysis are demonstrated in the analysis of the mandibular triangle condylion-gonion-menton ( Fig. 8). The younger con- trol group (upper left) has a direction of least rate of
growth oriented about 10” counterclockwise of ramal height: 3.7%/24 months along the direction from con- dylion to a point 8” forward of gonion. Perpendicular to this is a direction of greatest rate of growth: 8%/24 months along the direction from gonion to a point half- way from condylion to menton. The shape feature that most effectively expresses this change4’ is the gonial angle, which is closing. The older controls show a slightly different mean tensor (second column, top row).
In the upper row of Fig. 8, the third column shows the mean biannualized shape change observed in the younger treated group, and the fourth column shows the same for the older treated group. For the young treated group, the effect of Frankel treatment seen in this mandibular triangle (third column of the lower row) is an additional increase in the growth rate along the ramus (that is, oriented with condylion-gonion) of 3.8%/24 months together with a decrease in the hori- zontal growth rate (that is, of the perpendicular distance of menton from the condylion-gonion line) by 2.1%/ 24 months. Treatment effects in other orientations are graded between these extremes.” For instance, treat- ment effect on the measure gonion-menton is less than 0.5% in both age groups. Registered on this segment (which is very roughly the same as registering on im- plants in the mandibular body), condylion may be vi- sualized as growing by an additional amount upward and backward, corresponding to all conventional re- ports of this treatment effect. The imputed direction of growth “at the condyle” is somewhat posterior of the condylion-gonion line.
The standard errors of estimate of these principal relative dilatations, taken from ancillary tabulations not reproduced here, are 0.84% and 0.90%. The statistical test for this treatment effecp6 yields an approximate
Volume 88 Number 2
Skeletal and dental changes following functional regulator therapy 105
2.2 2.8 9.8 11.0
0.3 -0.8
Gonion qen+on 2A -Oh $&
0.5 0 @ 0 @
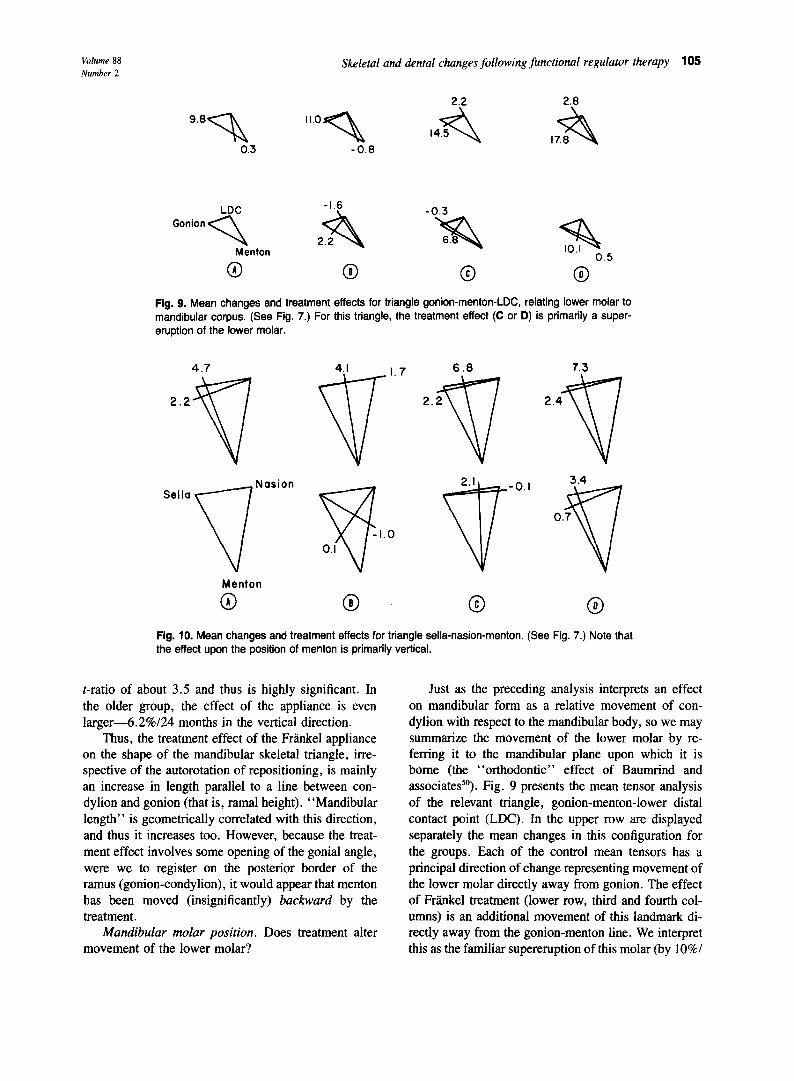
Fig. 9. Mean changes and treatment effects for triangle gonion-menton-LDC, relating lower molar to mandibular corpus. (See Fig. 7.) For this triangle, the treatment effect (C or D) is primarily a super- eruption of the lower molar.
4.7
Menton
0 0
7.3
2.4
Tl
3.4
0.7
v
@
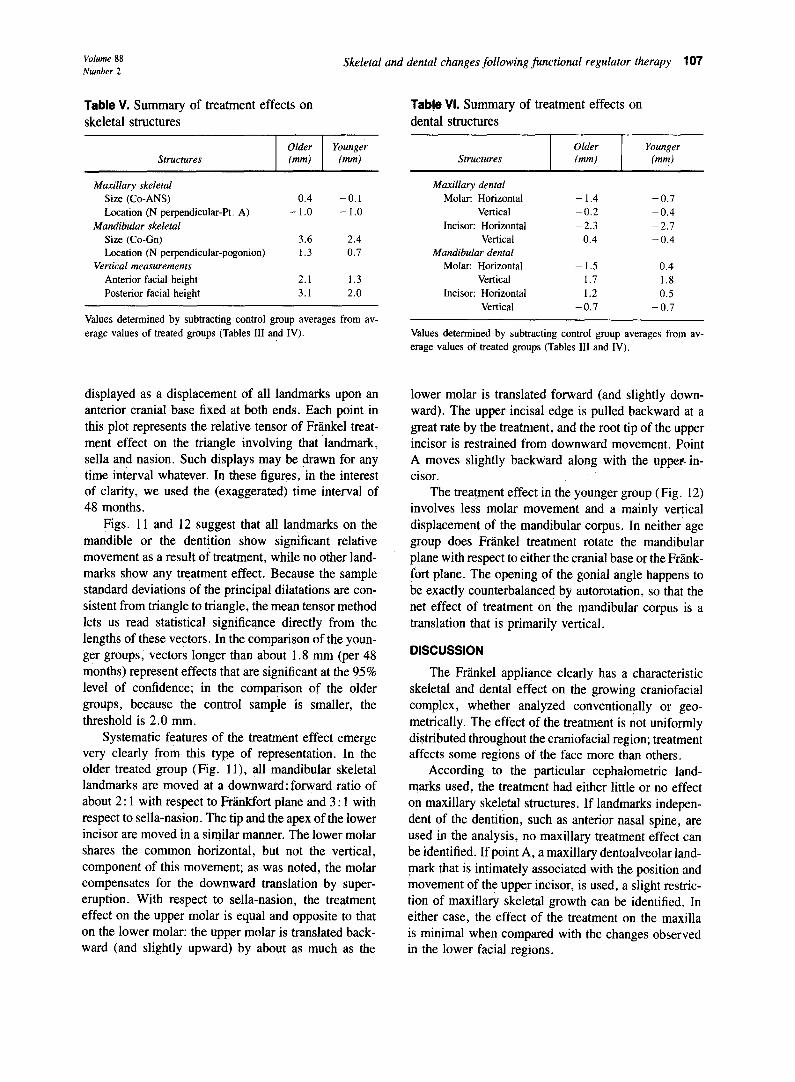
Flg. 10. Mean changes and treatment effects for triangle sella-nasion-menton. (See Fig. 7.) Note that the effect upon the position of menton is primarily vertical.
t-ratio of about 3.5 and thus is highly significant. In the older group, the effect of the appliance is even larger-6.2%/24 months in the vertical direction.
Thus, the treatment effect of the Friinkel appliance on the shape of the mandibular skeletal triangle, irre- spective of the autorotation of repositioning, is mainly an increase in length parallel to a line between con- dylion and gonion (that is, ramal height). “Mandibular length” is geometrically correlated with this direction, and thus it increases too. However, because the treat- ment effect involves some opening of the gonial angle, were we to register on the posterior border of the ramus (gonion-condylion), it would appear that menton has been moved (insignificantly) backward by the treatment.
Mandibular molar position. Does treatment alter movement of the lower molar?
Just as the preceding analysis interprets an effect on mandibular form as a relative movement of con- dylion with respect to the mandibular body, so we may summarize the movement of the lower molar by re- ferring it to the mandibular plane upon which it is borne (the “orthodontic” effect of Baumrind and associates”). Fig. 9 presents the mean tensor analysis of the relevant triangle, gonion-menton-lower distal contact point (LDC). In the upper row are displayed separately the mean changes in this configuration for the groups. Each of the control mean tensors has a principal direction of change representing movement of the lower molar directly away from gonion. The effect of FrSnkel treatment (lower row, third and fourth col- umns) is an additional movement of this landmark di- rectly away from the gonion-menton line. We interpret this as the familiar supereruption of this molar (by lo%/

106 McNamura, Bookstein, and Shaughness?
Fig. 11. Because it does not affect superior structures, the Fran- kel treatment effect may be displayed as a displacement vector at each landmark after registration upon any convenient base- line (as, for instance, sella-nasion). The vectors displayed have been doubled in length for ease of illustration. Displacements of all mandibular landmarks and all maxillary dental landmarks are statistically significant by appropriate T* test. The treatment effects upon all other landmarks are not significant. This figure displays the treatment effects for the older age group.
24 months of its usual distance from the line) together with a negligible backward component. The approxi- mate t-ratio for differences in shape change for this triangle is 4.1 in the younger treated groups and 4.4 in the older groups.
Mandibular skeletal position. Is the relative posi- tion of the mandible affected by functional regulator therapy?
The net effect of treatment on chin position, a com- bination of changes in mandibular form with changes consequent upon autorotation, may be summarized in the relation of a representative landmark such as menton to the anterior cranial base (Fig. 10). The mean change of form for the younger controls is the usual growth axis of our normative sample.48 The older control pat- tern is more characteristic of a Class II sample. For the younger treated patients, the additional deformation in- duced by treatment is a purely downward extension by some 2.1%/24 months; the equivalent t-ratio is 3.2, and the effect is highly significant. In the older treated group, treatment effect is aligned with the usual growth axis; treatment has increased the ordinary rate of growth in that direction by some 3.4%/24 months. Our previous report of Frlnkel treatment tensors** did not subset ac-
Fig. 12. Vector representation of treatment effect for younger age group. (See Fig. 11.)
cording to age, and thus represented an average of these two geometries.
Compodta dkgfam of all treatment &facts
The stability of superior structures suggests a short- cut to the display of treatment effect geometry: a reg- istration on the entire unaffected region. Any mean tensor may be construed4’ as a displacement of one vertex in a registration upon two others after correction for change in the distance between them. In particular, the change in the relation of any landmark to the sella- nasion segment may be modeled as a change in scale of the entire configuration, so that sella and nasion remain at the same distance, followed by a displacement of the landmark with respect to the sella-nasion base- line, now Jixed at both ends. (This is not equivalent to the usual sella-nasion registration, which registers only at sella and uses nasion only for orientation; it is a registration at both sella and nasion, by change of scale whenever necessary.)
The anterior cranial base segment sella-nasion changes little during treatment: it grows by an average of 0.84 mm/year in the younger controls, 0.79 mm/ year in the younger treated patients, 0.64 mm/year in the older controls, and 0.91 mm/year in the older treated patients. If we are willing to ignore these differences (0.05 mm/year or 0.28 mm/year), we can treat the anterior cranial base as fixed under treatment, requiring no “change of scale, ” and relate all the other landmarks to sella and nasion at the same time. There result the vector diagrams of Figs. 11 (older treatment effect) and 12 (younger treatment effect), in which treatment is
Volume 88 Number 2
Skeletal and dental changes following functional regulator therapy 107
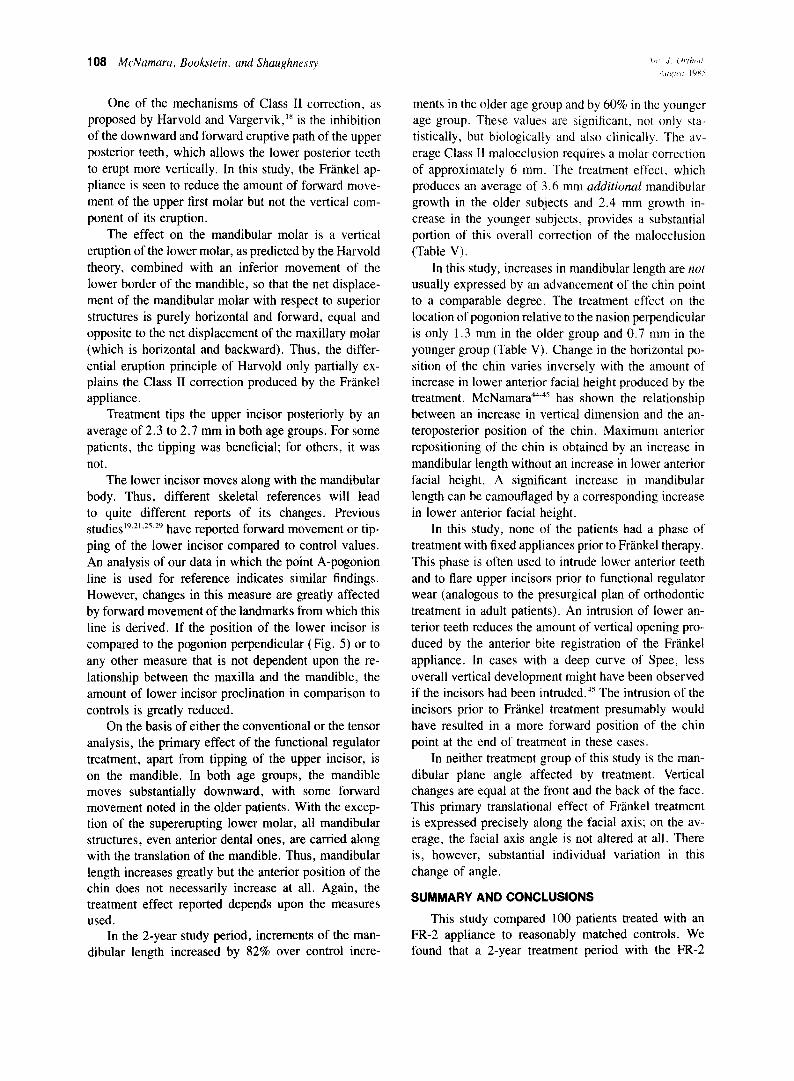
Table V. Summary of treatment effects on skeletal structures
Structures
Maxillary skeletal Size (Co-ANS) Location (N perpendicular-Pt. A)
Mandibular skeletal Size (Co-Cm) Location (N perpendicular-pogonion)
Vertical measurements Anterior facial height Posterior facial height
Older Y0WlgtT (mm) 04
0.4 -0.1 - 1.0 - 1.0
3.6 2.4 1.3 0.7
2.1 1.3 3.1 2.0
Values determined by subtracting control group averages from av- erage values of treated groups (Tables III and IV).
displayed as a displacement of all landmarks upon an anterior cranial base fixed at both ends. Each point in this plot represents the relative tensor of Frankel treat- ment effect on the triangle involving that landmark, sella and nasion. Such displays may be drawn for any time interval whatever. In these figures, ‘in the interest of clarity, we used the (exaggerated) time interval of 48 months.
Figs. 11 and 12 suggest that all landmarks on the mandible or the dentition show significant relative movement as a result of treatment, while no other land- marks show any treatment effect. Because the sample standard deviations of the principal dilatations are con- sistent from triangle to triangle, the mean tensor method lets us read statistical significance directly from the lengths of these vectors. In the comparison of the youn- ger groups, vectors longer than about 1.8 mm (per 48 months) represent effects that are significant at the 95% level of confidence; in the comparison of the older groups, because the control sample is smaller, the threshold is 2.0 mm.
Systematic features of the treatment effect emerge very clearly from this type of representation. In the older treated group (Fig. 1 l), all mandibular skeletal landmarks are moved at a downward:forward ratio of about 2 : 1 with respect to Frankfort plane and 3 : 1 with respect to sella-nasion. The tip and the apex of the lower incisor are moved in a similar manner. The lower molar shares the common horizontal, but not the vertical, component of this movement; as was noted, the molar compensates for the downward translation by super- eruption. With respect to sella-nasion, the treatment effect on the upper molar is equal and opposite to that on the lower molar: the upper molar is translated back- ward (and slightly upward) by about as much as the
Table Vi. Summary of treatment effects on dental structures
Older Younger Structures (mm) (mm)
Maxillary dental Molar: Horizontal - 1.4 -0.7
Vertical -0.2 -0.4 Incisor: Horizontal -2.3 -2.7
Vertical 0.4 -0.4 Mandibular dental
Molar: Horizontal - 1.5 0.4 Vertical 1.7 1.8
Incisor: Horizontal 1.2 0.5 Vertical -0.7 -0.7
Values determined by subtracting control group averages from av- erage values of treated groups (Tables III and IV).
lower molar is translated forward (and slightly down- ward). The upper incisal edge is pulled backward at a great rate by the treatment, and the root tip of the upper incisor is restrained from downward movement. Point A moves slightly backward along with the upper- in- cisor.
The treatment effect in the younger group (Fig. 12) involves less molar movement and a mainly vertical displacement of the mandibular corpus. In neither age group does Frarrkel treatment rotate the mandibular plane with respect to either the cranial base or the Frlnk- fort plane. The opening of the gonial angle happens to be exactly counterbalanced by autorotation, so that the net effect of treatment on the mandibular corpus is a translation that is primarily vertical.
DISCUSSION
The Frankel appliance clearly has a characteristic skeletal and dental effect on the growing craniofacial complex, whether analyzed conventionally or geo- metrically. The effect of the treatment is not uniformly distributed throughout the craniofacial region; treatment affects some regions of the face more than others.
According to the particular cephalometric land- marks used, the treatment had either little or no effect on maxillary skeletal structures. If landmarks indepen- dent of the dentition, such as anterior nasal spine, are used in the analysis, no maxillary treatment effect can be identified. If point A, a maxillary dentoalveolar land- mark that is intimately associated with the position and movement of the upper incisor, is used, a slight restric- tion of maxillary skeletal growth can be identified. In either case, the effect of the treatment on the maxilla is minimal when compared with the changes observed in the lower facial regions.
108 McNamara, Bookstein, and Shaughnesq
One of the mechanisms of Class I1 correction, as proposed by Harvold and Vargervik,‘* is the inhibition of the downward and forward eruptive path of the upper posterior teeth, which allows the lower posterior teeth to erupt more vertically. In this study, the Frankel ap- pliance is seen to reduce the amount of forward move- ment of the upper first molar but not the vertical com- ponent of its eruption.
The effect on the mandibular molar is a vertical eruption of the lower molar, as predicted by the Harvold theory, combined with an inferior movement of the lower border of the mandible, so that the net displace- ment of the mandibular molar with respect to superior structures is purely horizontal and forward, equal and opposite to the net displacement of the maxillary molar (which is horizontal and backward). Thus, the differ- ential eruption principle of Harvold only partially ex- plains the Class II correction produced by the Frinkel appliance.
Treatment tips the upper incisor posteriorly by an average of 2.3 to 2.7 mm in both age groups. For some patients, the tipping was beneficial; for others, it was not.
The lower incisor moves along with the mandibular body. Thus, different skeletal references will lead to quite different reports of its changes. Previous studies’9,2’.25.29 have reported forward movement or tip- ping of the lower incisor compared to control values. An analysis of our data in which the point A-pogonion line is used for reference indicates similar findings. However, changes in this measure are greatly affected by forward movement of the landmarks from which this line is derived. If the position of the lower incisor is compared to the pogonion perpendicular (Fig. 5) or to any other measure that is not dependent upon the re- lationship between the maxilla and the mandible, the amount of lower incisor proclination in comparison to controls is greatly reduced.
On the basis of either the conventional or the tensor analysis, the primary effect of the functional regulator treatment, apart from tipping of the upper incisor, is on the mandible. In both age groups, the mandible moves substantially downward, with some forward movement noted in the older patients. With the excep- tion of the supererupting lower molar, all mandibular structures, even anterior dental ones, are carried along with the translation of the mandible. Thus, mandibular length increases greatly but the anterior position of the chin does not necessarily increase at all. Again, the treatment effect reported depends upon the measures used.
In the 2-year study period, increments of the man- dibular length increased by 82% over control incre-
ments in the older age group and by 60% in the younger age group. These values are significant, not only sta- tistically, but biologically and also clinically. The av- erage Class II malocclusion requires a molar correction of approximately 6 mm. The treatment effect, which produces an average of 3.6 mm additional mandibular growth in the older subjects and 2.4 mm growth in- crease in the younger subjects, provides a substantial portion of this overall correction of the malocclusion (Table V).
In this study, increases in mandibular length are not
usually expressed by an advancement of the chin point to a comparable degree. The treatment effect on the location of pogonion relative to the nasion perpendicular is only 1.3 mm in the older group and 0.7 mm in the younger group (Table V). Change in the horizontal po- sition of the chin varies inversely with the amount of increase in lower anterior facial height produced by the treatment. McNamaraUm4’ has shown the relationship between an increase in vertical dimension and the an- teroposterior position of the chin. Maximum anterior repositioning of the chin is obtained by an increase in mandibular length without an increase in lower anterior facial height. A significant increase in mandibular length can be camouflaged by a corresponding increase in lower anterior facial height.
In this study, none of the patients had a phase of treatment with fixed appliances prior to Frankel therapy. This phase is often used to intrude lower anterior teeth and to flare upper incisors prior to functional regulator wear (analogous to the presurgical plan of orthodontic treatment in adult patients). An intrusion of lower an- terior teeth reduces the amount of vertical opening pro- duced by the anterior bite registration of the Frankel appliance. In cases with a deep curve of Spee, less overall vertical development might have been observed if the incisors had been intruded.45 The intrusion of the incisors prior to Frankel treatment presumably would have resulted in a more forward position of the chin point at the end of treatment in these cases.
In neither treatment group of this study is the man- dibular plane angle affected by treatment. Vertical changes are equal at the front and the back of the face. This primary translational effect of Frankel treatment is expressed precisely along the facial axis; on the av- erage, the facial axis angle is not altered at all. There is, however, substantial individual variation in this change of angle.
SUMMARY AND CONCLUSIONS
This study compared 100 patients treated with an FR-2 appliance to reasonably matched controls. We found that a 2-year treatment period with the FR-2
Volume 88 Number 2
Skeletal and dental changes following functional regulator therapy 109
appliance has significant effects on specific skeletal and dental dimensions of growing persons. The main find- ings are as follows:
1. The appliance has little or no effect on maxillary skeletal structures, depending upon the landmarks mea- sured:The effect on the position of point A reflects the treatment effect on underlying dental elements.
2. The forward movement expected of the maxil- lary molar is reduced (0.7 to 1.4 mm), but the normal vertical movement is not reduced.
3. There is some upper incisor tipping in a lingual direction (2.3 to 2.7 mm).
4. There is tipping of the lower incisors (0.5 to 1.2 mm).
5. There is increased vertical eruption of the lower molar (1.7 to 1.8 mm). There is no horizontal advance- ment of these teeth with respect to the mandibular body, but there is substantial advancement with respect to maxillary structures.
6. Fdnkel treatment displaces the mandibular body parallel to itself along the facial axis. On the average, the mandibular plane angle and the facial axis angle show no treatment effect; vertical measures of lower facial height show a great treatment effect (1.3 to 3.1 mm); measures of chin position show an effect that varies according to the choice of measure.
For some of the patients in this study, therapeutic results may not have been optimal. It should be recalled that none of the patients had any repositioning of the upper and lower incisors prior to the FrHnkel phase of treatment. Such incisor repositioning may help control vertical increases, which allow greater mandibular ad- vancement. Also, the fabrication of the appliances and the clinical management of cases has improved since the years when most of these treatments were begun. However, in spite of the limitations of this retrospective study, we believe that of all findings in the literature, those cited above are most appropriate for generaliza- tion to other patient groups with a similar malocclusion type and similar treatment protocol. A prospective, ran- domized clinical trial of functional regulator treatment is appropriate at this time.
The authors would like to thank Ms. Kathleen A. O’Connor, Mr. Richard L. Miller, and Mr. Robert L. Wain- right for their help in data management. They also thank Dr. Brainerd F. Swain, Dr. Raymond P. Howe, and Ms. Katherine A. Ribbens for their critical review of the manuscript. The illustrations are by Mr. William L. Brudon and Ms. Teryl Lynn.
REFERENCES 1. Friinkel R: The theoretical concept underlying the treatment with
functional correctors. Trans Em Orthod Sot 42: 233-254. 1966.
2.
3.
4.
8.
9.
10.
11.
12.
13.
14.
15.
16.
17.
18.
19.
20.
21.
22.
Frtiel R: The treatment of Class II, Division 1 malocclusion with functional correctors. AM J ORTHOD 55: 265-275, 1969. Fr%nkel R: Decrowding during eruption under the screening in- fluence of vestibular shields. AM J ORTHOD 65: 372-406, 1974. Fr;inkel R: The artificial translation of the mandible by function regulators. In Cook JT (editor): Transactions of the Third Inter- national Orthodic Congress, St. Louis, 1975, The C.V. Mosby Company. Fr;inkel R: Technik und Handhabung der Funktionsregler, Berlin, 1976, VEB Verlag Volk und Gesundheit. F&e1 R: A functional approach to orofacial orthopedics. Br J Orthod 7: 41-51, 1980. Frlnkel R: Biomechanical aspects of the form/function relation- ship in craniofacial morphogenesis: a clinician’s approach. In McNamara JA Jr, Ribbens KA, Howe RP (editors): Clinical alteration of the growing face, Monograph 14, Craniofacial Growth Series, Ann Arbor, 1983, Center for Human Growth and Development, The University of Michigan. Poulton DR: The influence of extraoral traction. AM J ORTHOD 53: 8-18, 1967. Watson WG: A computerized appraisal of the high-pull face- bow. AM J ORTHOD 62: 561, 1972. Barton JJ: High-pull headgear versus cervical traction: a ceph- alometric comparison. AM J ORTHOD 62: 517-529, 1972. Pfeiffer JP, Grobety D: The Class II malocclusion: differential diagnosis and clinical application of activators, extraoral traction, and fixed appliances. AM J ORTHOD 68: 499-544, 1975. Pfeiffer JP, Grobety D: Simultaneous use of cervical appliance and activator: an orthodontic approach to fixed appliance therapy. AM J ORTHOD 61: 353-373, 1972. Moss JP: Cephalometric changes during functional appliance therapy. Trans Eur Orthod Sot 38: 327-341, 1962. Evald H, Harvold EP: The effect of activators on maxillary- mandibular growth and relationships. AM J ORTHOD 52: 857, 1966. Meach CL: A cephalometric comparison of bony profile changes in Class II, Division 1 patients treated with extraoral force and functional jaw orthopedics. AM J ORTHOD 52: 353-370, 1966. Freunthaller P: Cephalometric observations in Class II, Division 1 malocclusions treated with the activator. Angle Orthod 37: 1% 25, 1967. Hotz R: Application and appliance manipulation of functional forces. AM J ORTHOD 58: 459-478, 1970. Harvold EP, Vargervik K: Morphogenic response to activator treatment. AM J ORTHOD 60: 478-490, 1971. Creekmore TD, Radney LJ: Frlnkel appliance therapy: or- thopedic or orthodontic? AM J ORTHOD 83: 89-108, 1983. Righellis EG: Treatment effects of Frtikel activator and extraoral traction appliances. Angle Orthod 53: 107-121, 1983. Robertson NRE: An examination of treatment changes in chil- dren treated with the function regulator of Frtiel. AM J ORTHOD 83: 299-310, 1983. Bookstein FL: Measuring treatment effects on craniofacial growth. In McNamara JA Jr, Ribbens KA, Howe RP (editors): Clinical alteration of the growing face, Monograph 14, Cranio- facial Growth Series, Ann Arbor, 1983, Center for Human Growth and Development, The University of Michigan.
23. Wilson WL, Wilson RC: Modular mechanics. Denver, 1981, Rocky Mountain Orthodontics.
24. Pancherz H: The mechanism of Class II correction in Herbst appliance treatment: a cephalometric investigation. AM J ORTHOD 82: 104-113, 1982.

110 McNamara, Bookstein, and Shaughnessy
25. Schulhof RJ, Engel GA: Results of Class II functional appliance treatment. J Clin Orthod 16: 587-599, 1982.
26. Bjiirk A: The principle of the Andresen method of orthodontic treatment, a discussion based on cephalometric x-ray analysis of treated cases. AM J ORTHOD 37: 437-458, 1951.
27. Softley JW: Cephalometric changes in seven “postnormal” cases treated by the Andresen method. Dent Ret 73: 485-494, 19.53.
28. Janson I: Skeletal and dentoalveolar changes in patients treated with a bionator during prepubertal and pubertal growth. In McNamara JA Jr, Ribbens KA, Howe RP (editors): Clinical alteration of the growing face, Monograph 14, Craniofacial Growth Series, Ann Arbor, 1983, Center for Human Growth and Development, The University of Michigan.
29. Adams CP: An investigation into indications for and effects of the function regulator. Trans Eur Orthod Sot 45: 293-3 12, 1969.
30. Jakobsson SO: Cephalometric evaluation of treatment effect on Class II, Division 1 malocclusions. AM J ORTHOD 53: 446-457, 1967.
31. Browne RW: A cephalometric study of effective mandibular length changes seen in patients treated with functional jaw or- thopedic appliances. Thesis, The University of Michigan, 1959.
32. Marschner JF, Harris JE: Mandibular growth and Class II treat- ment. Angle Orthod 36: 89-93, 1966.
33. Hlupl K: Zur Frage des Kieferorthopidischen Gelenkumbaues. Fortschr Kieferorthop 19: l-8, 1958.
34. Korkhaus G: Present orthodontic thought in Germany. AM J ORTHOD 46: 270-287, 1960.
35. Tiegelkamp KH: Changes in the region of the mandible and the temporomandibular joint during orthodontic treatment. Trans Eur Orthod Sot 36: 204-223, 1960.
36. Hausser E: Le traitement fonctionnel de la Class II et son influ- ence sur la croissance et le developpement facial. Trans Eur Orthod Sot 44: 247-256, 1968.
37. Frlnkel R, Reiss W: Zur Problematik der Unterkiefermachen- twicklung bei Distalbissfgllen. Fortschr Kieferorthop 31: 345- 355, 1970.
38. Gianelly AA, Brosnan P, Martignoni M, Berstein L: Mandibular growth, condylar position and Frlnkel appliance therapy. Angle Orthod 53: 131-142, 1983.
39. Baumrind S, Kom EL, Molthen R, West EE: Changes in man- dibular dimensions associated with the use of force to retract the maxilla. AM J ORTHOD 79: 17-58, 1981.
40. Scholz RP: Functional regulator of Fra’nkel. AM J ORTHOD 84: 174, 1983.
41. McNamara JA Jr, Huge SA: The Frinkel appliance (FR-2): model preparation and appliance construction. AM J ORTHOD 80: 478-495, 1981.
42. McNamam JA Jr: The Frmel appliance. I. Biological basis and appliance design. J Clin Orthod 16: 320-337, 1982.
43. McNamara JA Jr: The Fdnkel appliance. II. Clinical manage- ment. J Clin Orthod 16: 390-407, 1982.
44. McNamara JA Jr: A method of cephalometric analysis. In McNamara JA Jr, Ribbens KA, Howe RP (editors): Clinical alteration of the growing face, Monograph 14, Craniofacial Growth Series, Ann Arbor, 1983, Center for Human Growth and Development, The University of Michigan.
45. McNamara JA Jr: A method of cephalometric evaluation. AM J ORTHOD 86: 449-469, 1984.
46. Bookstein FL: A statistical method for biological shape com- parisons. J Theor Biol 107: 475-520, 1984.
47. Bookstein FL: On the cephalometrics of skeletal change. AM J ORTHOD 82: 177-198, 1982.
48. Bookstein FL: The geometry of craniofacial growth invariants. AM J ORTHOD 83: 221-234, 1983.
49. Ellis E, McNamara IA Jr: A cephalometric evaluation of max- illary incisor position. (Submitted for publication.)
50. Baumrind S, Kom EL, Isaacson RJ, West EE, Molthen R: Quan- titative analysis of the orthodontic and orthopedic effects of max- illary traction. AM J ORTHOD 84: 384-398, 1983.
5 I. Riolo ML, Moyers RE, McNamara JA Jr, Hunter WS: An atlas of craniofacial growth: cephalometric standards from The Uni- versity School Growth Study, The University of Michigan, Monograph 2, Craniofacial Growth Series, Ann Arbor, 1974, Center for Human Growth and Development, The University of Michigan.
Reprint requests to: Dr. James A. McNamara Center for Human Growth and Development The University of Michigan Ann Arbor, MI 48109