american alligator nesting and reproductive success in ...€¦ · toward the rehabilitation of the...
TRANSCRIPT

FINAL REPORT
American Alligator Nesting and Reproductive Success in Everglades National Park.
An analysis of the systematic reconnaissance flight data (SRF) from 1985 - 1998.
University of Miami - Everglades National Park Cooperative Agreement # CA528-03-902 3: Statistical Analysis of Environmental Factors Influencing Spatial and Temporal Patterns of
American Alligator Nesting in the Southern Everglades.
Prepared by George H. ~alrymple'
Final Version
August 2001
I Everglades Research Group, Inc. 381 North Krome Avenue, Suite 208, Homestead, FL 33030

EXECUTIVE SUMMARY
This report details the analyses of the data from the systematic reconnaissance helicopter flights to identify and study American alligator nests in the Shark Slough region of Everglades National Park from 1985 to 1998. Variable length transects of 500 m width were flown across the Shark River Slough and adjoining water basins to evaluate nesting activity. A total of 849 nests were observed in the aerial flights from 1985 to 1998. 733 (86%) of the nests were from Shark Slough basin. A total of 332 nests were evaluated for the fate of the eggs from all locations and a total of 293 from Shark Slough were studied for preliminary relationships of water levels, rainfall, discharge rates, and ground surface elevations to nest flooding. Over all years, 60% of the eggs hatched. Most nests had no or few eggs flooded, but 19.3% had more than 95% of the eggs in the nests flooded. Preliminary plots of nests by geographic location using GIs software have not demonstrated any strong relationship between location and nest flooding within Shark Slough. The current rain-driven water delivery to the park has greatly reduced the risk of excessive unnatural nest flooding. Remaining goals for the alligator studies include evaluating the effects of additional Everglades restoration projects including the re-establishment of habitat in Northeast Shark Slough and developing effective performance measures for restoration projects.
Key findings
Between 1985 and 1998 a total of 849 nests have been observed on flights of standard transects and 733 or 86O/0 were from Shark River Slough basin.
Before 1993 only nests in the Shark River Slough and Northeast Shark River Slough (NESRS) were surveyed. Since 1993 an additional 6 water basins were included in the surveys. Over the entire 8 water basins surveyed, nests are clearly clumped within the Shark River Slough west of the L67 extension canal. All other basins surveyed had very few nests, including Northeast Shark River Slough.
Within Shark River Slough nest distribution did not appear to be clumped by location or ground surface elevation in any local geographic region.
Alligators did not appear to be selecting nesting sites based on elevation, since nests were distributed throughout the range of elevations in the slough and there was no relationship between ground elevation and nest flooding.
Circumstantial evidence suggests alligators built nests of greater heights above the ground at lower elevations to help avoid flooding, but no field data was available to verify this assumption.
The year with the most nests (on standard flight transects) was 1993. The year with the least nests was 1989.
More alligators built nests in wet years than in dry years, but only a portion (probably 29% - 60%) of the mature female population nested each year regardless of hydrological conditions.
1993 had the most nests observed on standard flight transects, and it also was the only year in which no surveyed nests flooded.
The mid to late 1980's was a period of moderate water levels with a drought period that extended into the wet seasons of 1989 and 1990. The mid to late1990's was a period of higher water levels.

Over all years, 60% of the eggs hatched, which was similar to the hatching rate in previous studies in other areas.
Between 1985 and 1998, 70% of nests (233 of 332 nests ground surveyed) had no eggs flooded, and 20% had more than 94.9% of eggs in nests flooded.
Predation and egg infertility were minor components of nest failure
The high rates of nest flooding reported in a previous study for the years 1978 and 1982 have not been repeated under the rainfall plan for water delivery.
Over the period of the study in Shark Slough basin 38% of the nests flooded in July, 33% in August, and 29% in September.
In July, there was no significant correlation between the percent of nests that flooded per year and maximum stage, total discharge through the S12 gates, or rainfall.
In August, there was a weak but significant correlation between the percentage of nests that flooded and the maximum stage. There was no significant corre'lation between the percent of nests that flooded and either total discharge or rainfall.
In September, there was no correlation between percent of nests that flooded and maximum stage, total discharge, or rainfall.
Overall, nest flooding was very difficult to correlate to hydrological conditions due to the complex temporal and spatial relationship between rainfall, discharge and water level changes.
Analyses indicate that from 1985 to 1989 fewer, but larger average sized females nested and from 1990 to 1998 more but smaller females nested.
While all available evidence suggests that there was no year when all breeding age females nested, our analyses indicated that the total breeding age female population of Shark River Slough was between 760 and 1572 females, with between 29 and 60% possibly breeding in any given year.
Lower water levels in the NESRS, due to a lack of overland flow from the north resulted in few alligator nests. Completion of the Modified Water Delivery project for NESRS is expected to result in an expansion of the geographic range of breeding age alligators.

INTRODUCTION
The systematic reconnaissance flight (SRF) program for the monitoring of American alligator nesting in Everglades National Park was initiated in 1985. This SRF project was designed to obtain species level data on the system wide improvements that were expected from the implementation of a new water delivery program, the rainfall plan, and the planned redistribution of flow south of U.S. 41 into the Shark River Slough and Northeast Shark River Slough (sometimes called the "Mod-Waters" or Modified Water Delivery Plan). These changes were originally incorporated in the Northeast Shark River Slough General Design Memorandum of 1990 (ACOE, 1990; Light and Dineen, 1994, see below). The South Florida Water Management District operation schedule for delivery of waters through the S-12 gates into the park followed "The Rainfall Plan (1985 - present), which linked timing and quantities of deliveries to upstream weather conditions and flow that was spatially redistributed closer to the way it was prior to construction of Water Conservation Area 3" (Light and Dineen, 1994:79). The new delivery schedule for flows through the flood control structures (S-12A - S12D, Fig. 1) was operated by the State of Florida's South Florida Water Management District. Under this program the flow volumes and timing were to be regulated in relation to the regional rainfall. The goal was to more closely mimic the natural flows of water through the wetlands and to avoid unnecessary flooding of alligator nests as well as unintended impacts to other components of the flora and fauna, including the wading bird assemblage.
Previous research on egg mortality due to nest flooding between 1975 and 1982 in the park stated that " . . . rainwater was retained in reservoirs and when released caused a rapid increase in water levels in the study area. These increased water levels were delayed in timing from the rainfall events that ultimately caused them; we suggest that they may have been implicated to some degree (italics added here for emphasis) in flooding of alligator nests in two of the three years of high mortality" (Kushlan and Jacobsen, 1990:177). The SRF program was initiated in part to evaluate the effects of rain-driven flows into the park and evaluate the progress toward the rehabilitation of the Northeast Shark River Slough (NESRS) region.
The main goal of the SRF alligator nest surveys is to get a relative estimate of year to year and regional variation in nesting effort and reproductive success of the American alligator in the park. Secondary to this are objectives such the identification of the sources of nest failure, and the development of performance measures for restoration goals in the greater Everglades ecosystem (see below). Far down the list of goals is the use of the data to estimate absolute population numbers of alligators in the Everglades National Park. In analysis of aerial survey data it is possible to develop a very strong dependency upon derived estimates of absolute numbers, and to base all additional analyses on these derived estimates. It is our philosophy to avo~d such dependency upon derived estimates in the early stages of analysis, and rather, to rely upon the raw data to identify tendencies, patterns and trends. Only when this conservative level of analys~s is complete, and consensus on the interpretation of the results is obtained, does it seem appropriate to extrapolate to one or several estimates of absolute numbers for further analyses We therefore see the latter estimates as less important than a thorough analysis of the actual data.
Importance to restoration.
Restoration of the southern Everglades is known to require re-establishing a more natural hydropattern. This will require structural changes in the canals, levees, and locks that deliver and control water in the region. Wherever it is found, the activities of the alligator have led to the use of the term "keystone" species to emphasize its ecological importance in wetlands dynamics (Craighead, 1968; Mazzotti and Brandt, 1994). Alligators are a top predator in Everglades wetlands and help to shape the trophic-dynamics of the ecosystem. Alligators excavate and maintain "gator holes" that serve as refugia during the dry season. Without alligators there are fewer ponds to serve as dry season refugia for fishes and aquatic invertebrates and, therefore,

less prey for the populations of wood storks and other wading birds. Alligator nests also serve as important oviposition sites for other reptiles. Hydrological conditions are known to have direct and indirect effects on the percent of the female population nesting, the percent of the eggs in nests that flood, and the growth rates and condition of young alligators (Jacobsen and Kushlan, 1989; Kushlan and Jacobsen 1990; Dalrymple, 1996, 1998). Water management practices have even been thought by some to have shifted the distribution of alligators. While much evidence exists to suggest that the central Shark River Slough (including Northeast Shark River Slough) is core habitat for nesting alligators others have suggested that "The alligator was historically most abundant in peripheral Everglades marshes and freshwater mangrove habitats but is now most abundant in canals and the deeper slough habitats of the central Everglades. Drainage of peripheral wetlands and increasing salinity in mangrove wetlands as a result of decreased flows has limited the occurrence of alligators in these habitats (Mazzotti and Brandt 1997)" (ACOE, 2001:37). To what extent the core distribution of the alligator was central slough versus peripheral wetlands and mangrove habitats may be answered by the current attempts to add significantly to the volume of freshwater flows to the southern Everglades. Efforts to determine the current and future distribution and habitat use by the American alligator are fundamental tasks for Everglades' restoration projects. For all of these reasons the Science Sub Group Report of 1993 listed "Restore pre-drainage alligator reproductive patterns" as an ecological restoration objective on page 57 (Weaver et al, 1993).
The Comprehensive Everglades Restoration Program (CERP), formerly known as the Central and Southern Florida Project Comprehensive Review, or the "Restudy" (ACOE 1999) incorporates the use of breeding potential models (developed as part of the ATLSS program) for numerous endangered and important species of wildlife to be employed in evaluating alternatives (U. S. ACOE 1999). At the current time, the USGS is developing one such breeding potential model for the American alligator as part of this effort (Palmer and Rice, 2000). The Everglades National Park's SRF alligator data are extremely valuable to the National Park Service in their evaluations of alternative greater Everglades restoration planning, engineering efforts, hydrological modeling, and independent evaluation of breeding potential models for this species. By organizing the SRF alligator database and analyzing nesting success in relation to hydropattern alternatives proposed, the National Park Service will have an independent method for assessing the impacts of suggested water management modifications on this keystone species within the parkf s boundaries.
METHODS
The SRF used a systematic pattern of East-West transect lines extending beyond the boundaries of the park spaced at 2 km intervals North-South. The flights were performed from a helicopter flying at 40 m above the ground surface at a ground speed of 50 knots. There was an observer on each side of the helicopter counting all nests in a belt approximately 250 m in width. The total area surveyed was approximately one fourth of the total area of each 2 km2 grid section of the region (the transect in each grid cell was 2000 m long and 500 m wide). The helicopter was flown over each nest and the location was recorded using a Geographic Positioning System. Initial flights were undertaken at or soon after July 1'' of the year, because previous studies had demonstrated that this was the average oviposition date in the region (Kushlan and Jacobsen, 1990; D. M. Fleming, unpublished).
Nests were surveyed from Shark River Slough and Northeast Shark River Slough basins from the onset of the project. An additional 6 basins were added to the surveys in 1993. These basins included an extension of the Shark River Slough in the mangrove estuary, portions of the southern Big Cypress National Preserve, East Slough, Northern and Southern Taylor Slough basins, and the Eastern panhandle (Fig. 1).

After the initial flights were completed, a series of nests were selected for ground visits to examine the eggs. A minimum of 20 percent of the estimated total nests in the area surveyed was sampled each year. The estimated total number of nests was assumed to be approximately 4 times the number of nests observed in the flight transects. There was only a loose correlation between the number of surveyed nests and this estimate of total nests. This was partially due to the fact that early staff calculated the total nests based on a Jolly Seber Model 2 mark recapture method (Fleming 1991), whereas later staff used the more parsimonious estimate of 4 times the observed number for determining the 20 percent sample size (0. L. Bass, Jr. Pers. Comm.). The geographic distribution of the ground sampled nests was chosen to broadly overlap the distribution of the nests observed during the flights.
A minimum of one visit (maximum of 7 visits) was made to each nest during the incubation period. Visits were made at intervals of approximately 2 weeks. At the initial visit the number of eggs were counted and the number of viable eggs was estimated based upon the presence of a band around the egg. At each follow up visit the fate of the eggs was categorized as healthy, unbanded or infertile, hatched, predated, flooded or not viable due to other causes (primarily crushing). Eggs were categorized as infertile because they did not show the typical banding around the egg shell seen in fertile eggs (Ferguson, 1985; Webb et al, 1987) and in follow up visits these eggs did not result in hatchlings; it would be possible to lump this category with the category called "other", but there would be a loss of information for future comparisons. At some nests, all the eggs were flooded upon the first visit and the staff did not count the eggs but merely listed it as 100 percent flooded. When these nest values are added to the values for nests where each egg was counted it leads to a minor inconsistency in the annual calculation of percent of eggs in categories, i.e. some tabulations of the fate of eggs do not add up to exactly 100 percent, but It was felt that a more complete picture of nest flooding was obtained by including as many nests as possible. The values were all standardize to 100 percent for each year.
Each line of data in the existing database needed to be checked for accuracy. Some nests did not turn out be true nests, some nests were not located upon ground truthing. Some nests had inaccurate egg counts due to inconsistencies in field data recording methods, because some eggs were removed as part of another study (an ATLSS study of alligator egg content and composition). In any given year, some nests that were ground surveyed or merely counted from the air were not actually within the 500 m band used for counting, this was due to unavoidable errors associated with estimating distances from the helicopter. In order to maintain consistency, such nests were excluded from the dataset, after the fact, by calculating the UTM's for the 500 m widths along line transects and including only those nests that fell within the 500 m wide transect boundaries, (We recommend that this procedure be followed in future years to avoid wasted effort, see below).
An unpublished USGS topographic map for Everglades National Park with elevation values taken at 200 meter intervals was overlain on the distribution of nests each year to estimate the ground surface elevations at which nests were laid.
Project Management and Hurricane Andrew.
Two notable events took place for this project in 1992. 0 . L. Bass, Jr. became a co- principal investigator with D. M. Fleming, and Hurricane Andrew struck the region in August 1992 All sampling during the 1992 season was done by both Bass and Fleming in order to allow for continuity in sampling protocols. Sampling for alligator nesting and hatching was completed in September 1992 after the hurricane struck. However 11 of the 13 nests that were reported as completely flooded out in 1992 were reported by August lS', three weeks before the hurricane Due to a complete lack of data for most gauges, including NP203, analyses of August 1992 stage used the partial data set from P33. Hurricane Andrew was characterized as a fast moving, compact storm with moderate to low levels of rainfall accompanying the high winds. By 1993 the
6
follow-up studies performed indicated that, while there had been serious impacts to upland forested communities, there had been no serious impact to the marsh ecosystem from the storm (Armentano et al, 1995).
Metric vs. English Measures
For this internal final report to Everglades National Park, we have left all the measurements of rainfall, flows, elevations (NGVD 1929), and water depths in English measures. This is the scale normally used by the agencies in day to day discussions and planning. For publication purposes, all measurements should be listed in both English and metric values.
Limitations
Some preliminary analyses for the SRF alligator project produced for draft in-house reports had summary tables or figures regarding nests dimensions in relation to water levels, and nest locations in relation to soil and vegetation (site selection studies that suggested that alligators preferred muck soil with tall sawgrass for nesting). The latter data .may have been collected on the ground at the time a nest was examined, but no field notes including this information were available. It was possible that soil and vegetation information were extrapolated from vegetation maps, but this would have a rather high level of error associated with the exact locations of nests. The previous in-house reports mention some measurements of the height of the bottom of the egg chambers of nests that were recorded in 1985 and 1986, but the data was not in the park's database. The raw data was not available in any report or database at the time the current report was prepared. Both 0. L. Bass, Jr. and G. H. Dalrymple have gone through all the existing boxes of information that were left at the South Florida Resource Management Center and have not found additional data. It was possible that such data was lost or destroyed in Hurricane Andrew in 1992, because all of the information was collected prior to that storm. The only data from this time period was some water depth data at some nests. In the years 1994 to 1998, water depths were taken at most nests on most visits, however the heights of the bottom of the egg chamber were not measured. Since we only have the pre- and post-flood water depth data without information on the height of the bottom of the egg chamber it was impossible to determine whether nest flooding was due to exceptionally high water at a nest or whether those nests had particularly low egg chambers ("low nests"). Finally, while visual estimates of female size were made in some years, almost all of them are "approximately 6 feet" and so no analysis to directly compare observed female size to clutch size was possible. In the discussion section we include comments and suggestions on ways to improve the program.
In any event, there remains a shortage of information on nest dimensions in relation to proximal water depths during incubation, on nest location in relation to soil and vegetation attributes, and on female size in relation to clutch size and egg mass. At the end of the Discussion section (see below), recommendations on potential types of additional information that should be collected in future will be discussed.
RESULTS AND DISCUSSION
Hydrologic conditions.
The mid to late 1980's were characterized as moderate to low surface water while the mid to late 1990's were characterized as a high water period (Fig. 2). The South Florida Water Management District operation schedule for delivery of waters through the S-12 gates into the park followed the rainfall plan (1 985 - present). The rainfall plan for water delivery permitted a
7
wide range of flows through the floodgates in some months in some years. What the schedule helped to prevent were brief but large pulses of water released through the gates that were not related to any rainfall event, but were merely related to flood control for the urban and agricultural areas.
Total Nests Observed
A total of 849 nests were observed in the 8 basins in the aerial flights from 1985 to 1998. The vast majority of alligator nesting occurred in the Shark River Slough. 733 ( 86%) of the nests were from Shark River Slough, 50 were from Northeast Shark River Slough (NESRS), 34 from East Slough, 4 from Northern Taylor Slough, 16 from Southern Taylor Slough (including Long Pine Key), 2 for the Eastern Panhandle, 9 from Shark River Slough's mangrove estuary, 1 from Southern Big Cypress (south of U.S. 41; Tab. 1; Fig 3). Surveys only covered Shark River Slough and NESRS until 1992, and there were too few nests in NESRS to identify any patterns. Restricting our comments to Shark River Slough for the period of record, it was clear from the graph of the number of nests per year that there was a break in the data at 1992 (Fig.4). The mean number of nests per year from 1985 to 1991 was 23.7 while the mean was 81 from 1992 to 1998. There were significantly fewer nests from 1985 to 1991 than between .I 992 and 1998 (t = - 4.503, p = 0.04). The year 1993 not only had the most nests observed on standard flight transects, it was also the only year in which no eggs in any surveyed nests flooded, see below.
The remaining basins had very few nests reported and no trends are identifiable to date. There were 34 nests observed in East Slough since 1993 (Tab. 1) and only ten of these were ground truthed during that period. The year 1996 stands out for East Slough, because there were 12 nests observed in that year, while all previous years had 2 or 3 or 4 nests. In the following year, 1997 there were no nests observed in East Slough. In 1998 there were 9 nests in East Slough.
North Taylor Slough had a total of only 4 nests observed since 1993, and Southern Taylor SloughILong Pine Key had a total of 16 nests in the same 7 years. The year with the most nests in Southern Taylor Slough was 1992 with 7 nests. The higher water years of the late 1990's actually had fewer nests observed, the total per year ranging from 0 to 2 nests since 1995.
In the Shark River Slough mangrove estuary zone there was a total of 9 nests since 1993, with most years having no, one or two nests. The year with the highest number of nests was 1996 with 5 nests. In the Eastern Panhandle the only year with any nests (two nests) was 1994. The Southern Big Cypress (south of U.S. 41) had a single nest reported in 1997.
Fate of Eggs in Ground Truthed Nests.
A total of 332 nests were evaluated for the fate of the eggs from 1985 to 1998 (mean nests sampled per year was 23.7, s.e. = 3.195, range = 4 to 47; Fig. 5). 293 nests were from Shark River Slough, 26 nests were from Northeast Shark River Slough, 10 from East Slough, 2 from Shark River Slough's mangrove estuary, and one from Long Pine KeyINorth Taylor Slough. Averaging over all years and using standardized percentages (to allow for inclusion of nests where a total egg count was not done, but where all eggs were listed as flooded), 60% of the eggs hatched, 23% were flooded and the remainder was divided approximately equally among the categories 'predated', 'unbanded' and 'other' (Tab. 2). There was a significant difference among the years in the percent of the eggs per nest that flooded (F = 4.311, d. f. = 13, 318 , p < 0.001; this test was based only on nests where an actual count of all eggs was included in the database). The years with the most flooding were 1988, 1992 and 1997. Year 1988 had the highest average percent of eggs flooded per nest (63.2%, Tab. 2). Even in years with no nest flooding some eggs were lost due to predation and crushing, etc., and the number of eggs characterized as infertile was not correlated to the other categories.
8

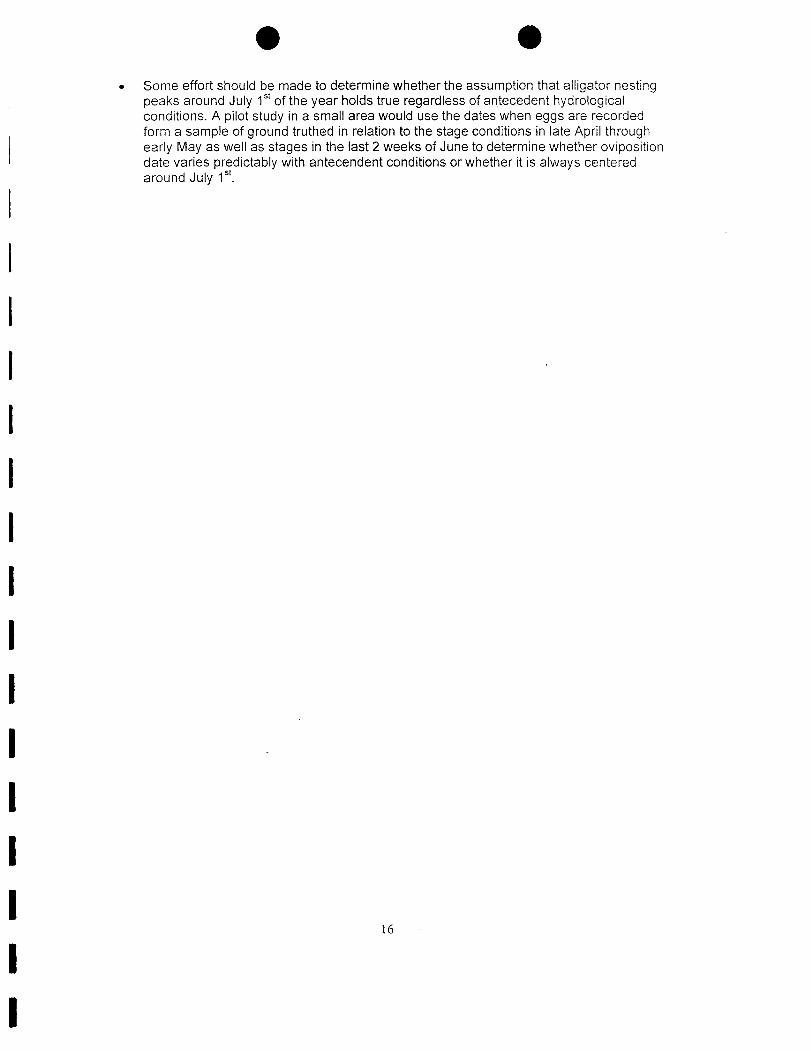
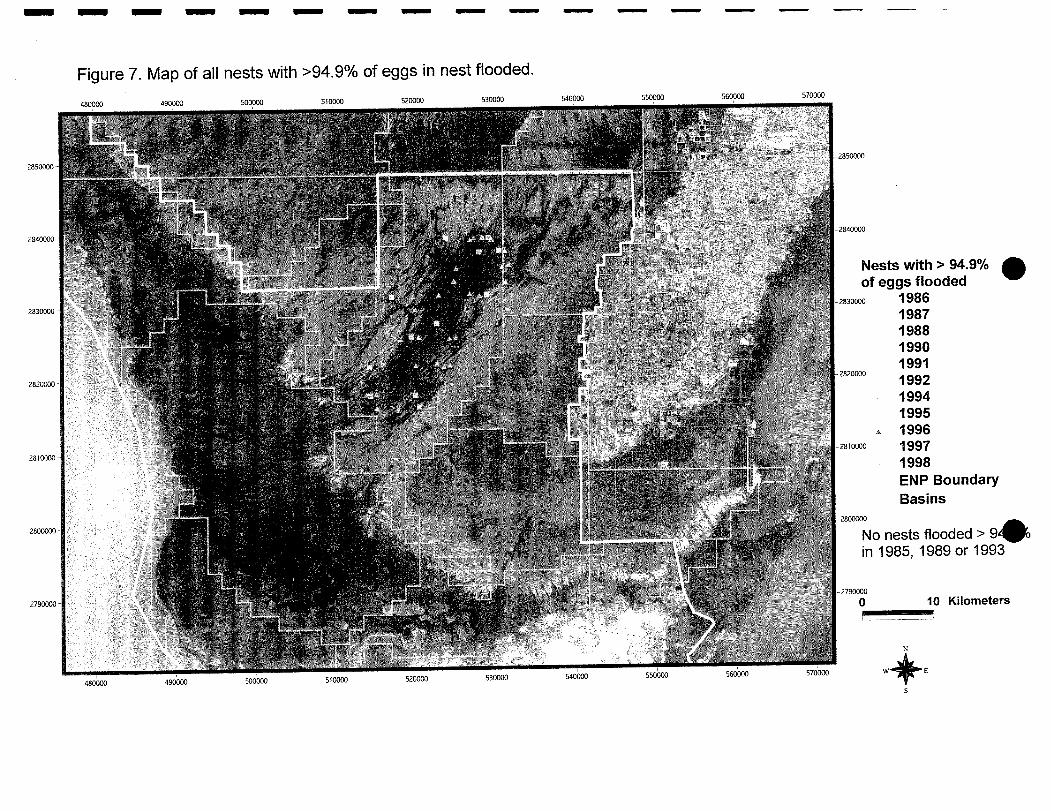
The vast majority of nests had no eggs flooded or were completely flooded (Fig. 6). This distinction between flooded and not flooded nests made further analyses of 'flooded nest' simpler, because we simply focused on nests with more than 94.9% of the eggs flooded. The distribution of flooded nests showed no clear geographic pattern among years (Fig. 7) or by percent flooding (Fig. 8).
Shark River Slough basin was the focus of most analyses because it was the basin with the majority of data and the only basin with a large enough sample extending to the beginning of the project in 1985. In the total sample of ground surveyed nests from the Shark Slough basin only 20% of the nests had more than 95% of the eggs in the nests flooded (Tab. 3).
Distribution of Nests in Relation to Topography of the Shark River Slough
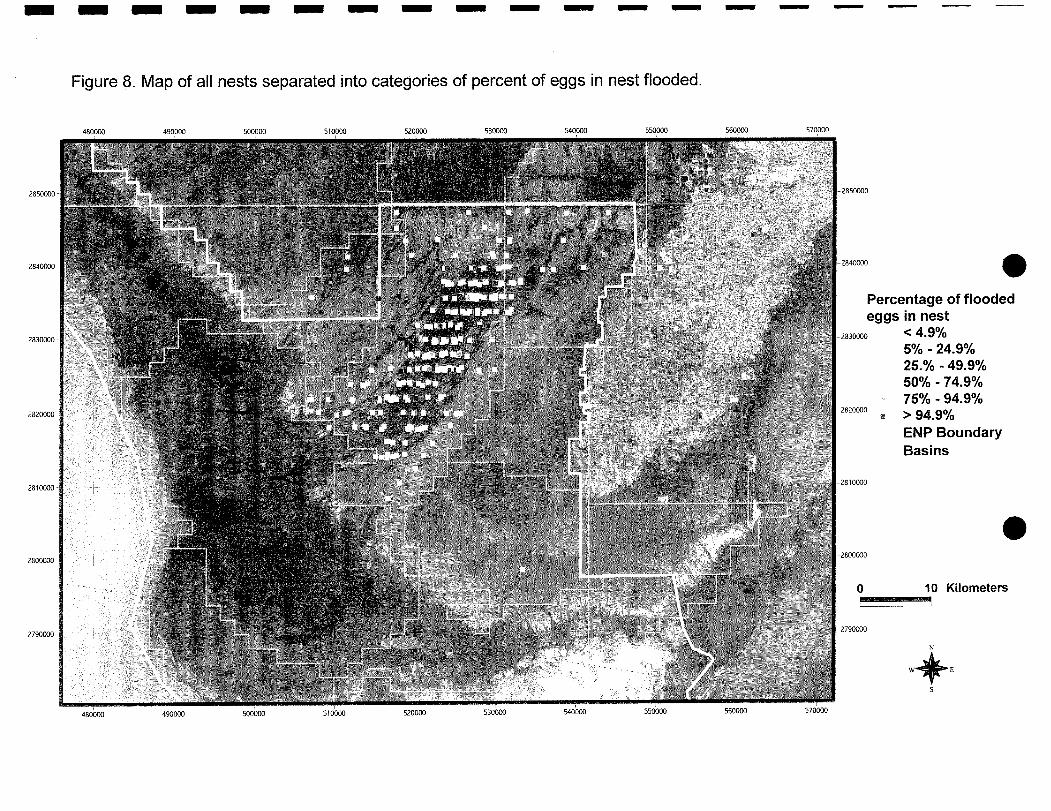
The map for the distribution of all nests from all years makes it clear that the vast majority of nests were located in the Shark River Slough basin (Fig. 3). Maps of the geographic distribution of nests in Shark River Slough each year do not indicate a contagious or clumped distribution of nests. Nests were located along the entire length and breadth of the slough at varying elevations. The mean ground surface elevation of nests in Shark River Slough basin was 4.07 feet (s.e. = 0.096, n = 293) and the range of surface elevations with nests was from 0.75 feet to 7.31 feet. In general, the distribution of the elevations at which nests were located reflects the shape of the slough, with the southwestern areas at lower elevations than the northeastern areas (Fig. 9). There was no correlation between ground surface elevation at nests and the percent of the eggs in a nest that flooded (F = 0.145, p = 0.70, r = -0.02; adj. R~ = -0.003, Fig. 10). Therefore, females probably built nests of a greater height, or they placed the eggs higher in the nest at lower elevations to avoid excessive flooding (see Kushlan and Jacobsen, 1990). However, there was no data on nest heights or height of eggs in nests from the current data set to verify this relationship.
Nest Flooding and "Historical Predictability" in Relation to Early and Late Water Levels
An important management related aspect of the studies of alligator nesting is the desire to relate nest flooding to patterns of water depth, rainfall, and water discharges from the S12 gates. Kushlan and Jacobson (1 990:Fig. 9) demonstrated a significant correlation between water levels (at NP203) during nest building in the last 2 weeks of June and maximum water level later during egg development between 1953 and 1962. They also showed that there was no correlation in water levels period from 1971 - 1982. It was argued that this correlation was a "Historical Predictability" (Kushlan and Jacobsen, 1990:181) and that alligators used the early water depth as a baseline indicator of the height at which to deposit their eggs in nests and that the correlation between early and late season water levels helped to minimize nest flooding A breakdown in this relationship caused by excessive discharges from the S12 gates may have contributed to exceptionally high nest flooding in at least two years: 1978 and 1982 (Kushlan and Jacobsen, 1990). Kushlan and Jacobsen (1990:177) stated that " ... rainwater was retained in reservoirs and when released caused a rapid increase in water levels in the study area. These increased water levels were delayed in timing from the rainfall events that ultimately caused them; we suggest that they may have been implicated to some degree in flooding of alligator nests in two of the three years of high mortality". The high discharges were implicated in higher rates of nest flooding in 1978 and 1982 when losses from flooding were 75% and 97.9%, respectively. Such flooding rates were much higher than any rate described in this study between 1985 and 1998, when the mean flooding was 20 % (58 of 293 nests, Tabs. 3). During the period of this study the regression of the mean water depth (at NP203) in the last 2 weeks of June showed a very significant linear regression and correlation to the maximum water depth during the incubation period (r = 0.90; Adj. R ~ = 0.80; Fig. 1 I ) , suggesting that "historical predictability"
9

had been restored by the rain driven program. Since 1985, in most years nest flooding was low to moderate (0 to 46%), but during a drought year, in 1988 seven of the I I nests (63%) monitored flooded more than 94.9% in August (Tab. 3, see below).
Relationships between water depth and the percent of nests that flooded did not effectively predict the degree of nest flooding in any month. There was no significant relationship between the percent (or number) of nests flooded in July and the maximum water depth (stage at P33; Fig 12A; F = 1.165, p = 0.3; Adj. R2 = 0.012; d. f. = I , 12). There was a weak but statistically significant relationship between the percent (or number) of nests flooded in August and maximum water depth during incubation (Fig. 12B; F = 4.869, p = 0.047; Adj. R2= 0.23; r = 0.54; d. f. = I , 12). Water levels were near or exceeded two feet above ground surface elevation of 4.87' at P33 in 3 Julys and 4 Augusts during this period. There was no significant relationship between the percent (or number) of nests flooded in September (Fig. 12C; F = 0.285; p = 0.60; Adj. R' = - 0.058; d. f. = I , 12) and maximum water depth in September. [Due to Hurricane Andrew, there was no gauge with a co~nplete data set for August or September 1992. N P 203 had no data for these months, but the nearby gauge, P33, had two days recorded for August. We used the ~naxim~tin value recorded at P33 for the analysis of tiiax. stage for August and September.]
S12 Discharge, Rainfall and Nest Flooding.
Relationships between total discharge (CFS) through the S12 gates (Fig. 1) and the percent of nests that flooded did not effectively predict the degree of nest flooding in any month. As a preliminary evaluation of the discharge of water through the S12 gates (S12A - D) the total monthly flow (the sum total of the daily flow values for a month through all four gates) was used to evaluate discharge in relation to nest flooding. There was no significant linear regression of the percent (and number) of nests that flooded (>94.9%) in July and the total discharge through the 512 gates for July (Fig. 13; F = 3.616; p = 0.08; Adj. R~ = 0.167). There was no significant regression of nest flooding versus August flows through the S12 gates (Fig. 14; F = 2.405; p = 0.147). There was also no significant regression of nest flooding versus September flows through the S12 gates (F = 0.015; p = 0.904).
Rainfall also was not effective at predicting nest flooding. There was no correlation between monthly total rainfall in July at P36 and the percent (or number) of nests that flooded in .July (F = 0.444, p = 0.51 7). he record for P36 rain in July of 1986 and 1992 and Aug~lst in 1993 was incoriiplctc. and near-by gauges had even lcss data. In order to make tlie relationsliip as reasonable as possible. we used the niean rainfall value5 k~i- t11c retiiairiirig 12 >cars of tlie period of record to estimate tlie regression. The choice of gauge used in these analyses was tilerel) orti: 0 1 ' convenience. 1'36 had a good record and it was within the study area. We would prefer to have this relationship recalc~rlated using rainfall data fro111 ariotlier gauge. but all of tlie gauges we exantined had missing data for some months.] There was no correlation between monthly total rainfall in August at P36 and the percent (or number) of nests that flooded in August either (F = 1.49; p = 0.246).
Timing and Intensity of Nest Flooding.
The above analyses indicated that nest flooding was not merely a function of absolutely deeper water levels. Nest flooding appears to be a complicated phenomenon, and the particular reasons for nest flooding vary from year to year, from month to month and probably from nest to nest.
The time when nest flooding occurred varied within and between years (Tab. 3; Fig. 15) [If nest flooding was recorded at the very beginning of a month, e.g. August I s ' in 1992, the flooding was assigned to the previous month for this analysis.] Nest flooding was spread out over the 3 months of July, August and September. In Shark Slough, out of the total 58 nests that completely flooded, 22 (38%) flooded in July, 19 (33%) flooded in August, and 17 (29%) flooded in September (Tab 3, Fig. 15).

In 1988 there were only I I nests surveyed in Shark Slough, but 7 of them completely flooded in August (apparently just before they were surveyed on August 23, 1988). The conditions that led up to this nest flooding include very high rainfall in July (18 inches at P36) and high rains in August coupled with high discharges through the S12 gates in later August (Fig. 16). The high stage at the gauges for August 1988 was a strong factor in the calculation of a significant regression between August stage and nest flooding (Fig. 12B).
Maximum water stage was higher in August for 1996, 1997, and 1997 (Fig. 12B). The same or higher discharge occurred in 1991, 1992, 1995, 1996, and 1997 (Fig. 14), but the degree of nest flooding was much lower. The discharges were not unusually high and were in keeping with the amount of regional rainfall. The flooding appears to have resulted from a combination of rainfall over two months coupled with discharges from upstream (Figs. 16 & 17). In 1992, 1995, 1996 and 1997 there was relatively high nest flooding (26.3% to 46.2 %), and in each of these years there was more rain in June than in July or August. This suggests that the conditions that led to nest flooding were probably related to the accumulation of monthly local rainfall and regional discharge from June through September in relation to the elevation of the egg chamber in the nests.
More than half of the flooding in 1992, and 1997 took place in July but the total discharge was about the same as it was in 1993 when no nests flooded. In 1992, 1995, 1996 and 1997 there was 2 to 5 inches more rainfall in July than in July of 1993 (Fig. 16A). In July in 1995, 1996 and 1997 the combination of slightly higher discharges and slightly higher rainfall appear to have resulted in higher water levels in the slough, but in 1992 when just as many nests flooded in July, the maximum water level (at NP203) was lower than in 1993 (6.09 feet vs. 6.3 feet; Fig. 12A). Discharge alone does not clearly correlate with higher flooding, e.g. in August of 1997 rainfall was relatively low but discharge was very high and yet only one additional nest was flooded during this month vs. July (Figs. 15 & 16). The lack of a consistent relationship for nest flooding with rain, discharge and water depth was characteristic of these data and indicated that we are dealing with only a matter of a few inches in determining whether nests flooded in these years.
Additional detailed analyses of the relationship between nest flooding and antecedent stage, rainfall and discharge would be worthwhile, but the limiting factor was the lack of information on the exact time of nest flooding. This relationship could be extrapolated based upon additional analyses of detailed daily data on rainfall and discharge events for each year. Additionally, the lack of information on the relationship between the height of the egg chamber in the nest and the elevation of the water at the time of nest flooding was also a limiting factor.
There was no preliminary evidence that excessive water release(s) through the S-12 gates caused any increase in flooding during the timeframe of this study. One specific difficulty with attempts to compare daily discharge with flooding was that it was difficult to know exactly when the flooding had taken place relative to the date of the site visit at which it was recorded, because it was usually ten days to two weeks between visits. Joanen et al (1977) determined that submerging alligator eggs for only 48 hours was sufficient to drown 100% of all embryos (and that
- embryos older than 42 days were more susceptible to death from flooding than younger ones), so it was possible that a very short term increase in water depth at individual nests caused flooding The data from the surveys are not daily information, nor are the survey dates identical from year to year or month to month. Therefore, we only know that nests flooded sometime before a survey date when they were listed as flooded. The comparisons shown in this report on the relationships of rainfall, S12 discharge and nest flooding are preliminary and more detailed analyses based upon daily or weekly rainfall and discharge would be desirable when it is feasible. Our initial analyses do indicate that nest flooding was not a simple function of S12 discharges during this time period. The flooding events may have been of short or longer duration. Such after the fact hydrological analyses would require a time consuming analysis of discharges from all four S-12 structures and a reliable source of rainfall data for the entire 3 month nesting interval for each of
the 14 years of data. In order to determine whether this pattern holds up for daily discharges form each S-12 structure we would recommend that the hydrological formulas agreed to in the operation schedule for the rain driven delivery program be evaluated in relationship to the 14 years of data. This could prove to be a very complicated analysis. Such an analysis was outside of the scope of work of this report.
Predicting nest flooding by general location may not be possible. While it may seem easy to predict flooding by merely stating that nests located at lower elevations or 'deeper' in the slough are more susceptible to flooding, two nests may be close by each other and yet one could be situated on a greatly elevated but small mound of vegetation near a 'gator hole' while another is placed much closer to the ground surface elevation. This small scale at which nest flooding occurs is not readily captured in large scale GIs based mapping efforts. The importance of this to future SRF survey work is that nest location alone will not predict nest flooding, i.e. more than an aerial evaluation is required. The follow-up ground surveys of selected nests would still be required to determine nest flooding.
The mean percentage of the eggs per nest that hatched in this study was 60%, which was very similar to the 58% hatching rate that Joanen (1969) noted for eggs left in nests to incubate in Louisiana. In general, some flooding of alligator nests has been found in most studies of alligators in southern Florida (Hines et al, 1968), on lakes and marshes of north-central Florida (Goodwin and Marion, 1978, Deitz and Hines, 1980), in coastal Louisiana (Joanen, 1969) the Okeefeokee Swamp in Georgia (Metzen, 1977) and in South Carolina (Wilkinson, 1983). While nest flooding appears to have always been the largest source of egg mortality for alligators in Shark River Slough, it does not appear to be at a level that exceeds levels noted elsewhere and probably does not severely impact the population under the rain driven schedule.
Predicting the number of nests observed along transects in relation to water depth.
The number of nests that will be produced in a given year around July lSt is closely tied to the antecedent water conditions during the period of courtship and mating. Courtship and copulation take place in the water approximately between April 16 and May 15 of the year, toward the end of the dry season. Higher water levels during this period make it physically possible for more alligators to have successful courtship and copulation (Kushlan and Jacobsen, 1990; Rice and Palmer, 2000).There was a significant regression of the mean water level between April 16 and May 15 at NP203 and the observed number of nests for the data from this project. The regression explained about 40% of the variation in nest numbers between 1985 and 1998:
Number of Nests = -1 18.8 + 30.052 * Water Depth in Feet (April 16 - May 15)
(Fig. 18; F = 9.40, d.f. = 1, 12, p =0.0097, Adj. R' = 0.39, r = 0.66). While the model explains a significant percentage of the variation it leaves about 60% of the variation unexplained. Indeed. the reasons why the percentage of the female population that breeds per year is so variable has remained unexplained in many population studies for reptiles (see below).
Female size, Clutch Size and Nesting Female Population Size
During the period of the study, water levels in the study area ranged from drought conditions (between 1989 -1 990) to flood conditions (in the late 90's) and are known to have impacted alligator population structure and patterns of growth (Dalrymple, 1998). One of the goals of the SRF surveys was to determine whether year to year variation in water levels had a measurable effect on nesting success. From the SRF data we have no direct information on the mean size of the nesting females or the relation between female size and clutch size. Previous studies showed mixed results on the relationship between female body size and clutch size and or clutch mass (Joanen, 1969; Dietz and Hines, 1980; Hall, 1991; Wilkinson, 1984). However, a

recent study in the Arthur R. Marshall Loxahatchee National Wildlife Refuge found a positive linear relationship between female size and clutch size for 21 alligator nests (Brandt and Mazzotti, 2000). In addition, when we took the body length and clutch size data for the 13 nests from Everglades National Park and Water Conservation Area 3A in the recent study by Percival et al (Percival et al, 2000:Tab. 8-1) there was a significant positive correlation between female size and clutch size (r = 0.61, n= 13, p <: 0.001) and a significant linear regression (Adj. R* = 0.32, F= 0.8433 (1,11), p <: 0.02):
Clutch Size = -9.984 + 0.17691 * Body Length (cm).
Based upon the above association of clutch size with female size, we hypothesized that, since the mean clutch size was larger from 1985 to 1989, the average female laying eggs from 1985 to 1989 was larger than the average female laying eggs from 1990 to 1998 (Fig. 4). By contrast, from 1990 to 1998 the mean clutch size was smaller and therefore the mean female size was smaller. Likewise, since there were more nests from 1990 to 1998, the mean number of females nesting was much higher in this time period. All of the above leads us to conclude that more but smaller females made up the majority of the breeding population from 1990 to 1998. [Estimates of average size of females per year could be calculated based upon the available regression equations mentioned above, if it were desirable.]
Estimation of the total female breeding and nesting populations and the total hatchlings per year in Shark River Slough.
A preliminary estimate of the total number of nesting females was based upon multiplying the observed number of nests in the one fourth of the Shark River Slough area by 4. Using this method to calculate the total area's annual nesting female population, there would have between 20 and 456 nesting females per year, but this was not the total number of nesting age females in this population. The percent of the alligator population nesting in a given year is not determined by water levels alone, but is also influenced by physiological and demographic characteristics of the population such as intrinsic physical health factors, including hormonal levels and levels of toxic substances in body tissues (Gross et al, 2000) as well as growth rates, body condition, and population structure (Dalrymple, 1996 and 1998). Intrinsic biological attributes of physiology, demography, and behavior may confound efforts to explain breeding effort on the basis of hydrological variables alone, and they add an additional layer of variation (statistical error) to the data.
Kushlan and Jacobsen (1990) suggested that approximately 29% (range: 16% to 58%) of the females in their 10 square kilometer study area near NP203 nested per year during their study. A recent study of 15 radio-tagged alligators in the park found that 40% (6 of 15) of the females nested during the study. In the adjacent Water Conservation Area 3A, 62% (8 of 13) of the radio tagged alligators nested (Percival et al, 2000: Chap. 8, p.132). Using the above information, we estimated the possible total number of breeding age females in the population of Shark River Slough as follows. Assuming that even the year with the largest number of observed nests (1 993 had 114 observed nests, or an estimated 456 total nests) did not include all potential nesting age females, the estimated 456 nests would have been representative of the highest previously estimated maximum percent of females nesting. If the maximum percent previously calculated by earlier workers, above, was between 60% and 29%, then we estimated the total breeding age female population to be between 760 and 1572 females.
To estimate the total number of hatchlings produced per year, we took the mean number of eggs per nest in each year, multiplied by the number of estimated total nests, multiplied by the mean percent of eggs that hatched per nest in each year. Using this estimation method there were between 400 and 7200 hatchlings produced per year between 1985 and 1998, with 1993 with the highest number of hatchlings (Fig. 19).
13
The number of hatchlings produced and the number of nests produced was positively correlated (r = 0.95, p < 0.0001), but there was no correlation between the number of hatchlings produced and either the number of eggs per nests or the percent of eggs per nest that flooded. Higher reproductive success appears to be more closely tied to the number of females that nest than either the number of eggs per nest or the percent of eggs that flood.
Northesast Shark River Slough and Other Basins
The mean number of nest per year in NESRS was 3.9 nests per year with a range of 0 to 10 per year. The highest number of nests in one year was for 1993 and the lowest, zero, was for 1985 (Tab. 1). There have been too few nests per year in the Northeast Shark River Slough (NESRS) to identify significant trends, or even patterns with water levels (Tab. 1). Shark River Slough is much larger than NESRS and that is one reason why the former slough had 733 nests observed over 14 years while the latter region had only 50. However, the alligator nests counts in NESRS were also low because the hydropattern of NESRS has been unnaturally low and alligators have been uncommon in the region (USACE 1999). The water level in NESRS at gauge NEI remained strongly correlated with the water levels at gauges in Shark River Slough (P33, P35, P36, and NP203), but the actual surface water levels were lower than they were in Shark River Slough. For example, there was an average of 0.81 feet more surface water at NP203 in Shark River Slough than at NEI in NESRS in June between 1985 and 1998 (Fig. 20).
There was some slight evidence of an upward trend in the number of nests in NESRS during this study (Fig. 21), but the re ression of number of nests versus years was not significant (F = 3.99, p = 0.069, r = 0.50. Adj Rq= 0.187). This slight upward trend was related to the higher water levels and increased nesting activity noted throughout the study area during the late 1990's in comparison to the drier late 1980's.
Future conditions and alligator nesting success.
Changes in seasonal water delivery and hydropatterns in 2000,2001, and 2002 as required by the Interim Operating Plan (IOP) for protection of the Cape Sable Seaside Sparrow (USACOE 2001) and the completion of the Modified Water Delivery project for Everglades National Park ('Modwaters') in 2003 (or 2006?) should lead to increases in the population levels and nesting efforts of alligators in NESRS, as well as changes in alligator use of other smaller basins. It remains unclear whether such changes in NESRS will be due to a shift in the concentration of alligators to NESRS from Shark River Slough, due to an absolute increase in the total population of alligators or some combination of both of the above. The need for empirical evidence of these impacts suggests that continuation of the SRF surveys for alligator nesting effort is warranted.
Water management practices, especially high variability in daily discharges from flood control structures, are certainly capable of significantly increasing egg mortality in some years, and modifying the water delivery system to reduce the potential for high rates of nest flooding of alligators was part of the motive for development of the rain driven schedule and remains a long term goal for CERP. The key to higher reproductive success appears to be more closely tied to the number of females that nest than to either the number of eggs per nest (female size) or the percent of eggs that flood. The evidence available from the current study indicates that the period of higher water conditions in the mid to late 1990's saw more females nesting than did the drier conditions from the mid to late 1980's. This was also the period with the higher rates of nest flooding. Therefore, higher water levels in the sloughs, higher numbers of nesting females and higher flooding rates might be naturally correlated. Having an overly simplistic "target" of more nests but fewer flooded nests may not be a reasonable expectation, and may even be disruptive to the naturally occurring regulating mechanisms working on the alligator population in the slough

Additionally, hydropatterns that redistribute some of the water south of Tamiami Trail into the Northeast Shark River Slough will remain a basic goal of all plans, since it will increase the geographic distribution of the alligator as it restores the spatial extent of the original Shark River Slough. Such an expansion of the geographic distribution of the breeding alligator population is expected to further reduce the potential for excessive nest flooding in the current spatially confined Shark River Slough. The regression models produced in this report for the relationships between number of nests produced, number of nests flooded and water depths at P33 and NP203 suggest that conditions that place about 2 feet of water at NP203 during late April and early May result in an increase in the number of nests produced (Fig. 18). It should be remembered however, that conditions that place a maximum water depth between July and August at the same gauges of more than 2 feet of water will also result in some years with higher nest flooding as well (Fig. 12). In general conditions that lead to more nesting also tend to lead to more nest flooding. The only thing water managers can do is to avoid unnecessary excessive flooding due to rapid and excessive releases of water through control structures.
RECOMMENDATIONS FOR FUTURE SRF DATA COLLECTION.
The alligator SRF data should be summarized at the end of each sampling year. The data should be proof-read for accuracy and to remove outliers from the standard sampling transects. The data should be statistically summarized for fates of eggs per nest and overall. The data should be correlated with hydrological variables from an agreed upon standard set of locations and over a standard set of time intervals. Such summaries will reduce the difficulties of trying to re-construct the localized and short-term events and conditions that led to year to year variations in nesting success at remote future dates.
Include collection of data on nest morphometrics in initial nest surveys. Data should include greatest length, width and height of nest, height of bottom and top of egg mass in nest.
A series of water depths at the cardinal points of the compass for calculating an average water depth at the nest during every visit.
A detailed description of the micro-habitat in which the nest is located. The details should be put into a quantitative or numeric format for statistical analyses. Details such as percent cover by various dominant plant species, percent of living vs. dead plant biomass should be collected.
Whenever it is possible the female attending the nest should be measured and weighed and marked, if she cannot be captured her size should be carefully estimated.
After the field data is collected and placed in a GIs, a series of geographically explicit re!ationships such as the distance between nests and the distance to the closest water (gator) hole for each nest should be calculated. Such relationships will assist in the evaluation of the distribution and social structure in the nesting population.
Some effort should be made to determine whether the assumption that alligator nesting peaks around July 1'' of the year holds true regardless of antecedent hydrological conditions. A pilot study in a small area would use the dates when eggs are recorded form a sample of ground truthed in relation to the stage conditions in late April through early May as well as stages in the last 2 weeks of June to determine whether oviposition date varies predictably with antecendent conditions or whether it is always centered around July 1''.

LITERATURE CITED
Armentano, T.V., R.F. Doren, W.J. Platt, and T. Mullins. 1995. Effects of Hurricane Andrew on coastal and interior forests of southern Florida: overview and synthesis. J. Coastal Res. 21:111- 144.
Brandt, L. A., and F. J. Mazzotti. 2000. Nesting of alligators at the Arthur R. Marshall Loxahatchee National Wildlife Refuge. Florida Field Naturalist 28:122-126.
Craighead, F. C. 1968. The role of the alligator in shaping plant communities and maintaining wildlife in the southern everglades. Florida Naturalist 41:69-74.
Dalrymple, G. H. 1996. Growth of American alligators in the Shark Valley region of Everglades National Park, Copeia 1966: 212-216.
Dalrymple, G. H. 1998. The effect of prolonged high water levels in 1995 on the American alligator in the Shark Valley area of Everglades National Park. Pages 125-135 in: Ecological assessment of the 1994-1995 high water conditions in the southern Everglades. Edited by T. V. Armentano. South Florida Natural Resources Center, Everglades National Park, Homestead, FL
Dietz, D. C., and T. C. Hines. 1980. Alligator nesting in north central Florida. Copeia. 1980:249- 258.
Ferguson, M. W. J., 1985. Reproductive biology and embryology of the crocodilians. Pp.329-491 in Biology of the Reptilia Vol. 14 ed. by C. Gans, F. S. Billet, and P. F. A. Maderson. John Wiley and Sons, New York.
Fleming, D. M. 1991. In-house report. Review of SRF results for American alligator nesting, South Florida Research Center. Homestead, FL.
Goodwin, T. M., and W. R. Marion. 1978. Aspects of the nesting ecology of American alligators (Alligator mississippiensis) in north-central Florida. Herpetologica 34: 43-47.
Gross, T. S., K. Rice, J. J. Wiebe, C. M. Wieser, and F. Percival. 2000. An assessment of potential contaminant exposures and effects for alligators in the greater Everglades ecosystem Proceedings of Greater Everglades Ecosystem Restoration Science Conference, Naples, FL December 11-15, 2000, abstract, p. 93. USGS.
Hall, P. M. 1991. Estimation of nesting female crocodilian size from clutch characteristics: Correlates of reproductive mode, and harvest implications. J. Herpetol. 25:133-141
Hines, T. C., M. J. Fogarty, and L. C. Chappell. 1968. Alligator research in Florida: a progress report. Proc. Ann. Conf. SoutheasternAssoc. Game Fish Comm. 22:166-180.
Jacobsen, T. and J. A. Kushlan 1989. Growth dynamics in the American alligator (Alliqator mississippiensis) J. Zool., Lond. 219: 309-328.
Joanen, T. 1969. Nesting ecology of alligators in Louisiana. Proc.Ann. Conf. Southeastern Assoc. Fish and Wildlife Agencies 23:141-151.
Joanen, T., L. McNease, and G. Perry. 1977. Effects of simulated flooding on alligator eggs. Proc. Ann. Conf. Southeastern Assoc. Fish and Wildlife Agencies 31 :33-35.

Joanen, T. and L. McNease. 1987b. Alligator farming research in Louisiana, USA. Pages 177-87 in Wildlife Management: Crocodiles and Alligators ed. by G. J. W. Webb, S. C. Manolis, and P. J Whitehead. Surrey Beatty and Sons, Ltd. N.S.W., Australia.
Kushlan, J. A,, and T. Jacobsen. 1990. Environmental variability and the reproductive success of Everglades alligators. J. Herpetol. 24: 176-1 84.
Kushlan, J. A. and M. S. Kushlan. 1979. Water levels and alligator nesting in the Everglades Second Conference on Scientific Research in National Parks, San Francisco.
Light, S. S., and J. W. Dineen. 1994. Water control in the Everglades: a historical perspective. Pages 47 - 84 in: Everglades the Ecosystem and its Restoration. Edited by S. M. Davis and J. C Ogden. St. Lucie Press. Delray Beach, FL.
Mazzotti, F. J. and L. A. Brandt. 1994. Ecology of the American alligator in a seasonally fluctuating environment. Pages 485 - 506 in: Everglades the Ecosystem and its Restoration Edited by S. M. Davis and J. C. Ogden. St. Lucie Press. Delray Beach, FL.
Metzen, W. D. 1977. Nesting cology of alligators on the Okeefenokee National Wildlife Refuge Proc. Ann Conf. Southeastern Assoc. Fish and Wildlife Agencies 31:29-32.
Palmer, M. R., and K. G. Rice. 2000. ATLSS American alligator production index model. Proceedings of Greater Everglades Ecosystem Restoration Science Conference, Naples, FL December 11 -1 5, 2000, abstract, p. 246. USGS.
Percival, H. F., K. G. Rice, and S. R. Howater. 2000. American alligator distribution, thermoregulation, and biotic potential relative to hydroperiod in the Everglades. Contract Final report to U. S. Geologic Survey.
U. S. Army Corps of Engineers. 1999. Central and Southern Florida Project Comprehensive Restudy. Final Integrated Feasibility Report and Programmatic Environmental Impact Statement. Jacksonville District, Jacksonville Beach, FL.
U. S. Army Corps of Engineers. 2001. Interim Operating Plan (IOP) for the Protection of the cape Sable Seaside Sparrow. Everglades national park, dade County, Florida. Draft Environmental Impact Statement. Jacksonville District, Jacksonville Beach, FL.
Weaver, J. B, Brown, W. Kitchens, D. Wesley, D. Unsell, L. Burns, D. Scheidt, D. Ferrell, N. Thompson, J. Ogden, T. Armentano, M. Robblee, W. Loflus, B. Glaz, and P. Ortner. 1993. Federal Objectives for The South Florida Restoration by The Science Sub-Group of The South Florida Management and Coordination Working Group. 96 pp.
Webb, G. J. W., S. C. Manolis, K. E. Dempsey, and P. J. Whitehead. 1987. Crocodilian eggs: a functional overview. Pages 417-426 in Wildlife Management: Crocodiles and Alligators ed. by G. J. W. Webb, S. C. Manolis, and P. J. Whitehead. Surrey Beatty-and Sons, Ltd. N.S.W.,,Australia.
Wilkinson, P. M., 1983. Nesting ecology of the American alligator in coastal South Carolina, Study Completion Report Aug. 1978 - Sept. 1983, South Carolina Wildlife and Marine Research Department, Charleston.


OL
OO
LO
0
LI)
0
LO
0
LO
Ti
ci
ci
cu
cu
- T
0 0
4


-a3
5'5
' L
nN
coo, o,o,

5
mD 2 t; rr *s a
,z m
zw
m

FIGURE 6. HISTOGRAM OF PERCENT OF EGGS FLOODED PER NEST
SHARK SLOUGH BASIN, STANDARD TRANSECTS 1985 - 1998
Histogram (STANDA-1 .STA 32v*332c)
PERCENT OF EGGS FLOODED
@ a
B 0
P
o
q~
b;
;..
qo
o a m
;5
. ri-
a&??
5 0
, ,*
s;F
tso
, Q
WS
N
I,
,?
mC
0
Q-
m
CG
8 S
,&*z
.w
$
uj&
so
'rZ
m
~.
EV
WN
W~
A
wm
r B
E 8
ba
5! # m
g 3
N
3


x m
0
Q
O
I,
('1 -a
OW
?
ZZ
m
Q3
$
w
z"
cr)
3C
QK
-3
27
3
ur
-2
O
'?
$
m
+ -3
Ya
Q
wo
w
ol*
ol II
a
11- d
ml
-.
(9
CV cO
3
0
0
old
-
+
b
cd a
cd ui
Isj
(1333) ~
VIS
tlavvvvns vvnvvIxvvv

FIGURE 12. SCATTERPLOTS OF PERCENT OF NESTS FLOODED VS. MAX. SATGE AT P33 FOR JULY, AUGUST AND SEPTEMBER - SHARK SLOUGH DATA
GROUND SURFACE ELEVATION = 4.87'
A JULY 6. AUGUST
JULY MAX. STAGE - P33 - (FEET) AUGUST MAX. STAGE - P33 (FEET)
C. SEPTEMBER
g 18 ESTIMATED VALUE FOR 1992 0
SEPTEMBER MAX STAGE - P33 (FEET)
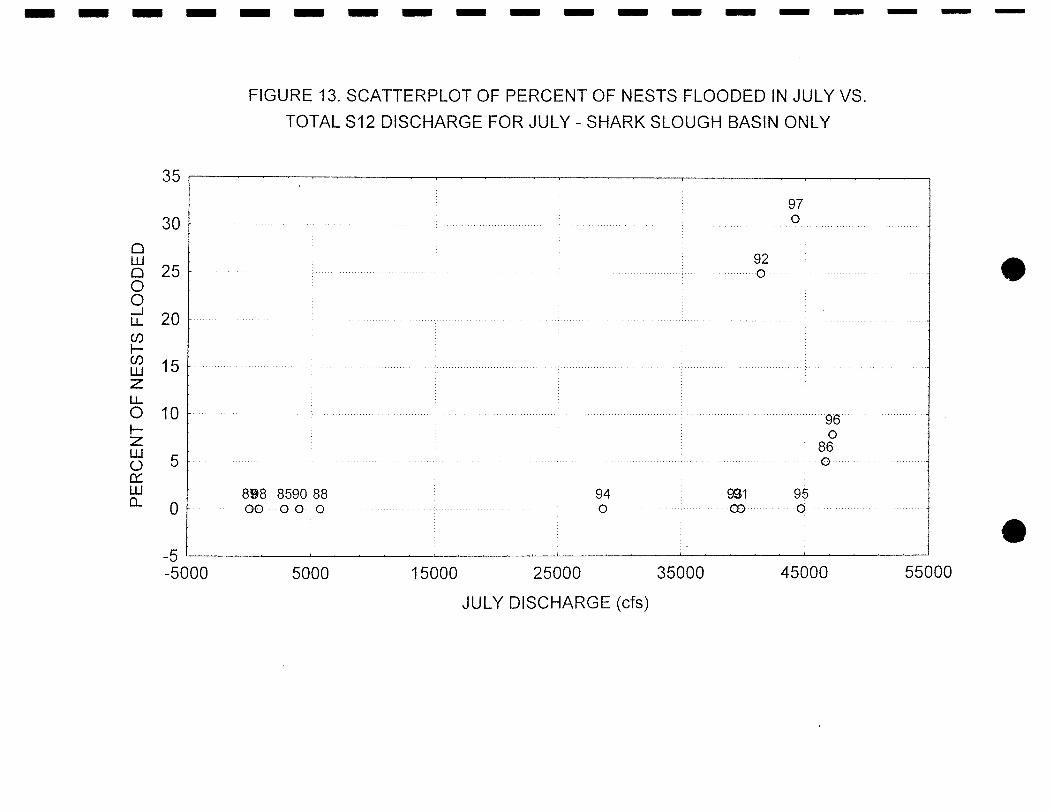
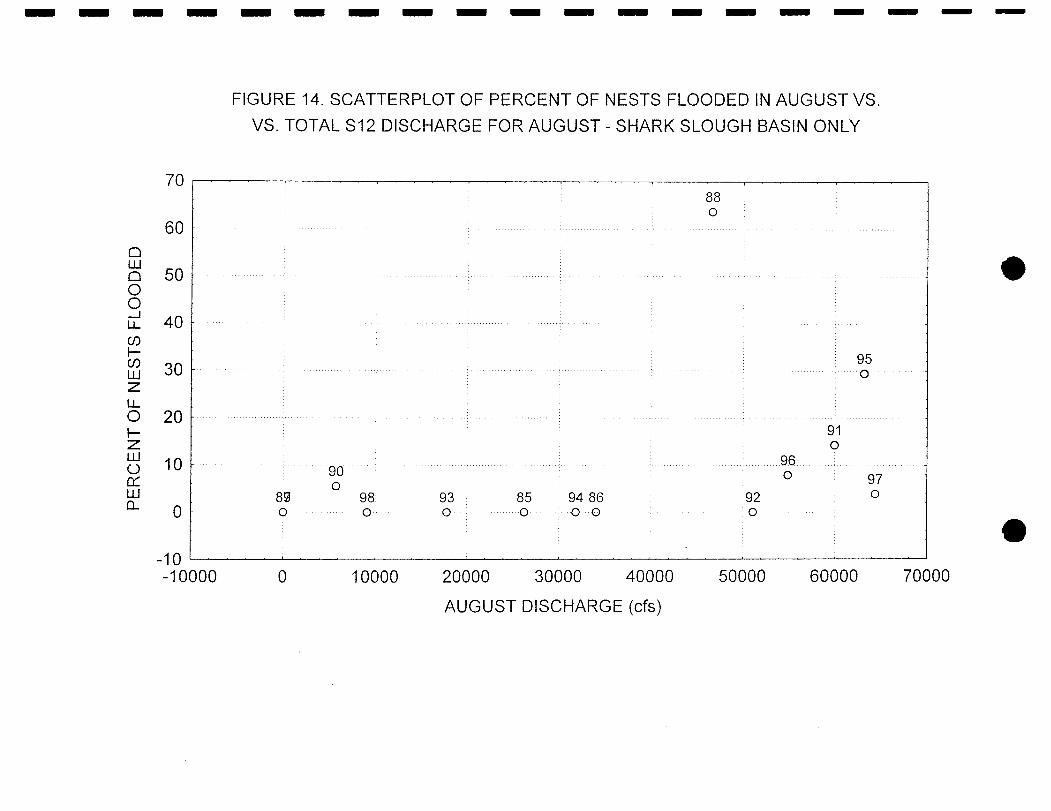
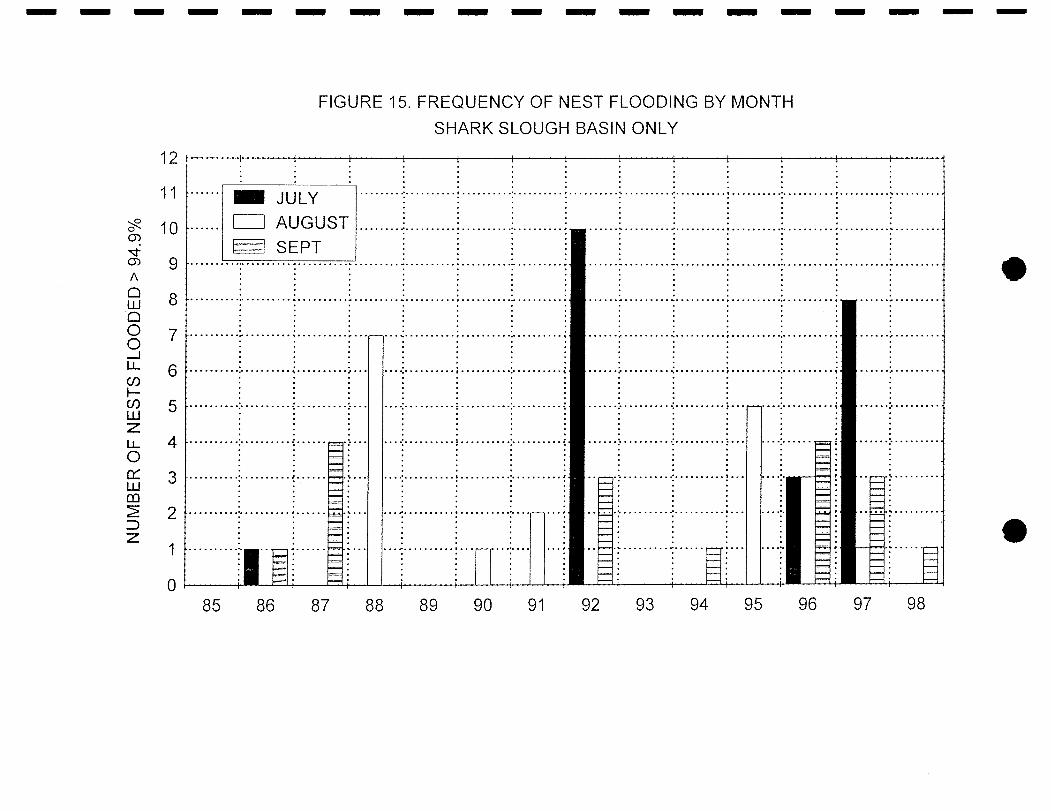

FIGURE 16. SCATTERPLOTS OF MONTHLY TOTAL S12 DISCHARGE VS. RAINFALL P36, ADJUSTED FOR MISSING DATA.
A. JULY B. AUGUST
-10000 1 I 2 4 6 8 10 12 14 16
RAINFALL (INCHES)
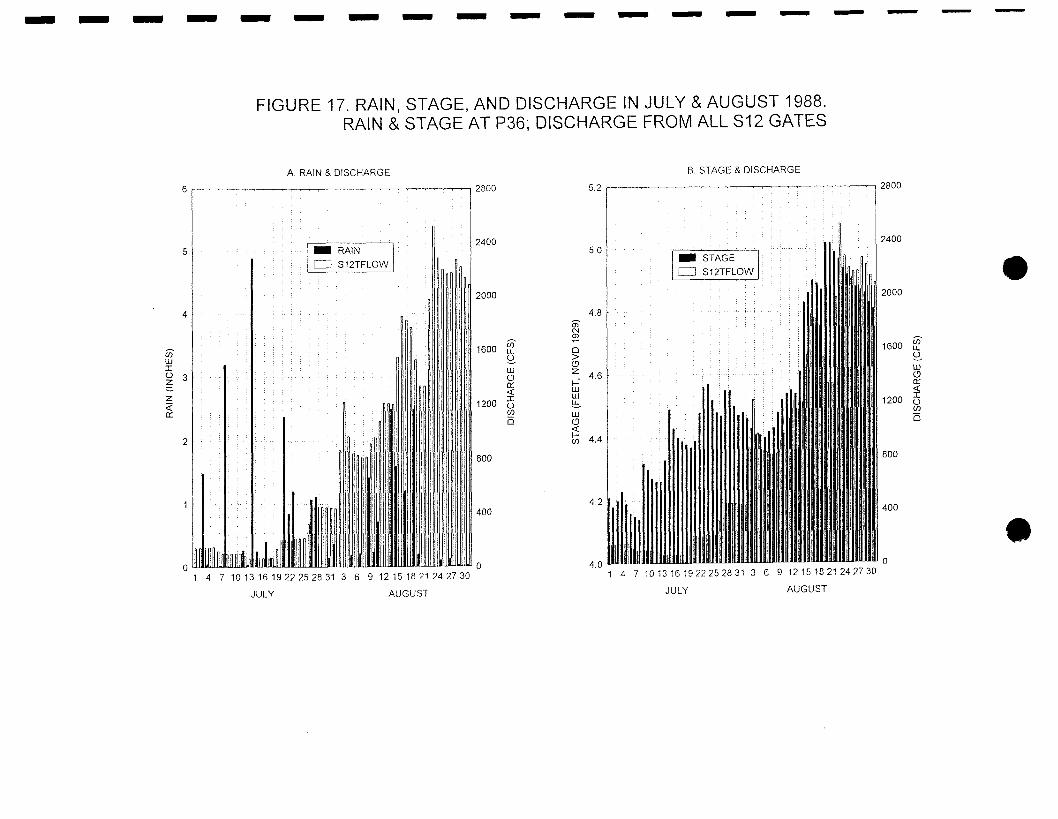


FIGURE 19. ESTIMATED TOTAL HATCHLINGS VS. ESTIMATED TOTAL NESTS IN SHARK SLOUGH
Correlation: r = .94971; ESTHATC = -85.82 + 15.31 7 * ESTNESTS
ESTIMATED NESTS

Lu
ll
I
I t
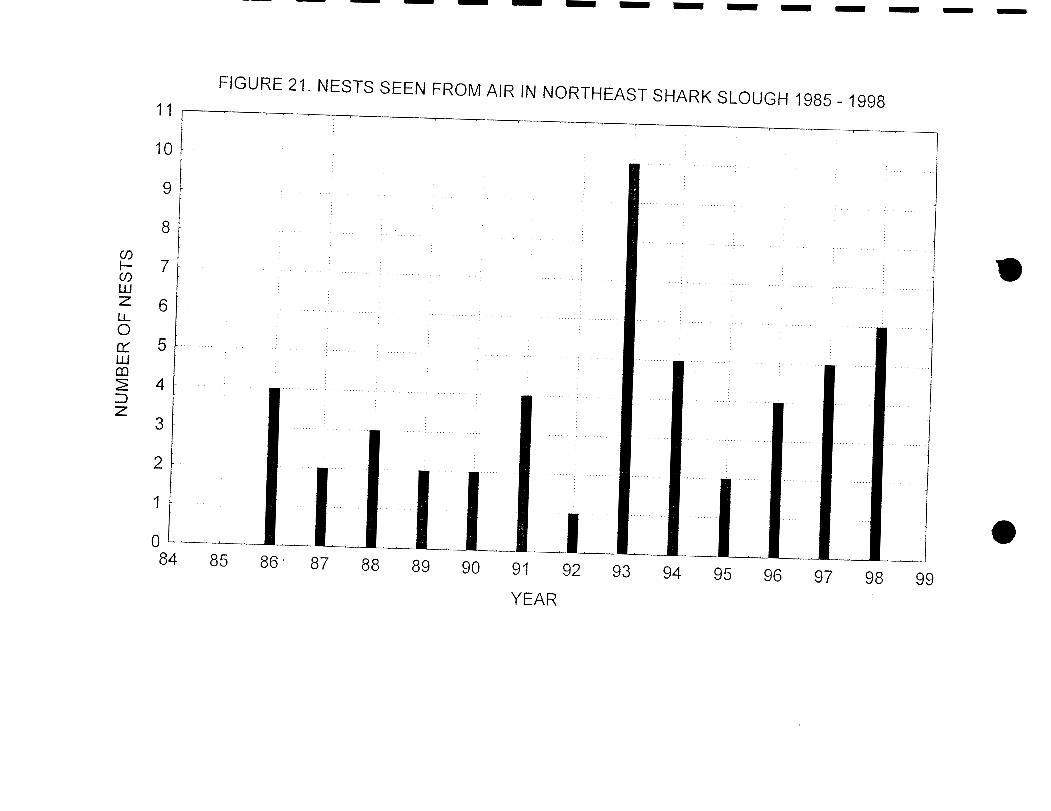

Table 1. Number of alligator nests observed in aerial flights in 8 basins
YEAR SHARK NESRS EAST SHARK SL. N. TAYLOR S. TAYLOR EASTERN SOUTHERN SLOUGH SLOUGH ESTUARY SLOUGH SLOUGH PANHANDLE BIG CYPRESS
TOTALS 733 50 34

Table 2. Fate of eggs as percent of totals for alligator nests in all basins by year
YEAR No. Nests
ALL GROUPS 332
1 % Hatched % Flooded % Predated % Unbanded % Other

Table 3. Fate of alligator nests in Shark Slough basin only.
YEAR Total No. Nests that %of Nests that
Nests Flooded > 94.9% Flooded > 94.9% July
Number
Number and Percent of nests by month: August September July August Number Number Percent Percent
0 0 0.0 0.0 0 1 5.0 0.0 0 4 0.0 0.0 7 0 0.0 63.6 0 0 0.0 0.0 1 0 0.0 5.6 2 0 0.0 14.3 0 3 25.0 0.0 0 0 0.0 0.0 0 1 0.0 0.0 5 0 0.0 29.4 3 4 7.9 7.9 1 3 30.8 3.8 0 1 0.0 0.0
September Percent
ALLYEARS 293 5 8 22 19 17