amalgamated transit union, local union no. 1005
TRANSCRIPT

Detection Range Setting
115
Detection Range SettingMethodology for Signal Priority
Peter Koonce and John Ringert, Kittelson and AssociatesTom Urbanik, University of Tennessee
Willie Rotich and Bill Kloos, City of Portland
AbstractA significant amount of delay to transit vehicles in urban areas is caused by traf-
fic signals. Implementation of signal priority has the potential to reduce control delay
caused by traffic signals. The implementation of these systems requires engineering
studies that address both transit and traffic signal operations. A comprehensive pro-
gram requires coordination between the transit agency and the transportation depart-
ment to address needs of both agencies and users. The City of Portland and the Tri-
County Metropolitan Transportation District of Oregon (Tri-Met) have been working
on a program that exhibits the elements of such an effort. This article details the efforts
of the project and the methodology for developing signal timing and detection distance
settings.
IntroductionThe City of Portland and Tri-Met have undertaken a program to improve bus
service by implementing a signal priority system. The current project is the resultof several years of experimentation with various techniques (Kloos and Turner1999). The system in place uses a 170 HC11 traffic controller, an evolutionarypiece of hardware, as part of an eventual upgrade to a 2070-like Advanced TrafficController (ATC). The Wapiti software used by the City, the Oregon Departmentof Transportation (ODOT), and most of the neighboring jurisdictions has been

Journal of Public Transportation, Vol. 5, No. 2, 2002
116
upgraded to provide added bus priority features. The implementation allowsgreen extension for the bus phase and red truncation when in nonbus phase(s)while also maintaining coordination. The 3M Opticom system is used as thedetection system, and an automatic vehicle location (AVL) system is used to con-trol the emitter.
This research summarizes the issues associated with the implementation ofsignal priority, specifically the determination of a detection range for an intersec-tion. The detection range for the buses is determined by the location of bus stopsupstream of the traffic signal, sight distance to the intersection, extension timeavailable at the intersections, and location of the nearest upstream traffic signal.This article describes the key factors for distance setting and recommends rulesfor implementation of the range setting. In addition, it examines the bus prioritydistance setting at one intersection in more detail, providing a summary of theapplications and constraints using actual headway and detection range values.
Background
Portland has a long history of providing signal priority for transit. The lightrail system, Metropolitan Area Express (MAX), began service in 1986 with highpriority or preemption at many of the signals. The level of priority has steadilyincreased, allowing more efficient travel between the stations.
Bus priority experience has included three field tests: Powell BoulevardPilot Project in 1993, Multnomah Boulevard test in 1994, and Tualatin ValleyHighway test in 1996. The Powell Boulevard test has been the most publicized(Kloos, Danaher, Hunter-Zaworski 1994). This study evaluated several detectiontechnologies for inclusion in the system. The technologies included the TOTEsystem by McCain, the LoopComm system by Detector systems, and theOpticom by 3M. Signal priority algorithms were limited in these tests to preservetraffic signal coordination. In each of these tests, Portland’s Bureau ofTransportation worked with Tri-Met.
Transit signal priority measures include passive, active, real-time, and pre-emption.
Detection Range Setting
117
• Passive strategies attempt to accommodate transit operations through the useof pretimed modifications to the signal system. These adjustments are com-pleted manually to determine the best transit benefit while minimizing theimpact to other vehicles. Passive priority can be simple changes to the signaltiming or systemwide retiming to address bus operations. The strategies canutilize transit operations information, such as bus link travel times, to deter-mine signal timing coordination plans.
• Active strategies adjust the signal timing after sensing the arrival of a bus.Depending on the application and capabilities of the equipment, active prior-ity may be either conditional or unconditional. Unconditional strategies pro-vide priority regardless of the transit vehicle status (i.e., regardless of passen-ger loads or lateness).
• Real-time strategies are implemented by systems that provide continuousfeedback between the priority request generator (the bus) and the priorityrequest server (unit that discerns which request to serve). Real-time strategiesmay also use estimated arrival time information at the intersections to makecontrol decisions within the system.
• Preemption could be classified separately because it results in changes to thenormal signal phasing and sequencing of the traffic signal. Preemption is mostcommonly associated with emergency response vehicles and trains.Preemption affects the normal operation of the traffic signal and the resultingtraffic flow, which has the potential to impact the safety and efficiency of theintersection. One of the most important effects is the disruption of coordina-tion between traffic signals, which may result in significant congestion.
The Portland application, as in many other cities, is focused on active pri-ority that make changes to the signal timing to accommodate buses whileremaining in a coordinated system of traffic signals.
System Description
Tri-Met is a regional transit agency that serves the three county area inPortland, Oregon. Tri-Met operates 101 bus routes, as well as light rail and para-transit services for seniors and people with disabilities. Tri-Met has continued to

Journal of Public Transportation, Vol. 5, No. 2, 2002
118
grow transit ridership by offering exceptional service and continually working toimprove the system.
The agency has developed an Intelligent Transportation Systems (ITS) planto ensure the Portland region is well prepared to realize the benefits of ITS. Tri-Met has planned projects that support regional integration, build on the agency’sexisting infrastructure, and offer opportunities for future ITS expansion (ParsonsBrinkerhoff, Batelle 2001). One of the 12 projects included in this plan is signalpriority. The initial scope of the signal priority project is to provide priority at 250traffic signals on seven routes in the City. Total project cost is estimated at $4.5million with initial field installation, completed in July 2001, and field-testing tobe completed by summer 2002.
Tri-Met has been using AVL to monitor and control its bus operation for twoyears. The AVL system uses onboard Global Positioning Systems (GPS)receivers to monitor the buses via the Bus Dispatch System (BDS). The BDSsystem, developed by Orbital Sciences Corporation, is connected to the vehicle’sonboard computer, which contains route and schedule information. Integration ofthis information allows the bus to determine schedule status on a real-time basis.This permits the Smart Bus concept to only allow the bus to activate the Opticomemitter when the vehicle is behind schedule and if certain other criteria are met.
Project Description
The first phase of the project involved implementation on Route104–Division and Route 4–Fessenden in Portland. The Division route operatesmainly on SE Division Street. The bus route travels through 31 traffic signals (ineach direction), along 10 miles of roadway, extending from downtown Portlandto the City of Gresham. The extent of the signal priority project is within the citylimits of Portland outside of the city center, stopping 3 miles west of the busroute’s eastern terminus, downtown Gresham. This corridor carries 6,500 ridersper day with an average load of 26 passengers.
The Fessenden route is more circuitous, traveling on several arterials andcollectors in North Portland. The route is approximately 9 miles in length with33 signals on the outbound route and 25 signals on its inbound route. Portions ofthe route operate on a couplet outside of the downtown. The Fessenden route car-ries 7,820 riders per day.

Detection Range Setting
119
These routes were good candidates for signal priority because of the spac-ing of signals, their ridership, and headways (7 minutes during the peak hour).The corridors also have a number of simple two-phase intersections, which aresimplistic from the traffic engineering perspective. Further, because of the natureof the routes and lower traffic intensities, changes to the signal timing were ofless concern on several of the intersections.
An additional advantage of selecting the Opticom system in Portland is thatalong with signal priority, the traffic signals are also upgraded with emergencyvehicle (fire and emergency medical services vehicles only) preemption equip-ment. The majority of the traffic signals on these routes previously did not havepreemption equipment installed because the intersections predated the equip-ment.
MethodologySignal priority consists of two components: the bus must be detected by the
traffic signal and the traffic signal must accept the request for priority. Asdescribed above, Portland evaluated several detection methodologies in its pilotproject and determined that the Opticom system by 3M would be utilized for busdetection. The Opticom system is currently the most widely used priority andpreemption detection system in the United States.
Bus Detection System
The challenge for implementing the concept successfully is the detectionsystem, which must place a call at an appropriate time in order to be effective. Acall placed too late during the bus phase can result in a missed opportunity. A callplaced to soon can result in the provision of green time that cannot be used effec-tively.
The Opticom system is relatively simple: data are transmitted from the busto the traffic signal via an emitter and an optical detector. An emitter mounted onthe bus is activated to send an encoded message to the traffic signal. A detectorlocated at the intersection receives the signal and converts it to a message to thecontroller. A phase selector within the controller cabinet makes the request forpriority within the traffic signal controller and also logs the information withinthe unit.

Journal of Public Transportation, Vol. 5, No. 2, 2002
120
Opticom can provide two pieces of information. First, the system requestsan immediate request for service. This request for service can be controlled intwo ways. The bus, using the Smart Bus concept, controls the time of the request.The detection range setting of the Opticom receiver controls the time of therequest. The Opticom transmitter can also provide a bus identification number,which can be used to distinguish bus types. Setting the distance for the detectionrange provides an opportunity to increase the usefulness of the priority requestby requesting priority at a location that increases the likelihood that the bus willprogress through the signal during the priority call. Other criteria that control theemitter within the Smart Bus concept are shown in Figure 1. The Smart Bus onlyactivates the emitter when the bus is on route, in service for passengers, its doorsare closed, or when the bus is running late. The threshold for determiningwhether the bus is late is set at 90 seconds. Once the bus has reached this thresh-old and is behind schedule, the emitter will be active until it has gained 60 sec-onds and is less than 30 seconds behind schedule.
Traffic Signal Timing
The traffic signal software used by the City provides a range of priority andpreemption options as well as recovery options to reduce bus delays. The strate-gies are in place throughout the day while buses operate on the system. Prioritycan be requested on any of the legs of the intersection. The maximum extensionis constrained by intersection elements, but range from 0 to 40 seconds. The trun-cation also is dependent on the configuration of the intersection. Table 1 sum-marizes some of the limitations associated with the signal timing as it relates tobus operations.
During this implementation, red truncation and green extension are utilizedto provide priority. The basic concept of green extension and red truncation isgenerally well understood. The maintenance of coordination requires that thephase length changes be implemented within the constraints of the overall cyclelength; considerations include minimum walk time, flashing DON’T WALK time,and minimum vehicle green time.

Detection Range Setting
121
Figure 1. Decision framework for emitter activation

Journal of Public Transportation, Vol. 5, No. 2, 2002
122
Table 1Traffic Signal Timing Considerations for Signal Priority
Parameter Limitation Comment
Pedestrian Lack of pedestrian detection (push Presence of pedestrian detectiondetection buttons for actuation) requires the opposing increases the potential responsiveness
pedestrian phase to time every cycle of the intersection to serve transit
Pedestrian Time for flashing Don’t Walk cannot Pedestrian detection reduces the needtiming be reduced in any case to recall pedestrian phases each cycle,
thereby improving the responsivenessto transit
Multiphase Phase skipping is not allowed in the Additional phases at intersectionsintersections State of Oregon; thus minimum vehicle increase the amount of required time
times and clearance times must be for serviceconsidered for all phases (legislativelimitation)
Cycle Low cycle lengths reduce the flexibility The trade-off between flexibility andlengths of the engineer to extend the timing efficiency at the intersections has been
provided to the bus, although may consistently discussed; lower cycleprovide better responsiveness overall length typically improves bus operations
Priority Decision Logic
The time the call is entered dictates the response of the controller. The con-troller logic determines whether to use green extension (extend a current greenindication for the bus) or red truncation (shorten other nonbus phases), depend-ing on whether the controller is in the bus or nonbus phase, respectively. In thecase of a simple two-phase intersection, the logic is simplified, and for purpos-es of discussion, this case will be reviewed. To set the detection range, bothextension and truncation must be considered to determine an appropriate dis-tance from the intersection. A procedure developed as a part of this projectestablishes the location of Opticom detectors on the bus line and determines therange at which the detector will identify the bus and initiate the bus priorityplan. As shown in Figure 2, the decision is based on the current status of the busphase when the call is received.
Priority Distance Setting
Establishing the priority distance is a critical portion of the implementation.Ideally, the detection would occur at the furthest upstream point to give advanced

Detection Range Setting
123
Figure 2. Decision framework for priority plan selection
notice for the approach of the buses. Because the Opticom system results in animmediate request for service, the distance from the traffic signal at which thecall is received dictates the length of the extension possible. To address limita-tions, the detection range is set to reduce the length of the call based on theamount of priority time that is available within the extension portion of the pri-ority service. Essentially, the length of advance time that can be accommodatedis limited by lack of knowledge on the desired time of service and limitations inthe controller software’s decision-making logic. The maximum advance time isthe length by which the bus phase can be extended.
For purposes of further explanation, a simple two-phase intersection withbuses on both phases will be described. While simplistic, the explanation is alsopractical because the intersection of N. Albina Avenue and N. KillingsworthStreet is exactly this configuration. As shown in Figure 3, Route 4 Fessendenoperates on phase 2 (N. Albina Avenue) and Route 72 Killingsworth operates onthe cross-street phase 4. At this intersection, the coordinated movement isKillingsworth Street (the north–south movement).
Green Extension Distance-Setting Procedure
The green extension plan is used when the call is received on a phase thatis already green (i.e., a call on phase 2 is received from Route 4 while phase is
Journal of Public Transportation, Vol. 5, No. 2, 2002
124
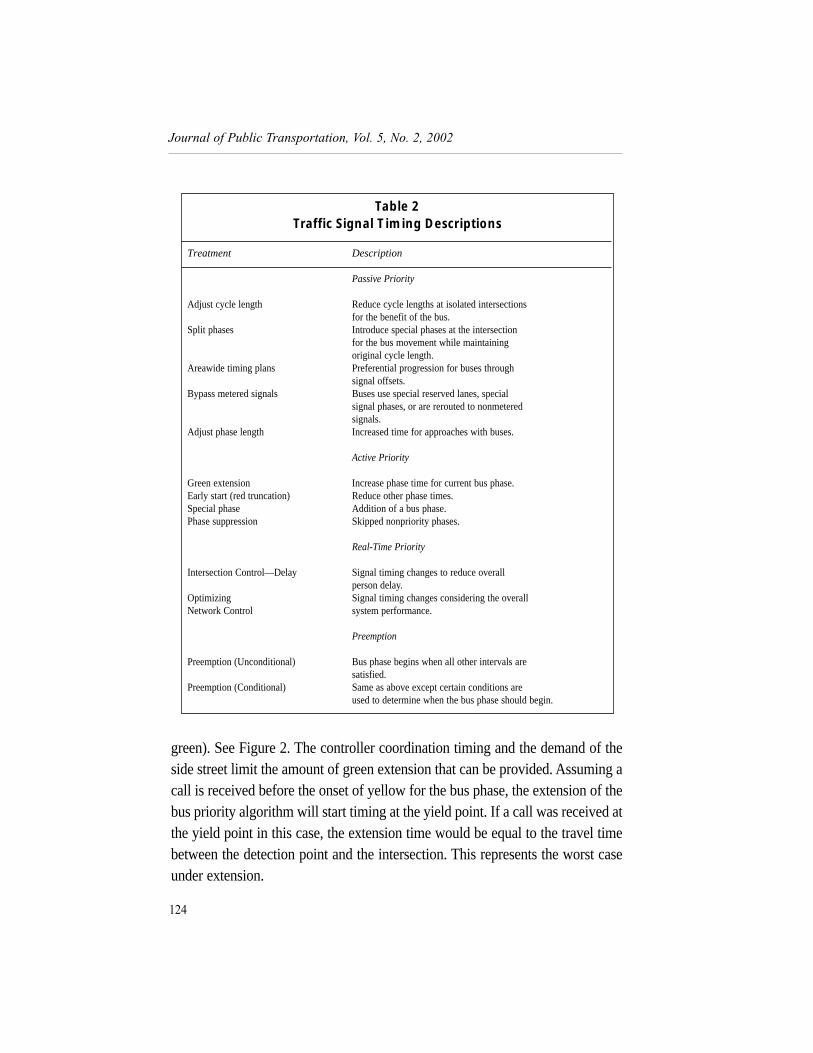
Table 2Traffic Signal Timing Descriptions
Treatment Description
Passive Priority
Adjust cycle length Reduce cycle lengths at isolated intersectionsfor the benefit of the bus.
Split phases Introduce special phases at the intersectionfor the bus movement while maintainingoriginal cycle length.
Areawide timing plans Preferential progression for buses throughsignal offsets.
Bypass metered signals Buses use special reserved lanes, specialsignal phases, or are rerouted to nonmeteredsignals.
Adjust phase length Increased time for approaches with buses.
Active Priority
Green extension Increase phase time for current bus phase.Early start (red truncation) Reduce other phase times.Special phase Addition of a bus phase.Phase suppression Skipped nonpriority phases.
Real-Time Priority
Intersection Control—Delay Signal timing changes to reduce overallperson delay.
Optimizing Signal timing changes considering the overallNetwork Control system performance.
Preemption
Preemption (Unconditional) Bus phase begins when all other intervals aresatisfied.
Preemption (Conditional) Same as above except certain conditions areused to determine when the bus phase should begin.
green). See Figure 2. The controller coordination timing and the demand of theside street limit the amount of green extension that can be provided. Assuming acall is received before the onset of yellow for the bus phase, the extension of thebus priority algorithm will start timing at the yield point. If a call was received atthe yield point in this case, the extension time would be equal to the travel timebetween the detection point and the intersection. This represents the worst caseunder extension.

Detection Range Setting
125
Coordinated Bus Phase Green Extension. In this case (Route 4 bus onphase 2), a call arrives during the green interval for phase 2. The limitation forgreen extension is determined by the minimum times for the phase 4 WALK,FLASH DON’T WALK (FDW), Yellow and All Red clearance intervals (Y+AR),and the minimum WALK (typically 4 seconds) for phase 2. This assumes that thebus phase (phase 2) of the next cycle maintains the phase 2 yield point (start ofFDW) for the next cycle after the bus call has arrived. This practice preserves thecoordination with the adjacent signals.
Noncoordinated Bus Phase Green Extension. For the noncoordinatedphase (bus on phase 4), the lengthen plan is similar to what was described above.In this case, the phase 2 forceoff (start of FDW) remains zero and the phase 4Y+AR must be accommodated, followed by the minimum phase 2 WALK time.
Figure 3. Case study intersection: N Albina/N Killingsworth

Journal of Public Transportation, Vol. 5, No. 2, 2002
126
In either of these cases, it is desirable to set the range to a distance equal tothe travel time associated with the extension time available. This approach lim-its the amount of unutilized priority provided and ensures that once a call isreceived and an extension plan is initiated the bus will pass through the intersec-tion during the current cycle.
Red Truncation Plans Distance Setting
Red truncation is activated when a call is received on a phase that is notgreen. Red truncation reduces the length of the other (nonbus) phases to returnto the bus phase earlier. In this scenario, the forceoffs for all phases change fromtheir normal value. The worst case under the shorten plan is a received call thatdoes not allow a truncation. Truncation is limited by the amount of time requiredfor the recalled phases (pedestrian and vehicle).
Coordinated Nonbus Phase Red Truncation. The nonbus phase is trun-cated to the new forceoff associated with the bus plan. Truncating the nonbusphase allows an earlier return to the bus phase. In a two-phase intersection, theshorten plan is limited by the minimum times for the WALK, FDW, and Y+AR.The truncation benefit is provided in what normally would be a solid Don’tWALK (DW) indication for phase 4. In some instances, WALK timing for phase 4was reduced to provide more flexibility for the buses.
Noncoordinated Bus Phase Red Truncation. The City’s signal timingpolicy maximizes the WALK portion of the coordinated phase. For this reason, thered truncation plan requires a forceoff that truncates the WALK portion and initi-ates the FDW before its normal forceoff. In this case, the truncation value shouldbe set to reduce the WALK to an amount that allows the early return to the non-coordinated phase (phase 4).
In either case, it is desirable to set the range to a distance greater than thecoordinated phase FDW value, so that the bus can be detected with adequatetime for the controller to react. Provided that the proper sight distance exists andthe bus stop spacing allows, the green extension and red truncation plans can bedeveloped so that a bus will not stop at a traffic signal under off-peak trafficconditions.

Detection Range Setting
127
Operational Issues of Bus ArrivalThe arrival of the bus at the traffic signal is dependent on the speed at which
the vehicle is traveling, the impedance it experiences, and the stops that it makes.These three factors may reduce the range at which it is desirable to place a lowpriority call to the controller. As discussed, providing priority to the bus phaseprematurely may not only delay the bus, but it also may reduce the effectivenessof the traffic signal in its capacity to serve nonbus phase traffic. Each of thesefactors was examined to identify operational results associated with the arrival ofthe bus at the intersection.
Bus Travel Speed
To set the detection range, the assumed travel speed for the bus was set toequal the speed limit. In some cases, where the speed limit was greater than theexpected speed, a lower value was used. A lower value was also considered inareas of denser development, where on-street parking, increased pedestrianactivity, and numerous access driveways can slow the average speed of buses.
Bus Impedance
The impedance the bus experiences en route to the bus stop could result frompedestrians, cyclists, or parked vehicles. Bus impedance was incorporated into thetravel speed where possible. Field studies during implementation may providemore insight as to the modifications necessary to accommodate special situations.
Stop Location
Nearside bus stops have been the subject of considerable debate. Nearsidestops have the potential to render a call useless due to bus boarding and alight-ing in advance of the traffic signal. The initial operating concept was to set therange of the emitter at a distance 40 feet past the upstream bus stop (between thebus stop and the next traffic signal). This would eliminate the potential of a busrequesting priority and then stopping upstream, thereby eliminating the need forthe priority.
Field tests of the Opticom emitter determined that in several locations thisapproach limits the range to less than 300 feet, reducing the overall effectivenessof the system. The potential limitation suggests more careful review of the busstop location, possibly relocating it to the far side of the intersection.

Journal of Public Transportation, Vol. 5, No. 2, 2002
128
When a bus places a priority call and has to stop upstream of the intersec-tion, the call may be inappropriate. This occurs frequently because bus stop spac-ing standards place stops every two blocks (300 to 700 feet upstream of the traf-fic signal) in many areas throughout the City. To increase the effectiveness of thepriority system, the rules were created for the range setting:
(The range will be set to maximize detection time in advance of the trafficsignal, provided the following rules are followed. The smallest value from thesethree rules will be used to set the range for the detector.)
• Rule 1—Extension Time Distance: The allowable range calculation will bebased on the extension time available in the controller. The speed limit willbe used to convert the extension time to an appropriate distance.Truncation time should not be the criterion, since the benefit of the trunca-tion suggests additional green time following the truncation should allowbus passage.
• Rule 2—Bus Stop Distance: The range should be 40 feet downstream ofthe bus stop closest to the traffic signal (disregarding nearside stops).
• Rule 2A–Modification to Bus Stop Distance: The first upstream bus stopwill be disregarded if it is within 400 feet of the traffic signal and calcula-tions per Rule 1 provide a distance greater than 900 feet. In this case, thedistance of the second upstream bus stop will be used for comparison withthe extension time distance.
• Rule 2B—Stop Utilization Modification: Tri-Met’s AVL data will bereviewed to determine the percentage of buses that stop at the upstream busstop. If this number is greater than half, Rule 2 will be followed.
• Rule 3—Traffic Signal Distance: The distance to the nearest upstream traf-fic signal will be noted to eliminate the potential of a priority call beingreceived simultaneously at two signals, as this may lead to ineffective calls.
Rule 2A was created to reduce the limitation of closely-spaced bus stops onthe priority corridors. At many of the intersections on the Fessenden and Divisionroutes, the Extension Time Distance exceeds the Bus Stop Distance. To reducethe effect of Rule 2 at locations where the first upstream stop is seldom used, Rule

Detection Range Setting
129
2A was created. In cases where Rule 2 is overly restrictive, the second upstreamstop will be used as the criteria to compare the extension distance. The logicbehind this decision was that the controller could recover from a call that is lostat an upstream stop, but it is less desirable to have two interruptions in the nor-mal system resulting in poor responsiveness when the bus arrives at the trafficsignal.
Ideally, information regarding stop frequency would be used to determinewhether the bus stop upstream of the traffic signal should be considered. In thisinitial implementation, no data have been provided and thus only anecdotal obser-vations will be used to determine whether the bus stops may be disregarded.
ResultsThe bus priority system has been implemented at 58 of the 72 intersections
on Routes 4 and 104. For evaluation of the bus operation, Tri-Met’s AVL sys-tem has been used to record the results for the implementation. Each route hasbeen cut into segments to delineate the effects at each traffic signal. The seg-ments vary from 800 to 2,500 feet and include up to three signals. Tri-Met’sAVL system records many different pieces of data about every time any buspasses by a bus stop. The system records arrival time near a segment to initial-ize the start of the segment time and segment end time to identify the total trav-el time for each segment.
Early results have shown that improvements in travel time typically rangefrom 5 to 8 percent of the overall travel time. On certain segments, the travel timereduction increases to as much as 24 percent of the travel time, but the value ishighly dependent on several factors such as the length and the number of trafficsignals within the segment.
Bus Priority Distance Setting Example: Northeast 33rd/SandyTo illustrate the various points made above, we have chosen the
Northeast 33rd/Sandy intersection to provide some additional context relat-ed to the priority distance setting. This example presents a summary of theapplication and constraints of the experience using actual headway anddetection range values.

Journal of Public Transportation, Vol. 5, No. 2, 2002
130
Intersection Characteristics
This particular intersection was chosen as an example because it featuresboth a nearside (inbound direction) and a farside (outbound direction) bus stopas shown in Figure 4. The Sandy Route 12 travels on the Northeast SandyBoulevard corridor operating at 10-minute headways during peak periods. Thespeed limit in this vicinity is 30 mph.
Bus Travel Speed
On Sandy Boulevard, the assumed travel speed for the bus was set lowerthan the speed limit because of the nature of the corridor in this area. As shownin Figures 5 and 6, bus ridership and short stop spacing along this corridor resultin low average speeds. Based on field observations, 15 mph was used.
Figure 4. NE 33rd/Sandy intersection

Detection Range Setting
131
Figure 5. Farside stop at NE 33rd/Sandy (outbound direction)
Figure 6. Nearside stop at NE 33rd/Sandy (inbound direction)
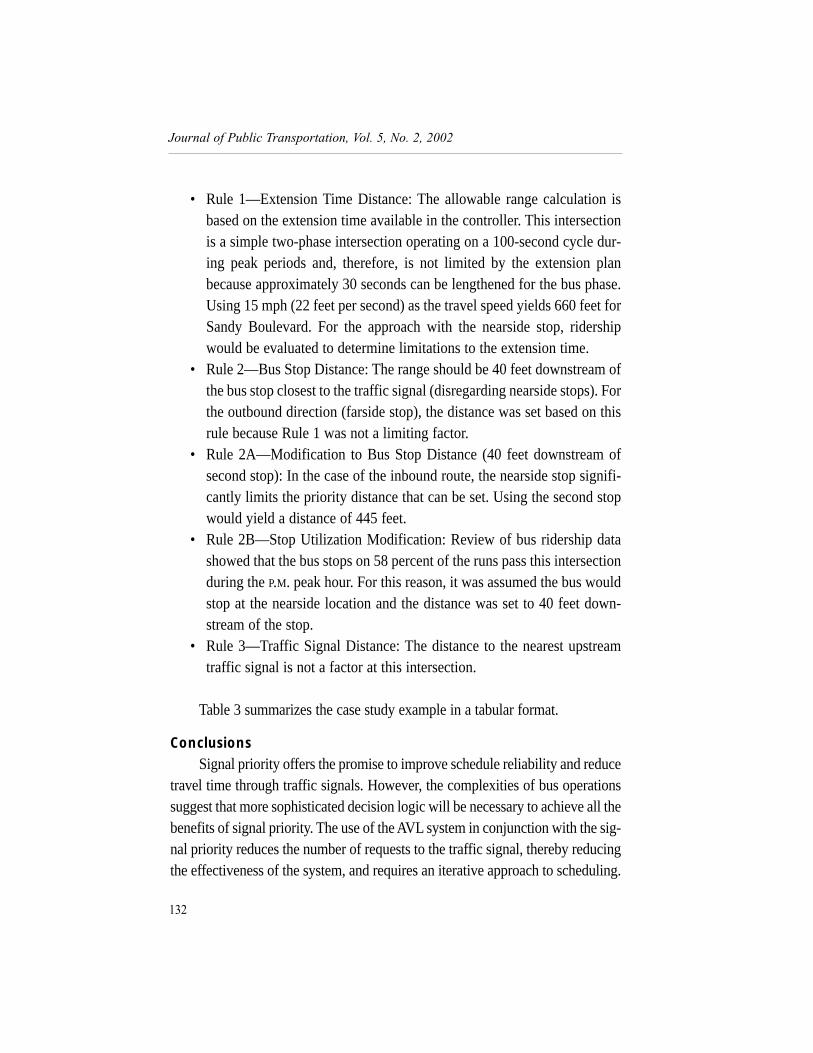
• Rule 1—Extension Time Distance: The allowable range calculation isbased on the extension time available in the controller. This intersectionis a simple two-phase intersection operating on a 100-second cycle dur-ing peak periods and, therefore, is not limited by the extension planbecause approximately 30 seconds can be lengthened for the bus phase.Using 15 mph (22 feet per second) as the travel speed yields 660 feet forSandy Boulevard. For the approach with the nearside stop, ridershipwould be evaluated to determine limitations to the extension time.
• Rule 2—Bus Stop Distance: The range should be 40 feet downstream ofthe bus stop closest to the traffic signal (disregarding nearside stops). Forthe outbound direction (farside stop), the distance was set based on thisrule because Rule 1 was not a limiting factor.
• Rule 2A—Modification to Bus Stop Distance (40 feet downstream ofsecond stop): In the case of the inbound route, the nearside stop signifi-cantly limits the priority distance that can be set. Using the second stopwould yield a distance of 445 feet.
• Rule 2B—Stop Utilization Modification: Review of bus ridership datashowed that the bus stops on 58 percent of the runs pass this intersectionduring the P.M. peak hour. For this reason, it was assumed the bus wouldstop at the nearside location and the distance was set to 40 feet down-stream of the stop.
• Rule 3—Traffic Signal Distance: The distance to the nearest upstreamtraffic signal is not a factor at this intersection.
Table 3 summarizes the case study example in a tabular format.
ConclusionsSignal priority offers the promise to improve schedule reliability and reduce
travel time through traffic signals. However, the complexities of bus operationssuggest that more sophisticated decision logic will be necessary to achieve all thebenefits of signal priority. The use of the AVL system in conjunction with the sig-nal priority reduces the number of requests to the traffic signal, thereby reducingthe effectiveness of the system, and requires an iterative approach to scheduling.
Journal of Public Transportation, Vol. 5, No. 2, 2002
132

AVL also promises to make the use of the emitter more selective depending onthe status of the bus and boarding and alighting passengers. Further, measuressupportive of signal priority such as the relocation of bus stops to the far side ofeach signalized intersection and the provision of stops at a distance upstream thatincreases the allowable range for the detection system.
Detection Range Setting
133
Table 3NE Sandy/33rd Avenue Intersection Tri-Met Route 12
Rule 1
DistanceExtension BetweenTime (ft) Stops (ft)
Inbound (nearside) 660 485
Outbound 660 676
Rule 2
Distance fromSignal of Unstream Stop
Stp (ft) Utilization
Inbound (nearside) 109 58%
Outbound 549 69%
Rule 3Distance Between Critical
Signal and Upstream CriticalSignal (ft) Distance (ft)
Inbound (nearside) 1,718 69Outbound 1,928 549

AcknowledgementsThe authors extend thanks to fellow staff from the City of Portland,
Kittelson & Associates, Inc., and Tri-Met who in working on the project havemade this implementation an enjoyable undertaking.
ReferencesKloos, W. C., and K. Turner. 1999. Implementing traffic signal priority for
buses. Compendium of Technical Papers. Institute of Transportation Engineers.Kloos, W. C., A. R. Danaher, and K. M. Hunter-Zaworski. 1994. Bus prior-
ity at traffic signals in Portland: The Powell Boulevard pilot project.Compendium of Technical Papers. Institute of Transportation Engineers:420–424.
Parsons Brinkerhoff, Batelle. 2001. Tri-Met 5-year IntelligentTransportation Systems plan. Final Report. Portland, Oregon.
About the AuthorsPETER KOONCE ([email protected]) is an engineer with Kittelson &
Associates and is based out of the Portland, Oregon, office. Mr. Koonce holds anundergraduate degree from Oregon State University and a Master of Sciencefrom Texas A&M University. He is a registered Professional Engineer in theState of Oregon.
TOM URBANIK ([email protected]) is a professor and Chair of Excellencein Transportation at the University of Tennessee in Knoxville. Dr. Urbanikreceived a Ph.D. from Texas A&M University, Master of Science in civil engi-neering from Purdue University, Bachelor of Science in civil engineering fromSyracuse University, and a Bachelor of Science in forest engineering from theNew York State College of Environmental Science and Forestry. He is a regis-tered engineer in Michigan and Texas.
BILL KLOOS ([email protected]) is the signal system man-ager for the City of Portland, Oregon. In that capacity, he manages the TrafficSignals/Street Lighting/ITS Division responsible for the planning, design, con-struction, operation, and maintenance of nearly all the traffic signals and street-lights within Portland. Mr. Kloos is a graduate of Montana State University.
Journal of Public Transportation, Vol. 5, No. 2, 2002
134

WILLIE ROTICH ([email protected]) is the ITS engineerfor the City of Portland. Mr. Rotich was the project manager for the City ofPortland on the Transit Signal Priority project. He is a graduate of Oregon StateUniversity.
JOHN RINGERT ([email protected]) is the consultant team projectmanager for Kittelson & Associates. He has more than 11 years experience intraffic design, traffic engineering, and planning. Mr. Ringert received a Bachelorof Science degree from the University of Idaho and received a Master of Sciencedegree from Texas A&M University.
Detection Range Setting
135