amador water agency 2015 urban water management plan
TRANSCRIPT

Amador Water Agency 2015 Urban Water Management Plan
Prepared by:
RMC Water and Environment
Amador Water Agency
June 2016

Amador Water Agency 2015 Urban Water Management Plan Table of Contents
June 2016 i
Table of Contents Chapter 1 Introduction and Overview .................................................................................1-1
1.1 Overview ...............................................................................................................1-1
1.2 UWMP Organization ..............................................................................................1-2 Chapter 2 Plan Preparation ..................................................................................................2-1
2.1 Basis for Preparing a Plan .....................................................................................2-1 2.2 Regional Planning .................................................................................................2-1 2.3 Individual or Regional Planning and Compliance ...................................................2-2
2.4 Fiscal or Calendar Year and Units of Measure ......................................................2-2 2.5 Coordination and Outreach ....................................................................................2-3 Chapter 3 System Description .............................................................................................3-1
3.1 General Description ...............................................................................................3-1 3.2 Service Area Boundary Maps ................................................................................3-3
3.3 Service Area Climate .............................................................................................3-4 3.4 Service Area Population and Demographics ..........................................................3-6 Chapter 4 System Water Use ...............................................................................................4-1
4.1 Water Uses by Sector ............................................................................................4-1
4.2 Distribution System Water Losses .........................................................................4-5 4.3 Water Savings from Codes, Standards, or Transportation and Land Use Plans ....4-6 4.4 Water Use for Lower Income Households..............................................................4-6
4.5 Climate Change Impacts to Water Demand ...........................................................4-6 Chapter 5 SB X7-7 Baselines and Targets ..........................................................................5-1
5.1 Updating Calculations from 2010 UWMP ...............................................................5-1 5.2 2015 Compliance ...................................................................................................5-5 5.3 R-GPCD ................................................................................................................5-7 Chapter 6 System Supplies ..................................................................................................6-1
6.1 Purchased or Imported Water ................................................................................6-1
6.2 Groundwater ..........................................................................................................6-1 6.3 Surface Water .......................................................................................................6-3 6.4 Stormwater ............................................................................................................6-4
6.5 Wastewater and Recycled Water ...........................................................................6-4 6.6 Desalinated Water ............................................................................................... 6-13
6.7 Exchange or Transfer Opportunities .................................................................... 6-13 6.8 Future Water Projects .......................................................................................... 6-13 6.9 Summary of Existing and Planned Sources of Water ........................................... 6-16
6.10 Climate Change Impacts to Supply ...................................................................... 6-19 Chapter 7 Water Supply Reliability Assessment ................................................................7-1
7.1 Constraints on Water Sources ...............................................................................7-1 7.2 Reliability by Type of Year .....................................................................................7-2 7.3 Supply and Demand Assessment ..........................................................................7-3
7.4 Regional Supply Reliability ....................................................................................7-4 Chapter 8 Water Shortage Contingency Planning ..............................................................8-1
8.1 Stages of Action ....................................................................................................8-1 8.2 Prohibitions on End Uses ......................................................................................8-1
8.3 Penalties, Charges, Other Enforcement of Prohibitions .........................................8-4 8.4 Consumption Reduction Methods ..........................................................................8-5 8.5 Determining Water Shortage Reductions ...............................................................8-6
8.6 Revenue and Expenditure Impacts ........................................................................8-6 8.7 Resolution or Ordinance ........................................................................................8-6
8.8 Minimum Supply Next Three Years .......................................................................8-7
Amador Water Agency 2015 Urban Water Management Plan List of Tables
June 2016 ii
Chapter 9 Demand Management Measures ........................................................................9-1
9.1 Conservation Measure Organization ......................................................................9-1
9.2 DMM Categories....................................................................................................9-2 Chapter 10 Plan Adoption, Submittal, and Implementation ............................................... 10-1
List of Tables Table 2-1: Public Water Systems (DWR Table 2 -1) ............................................................. 2-1 Table 2-2: Plan Identification (DWR Table 2 -2) .................................................................... 2-2
Table 2-3: Agency Identification (DWR Table 2 -3) .............................................................. 2-3 Table 2-4: Water Supplier Information Exchange (DWR Table 2 -4) ................................... 2-4
Table 2-5: Coordination with Appropriate Agencies (Optional) ......................................... 2-4 Table 3-1: Climate (Optional) ................................................................................................ 3-5 Table 3-2: Population - Current and Projected (DWR Table 3 -1) ........................................ 3-7
Table 4-1: Past Water Demand (Optional) ........................................................................... 4-2 Table 4-2: Demands for Potable and Raw Water – Actual (DWR Table 4 -1) ...................... 4-2
Table 4-3: Average Water Use per Connection (Optional) ................................................. 4-3 Table 4-4: Projected Number of Agency Service Connections (Optional) ........................ 4-4
Table 4-5: Demands for Potab le and Raw Water - Projected (DWR Table 4 -2) ................. 4-5 Table 4-6: Total Water Demands (DWR Table 4 -3) .............................................................. 4-5 Table 4-7: 12 Month Water Loss Audit Reporting (DWR Table 4 -4) ................................... 4-6
Table 4-8: Inclusion in Water Use Projections (DWR Table 4 -5) ........................................ 4-6 Table 5-1: Baseline Period Ranges (SB X7 -7 Table-1) ........................................................ 5-2
Table 5-2: Gallons Per Capita Per Day (G PCD) (SB X7-7 Table 5) ..................................... 5-4 Table 5-3: Baselines and Targets Summary (DWR Table 5 -1)............................................ 5-5 Table 5-4: 2015 Compliance (DWR Table 5 -1) ..................................................................... 5-6
Table 6-1: Historic Groundwater Levels in Cosumnes Subbasin (Optional) .................... 6-2 Table 6-2: Groundwater Volume Pumped (DWR Table 6 -1) ............................................... 6-3
Table 6-3: Wastewater Collec ted Within Service Area in 2015 (DWR Table 6 -2)............... 6-7 Table 6-4: Wastewater Treatment and Discharge Within Service Area in 2015 (DWR Table
6-3) ................................................................................................................................. 6-8
Table 6-5: 2010 UWMP Recycled Water Use Projection Compared to 2015 Actual (DWR Table 6-5) ....................................................................................................................... 6-9
Table 6-6: Current and Projected Recycled Water Direct Beneficial Uses Within Service Area (DWR Table 6 -4) .................................................................................................. 6-11
Table 6-7: Methods to Expand Future Recycled Water Use (DWR Table 6 -6) ................. 6-13
Table 6-8: Expected Future Water Supply Projects or Programs (DWR Table 6 -7) ........ 6-14 Table 6-9: Water Supplies - Actual (DWR Table 6 -8) ......................................................... 6-17
Table 6-10: Water Supplies - Projected (DWR Table 6 -9) ................................................. 6-18 Table 7-1: Basis of Water Year Data (DWR Table 7 -1) ........................................................ 7-2 Table 7-2: Normal Year Supply and Demand Comparison (DWR Table 7 -2) ..................... 7-3
Table 7-3: Single -Dry Year Supply and Demand Comparison (DWR Table 7 -3) ............... 7-3 Table 7-4: Multiple -Dry Years Supply and Demand Comparison (DWR Table 7 -4) ........... 7-4
Table 8-1: Stages of Water Shortage Contingency Plan (DWR Table 8 -1) ........................ 8-1 Table 8-2: Restrictions and Prohibitions on End Uses (DWR Table 8 -2) .......................... 8-1
Table 8-3: Stages of Water Shortage Contingency Plan - Consumption Reduction Methods (DWR Table 8 -3) ............................................................................................. 8-5
Table 8-4: Preparation Actions for a Catastrophe (Optional) ............................................. 8-7
Table 8-5: Minimum Supply Next Three Years (DWR Table 8 -4) ........................................ 8-7 Table 9-1: 14 DMMs vs. 2015 Guidebook DMMs (Optional) ................................................ 9-2
Table 9-2: Drought Surcharge Rates for Every Water Conservation Stage (Optional) ..... 9-4

Amador Water Agency 2015 Urban Water Management Plan List of Figures
June 2016 iii
Table 9-3: Public and School Education Over Past Five Years (Optional) ........................ 9-6 Table 10-1: Notification to Cities and Counties (DWR Table 10 -1) .................................. 10-1
List of Figures Figure 3 -1: Amador Water Agency Water Systems ............................................................ 3-3
Figure 3 -2: Map of Amador County ...................................................................................... 3-4 Figure 6 -1: Map of Cosumnes Subbasin and Amador Water Agency Wells .................... 6-2 Figure 6 -2: Wastewater Collection Systems in the Agency's Service Area ...................... 6-6
Figure 9 -1: Anonymous Water Waste Report Form on the Agency's Website ................. 9-3
Appendices Appendix A Completed UWMP Checklist Appendix B Public, City, and County Noticin g Appendix C Population Projection Support
Appendix D AWWA Water Loss Audits Appendix E SBX7-7 Tables and Data
Appendix F Population Tool TM Appendix G Lake Camanche Groundwater Study: Extracted Pages
Appendix H Regional Approach to Reuse Study: Extracted Pages Appendix I Amador Water Agency Water Code Appendix J Drought Rate Structure Resolution No 2015 -19
Appendix K Amador Water Agency Emergency Response Plan Appendix L Samples of Water Conservation – Related Public Information Distributed by Amador Water Agency Appendix M June 2015 Rate Update and Water Shortage Financial Strategy Appendix N UWMP Adoption Resolution
Appendix O Public Meeting Agenda Appendix P Energy Intensity TM
Appendix Q Climate Change Vulnerability Assessment Appendix R UWMP Submission Appendix S Public Comments and Responses

Amador Water Agency 2015 Urban Water Management Plan List of Abbreviations
June 2016 iv
List of Abbreviations
AF Acre-feet
AFY Acre-feet per year
Agency Amador Water Agency
ARSA Amador Regional Sanitation Agency
AWS Amador Water System
BMP Best Management Practice
CAWP Central Amador Water Project
cfs cubic feet per second
CII Commercial, Industrial, and Institutional
CSD Community Service District
CUWCC California Urban Water Conservation Council
CWD County Water District
DMM Demand Management Measure
DWR California Department of Water Resources
EBMUD East Bay Municipal Utility District
EID El Dorado Irrigation District
ETo Reference EvapoTranspiration
FERC Federal Energy Regulatory Commission
GPCD gallons per capita per day
gpm gallons per minute
GSL Gravity Supply Line
ID Improvement District
IRWMP Integrated Regional Water Management Plan
JVID Jackson Valley Irrigation District
kWh kilowatt-hours
mgd Million gallons per day
MAC Mokelumne/Amador/Calaveras
MokeWISE Mokelumne Watershed Inter-Regional Sustainability Evaluation
MOU Memorandum of Understanding
PG&E Pacific Gas and Electric
UWMP Urban Water Management Plan
UMRWA Upper Mokelumne River Watershed Authority

Amador Water Agency 2015 Urban Water Management Plan Introduction and Overview
June 2016 1-1
Chapter 1 Introduction and Overview
This Urban Water Management Plan (UWMP) has been prepared in accordance with the Urban Water Management Planning Act (Act). The Act became part of the California Water Code (CWC) with the passage of Assembly Bill 797 during the 1983-1984 regular session of the California legislature and is codified in CWC Division 6, Part 2.6, and §§10610 through §§10657. The Act requires urban water suppliers providing municipal water to more than 3,000 connections or supplying more than 3,000 acre-feet (AF) of water annually to adopt and submit an UWMP every five years to the California Department of Water Resources (DWR). Subsequent assembly bills have amended the Act, including the Water Conservation Act of 2009, known as SB X7-7. SB X7-7 required agencies to establish water use targets for 2015 and 2020 that would result in statewide savings of 20% by 2020. In preparing the 2015 UWMP, DWR’s Guidebook for Urban Water Suppliers has been followed, as shown in the comprehensive checklist found in Appendix A. This 2015 UWMP provides an update to Amador Water Agency’s 2010 UWMP.
1.1 Overview Several recent planning efforts undertaken by the Agency have informed this UWMP. These planning efforts include the 2010 AWA Water Conservation Plan, the 2012 Groundwater Supply Study and Integrated Regional Groundwater Management Plan for the Lake Camanche Water Improvement District No.7, the 2013 Mokelumne/Amador/Calaveras (MAC) Integrated Regional Water Management Plan (IRWMP) Update, the 2013 Regional Approach for Reuse Study, the 2015 Conservation Policy Update, and the 2015 Mokelumne Watershed Interregional Sustainability Evaluation (MokeWISE) Program. Information from the Amador County General Plan was also used in the preparation of this plan. Additionally, the Agency is preparing a Long Term Water Needs and Supply Study in parallel with this UWMP. The Study will assess the Agency’s ability to meet future demands considering the effects of climate change and a possible Wild and Scenic River designation for the Mokelumne River, which is part of the Agency’s water supply. This study will be closely coordinated with this UWMP so that the two plans inform each other to assist the Agency with planning decisions.
Amador Water Agency (Agency) retails potable and raw water to approximately 14,000 people for municipal, industrial, and irrigation uses, in addition to wholesaling water to other agencies. The water served by the Agency is primarily sourced from the Mokelumne River, although a small portion of the Agency’s customers are served with groundwater. In 2015, the Agency delivered 2,291 AF of potable water to retail customers, 1,156 AF of potable water to wholesale customers, 292 AF of raw water to retail customers, and experienced 2,236 AF of raw and potable water loss. Most of this water was used by residential customers, with the remaining water going to commercial, industrial, and agricultural uses. The total amount of water served to customers over the next 25 years is expected to increase by approximately 100% as the population served by the Agency is expected to increase to over 20,000 people by 2040 and as water demand returns to pre-drought levels.
In this UWMP, the Agency updated its 2015 and 2020 urban water use targets in compliance with SB X7-7 using 2010 U.S. Census data to update its retail service area population and to include its raw water customers. With these modifications to the SB X7-7 calculations performed in the 2010 UWMP, the Agency’s baseline Gallons per Capita per Day (GPCD) water use for the period from 1995 to 2004 is 731 GPCD, its 2015 target is 613 GPCD, and its 2020 target is 495 GPCD. The Agency’s actual 2015 GPCD was 309 GPCD, so the Agency met its 2015 target and is on track to meet its 2020 target. The Agency’s 2015 GPCD is considerably lower than its baseline and 2020 target due to significant reductions in water loss from implementation of the first phase of the Amador Transmission Project, and due to voluntary and mandatory conservation efforts during the drought of 2013 through 2015.
In addition to serving raw and potable water, the Agency provides wastewater collection and treatment services. The volume of wastewater collected and treated within the Agency’s service area in 2015 was

Amador Water Agency 2015 Urban Water Management Plan Introduction and Overview
June 2016 1-2
1,696 AF. Approximately one-third of this wastewater is recycled for use at local golf courses, while the rest is treated and discharged by the Agency or other wastewater treatment agencies in the area. This UWMP summarizes several planning efforts to increase the amount of recycled water delivered within the Agency’s service area.
The Agency intends to use this UWMP, in coordination with other planning documents, to manage its water supplies and water demands over a range of normal year, dry year, and emergency conditions. Due to the size and priority of the Agency’s water rights, the Agency does not anticipate an inability to meet water demand, even in extremely dry years and multi-year droughts.
Amador Water Agency is committed to maximizing available water resources and minimizing the need to obtain additional water supplies. The Agency has done this, and will continue to do so, by utilizing water management tools and developing strategic partnerships with upstream, downstream, and nearby agencies and districts. As outlined in the Agency’s Water Shortage Contingency Plan, water conservation practices have, and will continue to be implemented to mitigate identified shortfalls caused by drought-induced water shortages, in addition to the on-going study of a regional water reclamation solution. Management practices have been developed and implemented to address various contingencies arising from an analysis of demand versus supply as documented herein. The Agency is also committed to working with the public and other agencies to facilitate regional water management efforts and ensure long-term sustainable supplies.
This Urban Water Management Plan was adopted by the Agency’s Board of Directors at a public hearing on June 16, 2016 and was submitted to DWR before July 1, 2016.
1.2 UWMP Organization This document, which presents the Agency’s 2015 UWMP, is organized based on guidance provided by DWR in its UWMP Guidebook and includes references to specific water code section citations, as appropriate. This UWMP has been organized to reflect the same chronological order as the chapters in the UWMP Guidebook.
Due to CWC requirements, standardized tables must be completed by the urban water supplier for the reporting and submittal of UWMP data to DWR. The standardization of the data tables allows DWR to more efficiently manage data, expedite review of UWMPs, and more easily compile data for regional and statewide planning. The standardized DWR tables are submitted to DWR in Microsoft Excel format and have also been embedded in this 2015 UWMP. In addition to the standardized tables, the Agency has included other tables to summarize useful information and data. In order to maintain consistency with numbering of the DWR standardized tables, optional tables included herein that are not required by DWR are labeled as Optional in the table caption. DWR standardized tables are designated as such at the end of each table caption (e.g. DWR Table 2-1).

Amador Water Agency 2015 Urban Water Management Plan Plan Preparation
June 2016 2-1
Chapter 2 Plan Preparation
2.1 Basis for Preparing a Plan This Plan has been prepared to comply with CWC §10617 as Amador Water Agency supplies more than 3,000 acre-feet per year to more than 3,000 customers. The Agency is a publically-owned water system that manages the Amador Water System (AWS), Central Amador Water Project System (CAWP), Lake Camanche Village Area, and La Mel Heights public water supplies and is thus considered an urban water supplier. The number of connections and total water delivered for each system is shown in Table 2-1. The Agency is a retail urban water supplier; while it delivers water to wholesale customers, the volume of water is less than 3,000 AFY, so wholesale tables have not been completed for this UWMP except where appropriate.
Table 2-1: Public Water System s (DWR Table 2-1)
Public Water System
Number
Public Water System
Name
Number of Municipal
Connections 2015
Volume of
Water Supplied
2015*
CA0310002,
CA0310003
Amador Water
System (AWS) 3,748 2,985
CA0310012,
CA0310009,
CA0310010,
CA0310014
Central Amador
Water Project
(CAWP)
2,398 587
CA0300002 Lake Camanche
Village 730 152
CA0310019 La Mel Heights 57 12
TOTAL 6,933 3,736
*All values are in Acre-Feet (AF)
NOTES: CAWP and AWS are conglomerations of several Public Water Systems. Water Supplied
is reported as treated and raw water deliveries for each system.
2.2 Regional Planning Amador Water Agency recognizes that water is a regional resource as well as a local one, and therefore, regional partnerships play a large role in maximizing resources along with agency-only projects and measures. The Agency has partnered with numerous regional entities to develop the MAC IRWMP for the Mokelumne River watershed in and around Amador County. The State promotes IRWMPs as a method for improving water management and its nexus to land use by promoting coordination between agencies and stakeholders within regions. In 2006, the Agency participated in completing the first IRWMP for the Mokelumne Watershed, in which the MAC IRWMP established itself as one of the first regional plans in the state. The IRWMP was updated in 2013 to comply with DWR’s 2012 IRWMP Guidelines. This updated IRWMP included a reconstituted stakeholder advisory committee, a new governance structure, a reorganized plan, and technical work related to climate change. The MAC IRWMP is under the governance of the Upper Mokelumne River Watershed Authority (UMRWA) and was successful in the State’s Regional Acceptance Program as a state-recognized IRWMP geographic area. The MAC IRWM Region has been
Amador Water Agency 2015 Urban Water Management Plan Plan Preparation
June 2016 2-2
successful in securing grant funding from DWR, allowing the Agency to implement important water resources-related projects, including a leak detection and repair project, lining the Amador Canal, and the Ione Backwash Water Reuse Project. Also with IRWM grant funding, UMRWA led development of the Mokelumne Watershed Inter-Regional Sustainability Evaluation, which was the first inter-regional integrated regional water management planning effort funded by DWR. The MokeWISE Program involved completing a holistic assessment of water management options and identifying 18 broadly supported projects for implementation. With a diverse set of stakeholders, the MokeWISE Program took a watershed-wide approach to evaluating water sources and developing projects and programs that could be implemented to balance water supplies and demands while minimizing environmental impacts. The evaluation included a water availability analysis, which evaluated potentially available water from a number of sources, including stormwater, recycled water, agricultural drainage, conservation, groundwater, desalination, Mokelumne River water, and other surface water.
The Agency predicts that, by working with their numerous partners and implementing the programs described throughout this UWMP, MokeWISE, and the MAC IRWMP, they will be able to continue managing and efficiently using their existing water supply sources through at least the year 2035.
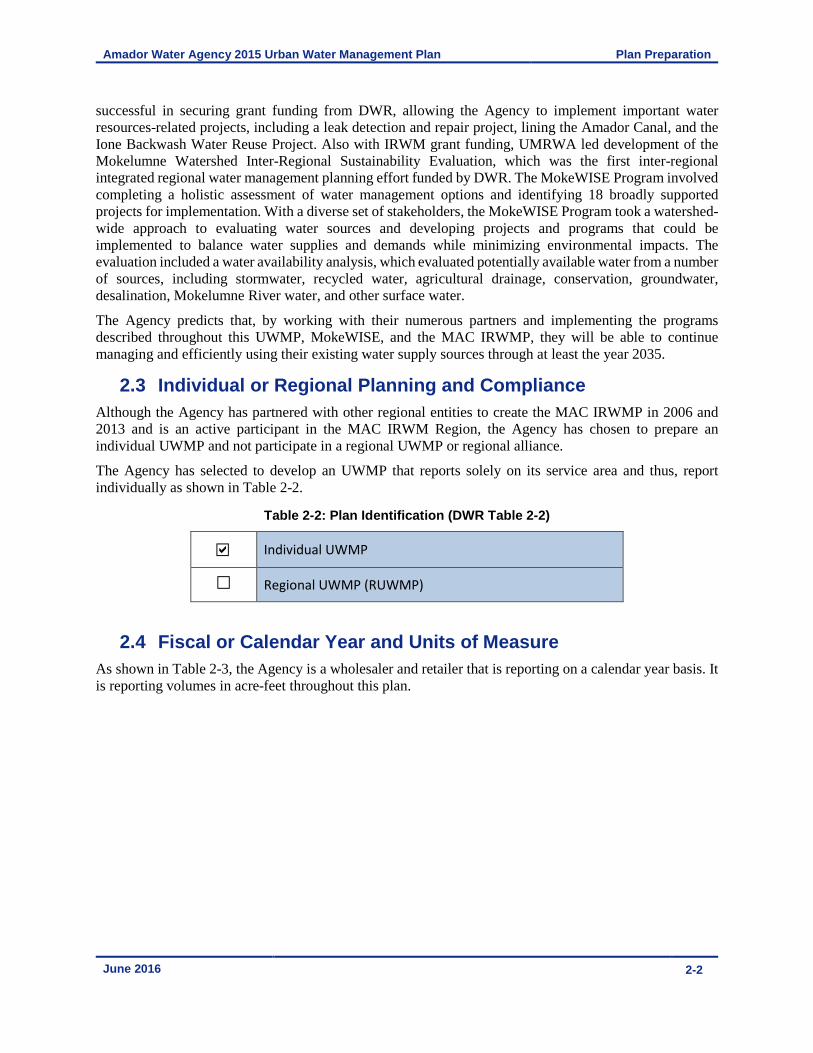
2.3 Individual or Regional Planning and Compliance Although the Agency has partnered with other regional entities to create the MAC IRWMP in 2006 and 2013 and is an active participant in the MAC IRWM Region, the Agency has chosen to prepare an individual UWMP and not participate in a regional UWMP or regional alliance.
The Agency has selected to develop an UWMP that reports solely on its service area and thus, report individually as shown in Table 2-2.
Table 2-2: Plan Identification (DWR Table 2-2)
Individual UWMP
Regional UWMP (RUWMP)
2.4 Fiscal or Calendar Year and Units of Measure As shown in Table 2-3, the Agency is a wholesaler and retailer that is reporting on a calendar year basis. It is reporting volumes in acre-feet throughout this plan.

Amador Water Agency 2015 Urban Water Management Plan Plan Preparation
June 2016 2-3
Table 2-3: Agency Identification (DWR Table 2-3)
Type of Agency
Agency is a wholesaler
Agency is a retailer
Fiscal or Calendar Year
UWMP Tables Are in Calendar Years
UWMP Tables Are in Fiscal Years
Units of Measure Used in UWMP
Unit AF
NOTES: The Agency does wholesale water, but this volume of
water is less than 3,000 AFY, so it does not meet the definition
of an urban wholesale water supplier according to CWC
10608.12. Thus, wholesale tables have not been completed for
this UWMP except where appropriate.
2.5 Coordination and Outreach
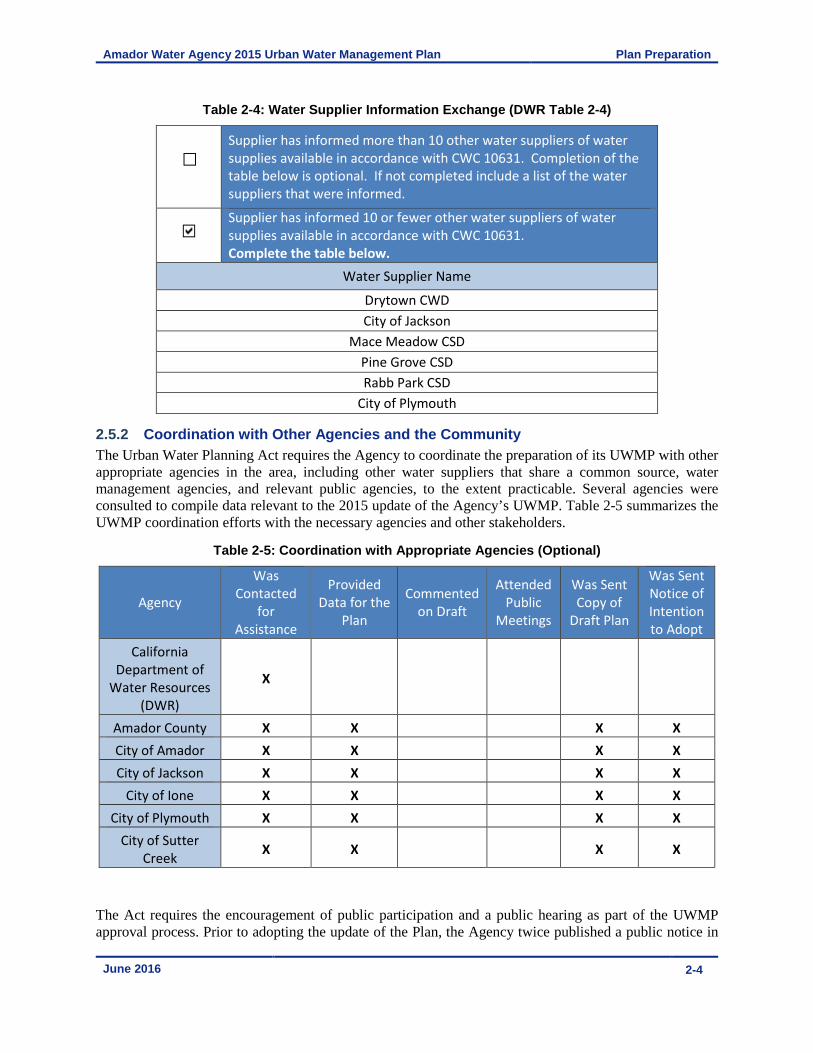
2.5.1 Wholesale and Retail Coordination The Agency sells water wholesale to several community service districts (CSD), one county water district (CWD), and two cities within Amador County, listed in Table 2-4. These wholesale customers have been informed of the Agency’s water supply projections and will be provided a copy of this UWMP. The Agency does not purchase water from any other wholesaler.
Amador Water Agency 2015 Urban Water Management Plan Plan Preparation
June 2016 2-4
Table 2-4: Water Supplier Information Exchange (DWR Table 2-4)
Supplier has informed more than 10 other water suppliers of water
supplies available in accordance with CWC 10631. Completion of the
table below is optional. If not completed include a list of the water
suppliers that were informed.
Supplier has informed 10 or fewer other water suppliers of water
supplies available in accordance with CWC 10631.
Complete the table below.
Water Supplier Name
Drytown CWD
City of Jackson
Mace Meadow CSD
Pine Grove CSD
Rabb Park CSD
City of Plymouth
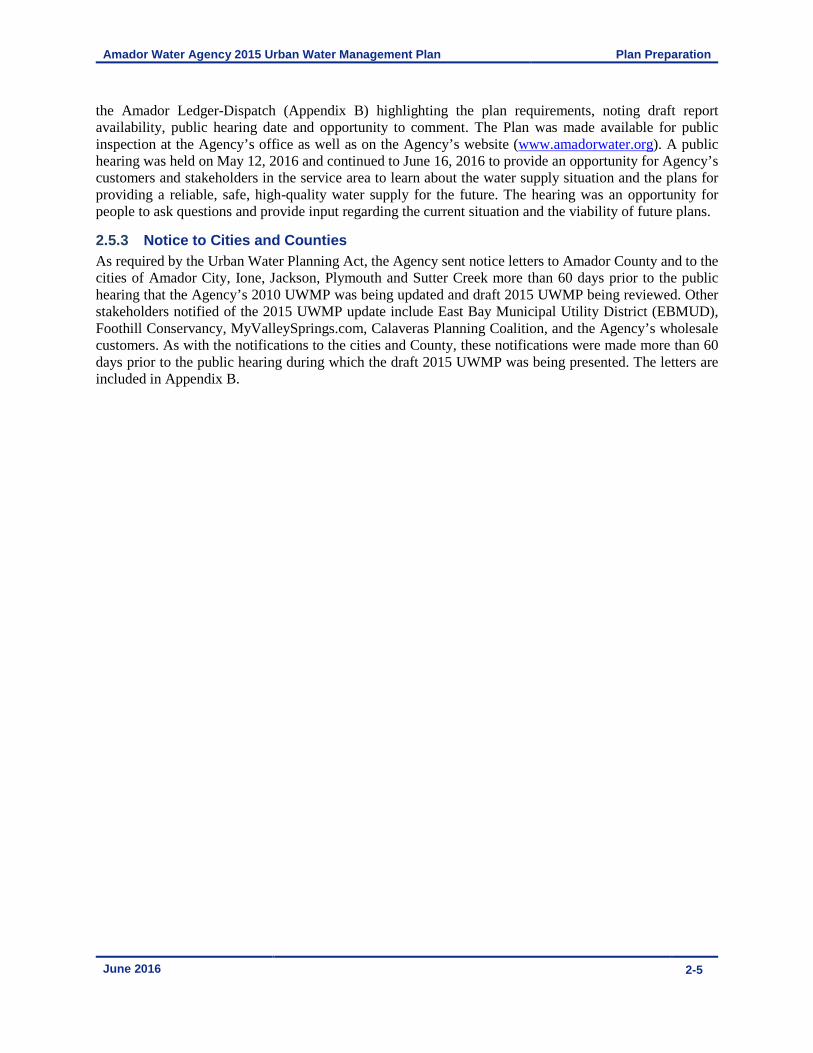
2.5.2 Coordination with Other Agencies and the Community The Urban Water Planning Act requires the Agency to coordinate the preparation of its UWMP with other appropriate agencies in the area, including other water suppliers that share a common source, water management agencies, and relevant public agencies, to the extent practicable. Several agencies were consulted to compile data relevant to the 2015 update of the Agency’s UWMP. Table 2-5 summarizes the UWMP coordination efforts with the necessary agencies and other stakeholders.
Table 2-5: Coordination with Appropriate Agencies (Optional)
Agency
Was
Contacted
for
Assistance
Provided
Data for the
Plan
Commented
on Draft
Attended
Public
Meetings
Was Sent
Copy of
Draft Plan
Was Sent
Notice of
Intention
to Adopt
California
Department of
Water Resources
(DWR)
X
Amador County X X X X
City of Amador X X X X
City of Jackson X X X X
City of Ione X X X X
City of Plymouth X X X X
City of Sutter
Creek X X X X
The Act requires the encouragement of public participation and a public hearing as part of the UWMP approval process. Prior to adopting the update of the Plan, the Agency twice published a public notice in
Amador Water Agency 2015 Urban Water Management Plan Plan Preparation
June 2016 2-5
the Amador Ledger-Dispatch (Appendix B) highlighting the plan requirements, noting draft report availability, public hearing date and opportunity to comment. The Plan was made available for public inspection at the Agency’s office as well as on the Agency’s website (www.amadorwater.org). A public hearing was held on May 12, 2016 and continued to June 16, 2016 to provide an opportunity for Agency’s customers and stakeholders in the service area to learn about the water supply situation and the plans for providing a reliable, safe, high-quality water supply for the future. The hearing was an opportunity for people to ask questions and provide input regarding the current situation and the viability of future plans.
2.5.3 Notice to Cities and Counties As required by the Urban Water Planning Act, the Agency sent notice letters to Amador County and to the cities of Amador City, Ione, Jackson, Plymouth and Sutter Creek more than 60 days prior to the public hearing that the Agency’s 2010 UWMP was being updated and draft 2015 UWMP being reviewed. Other stakeholders notified of the 2015 UWMP update include East Bay Municipal Utility District (EBMUD), Foothill Conservancy, MyValleySprings.com, Calaveras Planning Coalition, and the Agency’s wholesale customers. As with the notifications to the cities and County, these notifications were made more than 60 days prior to the public hearing during which the draft 2015 UWMP was being presented. The letters are included in Appendix B.

Amador Water Agency 2015 Urban Water Management Plan System Description
June 2016 3-1
Chapter 3 System Description
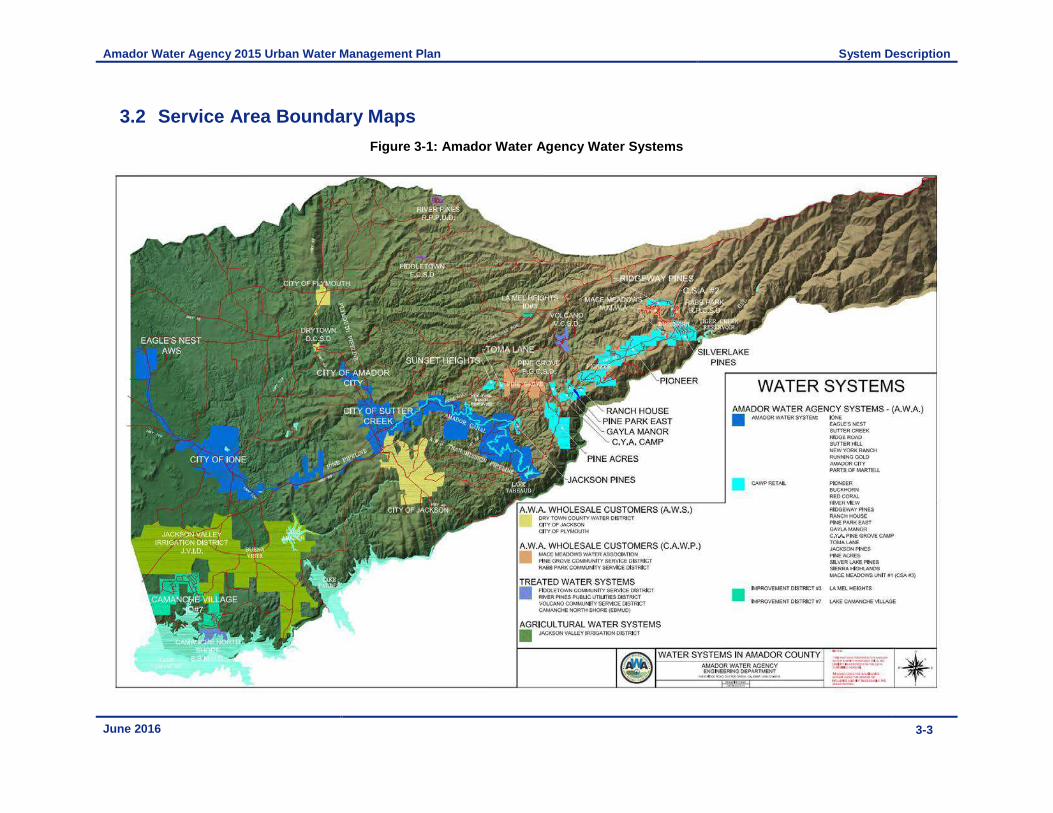
3.1 General Description Amador Water Agency was formed in 1959 for the purpose of providing water and wastewater services to the residents of Amador County. The Agency has four general service areas: the AWS, the CAWP System, La Mel Heights, and Lake Camanche Village. These service areas are shown in Figure 3-1.
The AWS was formerly owned and operated by Pacific Gas and Electric Company (PG&E) and currently serves all five cities in Amador County, including the areas of Jackson, Martell, Sutter Creek, Sutter Hill, Ione, Amador City, Plymouth and Drytown. The Agency has two water treatment plants at Sutter Hill and Ione, but also serves raw (untreated) water from the Amador Canal to customers between Lake Tabeaud and Sutter Hill, and Sutter Hill and Ione.
The CAWP System provides wholesale water to the communities of First Mace Meadow Water Association, Pine Grove CSD, and Rabb Park CSD. The CAWP System also provides retail water to Mace Meadow Unit #1 (CSA #2), Sunset Heights, Jackson Pines, C.Y.A. Pine Grove Camp, Pine Acres, Ranch House, Pioneer, Ridgeway Pines, Silver Lake Pines, Sierra Highlands, Buckhorn, Red Coral, River View, Pine Park East, Gayla Manor, and Toma Lane.
Lake Camanche Village is a major subdivision consisting of several units (subdivisions) in western Amador County. The Agency supplies both water and wastewater services to this area, with water supplies coming from groundwater rather than the Mokelumne River (as with the other two service areas). La Mel Heights is a small development in the northern part of the county, and is served by the Agency from one community well.
Amador County is expected to have a 2040 population of approximately 44,200 people, an increase of 20% from its 2015 population of 37,000 (PMC, 2015 and United States Census Bureau, 2016). The Agency currently provides retail service to a population of approximately 13,868 people through 6,511 retail residential water service connections. The Board of Directors is comprised of five members elected by the citizens within districts that mirror the Amador County Board of Supervisor districts.
The Agency is the main water purveyor for residential and commercial use in Amador County and has the legal jurisdiction to serve water throughout Amador County (see Figure 3-2). The Agency’s primary source of water is the Mokelumne River watershed which supplies the primary water systems of the AWS and the CAWP. Lake Camanche Village and La Mel Heights are served through groundwater. There are a total of 6,933 water service connections in the Agency’s service area, not including wholesale entity customers and their customer connections.
3.1.1 Amador Water System The Amador Water System receives water from the Mokelumne River via Lake Tabeaud. The AWS delivery system consists of approximately 120 miles of water main piping for potable water customers and 24 miles of conveyance canals for untreated water customers. The Agency supplies both raw and treated water to customers in the AWS. Treated water supplied to AWS customers comes from the Ione Water Treatment Plant located in Ione or the Tanner Water Treatment Plant located in Sutter Creek. The service area covers over 450 square miles and serves the communities of Amador City, Ione, Sutter Creek, Sutter Hill , Martell, and their vicinities, and portions of Ridge Road and New York Ranch Road on a retail basis. The Agency also provides wholesale water through the AWS to the communities of Jackson, Plymouth and Drytown. In addition, the system also supplies raw water for agricultural, industrial, commercial and domestic irrigation needs to both public facilities and individual raw water customers. In 2007, the Agency began operating the Amador Transmission Waterline, a gravity pipeline which transports raw water from Lake Tabeaud to the Tanner Water Treatment Plant located in Sutter Hill. Compared to the primarily earthen Amador Canal, this pipeline conserves approximately 25% of water diverted from Lake Tabeaud

Amador Water Agency 2015 Urban Water Management Plan System Description
June 2016 3-2
and prevents degradation of the quality of this water. There are 3,748 service connections in the AWS. Figure 3-1 shows the AWS service area.
3.1.2 Central Amador Water Project System The Central Amador Water Project System receives water from the Mokelumne River via PG&E’s Tiger Creek Afterbay and, as of 2015, via the Tiger Creek Regulating Reservoir. Water supplied to CAWP customers is treated at the Buckhorn Water Treatment Plant located in Pioneer. The CAWP delivery system consists of approximately 90 miles of water main piping for potable water customers. The CAWP provides wholesale treated water to the upcountry communities of First Mace Meadow Water Association, Pine Grove CSD, and Rabb Park CSD. In addition to delivering wholesale water, the Agency also retails potable water to 2,398 service connections in the communities of Jackson Pines, Pine Acres, Pioneer, Ridgeway Pines, Ranch House, Silver Lake Pines, the Sunset Heights area, Buckhorn, Red Coral, River View, Pine Park east, Gayla Manor, Toma Lane, and Sierra Highlands. In December 2015, the Agency placed the CAWP Gravity Supply Line into operation which eliminated electrical energy use by 1.8 million kilowatt-hours (kWh) annually in addition to improving water quality. Figure 3-1 shows the CAWP service area.
3.1.3 Lake Camanche Village Area The Agency provides water service to 730 residences and small commercial businesses in the Lake Camanche Village area. The domestic water supply for Lake Camanche Village is currently based on groundwater which is treated by chlorine addition at each well head located throughout the Improvement District 7 (ID #7). As detailed in Chapter 6 of this UWMP, the Camanche Area Regional Water Supply Project will replace 1,200 AFY of Lake Camanche Village’s groundwater supply with surface water supply over the next five years to increase water reliability and quality. Figure 3-1 shows the Lake Camanche Village service area.
3.1.4 La Mel Heights The Agency provides water service to La Mel Heights, a 57 unit subdivision. The only water supply is groundwater which is treated at the Improvement District 3 (ID #3) Water Treatment Plant. Figure 3-1 shows the La Mel Heights service area.
3.1.5 System Energy Intensity An urban water supplier’s energy intensity (EI) of water is the amount of energy (kWh) required for the process of supplying water from the point that it enters a system to the point at which it exits the system per unit volume of water (AF). The amount of energy used for extraction and diversion, conveyance, treatment, and distribution per AF of water was analyzed, and they system’s total energy intently is 791 kWh/AF. This EI is expected to decrease in the future due to improvements in efficiency and the addition of a hydropower unit at one of the Agency’s water treatment plants. The amount of energy used for collection, treatment, and discharge per AF of wastewater was also estimated. The Agency’s wastewater systems have an overall EI of 1,521 kWh/AF. The Agency’s water and wastewater EIs and calculations are detailed in Appendix P.
Amador Water Agency 2015 Urban Water Management Plan System Description
June 2016 3-3
3.2 Service Area Boundary M aps
Figure 3-1: Amador Water Agency Water Systems

Amador Water Agency 2015 Urban Water Management Plan System Description
June 2016 3-4
Figure 3-2: Map of Amador County
3.3 Service Area Climate The Agency’s main water supply is the Mokelumne River, a snow- and rain-fed river originating in the Sierra Nevada. The Mokelumne River watershed is a relatively narrow and steep watershed located northeast of the Sacramento-San Joaquin Delta on the western slope of the Sierra Nevada. The watershed, upstream of Camanche Dam, covers an area of 627 square miles and extends from Highland Peak (elevation 10,934 feet above sea level) near the crest of the Sierra Mountains to Camanche Reservoir (elevation 235 feet above sea level) located in the lower western foothills near Clements.
Annual precipitation (rainfall and snowfall) in the Mokelumne River Watershed, and thus river runoff, is extremely variable in Northern California. Within a year, precipitation is highly seasonal with most precipitation normally occurring between November and May and very little occurring between late spring and fall. Peak flows in the Mokelumne River normally occur during winter storms or during the spring snow-melt season from March through June. River flows decrease to a minimum in late summer or fall.
Amador County has a varying range of temperature and precipitation. The Sierra Nevada foothill areas experience hot, dry summers and mild winters. The higher elevations, about 5,000 feet, experience long and severe winters accompanied by heavy snowfall. Table 3-1 shows typical reference evapotranspiration (ETo), precipitation and temperature values.

Amador Water Agency 2015 Urban Water Management Plan System Description
June 2016 3-5
Table 3-1: Climate (Optional)
Month Jan Feb Mar Apr May Jun Jul Aug Sep Oct Nov Dec Annual
Standard Average
EToa (in.) 1.40 2.10 3.41 4.95 6.67 7.80 8.84 7.75 5.70 3.88 1.95 1.24 55.65
Average Rainfallb
(in.) 6.06 5.57 5.12 2.54 1.25 0.37 0.01 0.04 0.47 1.73 3.75 4.51 32.32
Average
Temperature b (°F) 45.7 48.9 52.7 56.6 63.8 69.8 76.3 74.9 70.2 62.0 52.1 45.4 59.9
a. Source: CIMIS ETo Map using an average of Zones 13 and 14 b. Source: Western Regional Climate Center #042728, Electra Power House
3.3.1 Climate Change The following sections summarize the vulnerabilities of Amador Water Agency’s water supply system to climate change as identified through completion of the Climate Change Vulnerability Assessment and based on the climate change analysis completed for the 2013 MAC IRWM Plan Update. Other climate change sections are included in Chapter 4 and Chapter 6 of this UWMP that describe climate change impacts on the Agency’s demands and supplies. See Appendix Q for the complete Climate Change Vulnerability Assessment.
Sea Level Rise
Since the Agency’s service area is not located in a coastal region, it is not vulnerable to sea level rise issues such as flooding, impacts to structures, or impacts to habitat. There is the potential for the Agency’s service area to be affected by sea level rise indirectly if required stream releases from the Mokelumne River increase in the future to maintain salinity fronts in the Sacramento-San Joaquin Delta. This would decrease the amount of water from the Mokelumne River available for supply to the Agency.
Flooding
Since climate change is likely to increase the intensity of precipitation events, floods may become more common. Storm-related runoff may also increase due to rising snowlines that increase the surface area in watersheds that receive precipitation as rain instead of snow (RMC, 2013). Additionally, the increase in the risk of wildfires also increases the risk of floods, as burned areas increase the level of runoff after a storm event. Operations of reservoirs in Amador County may require modifications in response to flood events and earlier springtime runoff. These dams are aging, but there are no immediate concerns about their ability to provide flood protection. Flooding in Amador County occurs more frequently in undammed creeks, rather than major rivers. Although the overall risk of flooding due to climate change will increase, it is unlikely that it will heavily affect the Agency’s service area since none of the county is in the 200-year flood plain.
Ecosystem and Habitat Vu lnerability
Amador County is primarily a natural area, including a section of Eldorado National Forest and large areas of designated rural or open space. There are riparian, wetland, forest, and alpine habitats in this region that support a broad variety of plant and animal life. Increasing temperatures due to climate change will lead to declines in alpine and subalpine forest as well as a shift from evergreen conifer forest to mixed evergreen conifer forests and grasslands (RMC, 2013). The increase in wildfire risk due to hotter and drier conditions will augment the conversion of woodlands to grassland as grasses are more drought tolerant and re-establish more rapidly than forest after burning (RMC, 2013). Most recently, the Butte Fire in 2015 in the Mokelumne River Watershed is expected to augment the conversion of woodland to grasslands. Additionally, trees are threatened by higher temperatures that will reduce trees’ capacity to resist pest attacks while also increasing

Amador Water Agency 2015 Urban Water Management Plan System Description
June 2016 3-6
pest survival rates. Endangered or threatened plant species may have a lower capacity to adapt to climate change. In Amador County, these species include Ione manzanita, Ione buckwheat, Irish hill buckwheat and Sacramento orcutt grass (AECOM, 2014).
Other species in Amador County that may have difficulty adapting to climate change due to their threatened or endangered status are vernal pool fairy shrimp, valley elderberry longhorn beetles, vernal pool tadpole shrimp, Central Valley steelhead, Chinook salmon, California tiger salamanders, California red-legged frogs, Swainson’s hawks, Bald eagles, Bank swallows, and wolverines (AECOM, 2014).
Increasing temperatures will increase freshwater temperatures which may reduce local salmon and steelhead trout populations and increase the risk of their extinction (RMC, 2013). Salmon and other anadromous fish are also threatened by increased silt levels in water due to the increased likelihood of erosion and sedimentation due to climate change. Additionally, the migration patterns of these fish are impeded by dams, so increasing storage may negatively affect anadromous fish populations. Other aquatic life and riparian habitats will be affected by the changes in chemical composition of surface water due to warmer temperatures. Lower summertime flows caused by climate change may exacerbate intermittent flow of smaller streams, so fish may be confined in warm, stagnant pools during portions of the summer (AECOM, 2014).
Decreased flows in the Mokelumne River may have negative impacts on both ecosystem and recreational activities. Through the Federal Energy Regulatory Commission (FERC) License Project No. 137 and a related, legally binding settlement agreement between FERC, PG&E, U.S. Department of Agriculture and Forest Service, U.S. Fish and Wildlife Service, U.S. Bureau of Land Management, CA Department of Fish and Game, CA Department of Boating and Waterways, American Whitewater, Friends of the River, Foothill Conservancy, and Natural Heritage Institute, PG&E must manage flow releases on the Mokelumne River in the Amador County for fish, wildlife, other aquatic biota, riparian habitat, and recreation (FERC, 2000). The Agency must work with these agencies to balance these flow requirements with municipal and recreational needs (including kayaking and river rafting) if there is a decrease in summertime flows on the Mokelumne River due to climate change.
Hydropower
Both PG&E and EBMUD own and operate hydroelectric facilities on the Mokelumne River. PG&E’s Mokelumne River Hydroelectric Project consists of four hydropower generating units that have a total capacity of 206 megawatts. EBMUD generates an average of 185 million kWh annually at dams at the Pardee and Camanche reservoirs. Both of these hydropower generation systems are reliant on snowmelt from the Sierra Nevada. Changes to the volume of snowfall and timing of melting as a result of climate change may require modifications to reservoir operations for the purposes of flood control. Changing operations within the hydropower systems may affect electrical general capabilities in addition to downstream water releases.
3.4 Service Area Population and Demographics The AWS was owned by PG&E until 1985. The Amador Canal dates back to 1855 and was primarily used for gold mine operations and transporting lumber used in the mines. The canal system was extended for domestic services to communities and farming. When the Agency acquired the AWS from PG&E in 1985, the system primarily served municipal and industrial customers with incidental agricultural services. Today, the Agency continues to primarily serve municipal and industrial customers with some agricultural services. Jackson Valley Irrigation District (JVID), located south of the City of Ione, primarily provides agricultural water. The CAWP System, completed around 1979, only serves municipal and industrial customers with some minor exceptions. From 1990 to 2010, the Agency’s residential retail population grew by over 40%.
Population growth projections utilized in this UWMP were obtained from the adopted Housing Element Update from the General Plan for Amador County, which is based on historical patterns, market research,
Amador Water Agency 2015 Urban Water Management Plan System Description
June 2016 3-7
and new housing unit commitments (e.g., issued permits or approved subdivisions) for the near future (Appendix C). Analysis of services other than water, wastewater or reclaimed water are outside of the purview of this UWMP and were therefore not considered by the Agency. For the population projections contained herein, the Agency relied on local land use agencies’ expertise.
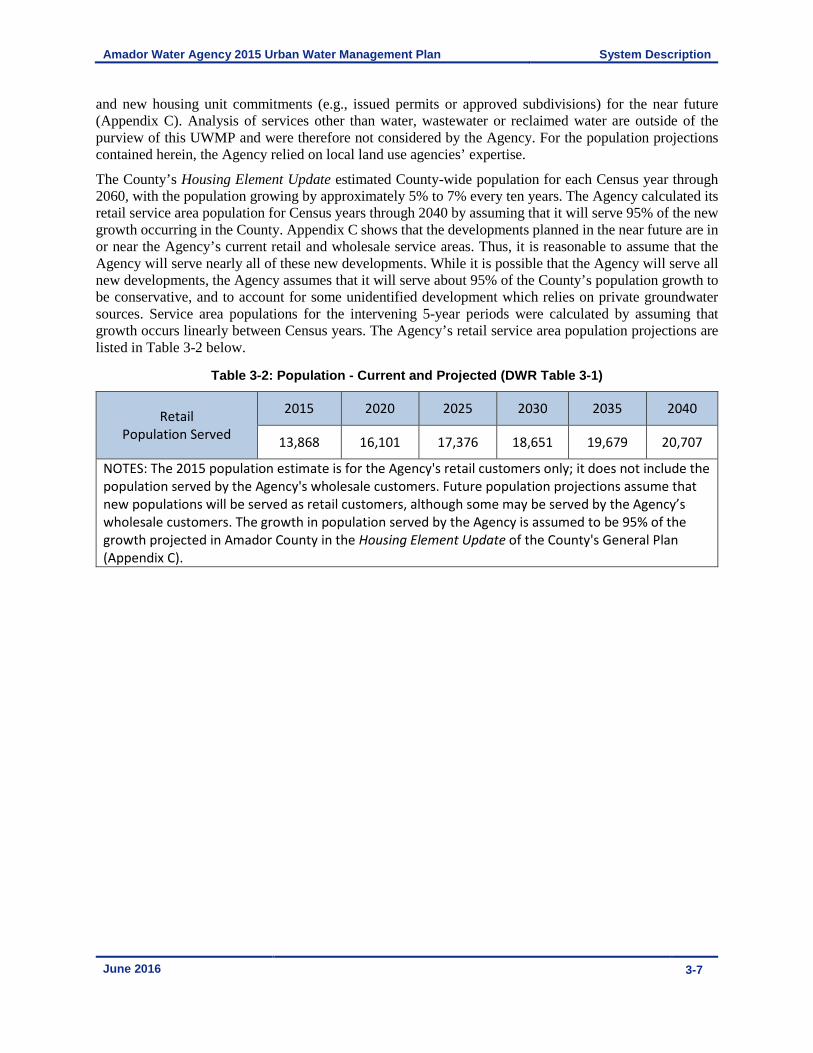
The County’s Housing Element Update estimated County-wide population for each Census year through 2060, with the population growing by approximately 5% to 7% every ten years. The Agency calculated its retail service area population for Census years through 2040 by assuming that it will serve 95% of the new growth occurring in the County. Appendix C shows that the developments planned in the near future are in or near the Agency’s current retail and wholesale service areas. Thus, it is reasonable to assume that the Agency will serve nearly all of these new developments. While it is possible that the Agency will serve all new developments, the Agency assumes that it will serve about 95% of the County’s population growth to be conservative, and to account for some unidentified development which relies on private groundwater sources. Service area populations for the intervening 5-year periods were calculated by assuming that growth occurs linearly between Census years. The Agency’s retail service area population projections are listed in Table 3-2 below.
Table 3-2: Population - Current and Projected (DWR Table 3-1)
Retail
Population Served
2015 2020 2025 2030 2035 2040
13,868 16,101 17,376 18,651 19,679 20,707
NOTES: The 2015 population estimate is for the Agency's retail customers only; it does not include the
population served by the Agency's wholesale customers. Future population projections assume that
new populations will be served as retail customers, although some may be served by the Agency’s
wholesale customers. The growth in population served by the Agency is assumed to be 95% of the
growth projected in Amador County in the Housing Element Update of the County's General Plan
(Appendix C).

Amador Water Agency 2015 Urban Water Management Plan System Water Use
June 2016 4-1
Chapter 4 System Water Use
This section describes the Agency’s system demands, including its retail customers in the AWS, the CAWP, La Mel Heights and Lake Camanche Village, as well as the Agency’s wholesale customers. While the Agency supplies water to wholesale customers, the wholesale demands do not exceed 3,000 AFY and therefore, the Agency has not presented water use separately for wholesale customers. The small volume of wholesale demands is reported in the Agency’s retail tables throughout this chapter. The current water system demand and projections by category are quantified over the planning horizon of the UWMP. These demands and projections include treated and raw water sales, water sales to other agencies, and system water losses.
Water demand projections provide the basis for sizing and staging future water supply facilities. Water use and production records, combined with future population projections, provide the basis for estimating future water requirements to serve the Agency’s customers. The Agency will serve most of the new projected growth and water demands within Amador County. This chapter summarizes past water use and future water demand projections through 2040.
4.1 Water Uses by Sector
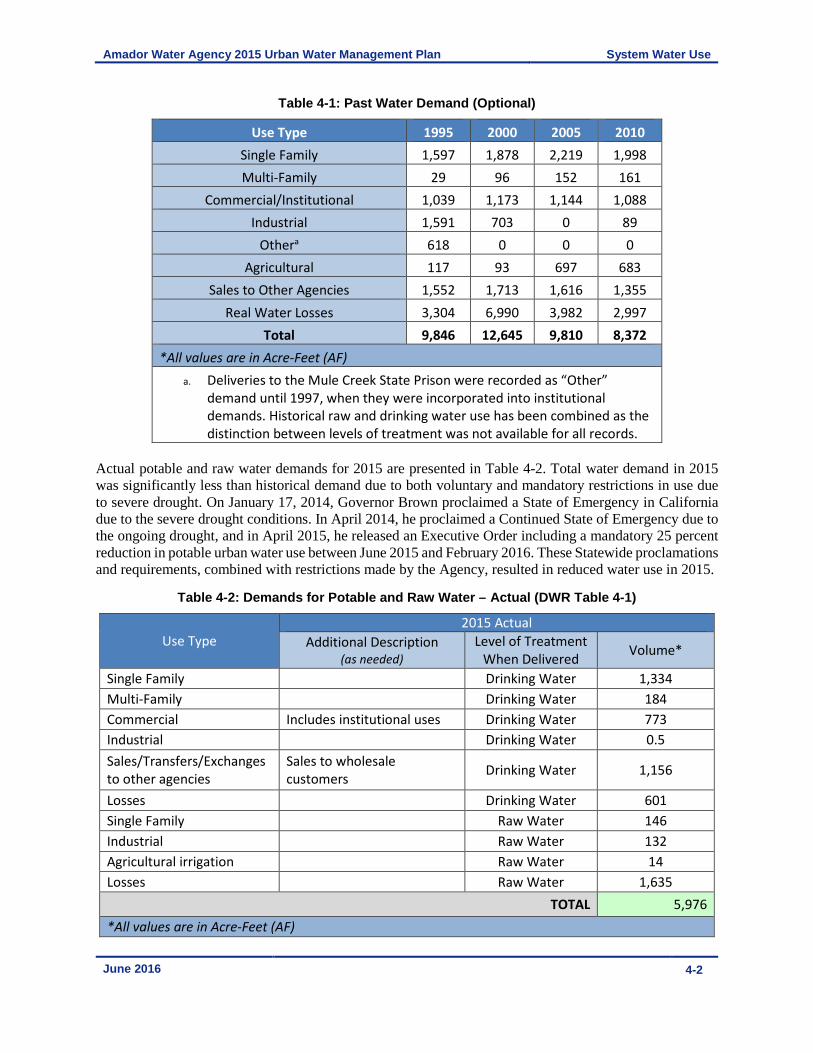
4.1.1 Past and Current Water Demands Water use is presented in the following user categories: single family residential, multi-family residential, commercial/institutional, industrial, agricultural irrigation, sales to other agencies, and water losses. Drinking and raw demands, reported separately for 2015 water use in Table 4-2, have been combined for historical (Table 4-1) and projected demands (Table 4-5) as the distinctions in level of treatment were not always made in the past and level of treatment may change in the future for some raw water customers. Recycled water demands are detailed in Chapter 6 and summarized here in Table 4-6.
Historical water demands from 1995 through 2010 are presented in Table 4-1. An increase in demand between 1995 and 2000 was primarily caused by population growth in the Agency’s service area. Decreases in overall demand in the 2000s is largely due to significant reductions in water loss resulting from raw water canal improvements in 2002 and 2007.
Amador Water Agency 2015 Urban Water Management Plan System Water Use
June 2016 4-2
Table 4-1: Past Water Demand (Optional)
Use Type 1995 2000 2005 2010
Single Family 1,597 1,878 2,219 1,998
Multi-Family 29 96 152 161
Commercial/Institutional 1,039 1,173 1,144 1,088
Industrial 1,591 703 0 89
Othera 618 0 0 0
Agricultural 117 93 697 683
Sales to Other Agencies 1,552 1,713 1,616 1,355
Real Water Losses 3,304 6,990 3,982 2,997
Total 9,846 12,645 9,810 8,372
*All values are in Acre-Feet (AF)
a. Deliveries to the Mule Creek State Prison were recorded as “Other”
demand until 1997, when they were incorporated into institutional
demands. Historical raw and drinking water use has been combined as the
distinction between levels of treatment was not available for all records.
Actual potable and raw water demands for 2015 are presented in Table 4-2. Total water demand in 2015 was significantly less than historical demand due to both voluntary and mandatory restrictions in use due to severe drought. On January 17, 2014, Governor Brown proclaimed a State of Emergency in California due to the severe drought conditions. In April 2014, he proclaimed a Continued State of Emergency due to the ongoing drought, and in April 2015, he released an Executive Order including a mandatory 25 percent reduction in potable urban water use between June 2015 and February 2016. These Statewide proclamations and requirements, combined with restrictions made by the Agency, resulted in reduced water use in 2015.
Table 4-2: Demands for Potable and Raw Water – Actual (DWR Table 4-1)
Use Type
2015 Actual
Additional Description (as needed)
Level of Treatment
When Delivered Volume*
Single Family Drinking Water 1,334
Multi-Family Drinking Water 184
Commercial Includes institutional uses Drinking Water 773
Industrial Drinking Water 0.5
Sales/Transfers/Exchanges
to other agencies
Sales to wholesale
customers Drinking Water 1,156
Losses Drinking Water 601
Single Family Raw Water 146
Industrial Raw Water 132
Agricultural irrigation Raw Water 14
Losses Raw Water 1,635
TOTAL 5,976
*All values are in Acre-Feet (AF)
Amador Water Agency 2015 Urban Water Management Plan System Water Use
June 2016 4-3
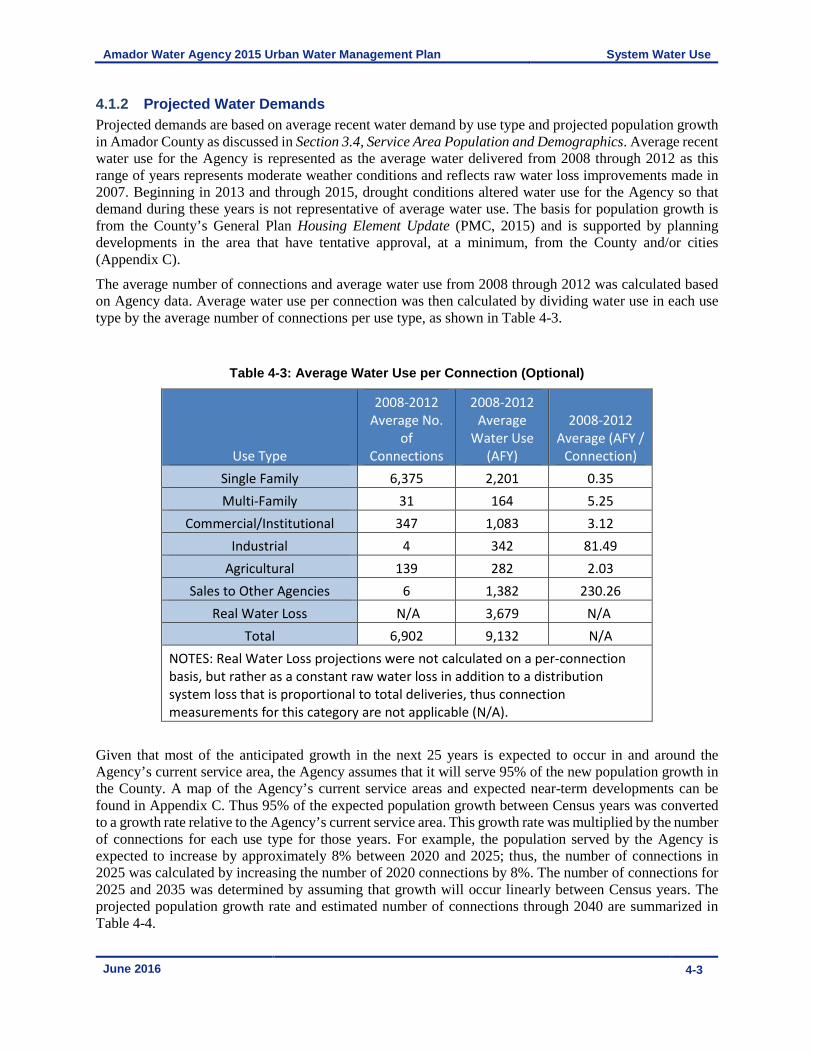
4.1.2 Projected Water Demands Projected demands are based on average recent water demand by use type and projected population growth in Amador County as discussed in Section 3.4, Service Area Population and Demographics. Average recent water use for the Agency is represented as the average water delivered from 2008 through 2012 as this range of years represents moderate weather conditions and reflects raw water loss improvements made in 2007. Beginning in 2013 and through 2015, drought conditions altered water use for the Agency so that demand during these years is not representative of average water use. The basis for population growth is from the County’s General Plan Housing Element Update (PMC, 2015) and is supported by planning developments in the area that have tentative approval, at a minimum, from the County and/or cities (Appendix C).
The average number of connections and average water use from 2008 through 2012 was calculated based on Agency data. Average water use per connection was then calculated by dividing water use in each use type by the average number of connections per use type, as shown in Table 4-3.
Table 4-3: Average Water Use per Connection (Optional)
Use Type
2008-2012
Average No.
of
Connections
2008-2012
Average
Water Use
(AFY)
2008-2012
Average (AFY /
Connection)
Single Family 6,375 2,201 0.35
Multi-Family 31 164 5.25
Commercial/Institutional 347 1,083 3.12
Industrial 4 342 81.49
Agricultural 139 282 2.03
Sales to Other Agencies 6 1,382 230.26
Real Water Loss N/A 3,679 N/A
Total 6,902 9,132 N/A
NOTES: Real Water Loss projections were not calculated on a per-connection
basis, but rather as a constant raw water loss in addition to a distribution
system loss that is proportional to total deliveries, thus connection
measurements for this category are not applicable (N/A).
Given that most of the anticipated growth in the next 25 years is expected to occur in and around the Agency’s current service area, the Agency assumes that it will serve 95% of the new population growth in the County. A map of the Agency’s current service areas and expected near-term developments can be found in Appendix C. Thus 95% of the expected population growth between Census years was converted to a growth rate relative to the Agency’s current service area. This growth rate was multiplied by the number of connections for each use type for those years. For example, the population served by the Agency is expected to increase by approximately 8% between 2020 and 2025; thus, the number of connections in 2025 was calculated by increasing the number of 2020 connections by 8%. The number of connections for 2025 and 2035 was determined by assuming that growth will occur linearly between Census years. The projected population growth rate and estimated number of connections through 2040 are summarized in Table 4-4.

Amador Water Agency 2015 Urban Water Management Plan System Water Use
June 2016 4-4
Table 4-4: Projected Number of Agency Service Connections (Optional)
Use Type
2008-2012
Average No.
of
Connections
2020 No. of
Connections
2025 No. of
Connections
2030 No. of
Connections
2035 No. of
Connections
2040 No. of
Connections
Single Family Residential 6,375 7,462 8,053 8,644 9,121 9,597
Multi-Family Residential 31 37 39 42 45 47
Commercial/Institutional 347 406 439 471 497 523
Industrial 4 5 5 6 6 6
Agricultural Irrigation
(Raw) 139 162 175 188 199 209
Sales to Other Agencies 6 7 8 8 9 9
Real Water Loss N/A N/A N/A N/A N/A N/A
Total 6,902 8,080 8,720 9,359 9,875 10,391
Amador County
Population 37,642 39,352 40,694 42,036 43,118 44,200
Retail Population Served
by the Agency 13,755 16,101 17,376 18,651 19,679 20,707
Service Area Growth
Rate 17.1% 7.9% 7.3% 5.5% 5.2%
NOTES: Real Water Loss projections were not calculated on a per-connection basis, but rather as a total demand
that grows at the same rate as population; thus, connection measurements for this category are not applicable
(N/A). The Amador County Population in 2008-2012 is reported as the average population during that period. The
Growth Rate reported in 2020 is the growth rate between the 2008-2012 average and 2020. Growth Rates
represent the percent change in projected population served by the Agency between periods (generally 5 year
increments, except for the period from 2008-2012 and 2020), which have been calculated based on the Amador
County’s General Plan Housing Element Update (Appendix C).
It is assumed that average water use per connection will remain the same over time, while population in the Agency service area will continue to grow. Thus, the 2008-2012 average demand per connection by use type was multiplied by the projected number of connections to result in a total projected demand by use type for 2020 through 2040. The resulting projected water use by type is presented in Table 4-5.
Water loss projections were not determined on a per-connection basis, but rather as a constant raw water loss in addition to a distribution system loss that is proportional to total deliveries. Average water loss from the Amador Canal was 3,116 AF from 2008-2012, with an additional distribution loss of 10.5% of the total deliveries, thus this average loss proportion has been used for projected water loss through 2040. . It is estimated that with the implementation backwash reuse projects at the Agency’s water treatment plants, potable water losses will be reduced by 292 AF. Since these projects are anticipated to be implemented before 2020, a total of 292 AF was subtracted from the 2020 water loss and future projections.
The agricultural demands reported in Table 4-5 reflect the relatively low agricultural demand that the Agency has served in the past. However, there is the potential that large agricultural users, including JVID and vineyards in the Shenandoah Valley, could become retail or wholesale customers in the future. The

Amador Water Agency 2015 Urban Water Management Plan System Water Use
June 2016 4-5
addition of these customers would dramatically increase water demand. While this increase in agricultural demand is recognized as a possibility, there is not enough information currently available to include this potential future demand in this UWMP. Projected demands, including water losses, are summarized in Table 4-5. Table 4-6 summarizes total projected water demand including recycled water, as described in Chapter 6 of this UWMP.
Table 4-5: Demands for Potable and Raw Water - Projected (DWR Table 4 -2)
Use Type Additional Description
(as needed)
Projected Water Use*
2020 2025 2030 2035 2040
Single Family Drinking and Raw
Water 2,576 2,780 2,984 3,148 3,313
Multi-Family Drinking Water 192 207 222 234 247
Commercial Drinking Water.
Includes Institutional 1,268 1,368 1,468 1,549 1,630
Sales/Transfers/Exchanges
to other agencies Drinking Water 1,617 1,745 1,873 1,977 2,080
Industrial Raw Water 401 432 464 490 515
Agricultural irrigation Raw Water 330 356 382 403 424
Losses Drinking and Raw
Water 3,494 3,547 3,600 3,643 3,686
TOTAL 9,878 10,435 10,993 11,444 11,895
*All values are in Acre-Feet (AF)
NOTES: Raw and drinking water use has been combined for projections, as some raw water customers
may be served drinking water in the future and the timing of this transition is uncertain.
Table 4-6: Total Water Demands (DWR Table 4-3)
2015 2020 2025 2030 2035 2040
Potable and Raw Water* 5,976 9,878 10,435 10,993 11,444 11,895
Recycled Water Demand* 622 723 1,264 1,264 1,264 1,264
TOTAL WATER DEMAND 6,598 10,601 11,699 12,257 12,708 13,159
*All values are in Acre-Feet (AF)
4.2 Distribution System Water Losses Distribution system water losses were calculated using the American Water Works Association (AWWA) Water Audit Method, as prescribed by the 2015 UWMP Guidebook. Losses were calculated for the calendar year of 2015 based on a water balance calculated for that year. The water balance calculation determines the amount of water lost by subtracting the authorized consumption of water from the total amount of water supplied. An AWWA Water Loss Audit was completed for each of the areas served by the Agency’s drinking and raw water systems (Amador Canal, Buckhorn, Ione, Tanner, Lake Camanche Village, and La Mel Heights) and then combined into one total Water Loss Audit, the results of which are summarized in Table 4-7. The AWWA Water Loss Audit spreadsheet for each system is included in Appendix D.
Overall, 2,236 AF of water was lost from the Agency’s system in 2015. Nearly 80% of this loss occurred in the Agency’s raw water system which consists of the Amador Canal, a primarily earthen ditch used to
Amador Water Agency 2015 Urban Water Management Plan System Water Use
June 2016 4-6
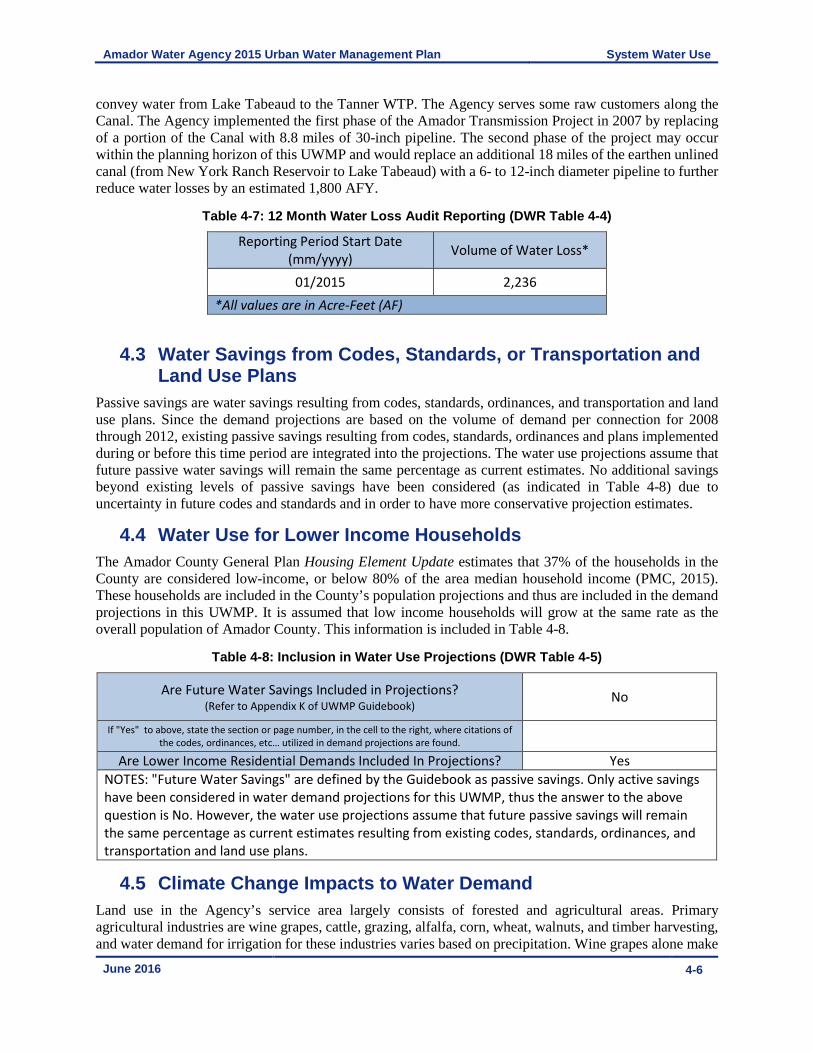
convey water from Lake Tabeaud to the Tanner WTP. The Agency serves some raw customers along the Canal. The Agency implemented the first phase of the Amador Transmission Project in 2007 by replacing of a portion of the Canal with 8.8 miles of 30-inch pipeline. The second phase of the project may occur within the planning horizon of this UWMP and would replace an additional 18 miles of the earthen unlined canal (from New York Ranch Reservoir to Lake Tabeaud) with a 6- to 12-inch diameter pipeline to further reduce water losses by an estimated 1,800 AFY.
Table 4-7: 12 Month Water Loss Audit Reporting (DWR Table 4-4)
Reporting Period Start Date
(mm/yyyy) Volume of Water Loss*
01/2015 2,236
*All values are in Acre-Feet (AF)
4.3 Water Savings from Codes, Standards, or Transportation and Land Use Plans
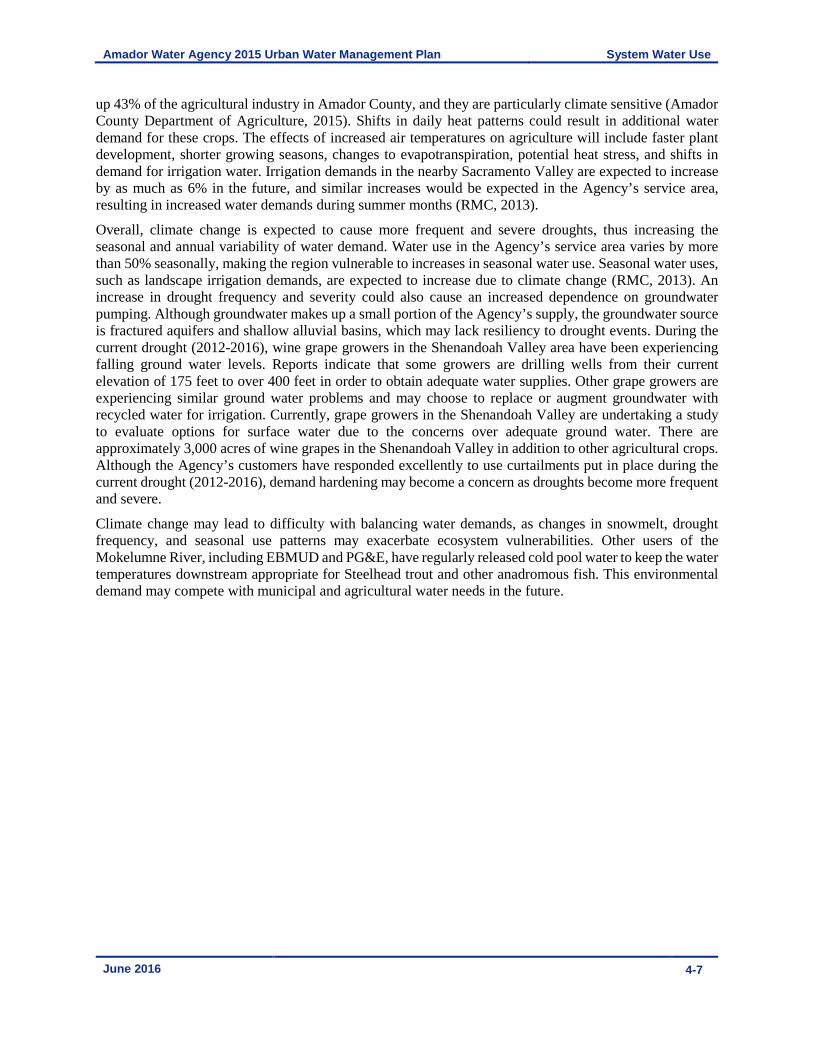
Passive savings are water savings resulting from codes, standards, ordinances, and transportation and land use plans. Since the demand projections are based on the volume of demand per connection for 2008 through 2012, existing passive savings resulting from codes, standards, ordinances and plans implemented during or before this time period are integrated into the projections. The water use projections assume that future passive water savings will remain the same percentage as current estimates. No additional savings beyond existing levels of passive savings have been considered (as indicated in Table 4-8) due to uncertainty in future codes and standards and in order to have more conservative projection estimates.
4.4 Water Use for Lower Income Households The Amador County General Plan Housing Element Update estimates that 37% of the households in the County are considered low-income, or below 80% of the area median household income (PMC, 2015). These households are included in the County’s population projections and thus are included in the demand projections in this UWMP. It is assumed that low income households will grow at the same rate as the overall population of Amador County. This information is included in Table 4-8.
Table 4-8: Inclusion in Water Use Projections (DWR Table 4-5)
Are Future Water Savings Included in Projections? (Refer to Appendix K of UWMP Guidebook)
No
If "Yes" to above, state the section or page number, in the cell to the right, where citations of
the codes, ordinances, etc… utilized in demand projections are found.
Are Lower Income Residential Demands Included In Projections? Yes
NOTES: "Future Water Savings" are defined by the Guidebook as passive savings. Only active savings
have been considered in water demand projections for this UWMP, thus the answer to the above
question is No. However, the water use projections assume that future passive savings will remain
the same percentage as current estimates resulting from existing codes, standards, ordinances, and
transportation and land use plans.
4.5 Climate Change Impacts to Water Demand Land use in the Agency’s service area largely consists of forested and agricultural areas. Primary agricultural industries are wine grapes, cattle, grazing, alfalfa, corn, wheat, walnuts, and timber harvesting, and water demand for irrigation for these industries varies based on precipitation. Wine grapes alone make
Amador Water Agency 2015 Urban Water Management Plan System Water Use
June 2016 4-7
up 43% of the agricultural industry in Amador County, and they are particularly climate sensitive (Amador County Department of Agriculture, 2015). Shifts in daily heat patterns could result in additional water demand for these crops. The effects of increased air temperatures on agriculture will include faster plant development, shorter growing seasons, changes to evapotranspiration, potential heat stress, and shifts in demand for irrigation water. Irrigation demands in the nearby Sacramento Valley are expected to increase by as much as 6% in the future, and similar increases would be expected in the Agency’s service area, resulting in increased water demands during summer months (RMC, 2013).
Overall, climate change is expected to cause more frequent and severe droughts, thus increasing the seasonal and annual variability of water demand. Water use in the Agency’s service area varies by more than 50% seasonally, making the region vulnerable to increases in seasonal water use. Seasonal water uses, such as landscape irrigation demands, are expected to increase due to climate change (RMC, 2013). An increase in drought frequency and severity could also cause an increased dependence on groundwater pumping. Although groundwater makes up a small portion of the Agency’s supply, the groundwater source is fractured aquifers and shallow alluvial basins, which may lack resiliency to drought events. During the current drought (2012-2016), wine grape growers in the Shenandoah Valley area have been experiencing falling ground water levels. Reports indicate that some growers are drilling wells from their current elevation of 175 feet to over 400 feet in order to obtain adequate water supplies. Other grape growers are experiencing similar ground water problems and may choose to replace or augment groundwater with recycled water for irrigation. Currently, grape growers in the Shenandoah Valley are undertaking a study to evaluate options for surface water due to the concerns over adequate ground water. There are approximately 3,000 acres of wine grapes in the Shenandoah Valley in addition to other agricultural crops. Although the Agency’s customers have responded excellently to use curtailments put in place during the current drought (2012-2016), demand hardening may become a concern as droughts become more frequent and severe.
Climate change may lead to difficulty with balancing water demands, as changes in snowmelt, drought frequency, and seasonal use patterns may exacerbate ecosystem vulnerabilities. Other users of the Mokelumne River, including EBMUD and PG&E, have regularly released cold pool water to keep the water temperatures downstream appropriate for Steelhead trout and other anadromous fish. This environmental demand may compete with municipal and agricultural water needs in the future.
Amador Water Agency 2015 Urban Water Management Plan SB X7-7 Baselines and Targets
June 2016 5-1
Chapter 5 SB X7-7 Baselines and Targets
The Water Conservation Act of 2009, also referred to as SB X7-7 or 20x2020, requires the State to reduce its urban water demands 20 percent by 2020. To help the State achieve its goal of reducing urban water use, agencies must have established urban water use targets in their 2010 UWMPs and demonstrate compliance in their 2015 UWMPs. In its 2010 UWMP, Amador Water Agency calculated its baseline water use during a baseline period and developed urban water use targets for 2015 and 2020 by applying a four-step methodology described in the 2010 UWMP Guidebook. As described in the 2015 UWMP Guidebook and summarized in the following section, the Agency can update its 2020 urban water use target in its 2015 UWMP, as well as the baseline and 2015 target, with updated Census population data.
The Agency is in compliance with its 2015 target and it is on track for achieving its 2020 target. Supporting calculations used to determine the SBX7-7 baselines and targets as well as the DWR SB X7-7 Verification Form are included in Appendix E.
5.1 Updating Calculations from 2010 UWMP The baselines and targets for the Agency’s 2010 UWMP were calculated using a 10-year baseline period from 2001 to 2010, resulting in a base daily per capita water use of 192 gallons per capita per day (GPCD). To calculate the targets, Method 1 of DWR’s target methodologies was applied, resulting in a 2015 target of 173 GPCD (90% of baseline) and a 2020 target of 154 GPCD (80% of baseline). Gross water use used in 2010 to develop the baseline and targets included potable demands for the Agency’s retail service areas only and did not include raw water customers, populations served by other water agencies, or those outside of Agency service area boundaries. Population was calculated by multiplying the number of residential service connections by persons per connection based on Department of Finance (DOF) data.
The 2015 Guidebook requires the use of 2010 U.S. Census data to calculate the population within a service area. Thus, the Agency’s GPCD baseline and 2015 and 2020 targets have been recalculated in this UWMP using U.S. Census data. During updates to the baseline and target calculations, the Agency also incorporated its retail raw water use and refined its retail service area boundary.
5.1.1 Step 1 – Determine Base Daily per Capita Water Use
Baseline Periods
A 15-year baseline period is allowed for use in baseline water use calculation only if an agency’s recycled water deliveries accounted for 10% or more of their total water deliveries in 2008. If recycled water accounted for 10% or less of an agency’s total water deliveries, then the baseline period used must be a 10 year period ending no earlier than 2004. The Agency’s recycled water supply was less than 10% of the total supply in 2008, therefore the base period range for determining the baseline daily per capita water use is 10 years. Additionally, a 5-year baseline period must be selected to confirm the 2020 target GPCD, as described in Section 5.1.2.
The Agency selected 1995 to 2004 for its 10-year baseline period and 2003 to 2007 for its 5-year baseline period. Table 5-1 summarizes the baseline periods chosen for the analysis.

Amador Water Agency 2015 Urban Water Management Plan SB X7-7 Baselines and Targets
June 2016 5-2
Table 5-1: Baseline Period Ranges (SB X7 -7 Table-1)
Baseline Parameter Value Units
10- to 15-year
baseline period
2008 total water deliveries
7,049 Acre Feet
2008 total volume of delivered recycled water
515 Acre Feet
2008 recycled water as a percent of total
deliveries 7.31% Percent
Number of years in baseline period1, 2 10 Years
Year beginning baseline period range 1995
Year ending baseline period range3 2004
5-year
baseline period
Number of years in baseline period 5 Years
Year beginning baseline period range 2003
Year ending baseline period range4 2007
1If the 2008 recycled water percent is less than 10 percent, then the first baseline period is a continuous 10-year period. If
the amount of recycled water delivered in 2008 is 10 percent or greater, the first baseline period is a continuous 10- to 15-
year period. 2 The Water Code requires that the baseline period is between 10 and 15 years. However, DWR recognizes that some water
suppliers may not have the minimum 10 years of baseline data.
3The ending year must be between December 31, 2004 and December 31, 2010.
4The ending year must be between December 31, 2007 and December 31, 2010.
NOTES: The 2008 total volume of delivered recycled water was the volume treated by the City of Ione
and delivered to the Castle Oaks Golf Course. 2008 volume is assumed to be the average for the
Castle Oaks Water Reclamation Plant, equivalent to 0.7 MGD for April through November (Policy
Consulting Associates, 2014). Although it was not treated and delivered by the Agency, it is an offset
to potable water that would otherwise need to be supplied by the Agency.
Service Area Population
For the 2015 UWMPs, DWR has provided a Population Tool to aid agencies in calculating their population during their baseline period and for 2015. The Population Tool uses the Agency’s retail service area boundary, the number of residential connections served by the Agency, and 2000 and 2010 U.S. Census data to compute the population served by the Agency. A Technical Memorandum detailing the process of calculating the Agency’s service area population is included in Appendix F. The Agency’s estimated population data from the Population Tool for its baseline periods and the year 2015 are summarized in Table 5-2.
Gross Water Use
Gross Water Use is defined in the 2015 Guidebook as the total volume of treated and raw (untreated) water that enters the distribution system of the Agency. Recycled water, water placed into long-term storage, water sold to other agencies, and water used for agricultural purposes are excluded from this volume. Since the Agency has raw water customers within the AWS that receive raw water for non-agricultural use directly from the Amador Canal, the Canal is considered part of the Agency’s distribution system. The Agency’s other water systems do not have raw water customers, so the distribution system for these areas starts at the point where treated water is distributed to customers. Thus, raw water use from the AWS is added to treated water use from CAWP, Lake Camanche Village, and La Mel Heights to determine the Agency’s Gross

Amador Water Agency 2015 Urban Water Management Plan SB X7-7 Baselines and Targets
June 2016 5-3
Water Use, with the exclusion of wholesale water deliveries and agricultural water use. The inclusion of raw water in this UWMP’s baseline and target GPCD analysis greatly increased the Agency’s Gross Water Use measure from the 2010 UWMP, as most of the Agency’s water loss occurs in its raw water system. The Agency conveys raw water via gravity in the Amador Canal from Lake Tabeaud to the Tanner WTP. A raw water canal and pipe containing water not treated at Tanner continues from Sutter Creek along Highway 88 to the Ione Reservoir for treatment at the Ione WTP. Along the Amador Canal, the Agency delivers raw water to retail residential customers for non-potable purposes. This Canal, at one time, was a 23-mile earthen ditch that experienced significant water loss through seepage and evaporation. The Agency implemented the first phase of the Amador Transmission Project in 2007 with the installation of 8.8 miles of 30-inch pipeline (Amador Transmission Pipeline) connecting Lake Tabeaud to Tanner Reservoir. This pipeline transports nearly all of the raw water for the AWS. The Amador Canal continues to operate to serve customers along its alignment with greatly reduced flows. Prior to completion of the Amador Transmission Pipeline the canal water losses were 40-50% of the volume diverted in to the canal headworks. This first phase of the project reduced water loss by over 25%, or approximately 1,100 AFY. The second phase of the project may occur within the time horizon of this UWMP and would place 18 miles of 6- to 12-inch diameter pipeline in the earthen unlined canal (from New York Ranch Reservoir to Lake Tabeaud) to further reduce water loss, improve water supply reliability, and protect water quality to the raw water customers. It is estimated that the second phase of the project would save an additional 1,800 AFY of water. The Agency’s Gross Water Use for its baseline period and for 2015 is shown in Table 5-2.

Amador Water Agency 2015 Urban Water Management Plan SB X7-7 Baselines and Targets
June 2016 5-4
Table 5-2: Gallons Per Capita Per Day (GPCD) (SB X7 -7 Table 5)
Baseline Year Fm SB X7-7 Table 3
Service Area
Population Fm SB X7-7
Table 3
Annual Gross
Water Use Fm SB X7-7
Table 4
Daily Per
Capita Water
Use (GPCD)
10 to 15 Year Baseline GPCD
Year 1 1995 11,123 8,177 656
Year 2 1996 11,030 9,478 767
Year 3 1997 10,933 10,768 879
Year 4 1998 11,112 9,045 727
Year 5 1999 11,215 11,266 897
Year 6 2000 11,181 10,839 865
Year 7 2001 11,262 10,597 840
Year 8 2002 12,781 8,600 601
Year 9 2003 14,410 8,900 551
Year 10 2004 14,987 8,863 528
10-15 Year Average Baseline GPCD 731
5 Year Baseline GPCD
Baseline Year Fm SB X7-7 Table 3
Service Area
Population Fm SB X7-7
Table 3
Gross Water Use Fm SB X7-7
Table 4
Daily Per
Capita Water
Use
Year 1 2003 14,410 8,900 551
Year 2 2004 14,987 8,863 528
Year 3 2005 14,737 7,497 454
Year 4 2006 14,851 9,437 567
Year 5 2007 14,859 8,395 504
5 Year Average Baseline GPCD 521
2015 Compliance Year GPCD
2015 13,868 4,806 309
5.1.2 Step 2 – Determine Urban Water Use Target DWR provided four methods that an urban water supplier may choose from to develop its 2020 water use target. The Agency has selected Method 1, 80% of the Base Daily Per Capita Use, to meet the urban water use target. The calculated base daily per capita use from Table 5-2 is 731 GPCD; therefore, the 2020 target calculated at 80% of the base GPCD is 585 GPCD.
5.1.3 Step 3 – Confirm Urban Water Use Target The 2020 target may not be greater than 95% of the 5 year baseline average. Table 5-2 provides the annual daily per capita use for the 5-year baseline period (2003 to 2007). 95% of the 5-year base daily per capita water use (521 GPCD) was calculated to be 495 GPCD. The 2020 target of 585 GPCD calculated from the 10-year baseline period was compared to 95% of the 5-year base period to confirm that the use target meets a minimum threshold. Since the target use of 585 GPCD is more than the 95% of the 5-year base daily per

Amador Water Agency 2015 Urban Water Management Plan SB X7-7 Baselines and Targets
June 2016 5-5
capita water use of 495 GPCD, the 2020 target must be adjusted to the lesser of the two values. Thus, the Agency’s 2020 water use target is 495 GPCD.
5.1.4 Step 4 – Determine Interim Urban Water Use Target The 2015 interim water use target is halfway between the baseline GPCD (731 GPCD) and the 2020 target GPCD (495 GPCD). Therefore, the interim water use target is 613 GPCD for 2015. Table 5-3 summarizes the Agency’s baseline and target GPCDs.
Table 5-3: Baselines and Targets Summary (DWR Table 5 -1)
Baseline
Period Start Year End Year
Average
Baseline
GPCD*
2015
Interim
Target *
Confirmed
2020
Target*
10-15
year 1995 2004 731 613 495
5 Year 2003 2007 521
*All values are in Gallons per Capita per Day (GPCD)
NOTES: The Confirmed 2020 Target is 95% of the 5 Year Baseline GPCD.
The 2015 Interim Target is the GPCD halfway between the 10 Year Baseline
GPCD and the 2020 Target GPCD.
5.2 2015 Compliance
5.2.1 Water Use Reduction Plan In 2010, the Agency proposed to use the following actions to meet its use target:
• Expanded use of recycled water.
• Capital improvements in the water system to reduce leakage.
• Implementation of a Water Conservation Plan that closely follows the Best Management Practices under the California Urban Water Conservation Council Memorandum of Understanding.
• Conversion of raw water ditches to piped segments.
• Water meter change-outs.
• Conversion of unmetered services to metered services.
• Assistance to land use agencies in establishing new building standards to achieve water demand reductions.
These improvements, particularly improvements made to the raw water distribution system (Amador Canal) to drastically reduce water losses, have helped the Agency to meet its 2015 interim target GPCD. The Agency’s actual 2015 use was 309 GPCD. This meets the 2015 interim target of 613 GPCD and also meets the 2020 target of 495 GPCD. Although 2015 use may be artificially low due to state-mandated restrictions caused by the recent severe drought, the Agency is on track to meet its 2020 target. The Agency demonstrates compliance with its 2015 GPCD goal in Table 5-4. No adjustments were made to the 2015 GPCD. The Agency plans to continue to make improvements to its system, implement DMMs as described in Chapter 8, and encourage water use efficiency throughout its service area in attempts to further reduce urban per capita water use.

Amador Water Agency 2015 Urban Water Management Plan SB X7-7 Baselines and Targets
June 2016 5-6
Table 5-4: 2015 Compliance (DWR Table 5 -2)
Actual
2015
GPCD
2015
Interim
Target
GPCD
Optional Adjustments to 2015 GPCD
Enter "0" for adjustments not used 2015 GPCD
(Adjusted if
applicable)
Did Supplier
Achieve
Targeted
Reduction
for 2015?
Y/N
Extraordinary
Events
Economic
Adjustment
Weather
Normalization
TOTAL
Adjustments
Adjusted
2015
GPCD
309 613 0 309 309 Yes
*All values are in Gallons per Capita per Day (GPCD)
NOTES: No adjustments were made to the 2015 per capita water use.
Amador Water Agency 2015 Urban Water Management Plan SB X7-7 Baselines and Targets
June 2016 5-7
5.3 R-GPCD In addition to presenting its GPCD, as required by the 2015 guidebook, the Agency calculated its Residential Gallons per Capita per Day (R-GPCD). The R-GPCD only accounts for potable residential deliveries, thus, the retail raw water, water used for non-residential purposes, and water lost in the distribution system that was included in the GPCD Gross Water Use volume is not included in the calculation of R-GPCD. The R-GPCD was calculated in accordance with guidance provided by the State Water Resources Control Board for the purposes of drought reporting. The Agency’s average R-GPCD over the 10-year baseline period selected and described in Section 5.2 (1995-2004) was 135 GPCD. In 2015, the Agency’s R-GPCD was calculated as 98 GPCD. This demonstrates that the Agency’s residential customers have reduced their per capita daily water use by almost 27% over the past 10 years.

Amador Water Agency 2015 Urban Water Management Plan System Supplies
June 2016 6-1
Chapter 6 System Supplies
This section describes the sources of water available to the Agency, a description of each water source, and projections for future water supply availability. A discussion of surface water, groundwater, recycled water, desalinated water, stormwater, and any other source of water that is part of the Agency’s water supply is included. Information regarding planned future water supply projects and wholesale water supplies received from another source is also described.
6.1 Purchased or Imported Water The Agency does not purchase water from other water suppliers or import water.
6.2 Groundwater Groundwater accounts for approximately four percent of the Agency’s total treated water supply and is used in the communities of La Mel Heights and Lake Camanche Village.
6.2.1 La Mel Heights Water System The Agency operates two wells in the La Mel Heights area. The wells pump water from a groundwater aquifer that is not defined in Bulletin 118 as published by the California Department of Water Resources (DWR). Generally, the wells are operated in parallel. Well #1 has a safe yield of 50 AFY, or 31 gpm and Well #2 has a safe yield of 56 AFY, or 35 gpm. Either well is capable of meeting peak day demands which provides the Agency with a redundant back-up source.
6.2.2 Lake Camanche Village Area Water System The Agency operates four wells in the Lake Camanche Village area. Well 6 can safely yield 241 AFY (150 gpm), Well 9 can safely yield 516 AFY (320 gpm), Well 12 can safely yield 241 AFY (150 gpm), and Well 14 can safely yield 516 AFY (320 gpm) (Dunn, 2012). Wells 9 and 14 have experienced some reliability and water quality issues over the past several years, occasionally resulting in the temporary suspension of operation of one of the wells. Wells 6 and 12 have experienced capacity reductions during the past ten years. These wells pump groundwater from the Cosumnes Subbasin (Subbasin 5-22.16) of the San Joaquin Valley Groundwater Basin (DWR Bulletin 118-80, California’s Groundwater) and are located as shown in Figure 6-1. This subbasin is considered medium priority under the CASGEM Groundwater Basin Prioritization (June 2014) and is subject to the provisions of the Sustainable Groundwater Management Act. This subbasin is not listed as critically overdrafted by DWR and it is not adjudicated.
In 2012, the Agency prepared a Groundwater Supply Study and Integrated Regional Groundwater Management Plan for the Lake Camanche Water Improvement District No. 7 (Dunn, 2012); an excerpt of this plan is included as Appendix G. This plan concluded that groundwater overdraft conditions were not observed in the Lake Camanche Village Area Water System. A series of Best Management Objectives were identified in the plan, including maintaining or improving groundwater quality and elevations, protecting against land subsidence and impacts to and from surface water, educating the public on basin sustainability and groundwater recharge, and cooperating and collaborating with stakeholders to protect groundwater resources against drought.
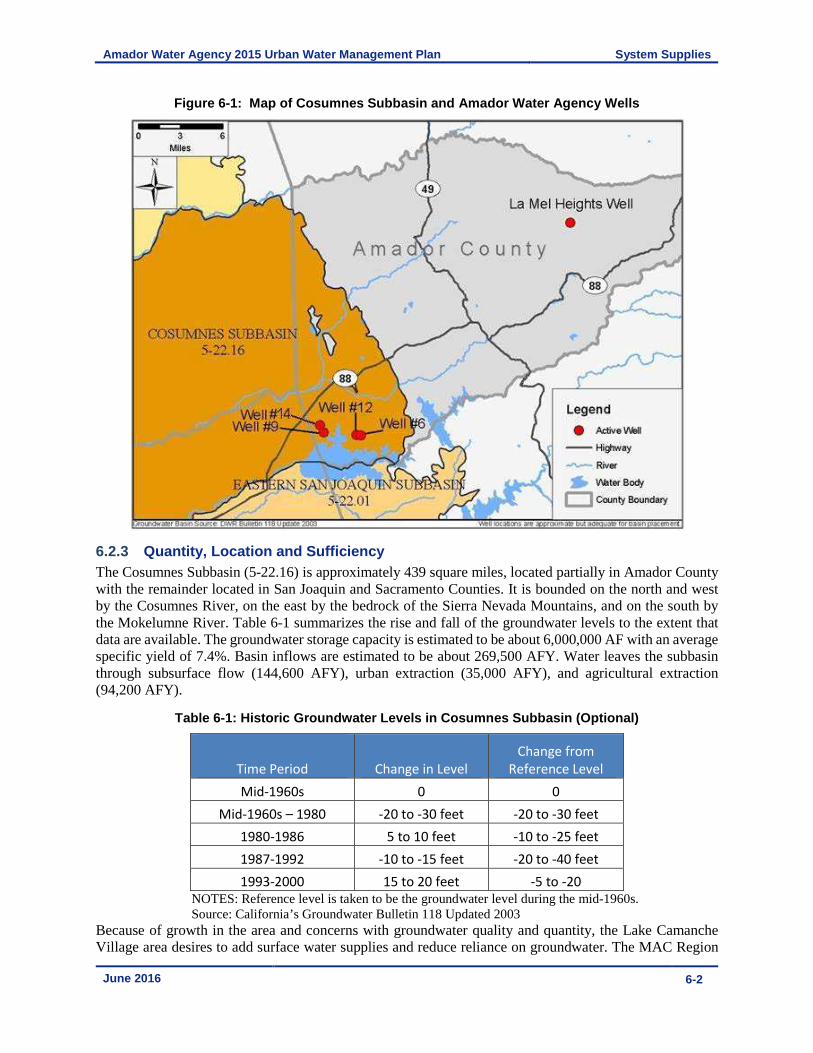
Amador Water Agency 2015 Urban Water Management Plan System Supplies
June 2016 6-2
Figure 6-1: Map of Cosumnes Subbasin and Amador Water Agency Wells
6.2.3 Quantity, Location and Sufficiency The Cosumnes Subbasin (5-22.16) is approximately 439 square miles, located partially in Amador County with the remainder located in San Joaquin and Sacramento Counties. It is bounded on the north and west by the Cosumnes River, on the east by the bedrock of the Sierra Nevada Mountains, and on the south by the Mokelumne River. Table 6-1 summarizes the rise and fall of the groundwater levels to the extent that data are available. The groundwater storage capacity is estimated to be about 6,000,000 AF with an average specific yield of 7.4%. Basin inflows are estimated to be about 269,500 AFY. Water leaves the subbasin through subsurface flow (144,600 AFY), urban extraction (35,000 AFY), and agricultural extraction (94,200 AFY).
Table 6-1: Historic Groundwater Levels in Cosumnes Subbasin (Optional)
Time Period Change in Level
Change from
Reference Level
Mid-1960s 0 0
Mid-1960s – 1980 -20 to -30 feet -20 to -30 feet
1980-1986 5 to 10 feet -10 to -25 feet
1987-1992 -10 to -15 feet -20 to -40 feet
1993-2000 15 to 20 feet -5 to -20 NOTES: Reference level is taken to be the groundwater level during the mid-1960s. Source: California’s Groundwater Bulletin 118 Updated 2003
Because of growth in the area and concerns with groundwater quality and quantity, the Lake Camanche Village area desires to add surface water supplies and reduce reliance on groundwater. The MAC Region

Amador Water Agency 2015 Urban Water Management Plan System Supplies
June 2016 6-3
secured funding to implement Phase 1 of the Camanche Area Regional Water Supply Project, which will provide surface water to Camanche North Shore and South Shore via a pipeline from the Mokelumne Aqueduct to a new 0.5 MGD surface water treatment plant. The design of this phase of the project is complete, with construction at approximately 20% as of October 2015. Phase 2 of the project will include a water treatment plant expansion and delivery of treated water to Lake Camanche Village, and Phase 3 will provide surface water to Calaveras County Water District. EBMUD is implementing this project, and the Agency has made in-system modifications to allow for the transmission of water.
The La Mel Heights area is limited on growth such that build out will be achieved in the next ten years. Therefore, the amount of groundwater projected to be pumped is held constant after the year 2020 for that water system. Table 6-2 summarizes groundwater use over the past five years for both areas. Reductions in pumped volumes in 2014 & 2015 reflect drought conservation efforts.
Table 6-2: Groundwater Volume Pumped (DWR Table 6 -1)
Groundwater Type Location or Basin Name 2011* 2012* 2013* 2014* 2015*
Alluvial Basin
San Joaquin Valley Cosumnes
Basin 5-22.16 (Lake
Camanche Village wells)
283 286 282 231 194
Fractured Rock Unclassified Groundwater
Aquifer (La Mel Heights well) 17 17 17 15 12
TOTAL 300 303 299 246 206
*All values are in Acre-Feet (AF)
6.3 Surface Water Surface water accounts for approximately ninety-six percent of the Agency’s total water supply. Surface water is the sole supply source for both the AWS and the CAWP and is obtained from the Mokelumne River watershed. The Mokelumne River watershed is located on the Agency’s southern boundary with the headwaters in parts of Amador, Alpine, El Dorado and Calaveras counties. The majority of flow is derived from snowmelt. The watershed ranges from peak elevations of approximately 10,000 feet above Mean Sea Level (MSL) at the Pacific Crest, down to 580 feet above MSL at Pardee Reservoir. The Mokelumne watershed upstream from Pardee Reservoir is approximately 578 square miles in extent.
The watershed above Pardee Reservoir is mostly protected and undeveloped, with a large portion located in the Mokelumne Wilderness. Many tributaries flow into the Mokelumne River before it reaches Pardee Reservoir. Reservoirs in the higher portions of the watershed include Lower Bear and Salt Springs, both owned by Pacific Gas & Electric Company (PG&E). Upstream hydropower facilities owned and operated by PG&E include diversion tunnels and regulating reservoirs, with most of the diverted flow released back into the river system. Pardee Reservoir and its downstream companion, Lake Camanche, are owned and operated by the EBMUD. Pardee Reservoir is operated for water supply and in stream requirements and Lake Camanche is operated for water supply, flood control, and in stream requirements.
The Agency is looking to increase Mokelumne River supplies through storage and regional collaboration efforts. The MAC IRWM region joined with the Eastern San Joaquin IRWM Region to create the MokeWISE program to develop and evaluate alternatives to optimize water resources management within the Mokelumne River watershed. This program aims to sustainably manage surface water in the region to provide interregional water supply, water quality and environmental benefits.
Amador Water Agency 2015 Urban Water Management Plan System Supplies
June 2016 6-4
6.3.1 Amador Water System In 1985, the Agency acquired the AWS from PG&E and the contractual right of up to 15,000 AFY diverted at a rate not to exceed 30 cubic feet per second (cfs). PG&E had been the major owner and operator for the purveyance of water in western Amador County since 1908. AWS receives water from the Mokelumne River via Lake Tabeaud and provides water service on a retail basis to the communities of Sutter Creek, Amador City, Martell, Ione and vicinities. The Agency provides wholesale water through the AWS to the communities of Jackson, Plymouth, and Drytown. In addition, the system supplies raw water via the Amador Canal and Ione pipeline for agricultural, industrial, commercial and domestic irrigation needs to both public facilities and individual raw water customers.
6.3.2 Central Amador Water Project In 1978, the Agency entered into an agreement with PG&E for the use of PG&E facilities to store and divert water under water rights acquired by the Agency for the CAWP water system. Initially, there were ten entities, public and private, that served water on a wholesale basis from the CAWP system. Over the years, the Agency has accepted and merged seven of those entities into the Agency’s retail customer base. The Agency’s present wholesale customers in this region include First Mace Meadow Water Association, Pine Grove CSD, and Rabb Park CSD. CAWP has historically pumped water from the Mokelumne River at PG&E’s Tiger Creek Afterbay. In 2015, the Agency began operation of the Gravity Supply Line (GSL) to replace the raw water pump system. The GSL diverts water at the Tiger Creek Regulator Reservoir and delivers water to the Buckhorn Water Treatment Plant by gravity. The CAWP surface water diversion is limited to a firm yield of 1,150 AFY at a rate not to exceed 3 cfs. The Agency is currently working to obtain additional surface water rights for the CAWP system which would expand the surface water diversions to 2,200 AFY with a flow not to exceed 5 cfs. The Agency has an agreement with PG&E to store water in the Lower Bear River Reservoir. Under the current water right permit, 1,600 AF can be stored in Lower Bear River Reservoir on an annual basis. The storage would be expanded to 3,000 AFY with the proposed water right permit.
6.4 Stormwater Stormwater is not currently used as a source of water for the Agency and it is not a planned source of water for the horizon of this UWMP.
6.5 Wastewater and Recycled Water The Agency recognizes recycled water use as a means of reducing raw and potable water demands in the region, in addition to addressing wastewater effluent discharges. As such, the Agency prepared the Regional Approach for Reuse Study in 2013 (Aegis, 2013), which proposes to maximize water recycling by developing a regional recycled water supply in lieu of raw and potable water. This study was funded by a Proposition 84 grant through the Sierra Nevada Conservancy and included coordination with local wastewater and planning agencies that were identified as potential partners in the region. Additionally, multiple non-governmental agencies, organizations and interested parties participated in stakeholder workshops on the study, as described in Section 6.5.1. The resultant report identified several alternatives for recycled water projects in the region based on market analysis, treatment technology, and cost. An excerpt of the Regional Approach for Reuse Study is included in this plan as Appendix H.
6.5.1 Recycled Water Coordination While the Agency has several small wastewater collection and treatment systems, the two largest wastewater treatment plants in the Agency’s service area are owned and operated by the City of Sutter Creek and the City of Jackson. The City of Sutter Creek’s treatment plant collects wastewater from Amador City, the City of Sutter Creek, and Martell. The wastewater treatment plants operated by the cities of Plymouth, Jackson, and Ione collect and treat wastewater from their respective cities. The Amador Regional Sanitation Authority (ARSA) is a joint powers authority comprised of the City of Sutter Creek, Amador
Amador Water Agency 2015 Urban Water Management Plan System Supplies
June 2016 6-5
City, and Amador County. ARSA provides distribution from the Sutter Creek WWTP to either the City of Ione’s tertiary treatment plant (Castle Oaks Reclamation Plant), or to the City of Ione’s secondary treatment plant (ponds). These service providers were consulted during the preparation of the Regional Approach for Reuse Study.
The Reuse Study identifies other potential stakeholders in the service area, including governmental entities, cities, and non-governmental agencies. Potential reuse costumers, including a golf course, parks, schools, and retail outlets located near Jackson, Sutter Creek, and Martell, were also identified.
During preparation of the Reuse Study, two stakeholder meetings were held with service providers, potential customers, and other interested parties. These meetings allowed stakeholders to contribute to the refinement of project alternatives to help the Agency reach a preferred project alternative.
6.5.2 Wastewater Collection, Treatment and Disposal The wastewater collection systems within the Agency’s service area are shown in Figure 6-2. Although the Agency currently owns, operates and maintains eleven geographically separate wastewater management systems throughout Amador County, none of the systems currently recycle water directly to reduce raw or potable water demands. Eight of the eleven systems are community leach field systems, while two systems treat wastewater to a secondary level that is then applied to land for disposal, and the last system is a collection only system that contracts for treatment and disposal. Most of these systems produce such limited quantities of wastewater or are so removed from reuse opportunities as to make recycling both inefficient and cost prohibitive. The Agency does, however, currently collect (but not treat) a significant quantity of wastewater in the Martell area of Amador County, which is immediately adjacent to the two other wastewater treatment purveyors, the cities of Sutter Creek and Jackson. Wastewater from the Martell system is processed under contract with the City of Sutter Creek and then through the ARSA system to the City of Ione, where the recycled water is further treated and used on the Castle Oaks Golf Course. The wastewater collection and treatment systems within the Agency’s service area are summarized in Table 6-3 and Table 6-4.
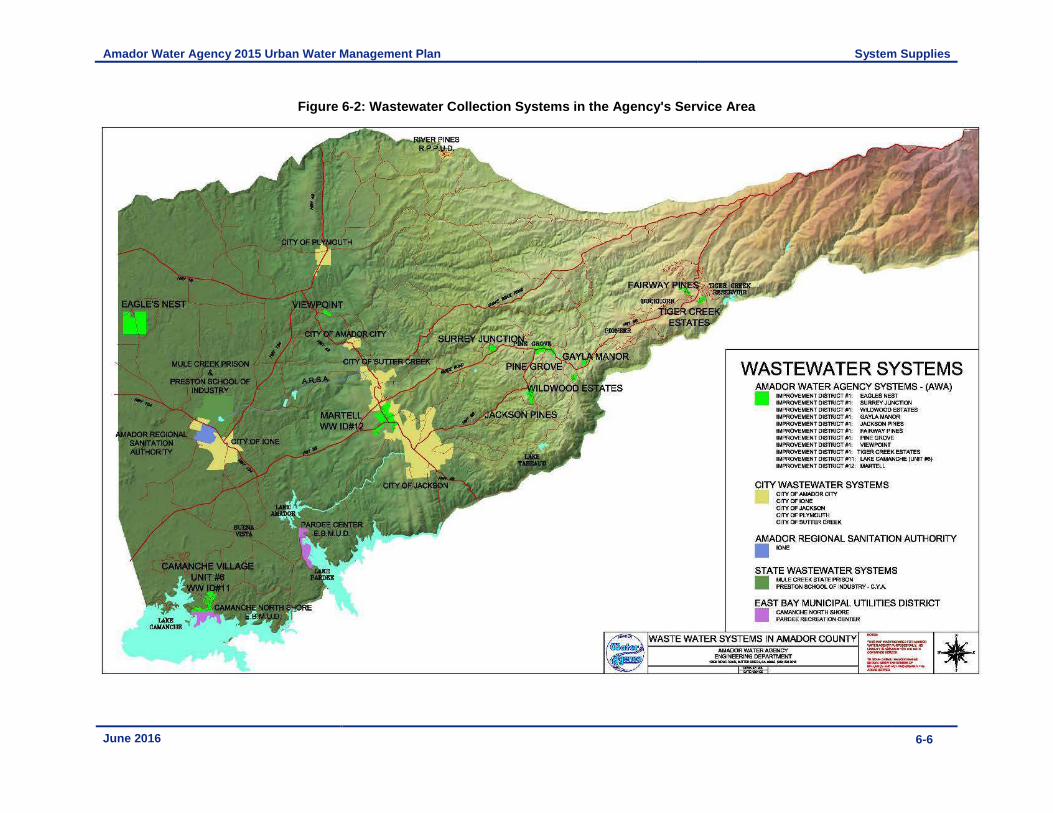
Amador Water Agency 2015 Urban Water Management Plan System Supplies
June 2016 6-6
Figure 6-2: Wastewater Collection Systems in the Agency's Service Area
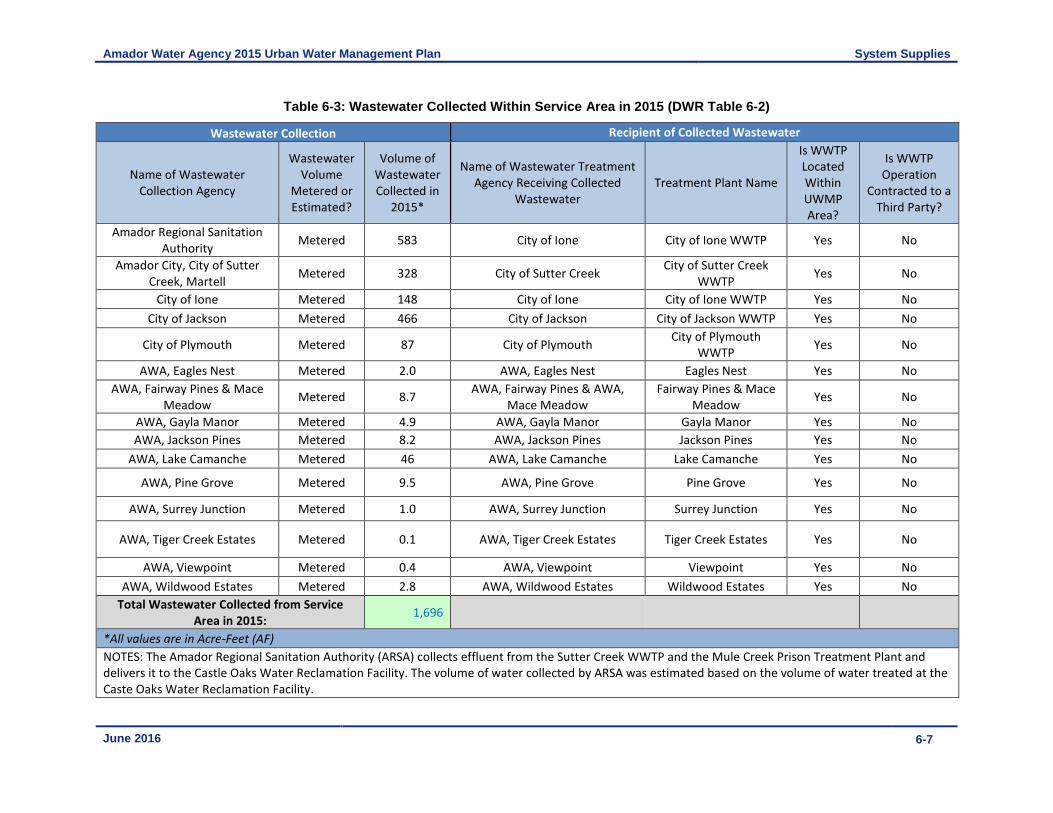
Amador Water Agency 2015 Urban Water Management Plan System Supplies
June 2016 6-7
Table 6-3: Wastewater Collected Within Service Area in 2015 (DWR Table 6-2)
Wastewater Collection Recipient of Collected Wastewater
Name of Wastewater
Collection Agency
Wastewater
Volume
Metered or
Estimated?
Volume of
Wastewater
Collected in
2015*
Name of Wastewater Treatment
Agency Receiving Collected
Wastewater
Treatment Plant Name
Is WWTP
Located
Within
UWMP
Area?
Is WWTP
Operation
Contracted to a
Third Party?
Amador Regional Sanitation
Authority Metered 583 City of Ione City of Ione WWTP Yes No
Amador City, City of Sutter
Creek, Martell Metered 328 City of Sutter Creek
City of Sutter Creek
WWTP Yes No
City of Ione Metered 148 City of Ione City of Ione WWTP Yes No
City of Jackson Metered 466 City of Jackson City of Jackson WWTP Yes No
City of Plymouth Metered 87 City of Plymouth City of Plymouth
WWTP Yes No
AWA, Eagles Nest Metered 2.0 AWA, Eagles Nest Eagles Nest Yes No
AWA, Fairway Pines & Mace
Meadow Metered 8.7
AWA, Fairway Pines & AWA,
Mace Meadow
Fairway Pines & Mace
Meadow Yes No
AWA, Gayla Manor Metered 4.9 AWA, Gayla Manor Gayla Manor Yes No
AWA, Jackson Pines Metered 8.2 AWA, Jackson Pines Jackson Pines Yes No
AWA, Lake Camanche Metered 46 AWA, Lake Camanche Lake Camanche Yes No
AWA, Pine Grove Metered 9.5 AWA, Pine Grove Pine Grove Yes No
AWA, Surrey Junction Metered 1.0 AWA, Surrey Junction Surrey Junction Yes No
AWA, Tiger Creek Estates Metered 0.1 AWA, Tiger Creek Estates Tiger Creek Estates Yes No
AWA, Viewpoint Metered 0.4 AWA, Viewpoint Viewpoint Yes No
AWA, Wildwood Estates Metered 2.8 AWA, Wildwood Estates Wildwood Estates Yes No
Total Wastewater Collected from Service
Area in 2015: 1,696
*All values are in Acre-Feet (AF)
NOTES: The Amador Regional Sanitation Authority (ARSA) collects effluent from the Sutter Creek WWTP and the Mule Creek Prison Treatment Plant and
delivers it to the Castle Oaks Water Reclamation Facility. The volume of water collected by ARSA was estimated based on the volume of water treated at the
Caste Oaks Water Reclamation Facility.

Amador Water Agency 2015 Urban Water Management Plan System Supplies
June 2016 6-8
Table 6-4: Wastewater Treatment and Discharge Within Service Area in 2015 (DWR Table 6-3)
Wastewater
Treated
Discharged
Treated
Wastewater
Recycled
Within
Service
Area
Recycled
Outside of
Service
Area
City of Sutter Creek WWTP ARSA System Land Disposal 5B030104001 Lake outfall YesSecondary,
Disinfected - 23328 328 0 0
City of Ione WWTP Percoloation Ponds 5SSO10894 Percolation ponds Yes Tertiary 148 148 0 0
Castle Oaks Water
Reclamation Facility
Castle Oaks Golf
CourseGolf Course Irrigation 5B030109001 Land disposal Yes Tertiary 583 0 583 0
City of Jackson WWTP Jackson Creek Creek 5B030103001 River or creek outfall No Tertiary 466 466 0 0
City of Plymouth WWTP Land Disposal 5-01-095 Land disposal NoSecondary,
Disinfected - 2387 87 0 0
Eagles Nest Eagles Nest Community Leachfield 5B030120003 Subsurface infiltration gallery No 2.0 2.0 0 0
Fairway Pines Fairway Pines Community Leachfield 5B031026001 Subsurface infiltration gallery No 4.8 4.8 0 0
Mace Meadows Mace Meadows Community Leachfield 5B031026001 Subsurface infiltration gallery No 3.9 3.9 0 0
Gayla Manor WWTP Gayla Manor Land Disposal 5B031025001 Land disposal NoSecondary,
Disinfected - 234.9 4.9 0 0
Jackson Pines Jackson Pines Community Leachfield N/A Subsurface infiltration gallery No 8.2 8.2 0 0
Lake Camanche WWTP Lake Camanche Land Disposal 5B031010001 Land disposal NoSecondary,
Disinfected - 2346 46 0 0
Pine Grove Pine Grove Community Leachfield 5B05NP00005 Subsurface infiltration gallery No 9.5 9.5 0 0
Surrey Junction Surrey Junction Community Leachfield N/A Subsurface infiltration gallery No 1.0 1.0 0 0
Tiger Creek EstatesTiger Creek
EstatesCommunity Leachfield N/A Subsurface infiltration gallery No 0.1 0.1 0 0
Viewpoint Viewpoint Community Leachfield N/A Subsurface infiltration gallery No 0.4 0.4 0 0
Wildwood EstatesWildwood
EstatesCommunity Leachfield 5B03NC0004 Subsurface infiltration gallery No 2.8 2.8 0 0
Buckhorn WTPMace Meadows
Golf CourseGolf Course Irrigation 5B03NC00019 Land disposal No Tertiary 39.0 0.0 39 0
Total 1,735 1,113 622 0
NOTES: The Buckhorn WTP line item consists of the reuse of backwash water from water treatment processes for use at the Mace Meadows Golf Course. Note that the volume of wastewater treated does
not equal the volume of wastewater collected due to the inclusion of the backwash water from the Buckhorn WTP. Treatment level is not provided for the leach fields as the wastewater is not treated
before it is discharged through subsurface infiltration.
Table 6-3 Retail: Wastewater Treatment and Discharge Within Service Area in 2015
Wastewater Treatment
Plant Name
Discharge
Location Name
or Identifier
Discharge Location
Description
Wastewater
Discharge ID
Number
(optional)
Method of Disposal
Does This Plant
Treat
Wastewater
Generated
Outside the
Service Area?
Treatment Level
2015 volumes*
*All values are in Acre-Feet (AF)

Amador Water Agency 2015 Urban Water Management Plan System Supplies
June 2016 6-9
6.5.3 Recycled Water System Currently, the only treated wastewater that meets recycled water standards within the Agency’s service area is treated by the City of Ione at the Castle Oaks Water Reclamation Facility. This recycled water is applied to the Castle Oaks Golf Course for irrigation. Additionally, backwash from the Buckhorn Water Treatment Plant (WTP) was used to provide irrigation for the Mace Meadow Golf Course in 2015. Table 6-5 shows that this is currently the only type of beneficial use for recycled water in the Agency’s service area.
Table 6-5: 2010 UWMP Recycled Water Use Projection Compared to 2015 Actual (DWR Table 6-5)
Use Type 2010 Projection for 2015* 2015 actual use*
Agricultural irrigation
Landscape irrigation (excludes golf
courses)
Golf course irrigation N/A 622
Commercial use
Industrial use
Geothermal and other energy
production
Seawater intrusion barrier
Recreational impoundment
Wetlands or wildlife habitat
Groundwater recharge (IPR)
Surface water augmentation (IPR)
Direct potable reuse
Other
Total 0 622
*All values are in Acre-Feet (AF)
NOTES: Recycled water was used in 2010, but no recycled water use projections were made in the
2010 UWMP. Recycled water was not used for any purpose or application other than golf course
irrigation in 2015.
6.5.4 Recycled Water Beneficial Uses Currently, the Agency does not produce any recycled or reclaimed water at any of its wastewater treatment plants due to economic and technical feasibility issues. However, in the future, the Agency anticipates development of a regional reclaimed water supply to offset raw and potable water demands through uses such as, but not limited to, agricultural irrigation, commercial landscape irrigation, construction water, industrial process water, and recreational impoundments. The Agency initiated a study in 2015 that will consider treating a portion of Lake Camanche Village’s wastewater for agricultural and future residential landscape use.
It is anticipated that wherever economically and physically feasible and when such recycled water is of adequate quality and quantity, the Agency and its partners will endeavor to plan, collaborate and implement the use of recycled water. Most likely, future recycled water projects will build off the Regional Approach for Reuse Study that was recently completed and acts as the first step in implementing a regional approach to water recycling. Specifically, in the Reuse Study, the recommended alternative for future implementation consists of a three-phased project. Phase 1 would include construction of a new recycled water treatment plant near the existing Sutter Creek wastewater treatment plant and would distribute recycled water within the City of Sutter Creek. Phase 2 would consist of the construction of a transmission pipeline from the
Amador Water Agency 2015 Urban Water Management Plan System Supplies
June 2016 6-10
Sutter Creek recycled water plant to the Martell and Gold Rush Subdivision areas. Phase 3 would provide recycled water to the City of Jackson through either an extension of the transmission line from the Sutter Creek recycled water plant or an upgrade to the City of Jackson’s wastewater treatment plant.
Table 6-6 shows the expected beneficial uses of recycled water over the next 30 years in the Agency’s service area, based on implementation of the preferred alternative for the Regional Reuse Project as well as the Lake Camanche Village Recycled Water Project, and the City of Plymouth’s Recycled Water Project.

Amador Water Agency 2015 Urban Water Management Plan System Supplies
June 2016 6-11
Table 6-6: Current and Projected Recycled Water Direct Beneficial Uses Within Service Area (DWR Table 6-4)
Name of Agency Producing (Treating) the Recycled Water: Amador Water Agency, City of Ione, City of Plymouth
Name of Agency Operating the Recycled Water Distribution System: Amador Water Agency, City of Ione, City of Plymouth
Supplemental Water Added in 2015 0
Source of 2015 Supplemental Water N/A
Beneficial Use Type General Description of
2015 Uses
Level of
Treatment 2015* 2020* 2025* 2030* 2035*
2040
(opt)*
Agricultural irrigation
Secondary,
Disinfected - 23 140 140 140 140 140
Landscape irrigation (excludes golf
courses) Tertiary 541 541 541 541
Golf course irrigation Castle Oaks and Mace
Meadow Golf Courses Tertiary 622 583 583 583 583 583
Commercial use
Industrial use
Geothermal and other energy production
Seawater intrusion barrier
Recreational impoundment
Wetlands or wildlife habitat
Groundwater recharge (IPR)
Surface water augmentation (IPR)
Direct potable reuse
Other
Total: 622 723 1,264 1,264 1,264 1,264
*All values are in Acre-Feet (AF)
IPR - Indirect Potable Reuse
NOTES: 2015 recycled water use comes from the Buckhorn WTP Backwash System for the Mace Meadow Golf Course and the Castle Oaks Water
Reclamation Facility for the Castle Oaks Golf Course. The Mace Meadow Golf Course closed in 2015 and the Buckhorn WTP Backwash System will be used
for internal reuse in the future, so this volume of water is not included in future recycled water projections. The implementation of City of Plymouth's
recycled water project will lead to the increase in recycled water for agricultural irrigation in 2020. The implementation of the Lake Camanche Village
Recycled Water Project and the Regional Reuse Project lead to the increase in recycled water for landscape irrigation in 2025. The level of treatment for
future projects may change as project development continues. There are no other anticipated uses for recycled water through 2040.
Amador Water Agency 2015 Urban Water Management Plan System Supplies
June 2016 6-12
6.5.5 Actions to Encourage and Optimize Future Recycled Water Use The Regional Approach to Reuse Study identified a preferred decentralized reuse system comprised of a new recycled water treatment plant located in the City of Sutter Creek and upgrades to the existing recycled water treatment plant located in the City of Jackson. This alternative would require additional refinement prior to implementation (Aegis, 2013):
• On-going public outreach program;
• Obtain all necessary permits to operate a recycled water system;
• Execute agreements with recycled water users and partners;
• Finalize recycled water rules and regulations, specifications, and processes;
• Prepare financing plan and revenue program to fund the projects;
• Conduct user site investigations to define site-specific conversion requirements;
• Prepare preliminary and final design plans of required facilities;
• Prepare and certify environmental documentation; and
• Construct recycled water facilities.
If the recommended alternative identified in the Study were implemented, recycled water use in the Agency service area would increase by 227 AFY. Currently, the most significant constraint to implementation is adequate funding. However, potential financing and grant funding opportunities will be explored which would allow for offsetting costs to Agency ratepayers. Potential funding opportunities currently identified for planning, design, and construction of a centralized recycled water system in the Agency service area include the following: Grants from the Water Recycling Funding Program administered by the State Water Resources Control Board (SWRCB);
• Grants from the IRWM Program administered by DWR;
• Title XVI Water Reuse and Reclamation grants administered by the U.S. Bureau of Reclamation; and
• Low-interest loans through the SWRCB Clean Water State Revolving Fund program.
Table 6-7 below describes all planned recycled water projects undertaken within the Agency’s service area over the planning horizon of this UWMP.
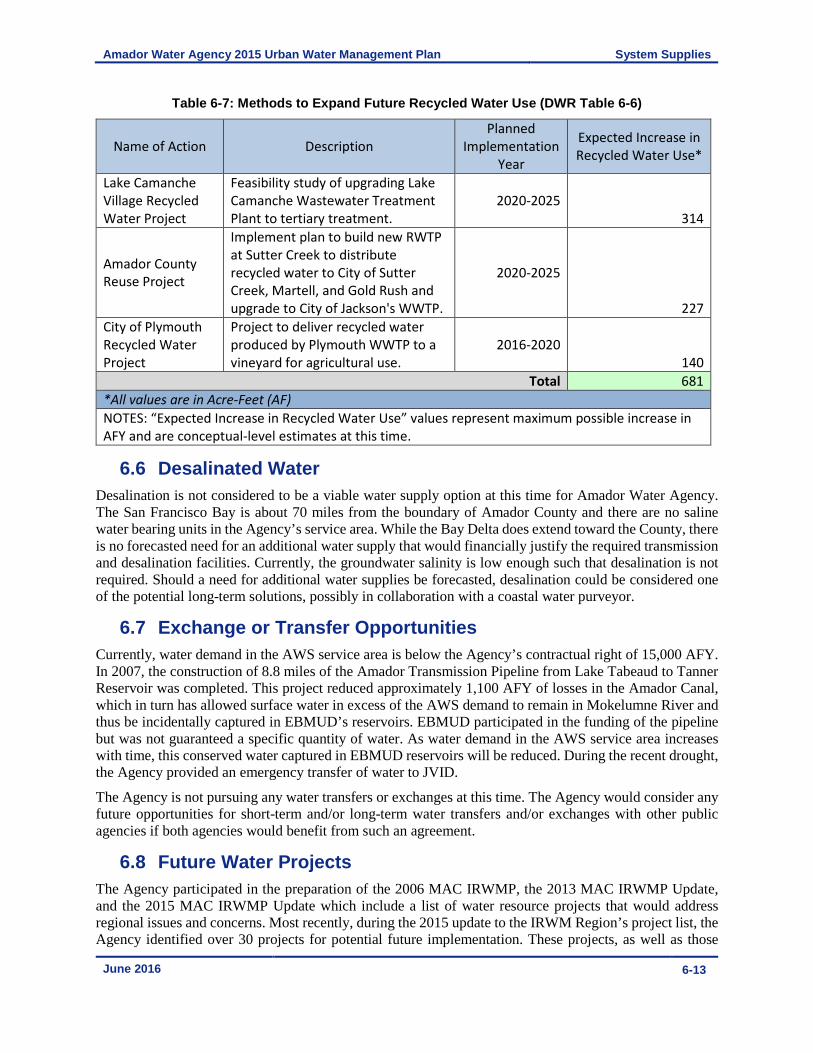
Amador Water Agency 2015 Urban Water Management Plan System Supplies
June 2016 6-13
Table 6-7: Methods to Expand Future Recycled Water Use (DWR Table 6-6)
Name of Action Description
Planned
Implementation
Year
Expected Increase in
Recycled Water Use*
Lake Camanche
Village Recycled
Water Project
Feasibility study of upgrading Lake
Camanche Wastewater Treatment
Plant to tertiary treatment.
2020-2025
314
Amador County
Reuse Project
Implement plan to build new RWTP
at Sutter Creek to distribute
recycled water to City of Sutter
Creek, Martell, and Gold Rush and
upgrade to City of Jackson's WWTP.
2020-2025
227
City of Plymouth
Recycled Water
Project
Project to deliver recycled water
produced by Plymouth WWTP to a
vineyard for agricultural use.
2016-2020
140
Total 681
*All values are in Acre-Feet (AF)
NOTES: “Expected Increase in Recycled Water Use” values represent maximum possible increase in
AFY and are conceptual-level estimates at this time.
6.6 Desalinated Water Desalination is not considered to be a viable water supply option at this time for Amador Water Agency. The San Francisco Bay is about 70 miles from the boundary of Amador County and there are no saline water bearing units in the Agency’s service area. While the Bay Delta does extend toward the County, there is no forecasted need for an additional water supply that would financially justify the required transmission and desalination facilities. Currently, the groundwater salinity is low enough such that desalination is not required. Should a need for additional water supplies be forecasted, desalination could be considered one of the potential long-term solutions, possibly in collaboration with a coastal water purveyor.
6.7 Exchange or Transfer Opportunities Currently, water demand in the AWS service area is below the Agency’s contractual right of 15,000 AFY. In 2007, the construction of 8.8 miles of the Amador Transmission Pipeline from Lake Tabeaud to Tanner Reservoir was completed. This project reduced approximately 1,100 AFY of losses in the Amador Canal, which in turn has allowed surface water in excess of the AWS demand to remain in Mokelumne River and thus be incidentally captured in EBMUD’s reservoirs. EBMUD participated in the funding of the pipeline but was not guaranteed a specific quantity of water. As water demand in the AWS service area increases with time, this conserved water captured in EBMUD reservoirs will be reduced. During the recent drought, the Agency provided an emergency transfer of water to JVID.
The Agency is not pursuing any water transfers or exchanges at this time. The Agency would consider any future opportunities for short-term and/or long-term water transfers and/or exchanges with other public agencies if both agencies would benefit from such an agreement.
6.8 Future Water Projects The Agency participated in the preparation of the 2006 MAC IRWMP, the 2013 MAC IRWMP Update, and the 2015 MAC IRWMP Update which include a list of water resource projects that would address regional issues and concerns. Most recently, during the 2015 update to the IRWM Region’s project list, the Agency identified over 30 projects for potential future implementation. These projects, as well as those
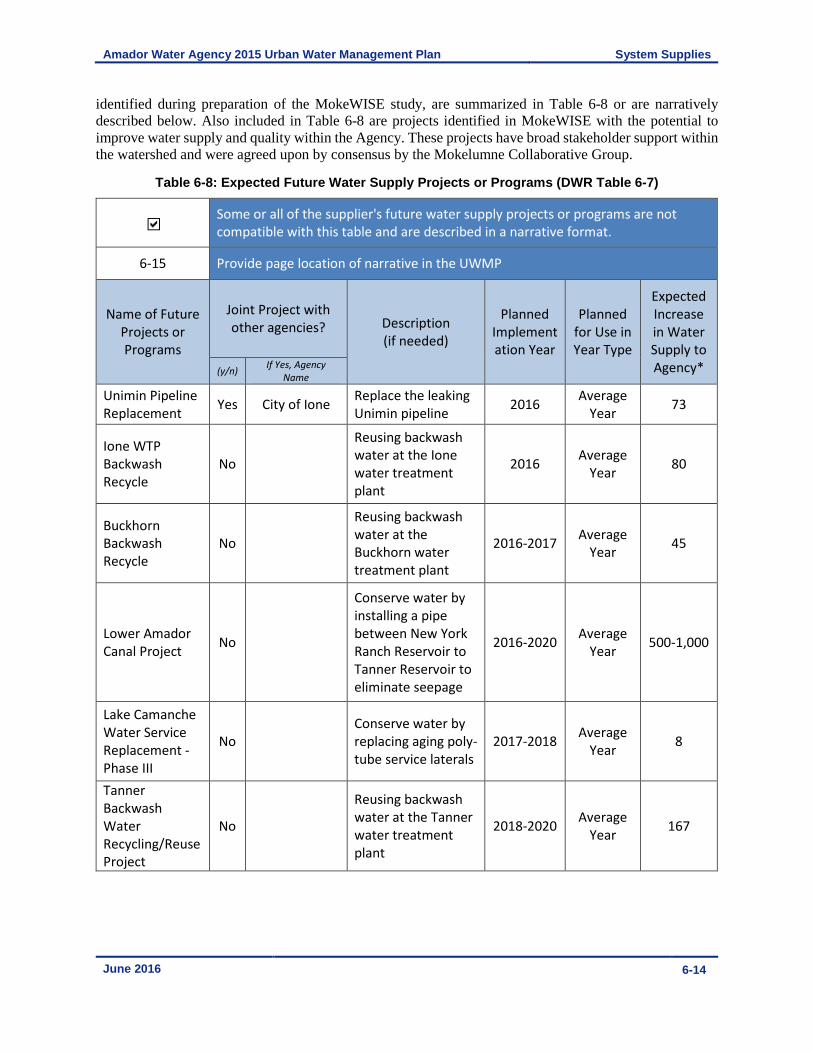
Amador Water Agency 2015 Urban Water Management Plan System Supplies
June 2016 6-14
identified during preparation of the MokeWISE study, are summarized in Table 6-8 or are narratively described below. Also included in Table 6-8 are projects identified in MokeWISE with the potential to improve water supply and quality within the Agency. These projects have broad stakeholder support within the watershed and were agreed upon by consensus by the Mokelumne Collaborative Group.
Table 6-8: Expected Future Water Supply Projects or Programs (DWR Table 6 -7)
Some or all of the supplier's future water supply projects or programs are not
compatible with this table and are described in a narrative format.
6-15 Provide page location of narrative in the UWMP
Name of Future
Projects or
Programs
Joint Project with
other agencies? Description
(if needed)
Planned
Implement
ation Year
Planned
for Use in
Year Type
Expected
Increase
in Water
Supply to
Agency* (y/n) If Yes, Agency
Name
Unimin Pipeline
Replacement Yes City of Ione
Replace the leaking
Unimin pipeline 2016
Average
Year 73
Ione WTP
Backwash
Recycle
No
Reusing backwash
water at the Ione
water treatment
plant
2016 Average
Year 80
Buckhorn
Backwash
Recycle
No
Reusing backwash
water at the
Buckhorn water
treatment plant
2016-2017 Average
Year 45
Lower Amador
Canal Project No
Conserve water by
installing a pipe
between New York
Ranch Reservoir to
Tanner Reservoir to
eliminate seepage
2016-2020 Average
Year 500-1,000
Lake Camanche
Water Service
Replacement -
Phase III
No
Conserve water by
replacing aging poly-
tube service laterals
2017-2018 Average
Year 8
Tanner
Backwash
Water
Recycling/Reuse
Project
No
Reusing backwash
water at the Tanner
water treatment
plant
2018-2020 Average
Year 167

Amador Water Agency 2015 Urban Water Management Plan System Supplies
June 2016 6-15
Ione Canal
Replacement
(with Piping)
No
Conserve water
installation of a
pipeline in the Ione
Canal to eliminate
seepage
2020 Average
Year 190
CAWP Tanks
Replacement
and
Consolidation
Project
No
Increase
conservation in the
CAWP system by
eliminating leaky
tanks.
2020-2025 Average
Year 3
Amador County
Reuse Project Yes JVID
Develop the
preferred recycled
water alternative
described in Chapter
6.5 of this UWMP
2020-2025 Average
Year 227
Amador
Transmission
Pipeline Phase II
No
Conserve water by
installation of a
small diameter
pipeline from
Amador Canal Lake
Tabeaud to New
York Ranch
Reservoir to
eliminate seepage
2035-2040 Average
Year 1,800
*All values are in Acre-Feet (AF)
NOTES: Planned Implementation Years dependent on funding.
Many of the future supply projects identified in MokeWISE and the MAC IRWMP are in the early planning stages, and thus do not yet have planned implementation dates or a quantifiable increase to supply. These projects are therefore not included in Table 6-8 and instead, are described qualitatively here. Several of these projects are studies, assessments, and analyses of the feasibility of potential supply projects. For example, the following studies will provide the foundation for the potential implementation of future water supply projects in the Agency’s service area:
• The Amador County Long Term Water Needs Study initiated in 2015 will investigate the effects that climate change and a possible Wild and Scenic River designation on the Mokelumne River would have on the Agency’s ability to meet water demands in the future.
• The PG&E Reservoir Storage Recovery Project Study will determine the feasibility of removing sediment from PG&E reservoirs in the Mokelumne watershed to make up to 9,000 AF of storage available.
• The Lower Bear Reservoir Feasibility Update and Preliminary Engineering study will evaluate the feasibility of raising the existing dam at the reservoir to increase water storage, of which up to 10,000 AF could be used by the Agency.
• The Reliability and Replacement Assessment for Dams at Blue and Twin Lakes will evaluate the possibility of replacing these two dams to increase seismic stability and increase carryover storage capacity.
Amador Water Agency 2015 Urban Water Management Plan System Supplies
June 2016 6-16
• The Surface Storage Feasibility Study is a reconnaissance level study investigating Sutter Creek Dam and Reservoir.
• The Shenandoah Valley Water Supply Analysis will evaluate the possibility of using Cosumnes River water at vineyards in the Shenandoah Valley and determine the most appropriate location to store this water.
Two supply projects are proposed in the Lake Camanche Village area. However, the Camanche Area Regional Water Supply Project Phase II (CARWSP II) will not create new water supply, but replace some of the groundwater that is currently used in the area with surface water. This surface water supply will be more reliable and of higher quality than groundwater in the area. Approximately 1,120 AFY of groundwater supply will be replaced by surface water within the next five years. Additionally, the Lake Camanche Village Recycled Water Project will provide up to 314 AFY of recycled water for pasture or public/residential irrigation within the next five years. This project will likely not offset current water demands, but will add to the supply available for irrigation in the area and reduce future supply needs.
MokeWISE proposed a study for a conjunctive use project in the Eastern San Joaquin Groundwater Subbasin to determine the basis for and feasibility of groundwater banking. The Agency may benefit from a project pending the completion of this study through a significant increase in supply, but this is unlikely to occur within the planning horizon of this UWMP. Conjunctive use between groundwater supplies and surface water storage could also be paired with reoperation of surface storage. The Agency may lease storage in PG&E or EBMUD’s existing reservoirs or apply for a new water right to help to improve supply reliability.
In addition to these large-scale, location-specific projects, the Agency will continue to implement its Water Conservation Plan, which includes giving away free water conservation items to customers and performing system water audits along with the other Demand Management Measures outlined in Chapter 9 of this UWMP. The Agency will also undertake a leak detection and master metering project, in which it will reduce losses in its entire distribution system by detecting and repairing leaks and inspecting meters for accuracy. All of these efforts will result in water savings and the potential to leverage the Agency’s existing water supplies.
6.9 Summary of Existing and Planned Sources of Water Table 6-9 and Table 6-10 summarize the Agency’s current and future water supplies.

Amador Water Agency 2015 Urban Water Management Plan System Supplies
June 2016 6-17
Table 6-9: Water Supplies - Actual (DWR Table 6-8)
Water Supply Additional Detail on
Water Supply
2015
Actual
Volume*
Water
Quality
Total Right
or Safe Yield
(optional)*
Groundwater Water from La Mel Heights and Lake
Camanche Village Wells 206
Drinking
Water 1,620
Surface water Mokelumne River Treated Water 3,737 Drinking
Water 16,150
Surface water Mokelumne River Raw Water 2,107 Raw
Water
Recycled Water Water used at Castle Oaks and Mace
Meadow Golf Courses for Irrigation 622
Recycled
Water N/A
Total 6,672 17,770
*All values are in Acre-Feet (AF)
NOTES: The Agency's total water supply from the Mokelumne River is 16,150 AFY; a portion of this
water is treated before delivery and a portion is delivered raw. The raw water reported here is the
amount of water supplied by the Amador Canal directly to users or is lost in transmission before
reaching the Agency's treatment plants. The total water supplied in this table is slightly more than the
total water demands presented in Table 4-1 due to the inclusion of all Non-Revenue water as
determined by the AWWA Water Loss Audit.
The future supplies shown in Table 6-10 are based on several assumptions; La Mel Heights will reach build-out in 2020 and not require any additional water supply and Lake Camanche Village will switch to surface water upon the completion of the second phase CARWSP in 2017. This will lead to a reduction in consumption of groundwater, even though the safe yield of that groundwater will remain unchanged. Recycled water projections are based on the implementation of the City of Plymouth Recycled Water Project before 2020 and the Amador County Reuse Project and the Lake Camanche Village Recycled Water Project between 2020 and 2025. The Agency expects to access its full surface water supplies for the AWS and CAWP systems in the future.

Amador Water Agency 2015 Urban Water Management Plan System Supplies
June 2016 6-18
Table 6-10: Water Supplies - Projected (DWR Table 6-9)
Water
Supply
Additional
Detail on
Water Supply
Projected Water Supply*
Report To the Extent Practicable
2020 2025 2030 2035 2040 (opt)
Reasonably
Available
Volume
Total
Right or
Safe Yield
(optional)
Reasonably
Available
Volume
Total
Right or
Safe Yield
(optional)
Reasonably
Available
Volume
Total
Right or
Safe Yield
(optional)
Reasonably
Available
Volume
Total
Right or
Safe Yield
(optional)
Reasonably
Available
Volume
Total
Right or
Safe Yield
(optional)
Add additional rows as needed
Groundwater 420 420 420 420 420
Surface
water
Mokelumne
River Water 17,200 17,200 17,200 17,200 17,200
Recycled
Water 723 1,264 1,264 1,264 1,264
Total 18,343 0 18,884 0 18,884 0 18,884 0 18,884 0
*All values are in Acre-Feet (AF)
NOTES: The projections for reasonably available groundwater were calculated based on the total safe yield of all wells in the Agency's system
less the amount of surface water expected to replace groundwater upon the implementation of the Camanche Area Water Supply Project. The
projections for reasonably available surface water were calculated based on historic ability to fully access both AWS and CAWP water rights from
the Mokelumne River and includes an expected increase of 1,050 AF to the CAWP water right. The reasonably available recycled water
projections were calculated by combining all current and future recycled water projects described in Tables 6-5 and 6-6.

Amador Water Agency 2015 Urban Water Management Plan System Supplies
June 2016 6-19
6.10 Climate Change Impacts to Supply
6.10.1 Water Supply Climate change is expected to lead to a shift in precipitation patterns so that more winter precipitation falls as rain rather than snow, thus increasing the winter streamflow and decreasing the spring and summer streamflow of the Mokelumne River (RMC, 2013). Overall Sierra Nevada snowpack is also expected to decline by 48-65% (DWR, 2015b), threatening the Agency’s heavily surface water dependent supply. This decline in snowpack, combined with earlier springtime runoff and reduced spring and summer stream flows will likely affect the Agency’s surface water supplies and could lead to an increase in the use of groundwater resources. However, groundwater in the Agency’s service area is limited, unreliable, and exhibits significant supply and quality issues. If groundwater use increased and extreme drought conditions occurred, impacts to groundwater quantity and quality could be expected to be similar to the 1976-1977 drought, in which wells went dry. Because the Agency’s existing water supply sources consist of primarily surface water (96%) and groundwater (4%), its supply portfolio is not diverse, resulting in significant vulnerabilities to climate change. If surface water supplies are reduced in the future, reliance upon the unpredictable yields and quality of groundwater would increase. While the Agency has never failed to meet customer demands during droughts, unpredictable supply reliability in the future emphasizes the need for diversification of water supplies. Projects including increases in storage, recycled water, conjunctive use, and long-term planning proposed through MokeWISE and the MAC IRWMP would help to diversify supply to strengthen resiliency against drought and changing streamflow patterns.
The current reservoir system must leave some space open for flood control, a function that will continue to be important as climate change causes earlier springtime runoff and increased storm intensity. Increasing storage volume in this reservoir system would increase resilience to droughts by increasing capacity to store excess water during wet years. This capacity is currently extremely limited, as the Agency has very little carry-over storage, aside from 1,600 AFY in the Lower Bear Reservoir for the CAWP system. Proposed projects in MokeWISE and the MAC IRWMP would alleviate this issue by increasing storage through dam replacement, sediment removal, or conjunctive use.
6.10.2 Water Quality Water quality is likely to be affected by climate change through extreme increases and decreases in precipitation and increasing air and water temperatures. In surface water, earlier snowmelt and more severe storm events may lead to increased erosion and turbidity, which may exacerbate the Agency’s existing sensitivity to storm-related high turbidity events. Buckhorn Water Treatment Plant was replaced in 2004 in large part due to inability to meet water quality standards after severe storm events. It is still sensitive to high levels of turbidity, as are the Tanner and Ione treatment plants. These plants must sometimes be operated at a reduced capacity following severe storm events, as chemical and backwash use increases to adequately treat highly turbid water. Maintaining adequate water quality may become more challenging as storm events become more frequent and severe.
Conversely, overall decreases in summertime precipitation may lead to higher concentrations of contaminants in water supply sources such as surface and groundwater and increased surface water temperatures (RMC, 2013). The combination of higher water temperatures and decreased low flows in the Mokelumne River may result in poor water quality that will not meet ecosystem demands. Additionally, current water quality issues in Lake Amador due to wastewater discharge into Jackson Creek by the City of Jackson may worsen as seasonal low flows decrease.
While low dissolved oxygen levels and algal blooms have not been issues in local reservoirs, higher water temperatures in still water bodies, such as Camanche Reservoir and Pardee Reservoir, could lead to water quality issues such as these (RMC, 2013). Other threats to water quality include increased surface water contamination due to increased probability of wildfires and sewer system overflows due to flooding. Amador County is a high fire danger area, and the recent Sand and Butte fires demonstrate the degraded
Amador Water Agency 2015 Urban Water Management Plan System Supplies
June 2016 6-20
water quality during major rain event. The decrease in water quality was demonstrated by EBMUD’s water quality monitoring data below the Butte Fire area. If surface water supplies become scarce and reliance on groundwater increases, the Agency would be relying upon a water supply with more unpredictable yields and quality. As groundwater reliance increases, overdraft could occur and quality could be further degraded.
Amador Water Agency 2015 Urban Water Management Plan Water Supply Reliability Assessment
June 2016 7-1
Chapter 7 Water Supply Reliability Assessment
The Agency regularly reviews and evaluates projected system demands versus available supplies in order to ensure sufficient capacity within the sevice area and to evaluate its long-term water supply reliability. This chapter analyzes water supply and reliability under a variety of scenarios.
7.1 Constraints on Water Sources
7.1.1 Water Quality and Availability
Surface Water – AWS & CAWP
The Agency’s water supply for its AWS and CAWP systems is the Mokelumne River, a high quality of source water for most of the year. During storm periods, the water quality becomes somewhat turbid, but for the most part, this has not caused changes in the availability of the water supply to either system as the water can be treated with standard water treatment facilities. The Mokelumne River water supply is sourced from Lake Tabeaud (for the AWS) and Tiger Creek Afterbay or Tiger Creek Regulator Reservoir (for the CAWP). The AWS system receives its supply through a contract with Pacific Gas and Electric Company (PG&E) which is firmed up with reservoirs constructed around 1901 (and, therefore, the AWS has a pre-1914 water right associated with it). The AWS water right dates back to 1850s with the Amador Canal. The CAWP system leases storage in a PG&E reservoir (the Lower Bear River Reservoir).
These reservoirs are located high in the watershed. The reservoirs that firm up the AWS water supply are located at elevations at or above 8,000 feet. PG&E manages and operates these reservoirs and conducts releases in order to meet instream flow requirements. These high elevation reservoirs generally have earthen dams, so PG&E releases water every summer in order to leave outlet valves open during the winter to avoid structural damage. Even during the extreme drought of 1976 through 1977 and the prolonged drought of 1988 to 1994, spring runoff each year filled PG&E’s reservoirs to near capacity. During the recent drought from 2013 to 2015, the reservoirs still captured enough water in excess of the AWS’s water allocation. During critically dry years, the AWS and CAWP system water demands can be met by storage facilities. The timing of the runoff is currently about the same for wet or dry years, with the only difference being the magnitude of the runoff and the amount of reservoir spill.
PG&E is able to provide the full annual water contract entitlements to the Agency for the AWS due to the priority of the pre-1914 water rights and the amount of water stored on behalf of the Agency. Therefore, the supply available for normal, single-dry or multiple-dry year scenarios remains the same for surface water diversions for AWS. The water rights for the CAWP system are more vulnerable to shortages, as the water right is less senior than others in the region. Thus, it is possible that the Agency could receive cutbacks to its full allocation for its 1927 priority CAWP water right in severely dry years. Pursuant to an agreement with PG&E, the Agency has the right to annually store 1,600 AF in Lower Bear River Reservoir with an option (which has been exercised) to increase the storage to 3,000 AF. During the recent drought 2013-2015, the CAWP water right permit was curtailed and storage in Lower Bear River Reservoir was utilized to meet demands. The Agency’s ability to meet water demands is unlikely to be affected during multiple dry years given thepre-1914 water right for the AWS system and storage associated with the CAWP system.
Groundwater – Lake Camanche Village and La Mel Heights
The Agency’s groundwater supply and its reliability is discussed in Section 6.2 Groundwater. Groundwater use in the La Mel Heights area is considered reliable for normal, dry, and multiple-dry years due to the operation of two wells in parallel, both of which are capable of meeting peak day demands on an individual basis, providing redundancy. The groundwater from the La Mel Heights area wells are of adequate quality and is not considered subject to changes in supply due to water quality concerns. During the extreme drought of 1976 through 1977, the single well at the La Mel Heights met water demands with no reports of insufficiency.

Amador Water Agency 2015 Urban Water Management Plan Water Supply Reliability Assessment
June 2016 7-2
The groundwater supply in the Lake Camanche Village area has experienced quality and quantity issues in the past. Two of the six wells in the area have been closed due to water quality concerns. A more detailed discussion on water quality of these wells is included in Section 6.2 Groundwater. While there is not a current state of overdraft, the Cosumnes Groundwater Subbasin is a medium priority basin under the CASGEM Groundwater Basin Prioritization. In response to these reliability issues, the Agency plans to supplement the Lake Camanche Village groundwater source with a surface water source by 2017 with the implementation of the Camanche Area Regional Water Supply Project, Phase 2.
Recycled Water
As described in Section 6.5, Wastewater and Recycled Water, the Agency does not currently produce recycled water from wastewater collected within its wastewater service area. Currently, the only recycled water produced and put to beneficial use is for irrigation of the Castle Oaks Golf Course. The Castle Oaks Water Reclamation Plant treats effluent to Title 22 standards for use at the Golf Course. By meeting Title 22 standards, water quality parameters are met to ensure the recycled water is suitable for direct beneficial use. The Agency does not produce recycled water at its wastewater treatment plants due to economic and technical feasibility issues. However, there are plans to expand recycled water use in the Agency’s service area in the future. Recycled water is typically considered a drought-proof supply that is highly reliable even during dry years. Implementing recycled water projects would assist in climate change adaptation and contribute to diversification of the Agency’s water supply portfolio.
7.1.2 Climate Change Impacts on Supply See Section 6.10.1 and Section 6.10.2 of this UWMP for a discussion related to potential climate change impacts on the Agency’s water supplies.
7.2 Reliabil ity by Type of Year The Agency’s supply reliability for normal years, single-dry years, and multiple-dry years is shown in Table 7-1. 2010 was selected as the representative year for an average year, as it occurred after the decreases in demand due to the economic recession of 2008 and 2009 and before the drought from 2013 through 2016. An analysis of reservoir storage data from DWR’s California Data Exchange Center (CDEC) for the Mokelumne River Watershed, including data for Camanche, Pardee, Lower Bear, and Salt Springs Reservoirs, was performed to determine the driest single year and consecutive three year periods. The analysis showed that 1977 was the single driest year on record, and the period from 1988 to 1990 was the driest three-year period on record; therefore, these years are used as the base years to determine the amount of water available during single-dry and multiple-dry year scenarios. Because the Agency’s AWS full water supply entitlement has never been curtailed and the adequacy of the CAWP storage, 100% of supply would be available for each of these years, as shown in Table 7-1.
Table 7-1: Basis of Water Year Data (DWR Table 7-1)
Table 7-1 Retail: Basis of Water Year Data
Year Type Base Year
Available Supplies if
Year Type Repeats
% of Average Supply
Average Year 2010 100%
Single-Dry Year 1977 100%
Multiple-Dry Years 1st Year 1988 100%
Multiple-Dry Years 2nd Year 1989 100%
Multiple-Dry Years 3rd Year 1990 100%

Amador Water Agency 2015 Urban Water Management Plan Water Supply Reliability Assessment
June 2016 7-3
7.3 Supply and Demand Assessment
7.3.1 Normal Year Supply projections for a normal year are described in Section 6.9, Summary of Existing and Planned Sources of Water. Supply totals include current and planned surface water rights, safe yields for groundwater sources, and recycled water supplies. Note that supply projections for both normal and dry years do not include mechanical failures or catastrophic events. Demand projections for a normal year are detailed in Section 4.1.2, Projected Water Demands. These projections consider average demand per connection and projected population growth for the Agency. As shown in Table 7-2, the Agency expects to have adequate supplies to fully meet projected demands for future normal years.
Table 7-2: Normal Year Supply and Demand Comparison (DWR Table 7-2)
2020 2025 2030 2035 2040
Supply totals* (from
DWR Table 6-9) 18,343 18,884 18,884 18,884 18,884
Demand totals* (from
DWR Table 4-3) 10,601 11,699 12,257 12,708 13,159
Difference* 7,742 7,185 6,627 6,176 5,725
*All values are in Acre-Feet (AF)
7.3.2 Single -Dry Year Supply projections for a single-dry year are the same as for a normal year as the Agency has not had a reduction in available supplies, even in the driest years, and does not expect to have decreased supply volumes in a single-dry year. Demand projections are also the same as a normal year, as generally, Agency and State-mandated cutbacks are not issued for a single-dry year. As shown in Table 7-3, the Agency expects to have adequate supplies to fully meet demand for future single-dry years.
Table 7-3: Single -Dry Year Supply and Demand Comparison (DWR Table 7-3)
2020 2025 2030 2035 2040
Supply totals* 18,343 18,884 18,884 18,884 18,884
Demand totals* 10,601 11,699 12,257 12,708 13,159
Difference* 7,742 7,185 6,627 6,176 5,725
*All values are in Acre-Feet (AF)
7.3.3 Multiple -Dry Years Supply projections for all multiple-dry year scenarios are the same as for a normal year as the Agency has not experienced a reduction in available supplies, even in multiple-dry year periods. Demand projections are also the same as a normal year for the first two years of a drought. However, demands are expected to decrease by 25% in the third year of the drought. This pattern mimics the recent 2013 to 2015 drought, where mandatory restrictions were not enforced until the third year of the drought, in which the Agency declared a Water Warning and required 25% water use reductions for its customers in response to state-

Amador Water Agency 2015 Urban Water Management Plan Water Supply Reliability Assessment
June 2016 7-4
wide cutback mandates. As shown in Table 7-4, the Agency expects to have adequate supplies to fully meet demand for future multiple-dry years.
Table 7-4: Multiple -Dry Years Supply and Demand Comparison (DWR Table 7-4)
2020 2025 2030 2035 2040
First year
Supply
totals* 18,343 18,884 18,884 18,884 18,884
Demand
totals* 10,601 11,699 12,257 12,708 13,159
Difference* 7,742 7,185 6,627 6,176 5,725
Second
year
Supply
totals* 18,343 18,884 18,884 18,884 18,884
Demand
totals* 10,601 11,699 12,257 12,708 13,159
Difference* 7,742 7,185 6,627 6,176 5,725
Third year
Supply
totals* 18,343 18,884 18,884 18,884 18,884
Demand
totals* 7,951 8,774 9,193 9,531 9,869
Difference* 10,392 10,110 9,691 9,353 9,015
*All values are in Acre-Feet (AF)
NOTES: First two years of drought have normal supply and demand, while the third year of drought
has 25% reduction in demand (reflecting cutbacks that occurred during the recent 2013-2015
drought)
7.4 Regional Supply Reliability Current and planned supply projects to reduce water loss, increase recycled water use, and to improve supply reliability are described in Section 6.8, Future Water Projects. The Agency has participated in several regional planning efforts, including the 2015 MAC IRWMP Update and the MokeWISE study, which are also described in Chapter 6. The Agency is committed to improving regional supply reliability through these supply projects, regional plans, and coordination with other agencies.
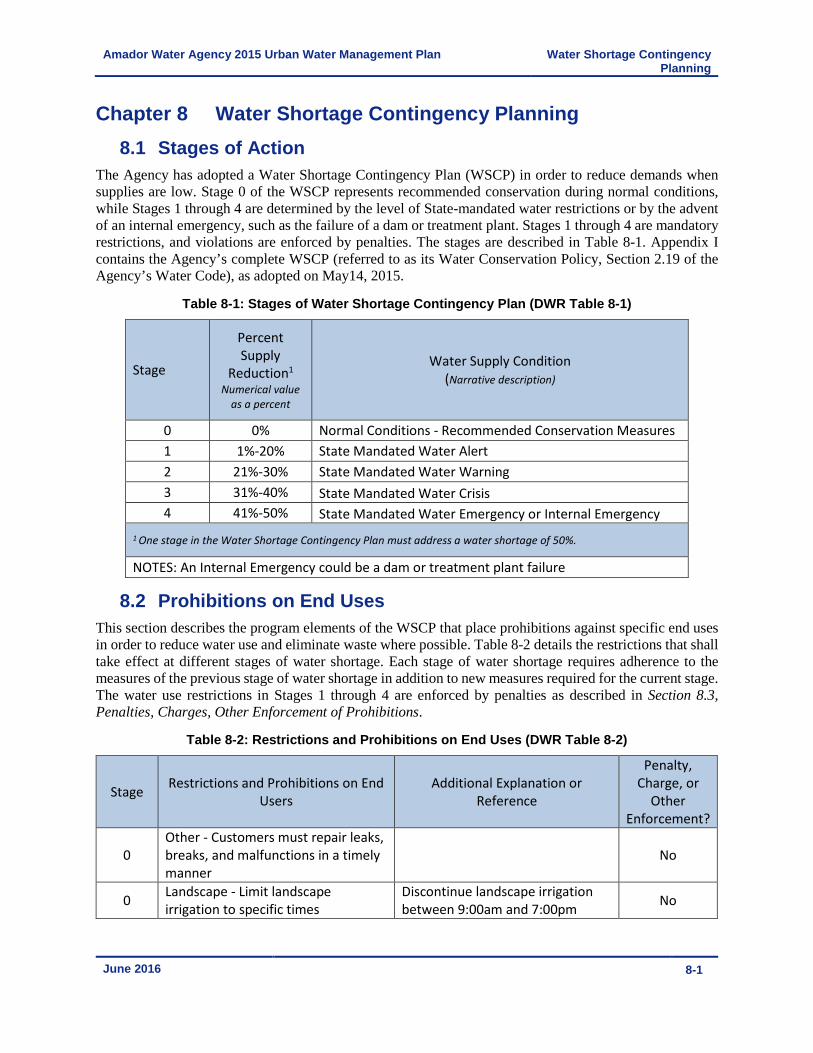
Amador Water Agency 2015 Urban Water Management Plan Water Shortage Contingency Planning
June 2016 8-1
Chapter 8 Water Shortage Contingency Planning
8.1 Stages of Action The Agency has adopted a Water Shortage Contingency Plan (WSCP) in order to reduce demands when supplies are low. Stage 0 of the WSCP represents recommended conservation during normal conditions, while Stages 1 through 4 are determined by the level of State-mandated water restrictions or by the advent of an internal emergency, such as the failure of a dam or treatment plant. Stages 1 through 4 are mandatory restrictions, and violations are enforced by penalties. The stages are described in Table 8-1. Appendix I contains the Agency’s complete WSCP (referred to as its Water Conservation Policy, Section 2.19 of the Agency’s Water Code), as adopted on May14, 2015.
Table 8-1: Stages of Water Shortage Contingency Plan (DWR Table 8-1)
Stage
Percent
Supply
Reduction1
Numerical value
as a percent
Water Supply Condition
(Narrative description)
0 0% Normal Conditions - Recommended Conservation Measures
1 1%-20% State Mandated Water Alert
2 21%-30% State Mandated Water Warning
3 31%-40% State Mandated Water Crisis
4 41%-50% State Mandated Water Emergency or Internal Emergency
1 One stage in the Water Shortage Contingency Plan must address a water shortage of 50%.
NOTES: An Internal Emergency could be a dam or treatment plant failure
8.2 Prohibitions on End Uses This section describes the program elements of the WSCP that place prohibitions against specific end uses in order to reduce water use and eliminate waste where possible. Table 8-2 details the restrictions that shall take effect at different stages of water shortage. Each stage of water shortage requires adherence to the measures of the previous stage of water shortage in addition to new measures required for the current stage. The water use restrictions in Stages 1 through 4 are enforced by penalties as described in Section 8.3, Penalties, Charges, Other Enforcement of Prohibitions.
Table 8-2: Restrictions and Prohibitions on End Uses (DWR Table 8-2)
Stage Restrictions and Prohibitions on End
Users
Additional Explanation or
Reference
Penalty,
Charge, or
Other
Enforcement?
0
Other - Customers must repair leaks,
breaks, and malfunctions in a timely
manner
No
0 Landscape - Limit landscape
irrigation to specific times
Discontinue landscape irrigation
between 9:00am and 7:00pm No
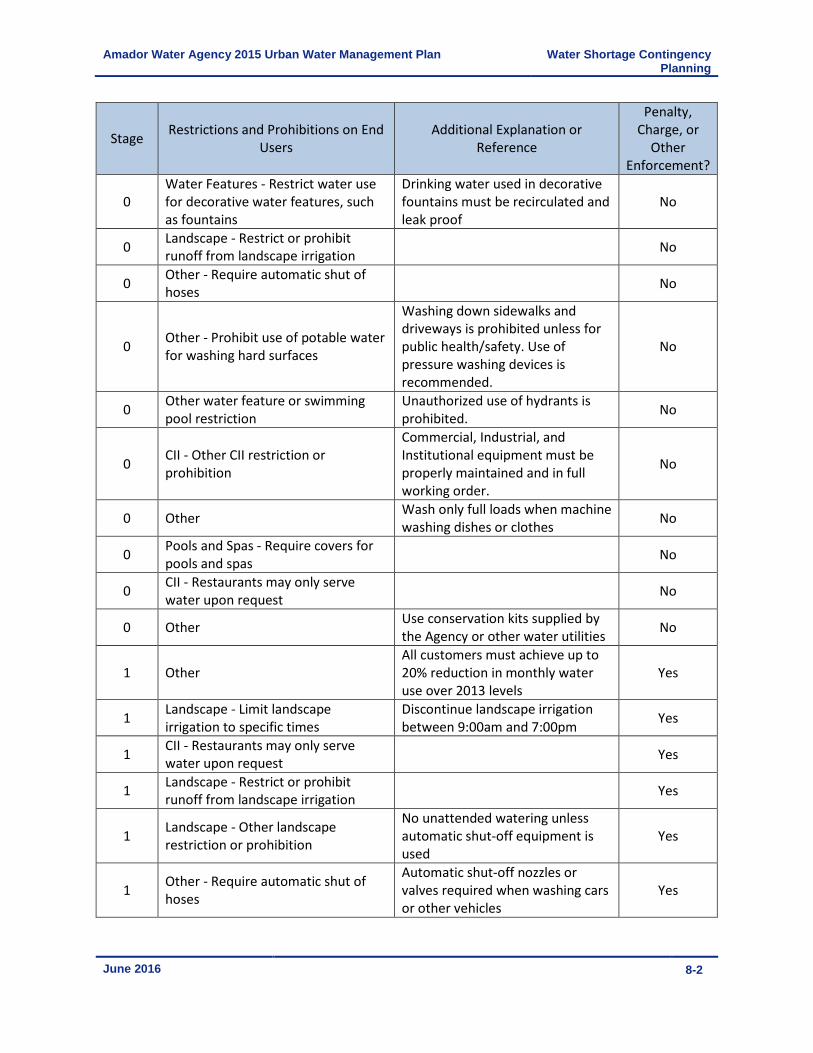
Amador Water Agency 2015 Urban Water Management Plan Water Shortage Contingency Planning
June 2016 8-2
Stage Restrictions and Prohibitions on End
Users
Additional Explanation or
Reference
Penalty,
Charge, or
Other
Enforcement?
0
Water Features - Restrict water use
for decorative water features, such
as fountains
Drinking water used in decorative
fountains must be recirculated and
leak proof
No
0 Landscape - Restrict or prohibit
runoff from landscape irrigation No
0 Other - Require automatic shut of
hoses No
0 Other - Prohibit use of potable water
for washing hard surfaces
Washing down sidewalks and
driveways is prohibited unless for
public health/safety. Use of
pressure washing devices is
recommended.
No
0 Other water feature or swimming
pool restriction
Unauthorized use of hydrants is
prohibited. No
0 CII - Other CII restriction or
prohibition
Commercial, Industrial, and
Institutional equipment must be
properly maintained and in full
working order.
No
0 Other Wash only full loads when machine
washing dishes or clothes No
0 Pools and Spas - Require covers for
pools and spas No
0 CII - Restaurants may only serve
water upon request No
0 Other Use conservation kits supplied by
the Agency or other water utilities No
1 Other
All customers must achieve up to
20% reduction in monthly water
use over 2013 levels
Yes
1 Landscape - Limit landscape
irrigation to specific times
Discontinue landscape irrigation
between 9:00am and 7:00pm Yes
1 CII - Restaurants may only serve
water upon request Yes
1 Landscape - Restrict or prohibit
runoff from landscape irrigation Yes
1 Landscape - Other landscape
restriction or prohibition
No unattended watering unless
automatic shut-off equipment is
used
Yes
1 Other - Require automatic shut of
hoses
Automatic shut-off nozzles or
valves required when washing cars
or other vehicles
Yes

Amador Water Agency 2015 Urban Water Management Plan Water Shortage Con tingency Planning
June 2016 8-3
Stage Restrictions and Prohibitions on End
Users
Additional Explanation or
Reference
Penalty,
Charge, or
Other
Enforcement?
1 Other - Prohibit use of potable water
for washing hard surfaces
Washing sidewalks, driveways,
patios, parking lots, and tennis
courts with water is prohibited
Yes
1 Other water feature or swimming
pool restriction
Emptying and refilling of swimming
pools and hot tubs in prohibited Yes
1
Water Features - Restrict water use
for decorative water features, such
as fountains
Drinking water used in decorative
fountains must be recirculated Yes
1
Water Features - Restrict water use
for decorative water features, such
as fountains
Drinking water may not be used in
scenic ponds and lakes except for
the minimum amount needed to
support existing aquatic life
Yes
1 Other Use conservation kits supplied by
the Agency or other water utilities Yes
1 Landscape - Other landscape
restriction or prohibition
No irrigation of new landscaping
for new construction Yes
1 Landscape - Other landscape
restriction or prohibition
No irrigation during and up to 48
hours after measurable rainfall Yes
1
Other - Customers must repair leaks,
breaks, and malfunctions in a timely
manner
Fix leaks or faulty sprinklers within
7 days Yes
1 Landscape - Limit landscape
irrigation to specific days
Water only three days per week
for turf watering when using
potable water
Yes
1 Landscape - Prohibit certain types of
landscape irrigation
Plant containers, trees, shrubs, and
vegetables may be watered more
than three days a week if using
drip irrigation or watering by hand
with an automatic shut-off device
Yes
2 Other
All customers must achieve up to
30% reduction in monthly water
use over 2013 levels
Yes
2 Other
Applications for new service
connections will be granted only
on the condition that the water
will be used for interior purposes
only during the drought
emergency
Yes
2
Other - Customers must repair leaks,
breaks, and malfunctions in a timely
manner
Fix leaks or faulty sprinklers within
5 days Yes
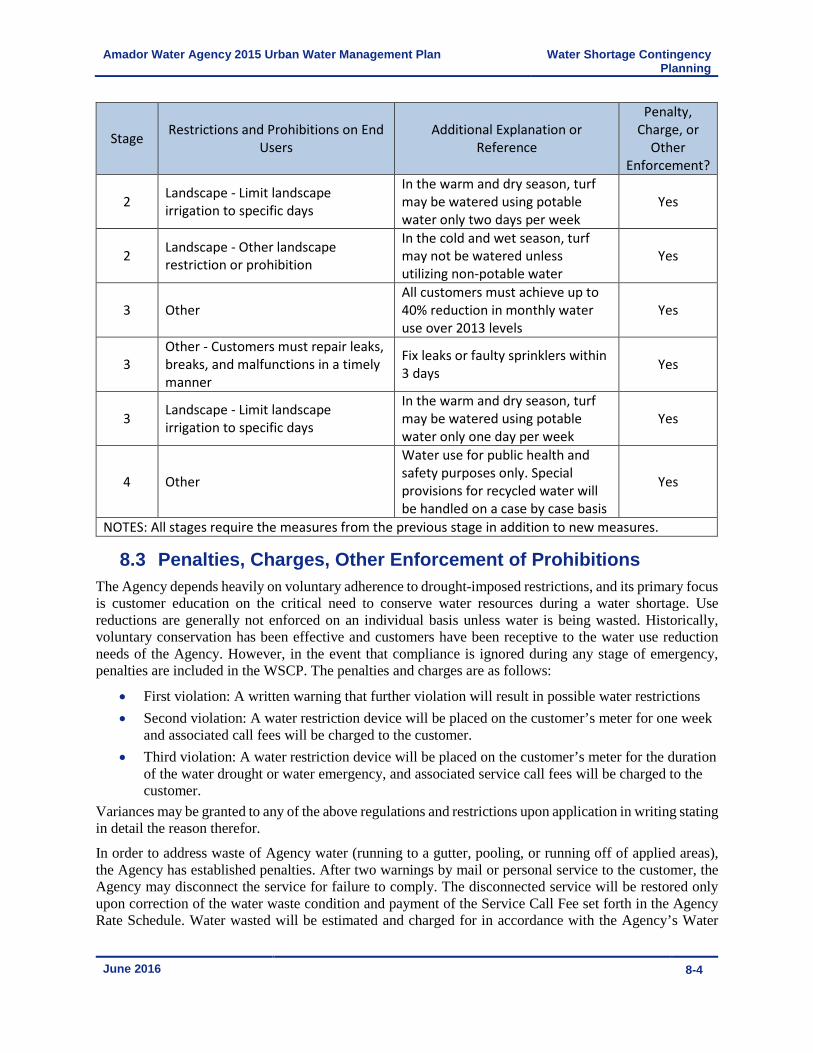
Amador Water Agency 2015 Urban Water Management Plan Water Shortage Contingency Planning
June 2016 8-4
Stage Restrictions and Prohibitions on End
Users
Additional Explanation or
Reference
Penalty,
Charge, or
Other
Enforcement?
2 Landscape - Limit landscape
irrigation to specific days
In the warm and dry season, turf
may be watered using potable
water only two days per week
Yes
2 Landscape - Other landscape
restriction or prohibition
In the cold and wet season, turf
may not be watered unless
utilizing non-potable water
Yes
3 Other
All customers must achieve up to
40% reduction in monthly water
use over 2013 levels
Yes
3
Other - Customers must repair leaks,
breaks, and malfunctions in a timely
manner
Fix leaks or faulty sprinklers within
3 days Yes
3 Landscape - Limit landscape
irrigation to specific days
In the warm and dry season, turf
may be watered using potable
water only one day per week
Yes
4 Other
Water use for public health and
safety purposes only. Special
provisions for recycled water will
be handled on a case by case basis
Yes
NOTES: All stages require the measures from the previous stage in addition to new measures.
8.3 Penalties, Charges, Other Enforcement of Prohibitions The Agency depends heavily on voluntary adherence to drought-imposed restrictions, and its primary focus is customer education on the critical need to conserve water resources during a water shortage. Use reductions are generally not enforced on an individual basis unless water is being wasted. Historically, voluntary conservation has been effective and customers have been receptive to the water use reduction needs of the Agency. However, in the event that compliance is ignored during any stage of emergency, penalties are included in the WSCP. The penalties and charges are as follows:
• First violation: A written warning that further violation will result in possible water restrictions
• Second violation: A water restriction device will be placed on the customer’s meter for one week and associated call fees will be charged to the customer.
• Third violation: A water restriction device will be placed on the customer’s meter for the duration of the water drought or water emergency, and associated service call fees will be charged to the customer.
Variances may be granted to any of the above regulations and restrictions upon application in writing stating in detail the reason therefor.
In order to address waste of Agency water (running to a gutter, pooling, or running off of applied areas), the Agency has established penalties. After two warnings by mail or personal service to the customer, the Agency may disconnect the service for failure to comply. The disconnected service will be restored only upon correction of the water waste condition and payment of the Service Call Fee set forth in the Agency Rate Schedule. Water wasted will be estimated and charged for in accordance with the Agency’s Water

Amador Water Agency 2015 Urban Water Management Plan Water Shortage Contingency Planning
June 2016 8-5
Service Rates and Charges. Currently, the Agency Policy Committee is drafting an ordinance to levy monetary fines for water waste violations.
8.4 Consumption Reduction Methods Consumption reduction methods are actions that are taken solely by the Agency to reduce water use during a period of shortage. In addition to the Agency’s ongoing conservation efforts (i.e., demand management measures) detailed in Chapter 9, the Agency’s WSCP specifies additional consumption reduction methods during times of shortage, such as increased giveaways of low-flow fixtures including water-conserving showerheads, faucet aerators, and toilet conservation kits. Additionally, Resolution No. 2015-19 (included in Appendix J) was passed on July 21, 2015 by the Agency to implement a drought rate structure that introduces a Water Shortage Rate Surcharge when any stage of water shortage is declared. Details about the shortage rate structure are included in Section 8.6. Table 8-3 shows the consumption reduction actions that occur under normal conditions and various stages of water shortage.
Table 8-3: Stages of Water Shortage Contingency Plan - Consumption Reduction Methods (DWR Table 8-3)
Stage
Consumption Reduction Methods by
Water Supplier
Additional Explanation or Reference
All Stages Provide Rebates on Plumbing Fixtures
and Devices
The use of conservation kits provided by the
Agency is suggested for all levels of water
shortage
All Stages Expand Public Information Campaign The Agency visits public events and schools,
hang banners, and maintain a public website
All Stages Improve Customer Billing Information such as tips on how to conserve
water is included on customer's water bills
All Stages Offer Water Use Surveys The Agency will perform surveys upon
requests and offer DIY water use survey kits
All Stages Reduce System Water Loss
The Agency completes regular water audits,
has recently piped/lined earthen canals, lined
redwood tanks, replaced hundreds of service
lines in high-leakage areas, and has
undertaken a leak detection and repair
program
All Stages Increase Water Waste Patrols The Agency's website has a page to
anonymously report water waste
1-4 Implement or Modify Drought Rate
Structure or Surcharge
Escalating Water Shortage Surcharges are
implemented for each stage of a water
shortage
NOTES: These consumption reduction methods are offered and apply to both retail and wholesale
customers.
Amador Water Agency 2015 Urban Water Management Plan Water Shortage Contingency Planning
June 2016 8-6
8.5 Determining Water Shortage Reductions Water use during normal, wet, and dry periods is monitored by several means. Agency customers are fully metered and meters are installed on all new connections to an Agency water system. All customers receiving water service are metered and billed on a volumetric basis. Records are kept of both water production and consumption (meter readings). These records are maintained and analyzed to identify losses in the system and to establish baselines in case of a declaration of emergency. In case of an emergency, achievement of reductions and the effectiveness of implementing each stage of the WSCP is determined by the Agency through comparison of the customer’s prior year’s seasonal usage with the seasonal usage during the year of the drought or other emergency. If the drought is severe enough, the Board can order monitoring of water production and uses on a weekly or even daily basis. The high percentage of metered customers within the service area facilitates this effort.
8.6 Revenue and Expenditure Impacts During water shortages, it is not uncommon for an agency’s revenue to decrease as a result of reduced water sales from conservation measures and implementation of the WSCP. Expenditures can also increase due to increased public outreach, water conservation giveaways, and rate studies needed during times of drought. In 2015, the Agency found that the mandatory reductions in water use due to a multi-year drought led to a deficit between revenues and expenses. In response to the April 20, 2015 Fourth District Court of Appeal decision in the Capistrano Tax Payers Association v. City of San Juan Capistrano, the Agency eliminated its tiered rate structure in July 2015 in favor of a uniform water rate applied on a volumetric basis. The Agency’s inclusion of the water shortage surcharge helps to ensure that fees are charged at the rate required to meet the Agency’s costs.
8.6.1 Drought Surcharge As has been experienced recently, reduced water sales causes an unsustainable financial situation; therefore, the Agency adopted a resolution on July 21, 2015 to implement water shortage surcharges. The amount of the water shortage surcharge, as detailed in the resolution, is determined by the stage of water shortage declared by the Agency and is projected to resolve revenue deficits and increased expenditures during water shortages. The surcharge level for each stage of shortage is detailed below:
• Stage 1 = 18% surcharge on all usage rates
• Stage 2 = 34% surcharge on all usage rates
• Stage 3 = 54% surcharge on all usage rates
• Stage 4 = 75% surcharge on all usage rates
The implementation of this surcharge structure does not affect the monthly service charge to customers and is temporary, as it will be terminated at the end of a declared shortage.
8.6.2 Use of Financial Reserves In addition to implementing the water shortage surcharge, the Agency has cut costs wherever possible. The Agency can use a portion of available financial reserves, when available, to help bridge the deficit and can reduce funding for planned capital projects in the most severe shortage conditions.
8.7 Resolution or Ordinance The most recent update to the Agency’s WSCP, as adopted through Resolution 2015-07, is included in the Agency’s Water Code (Appendix I) Catastrophic Supply Interruption
In addition to drought, the Agency has planned for other catastrophes that could impact water supply and quality. For example, in case of a short-term regional power outage, the Agency has purchased or has access to emergency generators to pump and treat water. The Buckhorn, Tanner, and Ione Water Treatment Plants

Amador Water Agency 2015 Urban Water Management Plan Water Shortage Contingency Planning
June 2016 8-7
have been assessed for possible water supply emergency scenarios and action plans have been developed. Table 8-4 summarizes the catastrophes for which the Agency has prepared to address in some or all of their facilities. Appendix K contains the Agency’s Emergency Response Plan for All Water Systems.
Due to the Agency’s geographic location and the area’s seismic classification, service interruption due to seismic activity is considered minimal and is therefore not extensively addressed in the Emergency Handbook. A seismic event could lead to a power outage, which is addressed within the Emergency Handbook.
Table 8-4: Preparat ion Actions for a Catastrophe (Optional)
Possible Catastrophe Check if
Discussed
Chlorine/Hazardous Materials Release X
Water Outages due to Extended Power Outages X
Untreatable/Contaminated Water X
MCL Failure X
Loss of System Pressure X
Plant/Well Failure X
Acts of Sabotage/Bio Terrorism X
Earthquakes X
Major Fire Emergencies X
Localized Flooding X
8.8 Minimum Supply Next Three Years Table 8-5 shows the minimum water supply available over the next three years: 2016, 2017, and 2018. This assumes that the hydrology will be the same as the hydrology during the multiple-dry year period reported in Chapter 7 and that no new water rights or recycled water capacity will be added to the system. The Agency’s current surface water supply is expected to be available through storage or diversions and its groundwater safe yield undiminished, even if the next three years repeat the driest hydrology on record. See Section 7.3 Supply and Demand Assessment for a detailed explanation.
Table 8-5: Minimum Supply Next Three Years (DWR Table 8-4)
2016* 2017* 2018*
Available Water
Supply 18,392 18,392 18,392
*All values are in Acre-Feet (AF)
NOTES: Minimum supply consists of the Agency's current
surface water right (16,150 AFY), groundwater safe yield
(1,620 AFY), and current recycled water capacity (622 AFY).
Amador Water Agency 2015 Urban Water Management Plan Demand Management Measures
June 2016 9-1
Chapter 9 Demand Management Measures
The Agency is committed to implementing water conservation programs that will promote efficient use of water supplies. This section discusses existing and future water conservation measures, referred to interchangeably as Best Management Practices (BMPs) or Demand Management Measures (DMMs), being implemented by the Agency or planned for future implementation.
9.1 Conservation Measure Organization In 1991, the California Urban Water Conservation Council (CUWCC) adopted its Memorandum of Understanding Regarding Urban Water Conservation in California (MOU), outlining 14 conservation programs, called BMPs, to expedite implementation of reasonable water conservation measures in urban areas. Assembly Bill 1420 (AB1420) amended the Urban Water Management Planning Act to require, effective January 1, 2009, that urban water suppliers awarded grants or loans by the State be conditioned on the implementation of the 14 DMMs to meet CUWCC goals. However, after CUWCC MOU and California Water Code (CWC) modifications, the 14 DMMs were reorganized. In December 2008, the CUWCC MOU was amended such that the BMPs were restructured into new two general BMP categories: Programmatic and Foundational. Separately, the CWC section describing the original 14 DMMs was modified in 2014 to describe six, more general DMM categories. This resulted in three different organizations of the DMMs/BMPs.
1. 14 BMPs described in the 1991 CUWCC MOU and AB1420.
2. Foundational and Programmatic BMPs described in the revised CUWCC’s 2008 MOU.
3. Six DMMs described in the 2014 CWC amendment and 2015 UWMP Guidebook.
The Agency’s 2010 UWMP and 2010 Water Conservation Plan (WCP) reference the original 14 DMMs. This allowed for streamlined tracking of DMMs for the purposes of gaining funding eligibility through AB1420 and the associated completion of AB1420 self-certification tables. However, as of July 1, 2016, funding eligibility will be based on meeting the 2015 interim target, rather than through completion of the AB1420 self-certification tables. Therefore, because the Agency is not a CUWCC MOU signatory and in order to be consistent with the CWC and 2015 UWMP Guidebook, this chapter uses the modified organization and describes the six DMMs as summarized in the 2015 Guidebook.
Table 9-1 summarizes how the original 14 DMMs fit into the six new DMM categories.

Amador Water Agency 2015 Urban Water Management Plan Demand Management Measures
June 2016 9-2
Table 9-1: 14 DMMs vs. 2015 Guidebook DMMs (Optional)
New DMM Original 14 DMMs
Water Waste Prevention Ordinance DMM 13: Water Waste Prohibition
Metering DMM 4: Metering with Commodity Rates
Conservation Pricing DMM 11: Retail Conservation Pricing
Public Education and Outreach
DMM 1: Water Surveys for Residential Customers
DMM 2: Residential Plumbing Retrofit
DMM 5: Large Landscape Conservation Programs
and Incentives
DMM 6: High-Efficiency Clothes Washers
DMM 9: CII
DMM 7: Public Education Programs
DMM 8: School Education Programs
DMM 10: Wholesale Agency Programs
DMM 14: WaterSense Specification Toilets
Programs to Assess and Manage Distribution
System Real Loss
DMM 3: System Water Audits, Leak Detection
and Repair
Water Conservation Program Coordination and
Staffing Report DMM 12: Water Conservation Coordinator
Other DMMs None
9.2 DMM Categories This section describes how each of the six DMM categories outlined in the 2015 UWMP Guidebook have been implemented over the past five years and how the Agency is planning to implement them to achieve its 2020 water use targets. The Agency has offered the same DMMs and services to its wholesale customers as it does to its retail customers since 1980.
9.2.1 Water Waste Prevention Ordinances Implementation over the Past Five Years
By definition, a water waste prevention ordinance is in place at all times within the Agency’s service area, regardless of whether there is a water shortage, and this ordinance prohibits the waste of water. While the Agency has not adopted a formal water waste ordinance, it has implemented this DMM through its adoption of a Water Shortage Contingency Plan (referred to as its Water Conservation Policy in Section 2.19 of the Amador Water Agency Water Code), which prohibits water waste. The Agency’s Water Conservation Policy is included in Appendix I. The Agency first adopted a water shortage plan in 1985 and has implemented it continuously since then. The Agency has both voluntary and mandatory water conservation policies in its water code. Under Normal Conditions, the Water Conservation Policy recommends various conservation measures, and includes the prohibition of:
• Run-off or street flooding from outdoor irrigation.
• Washing down sidewalks and driveways, unless for public health/safety.
• Unauthorized use of hydrants.
• Restaurants serving water only upon request.

Amador Water Agency 2015 Urban Water Management Plan Demand Management Measures
June 2016 9-3
A complete list of all conservation measures can be found in Appendix I.
The Agency tracks water waste concerns communicated through phone calls, emails, and other methods, including an anonymous form on its website, as shown to the left.
If the Agency’s Board of Directors deems it necessary, it could implement enforcement measures to violators, including oral and/or written notices and fines to repeat violators. Currently, the Agency Policy Committee is drafting an ordinance to levy monetary fines.
Planned Implementation to Achieve Water Use Targets
The Agency will continue its ongoing efforts under this DMM, and will continue to enforce provisions of the Amador Water Code Ordinance including Section 1.15 Waste of Water, Sections 2.19 & 2.2 Voluntary & Mandatory Water Conservation, and Section 2.34 (e) Discontinuance of Service for Unauthorized Use or Waste of Water.
9.2.2 Metering Implementation over the Past Five Years
As required by CWC 527, urban water suppliers must install water meters on all municipal and industrial service connections located within its service area before January 1, 2015. Over the last five years, the Agency fully metered its customers. Meters are installed with every new connection made to an Agency water system, whether treated or untreated, at the time that the service connection is installed. The Agency has
historically converted services from flat rate to metered service upon transfer of ownership. As of June 2014, 98.7% of its customers received metered service and were billed on a volumetric basis. In July 2015, the Water Agency Board adopted Resolution 2015-19 which, among other rate related items, converted all flat rate water schedules to metered rates which utilize a volumetric rate structure.
Planned Implementation to Achieve Water Use Targets
The Agency will continue to meter all new connections and charge customers volumetrically.
9.2.3 Conservation Pricing Implementation over the Past Five Years
The Agency’s first conservation pricing rates were adopted in 1980. Since then, the rates have been adjusted and amended several times. Most recently in July 2015, in response to the April 20, 2015 Fourth District Court of Appeal decision in the Capistrano Tax Payers Association v. City of San Juan Capistrano, the Agency eliminated its tiered rate structure in favor of a uniform water rate applied on a volumetric basis. At the same time, as described in Section 8.6, a water shortage surcharge rate was also adopted. The surcharge is meant to be temporary and in effect only during dry conditions until normal water supply conditions return. It is used to compensate for reduced Agency revenue during the State-required water
Figure 9-1: Anonymous Water Waste Report Form on the Agency's Website

Amador Water Agency 2015 Urban Water Management Plan Demand Management Measures
June 2016 9-4
conservation efforts or other local water shortage emergencies by charging customers a specific volumetric rate increase based on certain percentage increases that correspond to the needed conservation in accordance with the Water Shortage Plan. Customers that comply with the required water conservation level will experience little to no increase in their monthly water bill while those that do not conserve water will experience a corresponding increase in their bill. The elimination of tiered rates and the addition of the drought surcharge were evaluated and are summarized in more detail in the Agency’s FY15-16 Water Rate Update and Water Shortage Financial Strategy Report (The Reed Group, Inc., 2015), included in Appendix M. The drought surcharge for each stage of the Agency’s Water Conservation Plan is provided in Table 9-2.
Table 9-2: Drought Surcharge Rates for Every Water Conservation Stage (Optional)
Normal
Supply
Stage 1
Water
Alert
Stage 2
Water
Warning
Stage 3
Water
Crisis
Stage 4
Water
Emergency
Water Shortage Rate Surchargea None 18% 34% 54% 75%
Water Usage Rates, with Surcharges Applied ($/CCF)b
General Service Customersc $2.30 $2.71 $3.08 $3.54 $4.03
Mule Creek State Prison $1.69 $1.99 $2.26 $2.60 $2.96
Wholesale Agencies $1.27 $1.50 $1.70 $1.96 $2.22
Untreated Water $0.59 $0.70 $0.79 $0.91 $1.03
Monthly Service Chargesd
All Meter Sizes Varies No Change to Service Charges
Monthly Debt Service Chargesd
All Meter Sizes Varies No Change to Debt Service Charges
a. Water shortage rate surcharges are temporary incremental increases in normal water usage
rates applied during water shortage conditions declared by the Board of Directors.
b. This exhibit shows water shortage rate surcharges applied to FY 15-16 water rates, for
illustrative purposes. The percentages shown would be applied to any then-current water
rates when water shortage conditions are declared by the Board of Directors.
c. General service customers include single family, commercial, and industrialtreated water
customers.
d. No changes to the fixed monthly service charges or debt service charges would occur as a
result of the water shortage rate surcharges.
Planned Implementation to Achieve Water Use Targets
The Agency will continue to charge its customers volumetrically using a uniform pricing structure and add on the drought surcharge when necessary.
9.2.4 Public Education and Outreach The Public Education and Outreach DMM category includes:
• Information booths at public events;
• School education programs;
• Communicating water use via water bills;
• Newsletters;
• Websites and newspaper articles;
• Television and radio ads;
Amador Water Agency 2015 Urban Water Management Plan Demand Management Measures
June 2016 9-5
• Water surveys and Do-it-Yourself home water audit brochures;
• Rebates and fixture giveaways; and
• Banners in public viewing areas.
Public and School Education
Implementation over the Past Five Years
The Agency believes public awareness of water conservation issues is an important factor in ensuring a reliable water supply. The Agency promotes public awareness of water conservation through many ways, including through bill inserts, brochures, a demonstration garden, special events throughout the year, and water conservation programs sponsored in local schools. Additionally, the Agency sponsors a portion of the Upper Mokelumne River Watershed Authority’s school education program, the Stewardship through Education Program, in which watershed and water conservation information sessions are taught at every elementary school in Amador and Calaveras Counties. Information about the program is available at its website here: http://www.steonline.org/Home.html. The Agency also has provided school education programs, including presentations and demonstrations, on a per request basis Educational materials and videos for this program are provided by the Agency and include water conservation activity and coloring books and conservation tips from “Aqua Annie.” To appeal to younger children, a duck costume is available for a staff member to wear to the presentations as Aqua Annie. Appendix L displays samples of public information distributed by the Agency, as well as examples of materials used for school education programs. Specifically, over the last five years, some of the public and school education activities have included the activities listed in Table 9-3.
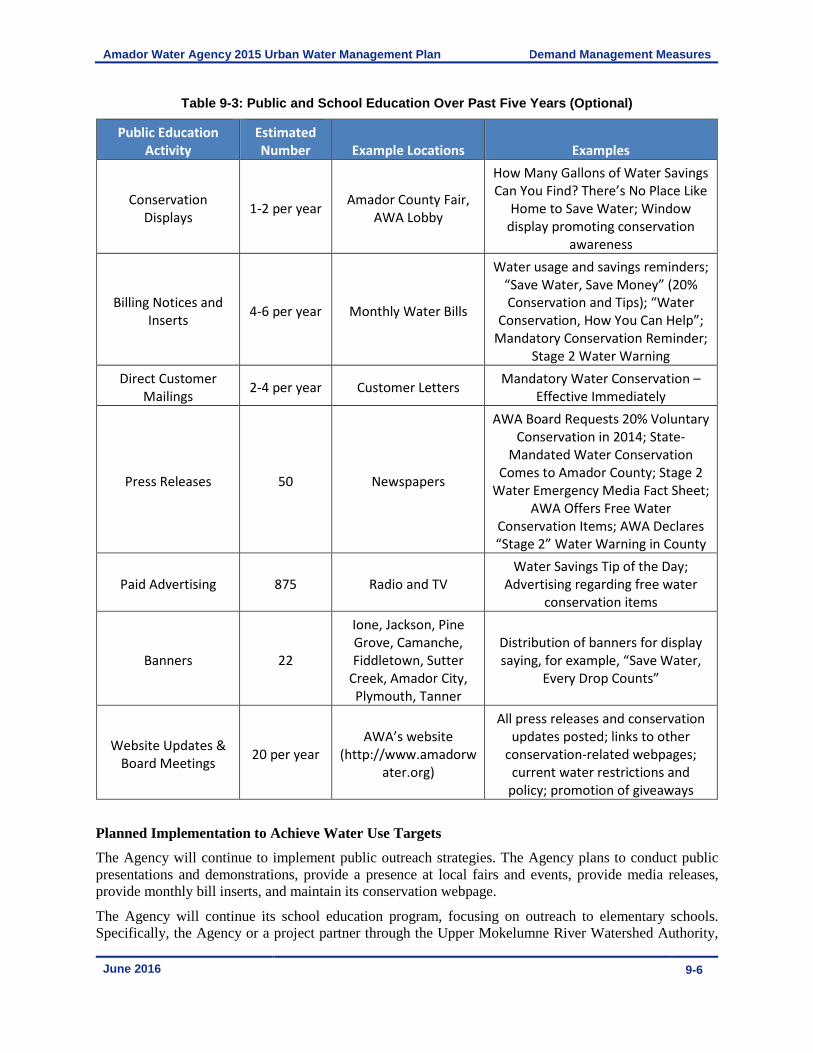
Amador Water Agency 2015 Urban Water Management Plan Demand Management Measures
June 2016 9-6
Table 9-3: Public and School Education Over Past Five Years (Optional)
Public Education
Activity
Estimated
Number Example Locations Examples
Conservation
Displays 1-2 per year
Amador County Fair,
AWA Lobby
How Many Gallons of Water Savings
Can You Find? There’s No Place Like
Home to Save Water; Window
display promoting conservation
awareness
Billing Notices and
Inserts 4-6 per year Monthly Water Bills
Water usage and savings reminders;
“Save Water, Save Money” (20%
Conservation and Tips); “Water
Conservation, How You Can Help”;
Mandatory Conservation Reminder;
Stage 2 Water Warning
Direct Customer
Mailings 2-4 per year Customer Letters
Mandatory Water Conservation –
Effective Immediately
Press Releases 50 Newspapers
AWA Board Requests 20% Voluntary
Conservation in 2014; State-
Mandated Water Conservation
Comes to Amador County; Stage 2
Water Emergency Media Fact Sheet;
AWA Offers Free Water
Conservation Items; AWA Declares
“Stage 2” Water Warning in County
Paid Advertising 875 Radio and TV
Water Savings Tip of the Day;
Advertising regarding free water
conservation items
Banners 22
Ione, Jackson, Pine
Grove, Camanche,
Fiddletown, Sutter
Creek, Amador City,
Plymouth, Tanner
Distribution of banners for display
saying, for example, “Save Water,
Every Drop Counts”
Website Updates &
Board Meetings 20 per year
AWA’s website
(http://www.amadorw
ater.org)
All press releases and conservation
updates posted; links to other
conservation-related webpages;
current water restrictions and
policy; promotion of giveaways
Planned Implementation to Achieve Water Use Targets
The Agency will continue to implement public outreach strategies. The Agency plans to conduct public presentations and demonstrations, provide a presence at local fairs and events, provide media releases, provide monthly bill inserts, and maintain its conservation webpage.
The Agency will continue its school education program, focusing on outreach to elementary schools. Specifically, the Agency or a project partner through the Upper Mokelumne River Watershed Authority,
Amador Water Agency 2015 Urban Water Management Plan Demand Management Measures
June 2016 9-7
will visit elementary schools in its service area, giving a presentation that covers the Agency’s role in supplying water, the importance of managing water resources and water conservation tips.
Water Surveys for Residential, Large Landscape, and CII Customers
Implementation over the Past Five Years
Water surveys for customers help raise awareness of overall water use and potential water savings measures that can be taken to conserve water during everyday use. In the past, the Agency has offered free residential water use surveys and water saving kits to customers upon request. The Agency published a Home Water Audit brochure in August 2014 and an update to this brochure in June 2015. The brochure is available in hard copy in the Agency’s Lobby and on its website (http://www.amadorwater.org/).
In addition, the Agency has approximately 30 accounts dedicated solely to large landscape irrigation. These accounts are mostly local parks and cemeteries. The Agency has offered surveys to large landscape accounts, along with all CII accounts, since 1985.
Lastly, the Agency has offered to review plans for new CII customers. The Agency has provided water use audits to any CII customer upon request since 1985
Planned Implementation to Achieve Water Use Targets
The Agency will continue to offer water surveys to residential, large landscape, and CII customers, upon request.
Residential Plumbing Retrofits
Implementation over the Past Five Years
The Agency encourages its customers to conserve water during everyday use by distributing low-flow showerheads, faucet aerators, and toilet conservation kits. Advertising campaigns in 2014 and 2015 notified the Agency’s customers of this giveaway program. The offer is good for one item per customer household, while supplies last, available at the Agency’s office, located at 12800 Ridge Road in Sutter Creek. During the last five years, the Agency handed out approximately 312 water saving devices to customers at the Agency office. Water-conserving devices are also available at local hardware and home improvement stores. Additionally, a Proposition 84, Round 2 IRWM implementation grant has funded the Vintage Home Fixture Retrofit Program, consisting of toilet and showerhead replacement in Lake Camanche Village. The Agency had estimated that over 350 homes within Lake Camanche Village could benefit from fixture replacement. As of December 2015, the Vintage Home Retrofit Program resulted in the installation of 134 high efficiency toilets and 119 water conserving showerheads in Lake Camanche Village and Camanche North and South Shore Recreation Areas. The Water Agency is extending the Vintage Home Retrofit Program to qualifying homes in the Sutter Creek, Ione, Amador City, and Central Amador Water Project service areas. Another factor reducing residential water use is that as of 2014, for new and remodeled homes and businesses, building codes require water-efficient fixtures.
Planned Implementation to Achieve Water Use Targets
The Agency will continue to give away free low flow fixtures as long as funding permits.
9.2.5 Programs to Assess and Manage Distribution System Real Loss Implementation over the Past Five Years
Repair and maintenance of the water distribution systems are priorities for the Agency, and the Agency has conducted system water audits since its founding. On a small scale, the Agency contacts individual customers when meter readings indicate unusually high usage. The Agency then coordinates with the owner to determine if a leak has developed. The Water Agency has made contact with approximately 840 customers with unusual high use in the past five years. System audits are also performed on a larger scale.

Amador Water Agency 2015 Urban Water Management Plan Demand Management Measures
June 2016 9-8
Records are kept annually on water production versus consumption to track unaccounted water in the system and this year, the AWWA Water Audit method and spreadsheet was used to estimate water loss in the Agency’s distribution system. In addition, in the past five years, the Agency has made a targeted effort to reduce real water losses in its system by completing the following:
• Implemented a master meter leak detection program which monitors 15 master meters throughout the Sutter Creek area and compares those readings with corresponding retail water meter use to determine areas that may have notable leakage.
• Identified and implemented leak detection projects in the Lake Camanche Village area through a comparison of source water meter readings and retail meters, combined with site investigations. Projects included placing tank liners in six wooden water tanks in the Lake Camanche Village area and replacing approximately 75% of all service lines in the area. The Agency plans to continue leak detection master metering programs as funding allows.
• As previously described, the Agency implemented the first phase of the Amador Transmission Project, replacing a portion of the earthen Amador and Ione Canal, ultimately reducing the system leaks and high water losses resulting from leakage and seepage. The new pipeline mitigates for water historically lost during conveyance through the Amador Canal, lowering effective system demand and allowing the Agency to more efficiently use its water entitlements. Also, by reducing Canal losses, the Agency has been able to better identify residential, commercial and industrial losses.
Planned Implementation to Achieve Water Use Targets
The Agency plans to complete the AWWA Water Loss Audit spreadsheets for each of its water systems on an annual basis.
There is potential for the Agency to coordinate a joint leak detection and pipe repair program with its southern neighbor, the Calaveras County Water District. This would be implemented through the regional umbrella organization, the Upper Mokelumne River Watershed Authority, and could potentially achieve cost savings through a shared program.
9.2.6 Water Conservation Program Coordination and Staffing Report Implementation over the Past Five Years
The Agency has historically assigned conservation coordinator duties to a member of the Agency’s staff. However, in 2010, the Agency’s Conservation Coordinator retired and the Agency’s conservation program is now a shared responsibility amongst several Agency staff members. The current conservation program lead is the Customer Service Supervisor, Karen Gish. She receives support from Operations staff and the Executive Department.
Planned Implementation to Achieve Water Use Targets
The Agency will continue to implement its water conservation program and share responsibilities among several staff members. Karen Gish, (209) 257-5234, [email protected], can be contacted with questions about the Agency’s conservation program.

Amador Water Agency 2015 Urban Water Management Plan Plan Adoption, Submittal, and Implementation
June 2016 10-1
Chapter 10 Plan Adoption, Submittal, and Implementation
Amador Water Agency provided notice to cities and counties as well as other local stakeholders that its 2015 UWMP was being prepared and was under review and amendment consideration at least 60 days in advance of the public hearing in accordance with CWC 10621 and CWC 10642. Letters were mailed on January 1, 2016 to the cities and counties listed in Table 10-1; these letters are included in Appendix B.
Table 10-1: Notification to Cities and Counties (DWR Table 10-1)
City Name 60 Day Notice Notice of Public
Hearing
City of Amador
City of Jackson
City of Ione
City of Plymouth
City of Sutter Creek
County Name 60 Day Notice Notice of Public
Hearing
Amador County
NOTES:
The draft 2015 UWMP was made available for public review, with public comments on the UWMP due to the Agency on June 16, 2016. The record of public comments and the Agency’s responses is included in Appendix S. The draft 2015 UWMP was discussed during a public meeting held on May 12, 2016 and continued to June 16, 2016. The public was notified of the UWMP hearing by the Agency’s Board of Directors via annoucements placed in the Amador Ledger Dispatch, the local newspaper, on April 29, 2016 and on May 6, 2016 Appendix B.The public hearing allowed the community to provide input and consider the economic impacts of the implementation of this UWMP. The 2015 UWMP was adopted by the Agency’s Board of Directors on June 16, 2016. A copy of the adoption resolution is provided in Appendix N. The agenda for the public meeting is included in Appendix O.
The UWMP was submitted to DWR before July 1, 2016. Within 30 days of adoption of the UWMP, a copy was submitted to the Amador County Library and to the California State Library, and is available at the Agency’s offices as well as on the Agency’s website for public access (Appendix R). A copy of the adopted UWMP was provided to Amador County and the cities of Amador City, Ione, Jackson, Plymouth and Sutter Creek within 30 days after adoption (Appendix R). Additionally, copies were provided to all water retailers who purchase water wholesale from the Agency.

Amador Water Agency 2015 Urban Water Management Plan References
June 2016 R-1
References
AECOM. 2014. Amador County General Plan Environmental Impact Report, Biological Resources. October 2014.
Aegis Engineering Management & Zw3. 2013. Regional Approach for Reuse Study. February 2013.
Amador County Department of Agriculture. 2015. 2014 Amador County Agricultural Crop & Livestock Report. July 2015.
Amador County. 2005. Amador County Regional Wastewater Plan. September 2005.
California Department of Water Resources (DWR). 2015a. Draft 2015 Urban Water Management Plans Guidebook for Urban Water Suppliers. November 2015.
California Department of Water Resources (DWR). 2015b. California Climate Science and Data for Water Resources Management. June 2015.
City of Ione. 2009. City of Ione General Plan Update Draft Environmental Impact Report. June 2009.
Dunn Environmental, Inc. 2012. Groundwater Supply Study and Integrated Regional Groundwater Management Plan for the Lake Camanche Water Improvement District No. 7. June 2012.
Federal Energy Regulatory Commission (FERC). 2000. Mokelumne River Project RERC Project No. 137: Mokelumne Relicensing Settlement Agreement. November, 2000.
PMC, 2015. Amador County Housing Element Update. April 2015.
Policy Consulting Associates, LLC, 2014. Amador Municipal Services Review. May 2014.
RMC Water and Environment. 2013. Mokelumne/Amador/Calaveras Integrated Regional Water Management Plan Update. January 2013.
The Reed Group, Inc. 2015. FY15-16 Water Rate Update and Water Shortage Financial Strategy Report. June 2015.
United States Census Bureau. 2016. Amador County, California Quick Facts. April 2016.