alternatives in action: a guide to strategies for ... · 2 october 2015 "alternatives in...
TRANSCRIPT

Alternative investment strategies have enjoyed explosive growth in recent years as investors embraced innovation to equip their portfolios for changing financial markets.
In market conditions today, it is especially important to gain a greater understanding of alternative strategies and how they can be used to diversify a portfolio. The U.S. bull market has reached its seven-year milestone, and investors are concerned with equity valuations, the potential for capital loss in fixed-income markets, and the trajectory for economic growth going forward. These challenges are causing investors to consider alternative asset classes and strategies.
As the number and variety of alternative strategies expands, the need for a framework to compare and evaluate them becomes greater. We believe that understanding how different alternative strategies may behave in different environments is essential to utilizing alternatives as an effective source of diver-sification over market cycles.
This study seeks to make sense of the alternative universe by using research to help set reasonable performance expectations for alternative investment strategies, and to shed light to how these strategies fit into a portfolio of traditional assets.
Research note: We have chosen the 20-year period from 1994 to 2013 for this study because it provides a recent and reasonably representative sample of the variety of economic scenarios that long-term investors may encounter. We outline our methodology, assumptions, and outcomes in Appendix 1, 2, and 3.
Alternatives in action: A guide to strategies for portfolio diversificationKey takeaways
Investors considering alternative strategies can benefit from understanding the variations in their performance characteristics during different economic scenarios.
This study offers:
•Classification of alternatives by investment objective
•Comparison of alternatives’ long-term returns and risk
•Performance in different economic scenarios
•Analysis of returns and risk-adjusted returns
•Insights about performance characteristics
•Observations for portfolio strategies
May 2018
Christian J. GalipeauSenior Investment Director
Brendan T. MurraySenior Investment Director
Seamus S. Young, CFAInvestment Director
For investment professionals use only. Not for use with the public.
2
May 2018 | Alternatives in action: A guide to strategies for portfolio diversification
For investment professionals use only. Not for use with the public.
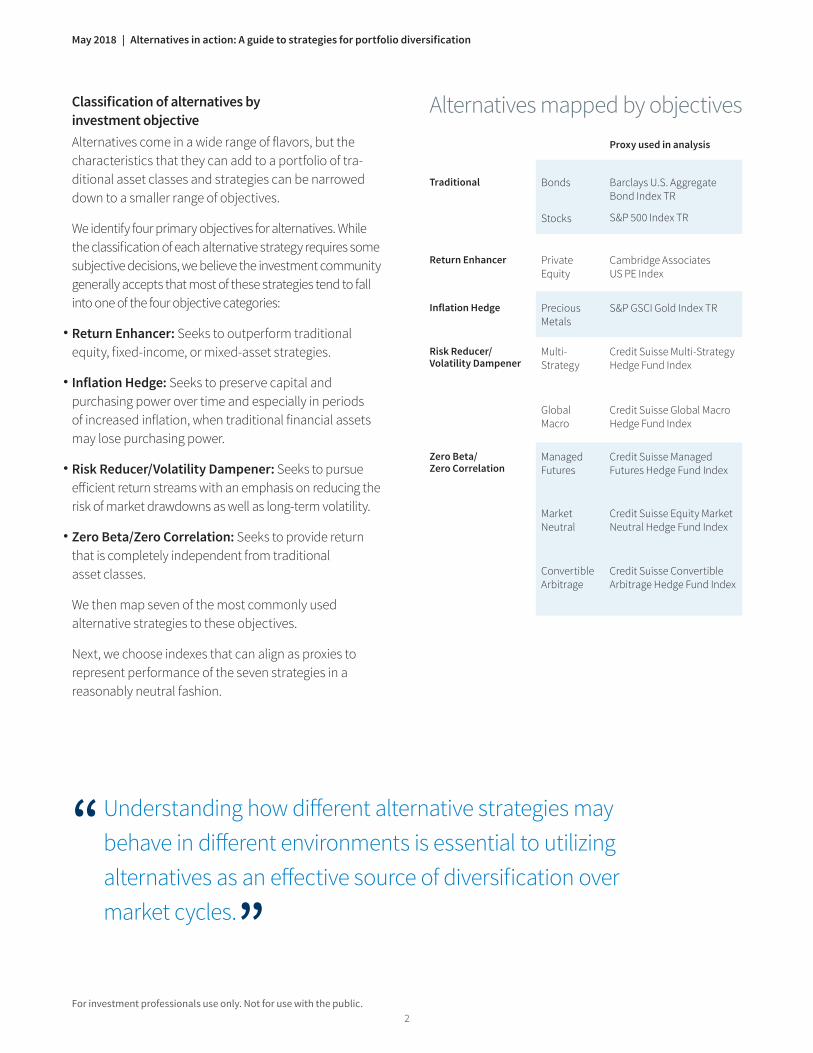
Classification of alternatives by investment objectiveAlternatives come in a wide range of flavors, but the characteristics that they can add to a portfolio of tra-ditional asset classes and strategies can be narrowed down to a smaller range of objectives.
We identify four primary objectives for alternatives. While the classification of each alternative strategy requires some subjective decisions, we believe the investment community generally accepts that most of these strategies tend to fall into one of the four objective categories:
•Return Enhancer: Seeks to outperform traditional equity, fixed-income, or mixed-asset strategies.
•Inflation Hedge: Seeks to preserve capital and purchasing power over time and especially in periods of increased inflation, when traditional financial assets may lose purchasing power.
•Risk Reducer/Volatility Dampener: Seeks to pursue efficient return streams with an emphasis on reducing the risk of market drawdowns as well as long-term volatility.
•Zero Beta/Zero Correlation: Seeks to provide return that is completely independent from traditional asset classes.
We then map seven of the most commonly used alternative strategies to these objectives.
Next, we choose indexes that can align as proxies to represent performance of the seven strategies in a reasonably neutral fashion.
Alternatives mapped by objectives Proxy used in analysis
Traditional Bonds Barclays U.S. Aggregate Bond Index TR
S&P 500 Index TRStocks
Return Enhancer Private Equity
Cambridge Associates US PE Index
Inflation Hedge Precious Metals
S&P GSCI Gold Index TR
Risk Reducer/ Volatility Dampener
Multi- Strategy
Credit Suisse Multi-Strategy Hedge Fund Index
Global Macro
Credit Suisse Global Macro Hedge Fund Index
Zero Beta/ Zero Correlation
Managed Futures
Credit Suisse Managed Futures Hedge Fund Index
Market Neutral
Credit Suisse Equity Market Neutral Hedge Fund Index
Convertible Arbitrage
Credit Suisse Convertible Arbitrage Hedge Fund Index
“ Understanding how different alternative strategies may behave in different environments is essential to utilizing alternatives as an effective source of diversification over market cycles. ”

3
Putnam Investments | putnam.com
For investment professionals use only. Not for use with the public.
Comparison of alternatives’ long-term returns and riskOur initial examination tracks the return and volatility of these objectives over 20 years to understand their general characteristics.
Returns and volatility of alternative objectives, 1994–2013
Precious Metals
Stocks
Private Equity
Bonds
Market Neutral
Global MacroMulti-Strategy
Convertible Arbitrage
Traditional
Return Enhancer
Inflation Hedge
Risk Reducer/ Volatility Dampener
Zero Beta/ Zero Correlation
0 2 4 6 8 10 12 14 16 18 20 220
2
4
6
8
10
12
14
16
18
Managed Futures
Aver
age
annu
aliz
ed re
turn
(%
)
Average annualized volatility (%)
Source: Putnam Investments. Indexes are unmanaged and do not incur expenses. You cannot invest directly in an index. Past performance is not a guarantee of future results.
These results can help us shape expectations for investment performance from alternatives. The two extreme outliers in the chart are the Return Enhancer category, with high returns and volatility, and traditional bonds, with the lowest volatility and nearly the lowest returns. The other alternative categories demonstrated lower volatility than stocks and higher volatility than bonds, while their returns varied.
With an understanding of how these objectives perform over long time periods and multiple market cycles, we then examine how they perform in specific periods by breaking down the 20-year period into shorter segments. The goal is to identify whether the performance of each alternative category is consistent across periods or if there are aber-rations from the long-term trend in specific periods. This understanding can help to guide investment decisions.
Performance in different economic scenarios over 20 yearsWe characterize the different economic scenarios of the past 20 years through the lenses of two variables: growth and inflation. With two variables, we can construct four economic scenarios:
G+/I+ Above-trend economic growth with above-trend inflation
G+/I- Above-trend economic growth with below-trend inflation
G-/I+ Below-trend economic growth with above-trend inflation
G-/I- Below-trend economic growth with below-trend inflation
To establish the scenarios of above- and below-trend economic growth, we use the Chicago Fed National Activity Index (CFNAI). For the purpose of this analysis, the growth signal is a three-month simple moving average of the CFNAI.
To measure and establish the standard for above- and below-trend inflation, we use the year-over-year (YoY) change in Core Consumer Price Index (CPI) (for additional information on the statistics used for growth and inflation, please consult Appendix 1).
We then calculate the time that is spent in each economic scenario.
Economic scenarios from 1994 to 2013
G+/I+37.5% of the time
G-/I+25.0% of the time
G+/I-15.0% of the time
G-/I-22.5% of the time
Source: Putnam Investments.

4
May 2018 | Alternatives in action: A guide to strategies for portfolio diversification
For investment professionals use only. Not for use with the public.
Analysis of returns and risk-adjusted returnsWorking with the economic scenarios, we then calculate the annualized performance and volatility of the alterna-tive asset classes conditional to each scenario. (Note: We took a step to eliminate look-ahead bias by calculating
conditional investment strategy returns based on the prior quarter’s economic data. For example, data about strategy returns from the first quarter of 1994 are conditional on economic data from the fourth quarter of 1993.)
Source: Putnam Investments.Indexes are unmanaged and do not incur expenses. You cannot invest directly in an index. Past performance is not a guarantee of future results.
Returns of traditional and alternative strategies in different economic scenarios, 1994–2013
3.5
10.6
13.3
9.3
10.4
9.9
1.5
6.5
9.2
6.3
15.1
24.5
-0.4
8.7
9.6
9.2
10.6
6.7Convertible Arbitrage
Market Neutral
Managed Futures
Global Macro
Multi-Strategy
Precious Metals
Private Equity
Stocks
Bonds
Convertible Arbitrage
Market Neutral
Managed Futures
Global Macro
Multi-Strategy
Precious Metals
Private Equity
Stocks
Bonds
5.1
-3.7
2.3
1.1
1.0
10.0
6.3
5.8
-4.2ConvertibleArbitrage
Market Neutral
Managed Futures
Global Macro
Multi-Strategy
Precious Metals
Private Equity
Stocks
Bonds6.8
12.2
12.2
17.7
11.8
15.9
1.1
-5.6
16.7ConvertibleArbitrage
Market Neutral
Managed Futures
Global Macro
Multi-Strategy
Precious Metals
Private Equity
Stocks
Bonds
G+/I- G+/I+
G-/I- G-/I+
Average annualized return (%)Average annualized return (%)
Average annualized return (%)Average annualized return (%)
l Traditional
l Return Enhancer
l Inflation Hedge
l Risk Reducer/ Volatility Dampener
l Zero Beta/ Zero Correlation
l Traditional
l Return Enhancer
l Inflation Hedge
l Risk Reducer/ Volatility Dampener
l Zero Beta/ Zero Correlation

5
Putnam Investments | putnam.com
For investment professionals use only. Not for use with the public.
Sharpe ratios of traditional and alternative strategies in different economic scenarios, 1994–2013
0.20
0.70
0.57
0.57
1.09
1.20
-0.19
0.77
0.59
0.59
-0.38
-0.02
-0.09
-0.17
0.71
0.30
0.70
-0.41
1.24
0.52
0.75
1.51
0.97
1.79
-0.10
-0.31
0.90
ConvertibleArbitrage
Market Neutral
Managed Futures
Global Macro
Multi-Strategy
Precious Metals
Private Equity
Stocks
Bonds0.63
0.67
1.30
-0.35
0.65
0.38
0.58
1.22
0.27ConvertibleArbitrage
Market Neutral
Managed Futures
Global Macro
Multi-Strategy
Precious Metals
Private Equity
Stocks
Bonds
ConvertibleArbitrage
Market Neutral
Managed Futures
Global Macro
Multi-Strategy
Precious Metals
Private Equity
Stocks
Bonds
ConvertibleArbitrage
Market Neutral
Managed Futures
Global Macro
Multi-Strategy
Precious Metals
Private Equity
Stocks
Bonds
In-sample Sharpe ratiosIn-sample Sharpe ratios
In-sample Sharpe ratiosIn-sample Sharpe ratios
l Traditional
l Return Enhancer
l Inflation Hedge
l Risk Reducer/ Volatility Dampener
l Zero Beta/ Zero Correlation
l Traditional
l Return Enhancer
l Inflation Hedge
l Risk Reducer/ Volatility Dampener
l Zero Beta/ Zero Correlation
G+/I- G+/I+
G-/I- G-/I+
Source: Putnam Investments.Indexes are unmanaged and do not incur expenses. You cannot invest directly in an index. Past performance is not a guarantee of future results.
Of course, in investing today, no asset class or strategy is considered for its return potential alone. Investment risk is also a paramount concern. Our analysis goes a step
further by bringing volatility, as measured by standard deviation, into the framework, using the Sharpe ratio of each strategy.
6
May 2018 | Alternatives in action: A guide to strategies for portfolio diversification
For investment professionals use only. Not for use with the public.
Insights about performance characteristicsThe primary use for alternatives is to complement traditional asset classes, but not to replace the traditional allocations entirely.
To determine which alternatives are best equipped to complement traditional asset classes in specific economic scenarios, our study also analyzes the correlation and beta statistics of each alternative versus stocks and bonds.
One important aspect of the analysis is to identify if there are economic environments in which alternatives behave differently than they perform over the full 20-year period. We apply a t-test that allows us to determine if there is a meaningful difference in performance of a particular alternative strategy during a specific period, or if this variation is due to random chance.
The data for each strategy and scenario can be found in Appendix 3, but our observations are summarized below.
Return Enhancer•Perhaps not surprisingly, our Return Enhancer proxy, Private Equity, generates the highest absolute return over our entire sample period, while also delivering fairly attractive risk-adjusted returns.
•Its ability to offer investors diversification from traditional stocks is not compelling, as its full sample correlation is 0.77.
•Its returns appear to be significantly higher in periods of above-trend economic growth and below-trend inflation (G+/I-), which coincides directly with traditional stocks.
•Returns appear to be significantly lower in periods of below-trend growth and above-trend inflation (G-/I+), again coinciding with traditional stocks.
Inflation Hedge•Overall, the results are mixed for our Inflation Hedge proxy, the S&P GSCI Gold Total Return Index. More specialized research would be needed to specifically address the role the proxy plays in a portfolio.
•The category appears to offer some attractive diversification benefits to both traditional stocks and bonds. However, its overall returns are muted.
•Additionally, it is unclear if the category is a true inflation hedge, as analysis of its returns suggests that performance is influenced by economic growth.
•Returns appear significantly higher in periods of below-trend growth and below-trend inflation (G-/I-), while appearing significantly lower in periods of above-trend growth and below-trend inflation (G+/I-).
Risk Reducer/Volatility Dampener•The category appears to balance the providing of stable absolute returns with fairly low volatility, resulting in some of the most attractive risk-adjusted returns over the full sample period.
•Both the Multi-Strategy and Global Macro indexes display fairly low sensitivity to traditional stocks and bonds, as evidenced by beta, which indicates a potential diversifica-tion benefit.
•Of the two proxies, Global Macro tends to have a slightly higher return and volatility compared with Multi-Strategy, while the cross-sectional analysis of the two suggests that they behave in a similar fashion.
•Both indexes also display fairly consistent return streams over varying economic scenarios, with each having only one period in which returns are meaningfully different from the full sample return (Multi-Strategy has lower returns in G-/I+, while Global Macro has higher returns in G-/I-).
Zero Beta/Zero Correlation•Though returns of the three proxies are in the range of approximately 5%–7% over the full sample period, there are clear return divergences within economic scenarios, with no cross-sectional consistencies.
•Unexpectedly, both Equity Market Neutral and the Convertible Arbitrage indexes have a positive beta bias over the full sample.
•Managed Futures appears to maintain low and quite often negative correlation and beta to traditional stocks, mak-ing it an attractive diversification choice from that regard.
•The Market Neutral proxy appears to show signs of a meaningful spike in volatility during periods of below-trend economic growth and below-trend inflation (G-/I-), which also skews the volatility over the full sample.

7
Putnam Investments | putnam.com
For investment professionals use only. Not for use with the public.
Economic scenario
Alternative proxy with highest risk-adjusted returns
Alternative proxy with lowest risk-adjusted returns
Alternative proxy with lowest equity beta
Alternative proxy with lowest equity correlation
G+/I+ l Risk Reducer/Volatility Dampener (Global Macro)
l Zero Beta/Zero Correlation (Managed Futures)
l Zero Beta/Zero Correlation (Market Neutral)
l Zero Beta/Zero Correlation (Market Neutral)
G+/I- l Return Enhancer (Private Equity)
l Inflation Hedge (Precious Metals)
l Inflation Hedge (Precious Metals)
l Inflation Hedge (Precious Metals)
G-/I+ l Risk Reducer/Volatility Dampener (Global Macro)
l Zero Beta/Zero Correlation (Convertible Arbitrage)
l Zero Beta/Zero Correlation (Managed Futures)
l Zero Beta/Zero Correlation (Managed Futures)
G-/I- l Risk Reducer/Volatility Dampener (Global Macro)
l Zero Beta/Zero Correlation (Market Neutral)
l Zero Beta/Zero Correlation (Managed Futures)
l Zero Beta/Zero Correlation (Managed Futures)
All scenarios — full 20-year period
l Risk Reducer/Volatility Dampener (Global Macro)
l Zero Beta/Zero Correlation (Market Neutral)
l Zero Beta/Zero Correlation (Managed Futures)
l Zero Beta/Zero Correlation (Managed Futures)
1Low equity beta and equity correlation indicate diversification potential.
Review of highest and lowest rankings in key performance metrics*, 1994–2013
Return Enhancer and Risk Reducer/Volatility Dampener strategies delivered among the best Sharpe ratios over the full 20-year period, 1994–2013.
0.73
0.37
0.69
0.21
0.72
0.55
0.25
0.13
0.28Convertible Arbitrage
Market Neutral
Managed Futures
Global Macro
Multi-Strategy
Precious Metals
Private Equity
Stocks
Bonds
Sharpe ratio
l Traditional
l Return Enhancer
l Inflation Hedge
l Risk Reducer/ Volatility Dampener
l Zero Beta/ Zero Correlation
Sources: Cambridge Associates, S&P, Credit Suisse, and Putnam Investments.Indexes are unmanaged and do not incur expenses. You cannot invest directly in an index. Past performance is not a guarantee of future results.
Observations for portfolio strategiesOur goal with this research is to offer insights to help you understand which alternative strategies can help equip a portfolio to pursue its goals more efficiently. The data demonstrate that over long time horizons such as 20 years, alternative investment strategies have generally met the expectations of their performance objectives.
Our study confirms that alternative strategies can represent valuable innovations to the toolbox of portfolio choices.
Our findings also reveal that in specific types of economic periods, the performance of some alternatives can diverge from their long-term characteristics.
These observations about long-term performance characteristics, and how the strategies can diverge from expectations in specific types of economic scenarios, provide a framework for differentiating the strategies and applying them to serve portfolio goals.

8
May 2018 | Alternatives in action: A guide to strategies for portfolio diversification
For investment professionals use only. Not for use with the public.
Appendix 1
Assumptions and methodology regarding economic scenariosAs noted above, to establish the scenarios of above- and below-trend economic growth, we use the Chicago Fed National Activity Index (CFNAI). The CFNAI is a weighted average of 85 indicators of national economic activity drawn from four broad categories of data production and income; employment, unemployment, and hours; personal consumption and housing; and sales, orders, and inventories. A zero value for the index indicates that the national economy is expanding at its historical trend rate of growth; negative values indicate below-average growth; and positive values indicate above-average growth. For the purpose of this analysis, the growth signal was a three-month simple moving average of the CFNAI. We establish two scenarios for economic growth: (1) a positive number representing above-trend growth, or (2) a negative number representing below-trend growth.
To measure and establish the standard for above- and below-trend inflation, we use the year-over-year (YoY) change in Core Consumer Price Index (CPI). The CPI is a time series measure of the price level of consumer goods and services that are collected from 87 urban areas throughout the United States and from 23,000 retail and service establishments. In addition, data on rents are collected from approximately 50,000 landlords or ten-ants. The weight of any item in the index is derived from the reported expenditures on that item as estimated by the Consumer Expenditure Survey. Our inflation signal looks at the YoY change in Core CPI relative to its three-year simple moving average. We establish two types of inflation scenarios: (1) above-trend inflation for when the current YoY Core CPI was above its moving average, and (2) below-trend inflation for when the current YoY Core CPI was below its moving average.
Appendix 2
Performance data Regarding the data for analyzing the alternative strate-gies, our analysis uses quarterly return data collected from December 31, 1993, through December 31, 2013 (80 quarters), as it is readily available for the Credit Suisse Hedge Fund Indices.
Another challenge to note when discussing alternative strategies is that the reported returns may experience some degree of positive autocorrelation, which is typically the result of smoothed returns. Many of the alternative investment strategy indices used in this analysis, including Private Equity, display this property. To mitigate its effect, returns are unsmoothed, assuming first-order autocorrelation.

9
Putnam Investments | putnam.com
For investment professionals use only. Not for use with the public.
l Return Enhancer (Private Equity)
Economic scenario
Average annualized
returns (%)
Volatility (%) Sharpe ratio T-test Equity beta Bond beta
Equity correlation
Bond correlation
G+/I+ 13.3 18.2 0.57 -0.21 1.07 -0.10 0.63 -0.02
G+/I- 24.5 16.0 1.30 3.43 0.72 -0.74 0.76 -0.19
G-/I+ 2.3 19.0 -0.02 -2.70 1.00 -2.25 0.89 -0.47
G-/I- 12.1 13.5 0.75 -0.75 0.56 -1.38 0.82 -0.40
ALL 14.4 16.7 0.69 — 0.76 -1.13 0.77 -0.26
Source: Putnam Investments.
l Inflation Hedge (Precious Metals)
Economic scenario
Average annualized
returns (%)
Volatility (%) Sharpe ratio T-test Equity beta Bond beta
Equity correlation
Bond correlation
G+/I+ 9.3 11.1 0.57 1.13 0.24 -1.87 0.20 -0.46
G+/I- -0.4 11.7 -0.35 -2.86 -0.22 0.79 -0.33 0.28
G-/I+ 1.1 17.1 -0.09 -1.12 -0.18 1.95 -0.18 0.45
G-/I- 17.7 10.4 1.51 5.16 0.03 -0.38 0.06 -0.14
ALL 5.7 13.0 0.21 — -0.09 0.58 -0.12 0.17
Source: Putnam Investments.
l Risk Reducer/Volatility Dampener (Multi-Strategy)
Economic scenario
Average annualized
returns (%)
Volatility (%) Sharpe ratio T-test Equity beta Bond beta
Equity correlation
Bond correlation
G+/I+ 10.4 6.9 1.09 1.27 0.41 -1.51 0.65 -0.60
G+/I- 8.7 7.7 0.65 0.55 0.10 0.26 0.22 0.14
G-/I+ 0.9 10.7 -0.17 -2.78 0.32 -0.07 0.51 -0.03
G-/I- 11.8 10.2 0.97 1.72 0.28 -0.83 0.54 -0.32
ALL 7.9 9.0 0.55 — 0.24 -0.19 0.45 -0.08
Source: Putnam Investments.
Appendix 3
Statistical summary for alternative strategies, 1994–2013.For the T-test, the typical convention for assessing statistical significance is a = 0.05, which coincides with a 95% confidence interval.

10
May 2018 | Alternatives in action: A guide to strategies for portfolio diversification
For investment professionals use only. Not for use with the public.
l Risk Reducer/Volatility Dampener (Global Macro)
Economic scenario
Average annualized
returns (%)
Volatility (%) Sharpe ratio T-test Equity beta Bond beta
Equity correlation
Bond correlation
G+/I+ 9.9 5.8 1.20 -0.81 0.21 -0.88 0.39 -0.42
G+/I- 9.6 15.8 0.38 -0.57 0.33 0.70 0.36 0.18
G-/I+ 10.0 10.1 0.71 -0.56 -0.06 1.24 -0.10 0.48
G-/I- 15.9 7.8 1.79 2.65 0.09 -0.02 0.22 -0.01
ALL 11.3 11.6 0.72 — 0.15 0.54 0.22 0.18
Source: Putnam Investments.
l Zero Beta/Zero Correlation (Managed Futures)
Economic scenario
Average annualized
returns (%)
Volatility (%) Sharpe ratio T-test Equity beta Bond beta
Equity correlation
Bond correlation
G+/I+ 1.5 7.7 -0.19 -1.70 0.40 -0.61 0.57 -0.22
G+/I- 9.2 9.5 0.58 2.26 -0.14 0.74 -0.24 0.38
G-/I+ 6.2 11.5 0.30 0.36 -0.26 1.32 -0.38 0.45
G-/I- 1.1 9.0 -0.10 -2.10 -0.22 0.14 -0.47 0.06
ALL 5.3 9.6 0.25 — -0.15 0.63 -0.27 0.25
Source: Putnam Investments.
l Zero Beta/Zero Correlation (Market Neutral)
Economic scenario
Average annualized
returns (%)
Volatility (%) Sharpe ratio T-test Equity beta Bond beta
Equity correlation
Bond correlation
G+/I+ 6.5 4.5 0.77 1.39 -0.03 -0.63 -0.08 -0.38
G+/I- 10.8 5.7 1.22 5.75 0.21 0.04 0.62 0.03
G-/I+ 5.7 4.3 0.70 1.10 0.11 -0.10 0.45 -0.10
G-/I- -5.6 24.3 -0.31 -1.89 0.73 -1.99 0.59 -0.32
ALL 4.6 12.9 0.13 — 0.34 -0.57 0.44 -0.17
Source: Putnam Investments.
Appendix 3 continued

11
Putnam Investments | putnam.com
For investment professionals use only. Not for use with the public.
l Zero Beta/Zero Correlation (Convertible Arbitrage)
Economic scenario
Average annualized
returns (%)
Volatility (%) Sharpe ratio T-test Equity beta Bond beta
Equity correlation
Bond correlation
G+/I+ 9.2 10.5 0.59 0.77 0.46 -1.33 0.48 -0.34
G+/I- 6.7 11.0 0.27 -0.09 0.34 0.14 0.52 0.05
G-/I+ -4.2 17.1 -0.41 -2.74 0.29 0.57 0.29 0.13
G-/I- 16.7 16.4 0.90 2.68 0.26 -0.64 0.32 -0.15
ALL 6.9 14.1 0.28 — 0.33 -0.01 0.40 0.00
Source: Putnam Investments.

Consider these risks before investing: The value of stocks and bonds in a fund’s portfolio may fall or fail to rise over time for several reasons, including general financial market conditions, changing market perceptions of the risk of default, changes in government intervention, and factors related to a specific issuer or industry. Bond investments are subject to interest-rate risk (the risk of bond prices falling if interest rates rise) and credit risk (the risk of an issuer defaulting on interest or principal payments). Risks associated with derivatives include increased investment exposure (which may be considered leverage) and, in the case of over-the-counter instruments, the potential inability to terminate or sell derivatives positions and the potential failure of the other party to the instrument to meet its obligations.
Diversification does not guarantee a profit or ensure against loss. It is possible to lose money in a diversified portfolio.
The Ibbotson Associates S&P 500 Index is represented by the Standard & Poor’s 90 Index from 1926 through February 1957 and the S&P 500 Index thereafter, which is an unmanaged group of securities and considered to be representative of the stock market in general.
The Ibbotson Associates SBBI U.S. Intermediate-Term Government Bond Index is an unweighted index which measures the performance of 5-year maturity U.S. Treasury bonds. Each year a one-bond portfolio containing the shortest noncallable bond having a maturity of not less than five years is constructed.
The S&P Goldman Sachs Commodity Index is a composite index of commodity sector returns that represents a broadly diversified, unleveraged, long-only position in commodity futures.
The HFN Multi-Strategy Index includes funds that run several different strategies in house that contribute to the total performance of the fund. A multi-strategy product may consist of one or a number of managers simultaneously operating, for example, a distressed debt portfolio, merger-arbitrage, convertible arbitrage, and long/short equity strategies for the same fund.
For informational purposes only. Not an investment recommendation.
For investment professional use only. Not for use with the public.
The views and opinions expressed are those of the authors and Putnam Investments, are subject to change with market conditions, and are not meant as investment advice.
Putnam Investments | One Post Office Square | Boston, MA 02109 | putnam.com SU847 311526 5/18