alternative thinking 2013 renewable energy under …...entering a third industrial revolution....
TRANSCRIPT
Alternative thinking 2013Renewable energy under the microscope
Contents2
WelcomeA video from Jane Allen, Global Leader – Renewable Energy.
IntroductionNoted economist and author Jeremy Rifkin says we are entering a Third Industrial Revolution.
Weighing infrastructure investmentNot all renewable energy technologies are created equal – at least, not everywhere.
Bridging the cost disparity gap with fossil fuelsIt’s a common refrain: What’s keeping the cost of fossil fuels down and renewables up?
Enduring the “shale revolution”It has been called a “game changer” and “fracking great.” The IEA says a “golden age” is upon us.
ConclusionWhile the road for renewable energy is likely to remain rough for some time, we have by no means come to its end.
Navigating the subsidy environmentAccording to the Renewables 2012 Global Status Report, at least 118 countries had renewable energy targets in place in early 2012.
ContactsOur renewable energy group.
Coming to terms with “energy democratization”“It’s not exactly a new idea.”
2
Conclusion
Introduction
Welcome
Foreword
Contacts
Bridging the cost disparity gap with fossil fuels
Enduring the “shale revolution”
Navigating the subsidy environment
Weighing infrastructure investment
Coming to terms with “energy democratization”

Alternative thinking 2013Renewable energy under the microscope
Welcome
The word “alternative,” with its connotations of hand-wringing greenery and a need for taxpayer subsidy, has to go. And in 2013 it will. “Renewable” power will start to be seen as normal.
The Economist, Nov. 21, 20123
Conclusion
Introduction
Welcome
Foreword
Contacts
Bridging the cost disparity gap with fossil fuels
Enduring the “shale revolution”
Navigating the subsidy environment
Weighing infrastructure investment
Coming to terms with “energy democratization”
3
Alternative thinking 2013Renewable energy under the microscope
Foreword
It’s been two years since we last published an edition of Alternative thinking, and in that time much has changed in the renewable energy space. For one, renewables are becoming less and less alternative and more and more mainstream.
This process still has a long way to go, but the signs are unmistakable. Renewable energy, for instance, made up nearly half of new electricity capacity in 2011, did the same (at least in the US) in 2012, and continues to show growth in all end-use sectors.
But global investment is showing a decline, in part an effect of ongoing austerity measures in various European Union countries and other struggles in sluggish economies around the world, still reeling from the recent global financial crisis. The ongoing sequester in the US, for instance, is not good for renewable energy companies, their shareholders or their stakeholders. These conditions, however, are similarly detrimental to other sectors and are simply one of the key macro challenges of the day.
We will get through it.
The objective of this paper, meanwhile, is to identify for developers, investors and policy-makers a few of the more important current trends and opportunities in renewable energy, point out where significant barriers to progress lie, and suggest strategies for dealing with them. The idea is to help you and your organization think through what you need to do to take best advantage of current conditions, wherever in the world you’re located. In addition to the range of sources cited throughout the document, the paper also incorporates the insight and experience of Deloitte renewable energy professionals from around the world.
It is, of course, impossible to give one-size-fits-all advice to companies and other organizations concerned about and affected by trends in renewable energy. Meanwhile, individual readers aren’t necessarily served by an exhaustive tome that tries to anticipate and advise on all possible strategic maneuvers. There is simply too much diversity amongst organizations and too many unknowns besides. To discuss these issues in more detail, how they affect your business and what you can do about it, I invite you to contact one of the Deloitte professionals identified at the end of the document.
In the meantime, thanks for reading, and we look forward to continuing the conversation with you.
4
Conclusion
Introduction
Welcome
Foreword
Contacts
Bridging the cost disparity gap with fossil fuels
Enduring the “shale revolution”
Navigating the subsidy environment
Weighing infrastructure investment
Coming to terms with “energy democratization”
Alternative thinking 2013Renewable energy under the microscope
Introduction
Noted economist and author Jeremy Rifkin says we are entering a Third Industrial Revolution, characterized, like the two industrial revolutions that preceded it, by the effective convergence of the breakthrough energy and communications technologies of the day.
In the First Industrial Revolution, it was the union of steam power and the printing press; in the Second Industrial Revolution, it was the internal combustion engine and “electrical communication.” In the Third Industrial Revolution, it will be renewable energies and the Internet. In all cases, “every aspect of the way we work and live” is understood to be fundamentally changed, mostly for the better.1
But what will it take to make this happen a third time? Unlike the transition into the Second Industrial Revolution, which seems to have occurred with little resistance from the primary benefactors of the First, this latest transition is shaping up to require much more deliberate planning and action.
According to the International Energy Agency (IEA), “the world is still failing to put the global energy system onto a more sustainable path.”2 Fossil fuels, the agency says, remain dominant in the energy mix, thanks in no small part to a global subsidy base – $523 billion in 2011, a 30% increase over the previous year – six times larger than that enjoyed by the renewable energy industry. >
Renewable energy today, though growing, only accounts (even in the aggregate, including hydro, biofuels and waste, geothermal, solar, wind, etc.) for less than 20% of global electricity generation, fully 16% of which comes from hydro. That isn’t negligible, but, meanwhile, coal (the “dirtiest” energy source) is at just over 40%, with natural gas at around 22% and nuclear at 13%. The final 5% or so is made up by crude oil. And in IEA scenarios, almost four-fifths of the CO2 emissions allowable by 2035 to keep global warming to no more than 2oC are already “locked-in” by existing infrastructure; all of it will be similarly locked-in by 2017 if action to reduce emissions is not taken before then.
1 Rifkin, Jeremy. 2011. The Third Industrial Revolution. Palgrave MacMillan.
2 International Energy Agency. World Energy Outlook 2012.
4
5
Conclusion
Introduction
Welcome
Foreword
Contacts
Bridging the cost disparity gap with fossil fuels
Enduring the “shale revolution”
Navigating the subsidy environment
Weighing infrastructure investment
Coming to terms with “energy democratization”
Alternative thinking 2013Renewable energy under the microscope
Furthermore, according to IEA chief economist Fatih Birol, “for every USD 1 of avoided investment before 2020, an additional USD 4.30 would need to be spent afterwards to meet the 2o goal.”3
It’s a curious thing, this challenge, given the proclaimed widespread benefits of renewable energy use not just to reducing carbon emissions but to global economic, social and environmental well-being generally. In both theory and practice, renewable energy eliminates the concerns and various costs of oil spills, nuclear failures and the clear and obvious air and water pollution from the particulates (other than CO2) released in the burning of fossil fuels. Because there are multiple sources of renewable energy, that energy can be generated anywhere at almost any scale, not simply in the locations where the resources are most densely available, leading to energy security, economic opportunity and greater self-sufficiency for regions otherwise short on conventional resources, in turn leading to improved social development as previously impoverished regions gain affluence and the freedom to pursue activities on the basis of interest rather than the raw imperative to survive.
That all sounds worthy, doesn’t it? So, what’s holding us back? Is it that, collectively, we don’t believe it, that it all sounds too good to be true? Or maybe it’s that we don’t believe in it enough?
For Rifkin, the eventual Third Industrial Revolution will mean nothing less than “a profound shift in the very way society is structured, away from hierarchical power and toward lateral power”4 – which is to say, distributed and collaborative rather than centralized and top-down. Evidence of this shift is all around us, in everything from highly visible popular uprisings like the Arab Spring and the Occupy Movement to the ongoing and more gradual shifts in consumer and social interaction, organic developments all made possible by disruptive advancements in communications technology.
It’s the energy piece that’s struggling to disrupt and converge. And that comes down to economics.
Renewable energy is still just not fully competitive with conventional sources, especially solar, which shows the greatest potential but over the longest-term. And as the International Renewable Energy Agency (IRENA) points out, “access to affordable financing and capital is often not the norm globally [for renewables], yet it is critical.”5 But IRENA also notes both that renewables made up nearly half of new electricity capacity in 2011 and that costs continue to fall, attesting that in more and more countries “renewable technologies are now the most economic solution for new capacity.” That new capacity in 2011 by resource included 41 gigawatts (GW) of new wind, 30 GW of solar photovoltaic (PV), 25 GW of hydro, 6 GW of biomass, 0.5 GW of concentrated solar power (CSP) and 0.1 GW of geothermal power.
In the best cases, hydropower and geothermal, both considered mature technologies, are the least expensive means of generating electricity. Onshore wind is also reasonably competitive with fossil fuels, as are, though to a lesser degree, the various applications of biomass. But solar struggles, notwithstanding that costs of PV have already fallen dramatically from a high of $76.67/watt in 1977 (more than half of that by 1980), according to Bloomberg New Energy Finance.6 And yet, The Economist argues that “sunlight has the potential to disrupt the electricity market completely,” accepting the premise of “Swanson’s law” that “the cost of photovoltaic cells needed to generate solar power falls by 20% with each doubling of global manufacturing capacity” and noting that despite accounting for “only a quarter of a per cent of the planet’s electricity supply,” it nevertheless grew 86% in 2011.7
But the fact remains that progress can only sort of be forced, and if Rifkin is right that the emerging paradigm will be “distributed and collaborative,” tighter linkage between government policy and industry investment is sure to be required. Trillions of dollars are said to be needed over the next twenty years to meet the IEA’s recommended targets.
The Economist argues that “sunlight has the potential to disrupt the electricity market completely.”
>
3 Birol, Fatih. “2015: Pricey Delay for Climate Action.” IEA Energy: The Journal of the International Energy Agency. Issue 2. Spring 2012. 37.
4 Rifkin, Jeremy. 2011. The Third Industrial Revolution. Palgrave MacMillan.
5 International Renewable Energy Agency. 2012. Renewable Power Generation Costs in 2012: An Overview. 5-6.
6 The Economist. “Sunny Uplands.” http://www.economist.com/news/21566414-alternative-energy-will-no-longer-be-alternative-sunny-uplands Accessed April 3, 2013.
7 Ibid.
5
6
Conclusion
Introduction
Welcome
Foreword
Contacts
Bridging the cost disparity gap with fossil fuels
Enduring the “shale revolution”
Navigating the subsidy environment
Weighing infrastructure investment
Coming to terms with “energy democratization”
Alternative thinking 2013Renewable energy under the microscope
But pitfalls abound.
Specifically, we see a number of areas where careful planning and decision-making in the near-term will be crucial, including:
•Bridging the cost disparity gap with fossil fuels•Enduring the “shale revolution”•Weighing infrastructure investment •Navigating the subsidy environment•Coming to terms with energy “democratization”
Companies that hope not just to survive but to thrive in a radically transformed but still free and open market – companies that generate and distribute exclusively renewable energy or their component technologies as well as legacy utilities and others whose existing business models are most at risk of disruption – can’t afford to wait until the Third Industrial Revolution is upon them to choose their future.
That time is now.
6
7
Conclusion
Introduction
Welcome
Foreword
Contacts
Bridging the cost disparity gap with fossil fuels
Enduring the “shale revolution”
Navigating the subsidy environment
Weighing infrastructure investment
Coming to terms with “energy democratization”
Alternative thinking 2013Renewable energy under the microscope
Is it that a clear price on carbon has still yet to be set in many countries (notwithstanding the actions of individual provinces or states), including Canada, the US and Brazil? Or is it maybe both?
In truth, it’s even more complex than that, involving fundamentals of supply and demand (which continue to favour fossil fuels), regional variations in availability of component parts and supplies, and basic differences in different countries’ regulatory environments generally.
But carbon prices and subsidies are two of the biggest obstacles to renewables achieving not only grid parity but also parity with fossil fuel costs generally.
Consider Figure 1, overleaf.
It’s clear that the range of costs of the various renewable technologies (on a levelised basis) is wide both on the whole and across regions. Suitability of individual technologies is, thus, intrinsically site-specific.
Fossil fuel-fired electricity generation costs, however (with the exception of diesel), are comparatively fixed and, on average, much less expensive, though not as inexpensive as biomass, hydropower and geothermal in the best cases.
According to the IEA, the primary driver of renewable energy deployment has been climate change mitigation, followed by a drive to increase energy diversification, reduce fossil fuel imports and create jobs.8 In the case of climate change mitigation, establishing a clear price signal on carbon is also key.
It’s a common refrain: What’s keeping the cost of fossil fuels down and renewables up? Is it that oil and gas companies still receive subsidies that dwarf renewables by a wide margin, despite a 2009 commitment by the G20 countries to eliminate these subsidies over the medium-term?
Bridging the cost disparity gap with fossil fuels
>
8 Frankl, Paolo. Spring 2012. “IEA on Energy.” IEA Energy: The Journal of the International Energy Agency. Issue 2. 11.
7
8
Conclusion
Introduction
Welcome
Foreword
Contacts
Bridging the cost disparity gap with fossil fuels
Enduring the “shale revolution”
Navigating the subsidy environment
Weighing infrastructure investment
Coming to terms with “energy democratization”

Alternative thinking 2013Renewable energy under the microscope
A number of countries have made this an imperative, whether through carbon taxes or emissions trading schemes. Several European countries have had carbon taxes in place since the 1990s, including Finland, The Netherlands, Sweden and Norway, to varying degrees of success. Australia’s carbon tax took effect in July 2012 at an initial price per tonne of AUD$F23 – according to Bloomberg New Energy Finance, this has made it so that, despite 54% of its electricity coming from coal, new builds in wind are AUD$80/MWh compared to $143 for coal and $116 for gas.9 China is working on a trading system that it will pilot in select regions while working toward a nationwide approach for the coming years. India has had a tax on coal since 2010, though at the relatively low cost of 50 rupees per tonne. In Canada, the provinces of Quebec and British Columbia both have carbon taxes, while Alberta has had a trading scheme in place since 2006; the federal government, however, has no immediate plans to implement a national system. The US is similarly fragmented, with emissions trading functioning in several states, such as California, but no national system or tax in place.
Setting a price on carbon doesn’t directly reduce the cost of renewable energy as much as it increases the cost of fossil fuel use, thus increasing the attractiveness of non-carbon “alternatives,” assuming appropriate limits on the number of allowances. Earlier this year, for instance, Standard & Poor’s predicted credit downgrades and negative outlooks in the oil sector as a result of an increasingly carbon-constrained future: “First to be affected would be the relatively focused, higher cost producers, and then the more diversified integrated players. In both cases […], the causes would be a decline in operating cash flows, weakening free cash flow and credit measures, along with less certain returns on investment and less robust reserve replacement.”10
As former Saudi oil minister Ahmed Zaki Amani wisely said: “The Stone Age came to an end not for a lack of stones and the oil age will end, but not for a lack of oil.”11
0.50
Diesel-fired electricity cost range
Utility-scale projects
OECD Europe OECD NA Africa Eastern Europe Other Asia China
India Latin America
2011
USD
/Kw
h
Range of fossil fuelpower in O&CD
Wind onshore
0.45
0.40
0.35
0.30
0.25
0.20
0.15
0.10
0.05
0Solar PV – utlity scale
Solar PV – residential/
off grid
Wind – smallscale
Biomass Hydrosmall
Hydrolarge
Geothemal CSP
Figure 1. Levelised cost of energy (LCOE) ranges and weighted averages by region for renewable power generation
technologies, 2012
(Source: IRENA)
>
9 Pasolini, Antonio. February 2013. “Analysts say renewable energy now cheaper option than new fossil fuels in Australia.” Gizmag. http://www.gizmag.com/renewable-energy-cheaper-australia/26193/. Accessed April 10, 2013.
10 Standard & Poor’s Ratings Services. March 2013. What A Carbon-Constrained Future Could Mean for Oil Companies’ Creditworthiness.
8
9
Conclusion
Introduction
Welcome
Foreword
Contacts
Bridging the cost disparity gap with fossil fuels
Enduring the “shale revolution”
Navigating the subsidy environment
Weighing infrastructure investment
Coming to terms with “energy democratization”
Alternative thinking 2013Renewable energy under the microscope
Meanwhile, a 2011 modeling study by Google.org on energy innovation in the US concluded that “breakthroughs in clean energy technologies could meaningfully improve the quality of our lives” and that “getting there will take the right mix of effective policy, a major sustained national investment in innovation by public and private institutions, and the increased mobilization of the private sector’s entrepreneurial energies.”12 In one of the study’s scenarios, where a $30/tonne carbon price was set exclusively on the power sector, it found that, by 2030, US GDP would increase by $53 billion per year, including annual employment growth of 558,000 and a reduction in greenhouse gases of 9%. In that scenario, however, household energy bills also increased by $152 per year. When combined with optimistic breakthroughs in a range of renewable technologies, those annual numbers became $182 billion in increased GDP, 1.5 million new jobs, greenhouse gas reduction of 22% and a decrease in household energy bills of $761.
Not too bad, even while it underscores the point that carbon prices are simply an indirect means to a specific end.
In the case of subsidies, the impacts are direct and sometimes wasteful. An International Institute for Sustainable Development review of several fossil fuel subsidy reform studies found that GDP in both OECD and non-OECD countries could see aggregate increases as high as 0.7% per year to 2050 and CO2 reduction by as much as 18% if subsidies for fossil fuels were phased out.13 For its part, a joint report by the IEA, OPEC, the OECD and the World Bank found that “in most cases, countries reforming fossil fuel consumer subsidies would realise a net economic benefit, measured both in terms of GDP impacts and real income effects.”14
Fossil fuel subsidies in general might not exactly qualify as “reckless and irrational”15 – such as depletion allowances and intangible drilling costs (IDCs) in the US – but on the whole they do appear to be preventing renewable energies from meeting growth objectives and achieving their full potential.
But simply phasing out existing fossil fuel subsidies isn’t a complete approach to bridging the energy cost gap. Other financing measures will also be needed and are being tried. In the US, for instance – where Treasury cash grants for renewable power projects expired at the end of 2011, production tax credits (PTCs) for wind expire at the end of 2013 (after having been extended last year) and investment tax credits (ITCs) for solar expire at the end of 2016 – proposals to allow renewables investment to qualify for tax-advantaged Master Limited Partnerships (MLPs) and Real Estate Investment Trusts (REITs) are currently making the rounds. Their adoption, which is by no means certain, would grow the ranks of renewable energy investors and lead to project financing cost reductions.
As Felix Mormann and Dan Reicher of Stanford University’s Steyer-Taylor Center for Energy Policy and Finance put it: “If renewable energy is going to become fully competitive and a significant source of energy […], then further technological innovation must be accompanied by financial innovation so that clean energy sources gain access to the same low-cost capital that traditional energy sources like coal and natural gas enjoy.”16
That will help.
But technological innovation is fundamental to the growth of renewables, and companies that invest wisely will benefit. Investing time and resources into understanding and leveraging not just energy-specific subsidies but also broader research and development tax programs, such as the ones in Australia, Canada, France and the UK, is also important. Sometimes, there’s more than one route to the finish line.
11 Carlisle, Tamsin. August 21, 2010. “Crude prices have defied expectations before.” The National. http://www.thenational.ae/business/industry-insights/energy/crude-prices-have-defied-expectations-before. Accessed June 7, 2013.
12 Google. July 2011. The Impact of Clean Energy Innovation. Examining the Impact of Clean Energy Innovation on the United States Energy System and Economy.
13 Ellis, Jennifer. March 2010. The Effects of Fossil-Fuel Subsidy Reform: A review of modeling and empirical studies. International Institute for Sustainable Development.
14 IEA, OPEC, OECD, World Bank. 2011. “Joint report by IEA, OPEC, OECD and World Bank on fossil-fuel and other energy subsidies: An update on the G20 Pittsburgh and Toronto Commitments.” http://www.oecd.org/site/tadffss/49006998.pdf. Accessed April 3, 2013.
15 Natural Resources Defense Council, Oil Change International, et al. June 2012. Governments Should Phase Out Fossil Fuel Subsidies or Risk Lower Economic Growth, Delayed Investment in Clean Energy and Unnecessary Climate Change Pollution.
16 Mormann, Felix and Dan Reicher. June 1, 2012. “How to Make Renewable Energy Competitive.” The New York Times. http://www.nytimes.com/2012/06/02/opinion/how-to-make-renewable-energy-competitive.html?pagewanted=all&_r=1&. Accessed March 20, 2013.
9
10
Conclusion
Introduction
Welcome
Foreword
Contacts
Bridging the cost disparity gap with fossil fuels
Enduring the “shale revolution”
Navigating the subsidy environment
Weighing infrastructure investment
Coming to terms with “energy democratization”
Alternative thinking 2013Renewable energy under the microscope
It has been called a “game changer” and “fracking great.” The IEA says a “golden age” is upon us. It is frequently referred to as a “bridge” to an energy future fuelled more by renewables than fossil fuels. Others, less optimistically, have called it a “retirement party” and a bubble waiting to burst.
We’re talking, of course, about the shale gas “revolution” that took root in the US over the past decade and now seems to want to spread internationally. Whether or not it’s ultimately an economic positive depends on who you ask, but one thing is clear: this revolution has created new uncertainty for the near-term investment prospects of renewable energies.
Trapped within the sedimentary rock known as shale, shale (or, sometimes, “tight”) gas was first discovered in the early nineteenth century but didn’t start to become truly viable until the 1970s, when fear of declining conventional oil and gas production prompted the US government to invest in associated research and development, eventually leading to directional drilling and industrial-scale hydraulic fracturing (a.k.a. “fracking”).
Indeed, this “revolution” is very much technological in nature.
Today, continually improving technology and operational procedure has lifted the technically recoverable shale resources in the US from basically nothing in 1990 to roughly 630 trillion cubic feet (Tcf) while, globally, according to an April 2011 US Energy Information Agency (EIA) assessment of 32 countries, total recoverable reserves are estimated to be more than ten times that amount.17
Enduring the “shale revolution”
These developments have radically altered the dynamics of global energy geopolitics, with the US now the largest producer of natural gas in the world and en route to relative energy self-sufficiency within a couple of decades. Not surprisingly, the world has been trying to duplicate the successes seen in the US, though, as we demonstrate in the Deloitte paper Natural Gas: Revolution or evolution?, actual results will vary.18
The immediate concern for renewable energy investors is that the low prices resulting from the glut in supply of shale gas will artificially depress the price of electricity and lower returns while also creating, in gas-fired generation, a staunch competitor for new infrastructure dollars. Deliberation in many US states, meanwhile, over whether to repeal renewable portfolio standards (RPS) are stoking this concern. >
17 U.S. Energy Information Administration. “World Shale Gas Resources: An Initial Assessment of 14 Regions Outside the United States. April 5, 2011. http://www.eia.gov/analysis/studies/worldshalegas/. Accessed April 10, 2013.
18 Deloitte Development LLC. Natural Gas: Revolution or Evolution? http://www.deloitte.com/view/en_us/us/4470cda5e0820310VgnVCM1000001a56f00a
RCRD.htm
10
11
Conclusion
Introduction
Welcome
Foreword
Contacts
Bridging the cost disparity gap with fossil fuels
Enduring the “shale revolution”
Navigating the subsidy environment
Weighing infrastructure investment
Coming to terms with “energy democratization”
Alternative thinking 2013Renewable energy under the microscope
Herein lies the underlying risk of the notion that shale gas can function as a bridge to a low-carbon future, in part because of its cleaner-burning properties when compared to coal for power generation and oil for transportation – that shale will prove so attractive it defers otherwise needed investments in not just renewable energy but other clean technologies such as carbon capture and sequestration (CCS). A study on the influence of shale gas on US energy and environmental policy by the Massachusetts Institute of Technology, for instance, concluded that shale is good for the economy and can aid in climate policy but warned that “it is crucial not to allow the greater ease of the near-term task to erode efforts to prepare a landing at the other end of the bridge.”19
It’s already happening in the US, where the lowered price of wholesale electricity is having a negative impact on the prices of Power Purchase Agreements (PPAs), squeezing return on investment.
There is no easy answer to the question of how to mitigate this risk or otherwise endure the revolution. In some ways, it is unavoidable: growth in the renewable energy sector is not likely to increase while gas prices are as low as they are. In many regions that haven’t benefited from shale, or not yet, renewable energy is becoming more cost-competitive. But make no mistake – everyone wants in on the revolution.
19 Jacoby, Henry et al. 2012. “The Influence of Shale Gas on U.S. Energy and Environmental Policy.” Economics of Energy & Environmental Policy. 1.1: 50.
20 Raynor, Michael. 2007. The Strategy Paradox: Why Committing to Success Leads to Failure (And What to Do About It). Currency/Doubleday.
In the meantime, investors in renewable energy should take a good hard look at building strategic flexibility – the ability to change strategies – into their planning. Much of an organization’s ability to do this will depend on the “constraints”20 imposed by the “commitments” the company has made. But, as Michael E. Raynor says in The Strategy Paradox, “Creating the real options required to implement new, different, effective, commitment-based strategies on a tempo defined by competitive markets can be done only in the spaces beyond constraints.”20 Meaning the onus is on the corporate office rather than individual operating divisions or companies to set the strategy and determine where and how much renewable energy fits into their overall business portfolio.
In the case of renewable energy investment, the approach might simply be to make solar, wind or other forms of renewable energy a small component of your portfolio, thereby positioning the organization to better and more directly understand the industry’s dynamics, including where growth is likely to come, so that you are able to more quickly and more effectively take advantage of emerging opportunities.
11
12
Conclusion
Introduction
Welcome
Foreword
Contacts
Bridging the cost disparity gap with fossil fuels
Enduring the “shale revolution”
Navigating the subsidy environment
Weighing infrastructure investment
Coming to terms with “energy democratization”
Alternative thinking 2013Renewable energy under the microscope
Total global new investment rose 17% in 2011 to US$257 billion and, including large hydropower, was US$40 billion more than net investment in fossil fuels capacity.
In many cases, the key deterrent to investment is the lack of regulatory frameworks suitable to ensuring economic returns. This leads to the question of whether it is more economic to upgrade existing infrastructure, build new facilities on the foundation of the existing infrastructure, or invest in the new infrastructure of the “Third Industrial Revolution.”
Take natural gas. If natural gas dominates new capital projects because of the current low price, that price is sure to rise as demand for the gas increases. And no other singular energy source will be able to make up the difference on its own in ways that are both economically feasible and likely to meet public approval. Coal and nuclear come closest economically, but coal is rightly rejected for being too environmentally problematic and nuclear, especially since the Fukushima Daiichi incident, is under increased security.
In spite of the shale gas hype, in any case, we are not convinced that gas-fired generation will dominate the next round of infrastructure development. Coal is still very much a competitor, as trends in Europe and the US show.
In Europe, carbon emission rights have become sufficiently inexpensive that supply of them has been exceeding demand, leading to positive dark spreads (the difference between the cost of coal and the price paid for coal-fired electricity) and negative spark spreads (the difference between the cost of natural gas and the price paid for gas-fired electricity). Coal use, accordingly, is rising. Indeed, in some areas, gas-fired power plants are being closed and new investments halted.
Weighing infrastructure investment
Not all renewable energy technologies are created equal – at least, not everywhere. But, everywhere, there is sure to be a renewable energy technology that could be readily deployed. According to REN21’s Renewables 2012 Global Status Report, investment in renewables continue to grow across the range of end-use sectors, including power, heating, cooling and transportation.21
>
21 REN21. 2012. Renewables 2012 Global Status Report. (Paris: REN21 Secretariat.)
12
13
Conclusion
Introduction
Welcome
Foreword
Contacts
Bridging the cost disparity gap with fossil fuels
Enduring the “shale revolution”
Navigating the subsidy environment
Weighing infrastructure investment
Coming to terms with “energy democratization”

Alternative thinking 2013Renewable energy under the microscope
A year ago in the US, meanwhile, coal’s share of electricity generation was falling relative to gas. But the latest short-term data from the EIA are showing a reversal of that trend, with a rise in the cost of natural gas relative to coal pushing gas down to 28% of generation in 2013 (from 30.4% last year) and coal up to 39.9% (from 37.4%). Longer-term, in its Annual Energy Outlook 2013, the EIA forecasts natural gas use for US power generation to increase by an average of only 0.8% per year to 2040.22 Over the same period, natural gas use for transportation is also expected to increase, but much more dramatically, from close to 40 billion cubic feet in 2011 to 1 trillion cubic feet in 2040 because the differential between the price of oil and natural gas is expected to remain sufficient to incentivize the use of gas.
(Interestingly, wider-scale implementation of natural gas in vehicles is one of Rifkin’s pillars for the Third Industrial Revolution.)
And while renewables can often also be put in place relatively quickly, or deployed by individual citizens or smaller collectives at smaller-scale and fed-in to the grid where relevant mechanisms allow, coal and gas still have the advantage of being able to provide base load power, which renewables cannot yet do owing principally to the twin problems of intermittency and insufficiently advanced storage capability.
In the broadest sense, then, existing utilities and other conventional energy producers are advised, wherever possible, to pursue strategies that lead to a balanced generation portfolio, not only as investment in a future that is likely to arrive anyway but also to spread risk and ensure that the transition is as painless as possible.
Of course, capital costs also vary significantly across the range of technology options and investment decisions are smart to be grounded almost as much in that fact as in the extent to which a particular resource – tidal or wave energy, for instance – is even available in a given region.
But the single-biggest infrastructure short-term need – today as well as tomorrow, regardless of the price of natural gas or the availability of any one energy source – is the smart grid. In its Smart Grids Technology Roadmap (2011), the IEA says, “The development of smart grids is essential if the global community is to achieve shared goals for energy security, economic development and climate change mitigation.”23 We agree. And we also agree with the IEA when it says that “large-scale, system-wide demonstrations are urgently needed to determine solutions that can be deployed at full scale, integrating the full set of smart grid technologies with existing electricity infrastructure.”24
In other words, the smart grid is at the center of not only today’s infrastructure bottlenecks (owing to incomplete deployment) but also tomorrow’s free and open transmission (once further refined and fully deployed). And it seems the levers of progress are mostly in the control of regulators, who, in Europe, for instance, are currently stalling large-scale investments owing to negative business cases that are expected to achieve little more than increases on distribution tariffs.
Still, according to Worldwatch Institute, smart grid investment grew by 7% in 2012, rising to $13.9 billion, led by the US, China and the European Union. And more is planned: US utilities are estimated to have smart meters installed in 57% of households by 2015; China’s State Grid Corporation has slated $101 billion for smart grid technology through 2020; and the UK is set to begin nationwide installations next year with a goal of seeing meters in all households by 2019.25
These are ambitious plans. It’s possible they could be more ambitious
>
22 U.S. Energy Information Administration. 2013. Annual Energy Outlook 2013. “Market Trends – Natural Gas.” http://www.eia.gov/forecasts/aeo/MT_naturalgas.cfm#natgas_prices. Accessed April 10, 2013.
23 International Energy Agency. 2011. Technology Roadmap: Smart Grids. http://www.iea.org/publications/freepublications/publication/name,3972,en.html. Accessed February 19, 2013.
24 Ibid.
25 Worldwatch Institute. “Smart Grid Technologies Continue to Spread.” http://www.worldwatch.org/smart-grid-technologies-continue-sp read Accessed March 22, 2013.
13
14
Conclusion
Introduction
Welcome
Foreword
Contacts
Bridging the cost disparity gap with fossil fuels
Enduring the “shale revolution”
Navigating the subsidy environment
Weighing infrastructure investment
Coming to terms with “energy democratization”
Alternative thinking 2013Renewable energy under the microscope
(beyond metering infrastructure, for instance, the smart grid will also be dependent on a host of other technologies and systems), but one cannot fly into flying. The fact is smart grid technology can save utilities money, it can save consumers money, and it can save everyone some additional time in which to continue flattening the cost curve for renewable energy technologies across the board. There’s also the more significant benefit that smart grids can help manage the intermittency that has long been renewable energy’s Achilles’ heel. Without this fundamental infrastructure, renewables will simply take longer to scale. Thus we also agree with IRENA’s recommendation that policy makers begin to shift away from supporting specific technologies and focus attention instead on minimizing electricity system costs more generally.26
But every utility, financier and government should be looking at the smart grid opportunity. Not all consumers currently support it, because it currently adds costs to the bill, but the same is effectively true of everything. The smart grid makes everything else possible. So let’s get on it.
Not all consumers currently support it, because it currently adds costs to the bill, but the same is effectively true of everything. The smart grid makes everything else possible.
26 International Renewable Energy Agency. 2012. Renewable Power Generation Costs in 2012: An Overview. 24.
15
Conclusion
Introduction
Welcome
Foreword
Contacts
Bridging the cost disparity gap with fossil fuels
Enduring the “shale revolution”
Navigating the subsidy environment
Weighing infrastructure investment
Coming to terms with “energy democratization”
Alternative thinking 2013Renewable energy under the microscope
According to the Renewables 2012 Global Status Report, at least 118 countries had renewable energy targets in place in early 2012 while 109 countries had renewable power generation policies, of which feed-in tariffs (FITs; in at least 65 countries and 27 states) and renewable portfolio standards (in at least 18 countries and 53 other jurisdictions) are the most common.27
As mentioned earlier in this document, the IEA reported in its 2012 World Energy Outlook that subsidies to fossil fuels in 2011 totaled $523 billion, 30% more than the year before and six times more than subsidies to renewable energy in the same period.28 The International Monetary Fund, meanwhile, estimates that pre-tax subsidies for petroleum products, coal and conventional electricity generation were only $480 billion in 2011 but, on a post-tax basis, were closer to $1.9 trillion.29 In the US alone between 1994 and 2009, subsidies to the oil and gas sector totaled almost $450 billion, 75 times more than the nearly $6 billion given to the renewable energy sector.
In the broader terms of overall investment in clean energy, China and the US unsurprisingly come out on top. According to the 2012 edition of The Pew Charitable Trusts Who’s Winning the Clean Energy Race?, China grew its investment in clean energy by 20% over 2011 to $65 billion last year for “an unsurpassed 30% of the G-20 total.”30 That included 25% of all solar investment, 37% of wind investment and 47% of the remaining clean energy sources. For its part, the US performs well in pure numbers because of the size of its economy generally but is nevertheless considered to underperform relative both to that economic heft and to its record.
In 2012, overall investment in the US was down 37% to $35.6 billion but showed record growth in both wind and solar – 13.6 GW and 3.2 GW, respectively.
Rounding out the rest of the top investment spots were Germany at $22.8 billion, Japan at $16.3 billion, the 27 non-G-20 European countries at a combined $16.3 billion, Italy at $14.7 billion, the UK at $8.3 billion, India at $6.9 billion, South Africa at $5.5 billion and Brazil at $5.3 billion. All told, global investment in clean energy declined to $269 billion in 2012, down 11% from $302 billion the year before, most likely a short-term trend that we expect to reverse as the global economy moves unequivocally out of the slump induced by the 2008 global financial crisis and confidence returns.
Navigating the subsidy environment
>
27 REN21. 2012. Renewables 2012 Global Status Report. (Paris: REN21 Secretariat.)
28 International Energy Agency. World Energy Outlook 2012.
29 International Monetary Fund. January 2013. Energy Subsidy Reform: Lessons and Implications.
30 The Pew Charitable Trusts. 2012. Who’s Winning the Clean Energy Race?
15
16
Conclusion
Introduction
Welcome
Foreword
Contacts
Bridging the cost disparity gap with fossil fuels
Enduring the “shale revolution”
Navigating the subsidy environment
Weighing infrastructure investment
Coming to terms with “energy democratization”
Alternative thinking 2013Renewable energy under the microscope
So which countries present the best bets for renewables investment, given subsidy availability or other financing incentives? It depends on the kind of investment your company is looking to make. For renewable and clean energy, four categories of investment are most relevant, including asset financing, small-scale distributed generation, public market, and the combination of venture capital and private equity. This report cannot hope to describe every mechanism in the world, but individual regions have their strengths relative to those categories.
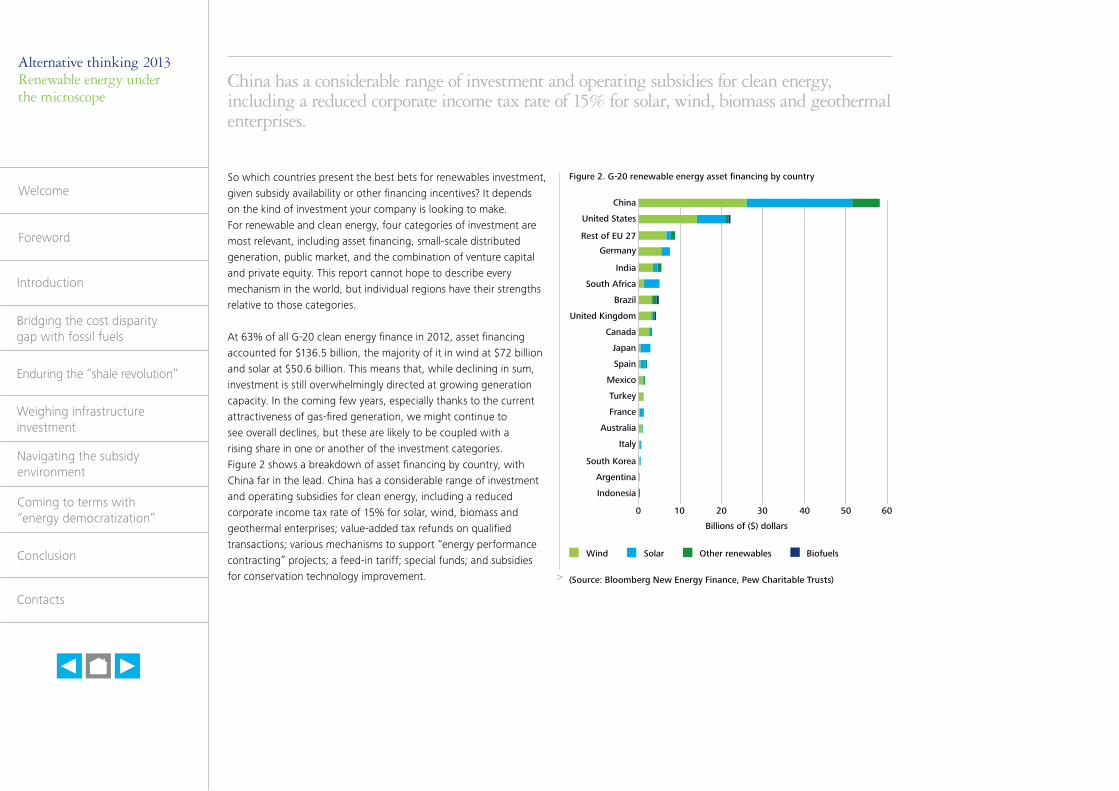
At 63% of all G-20 clean energy finance in 2012, asset financing accounted for $136.5 billion, the majority of it in wind at $72 billion and solar at $50.6 billion. This means that, while declining in sum, investment is still overwhelmingly directed at growing generation capacity. In the coming few years, especially thanks to the current attractiveness of gas-fired generation, we might continue to see overall declines, but these are likely to be coupled with a rising share in one or another of the investment categories. Figure 2 shows a breakdown of asset financing by country, with China far in the lead. China has a considerable range of investment and operating subsidies for clean energy, including a reduced corporate income tax rate of 15% for solar, wind, biomass and geothermal enterprises; value-added tax refunds on qualified transactions; various mechanisms to support “energy performance contracting” projects; a feed-in tariff; special funds; and subsidies for conservation technology improvement.
Figure 2. G-20 renewable energy asset financing by country
(Source: Bloomberg New Energy Finance, Pew Charitable Trusts)
China has a considerable range of investment and operating subsidies for clean energy, including a reduced corporate income tax rate of 15% for solar, wind, biomass and geothermal enterprises.
>
China
United States
Rest of EU 27
Germany
India
South Africa
Brazil
United Kingdom
Canada
Japan
Spain
Mexico
Turkey
France
Australia
Italy
South Korea
Argentina
Indonesia
0 10 20 30
Billions of ($) dollars
Wind Solar Other renewables Biofuels
40 50 60
16
17
Conclusion
Introduction
Welcome
Foreword
Contacts
Bridging the cost disparity gap with fossil fuels
Enduring the “shale revolution”
Navigating the subsidy environment
Weighing infrastructure investment
Coming to terms with “energy democratization”
Alternative thinking 2013Renewable energy under the microscope
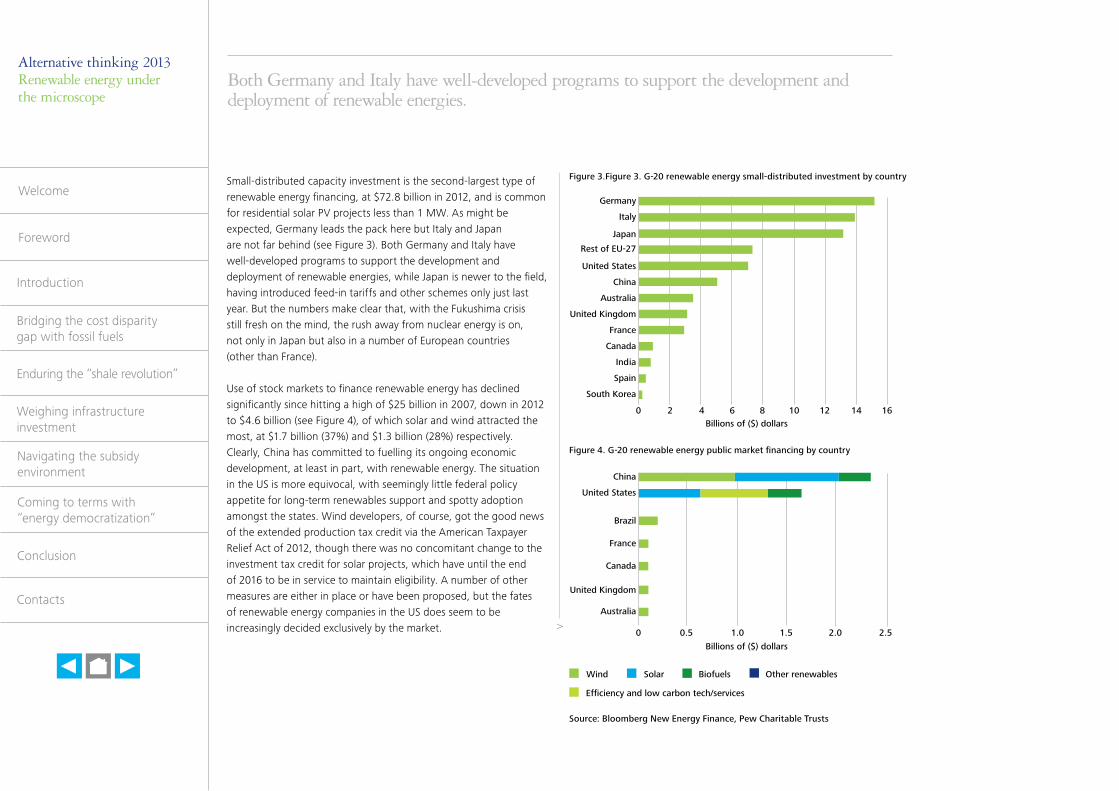
Small-distributed capacity investment is the second-largest type of renewable energy financing, at $72.8 billion in 2012, and is common for residential solar PV projects less than 1 MW. As might be expected, Germany leads the pack here but Italy and Japan are not far behind (see Figure 3). Both Germany and Italy have well-developed programs to support the development and deployment of renewable energies, while Japan is newer to the field, having introduced feed-in tariffs and other schemes only just last year. But the numbers make clear that, with the Fukushima crisis still fresh on the mind, the rush away from nuclear energy is on, not only in Japan but also in a number of European countries (other than France).
Use of stock markets to finance renewable energy has declined significantly since hitting a high of $25 billion in 2007, down in 2012 to $4.6 billion (see Figure 4), of which solar and wind attracted the most, at $1.7 billion (37%) and $1.3 billion (28%) respectively. Clearly, China has committed to fuelling its ongoing economic development, at least in part, with renewable energy. The situation in the US is more equivocal, with seemingly little federal policy appetite for long-term renewables support and spotty adoption amongst the states. Wind developers, of course, got the good news of the extended production tax credit via the American Taxpayer Relief Act of 2012, though there was no concomitant change to the investment tax credit for solar projects, which have until the end of 2016 to be in service to maintain eligibility. A number of other measures are either in place or have been proposed, but the fates of renewable energy companies in the US does seem to be increasingly decided exclusively by the market.
Figure 3.Figure 3. G-20 renewable energy small-distributed investment by country
Both Germany and Italy have well-developed programs to support the development and deployment of renewable energies.
>
Germany
Italy
Japan
Rest of EU-27
United States
China
Australia
United Kingdom
France
Canada
India
Spain
South Korea
0 2 4 6 8Billions of ($) dollars
10 12 14 16
China
United States
Brazil
France
Canada
United Kingdom
Australia
0 0.5 1.0
Billions of ($) dollars
Wind Solar Biofuels Other renewables
1.5 2.0 2.5
Efficiency and low carbon tech/services
Figure 4. G-20 renewable energy public market financing by country
Source: Bloomberg New Energy Finance, Pew Charitable Trusts
17
18
Conclusion
Introduction
Welcome
Foreword
Contacts
Bridging the cost disparity gap with fossil fuels
Enduring the “shale revolution”
Navigating the subsidy environment
Weighing infrastructure investment
Coming to terms with “energy democratization”
Alternative thinking 2013Renewable energy under the microscope
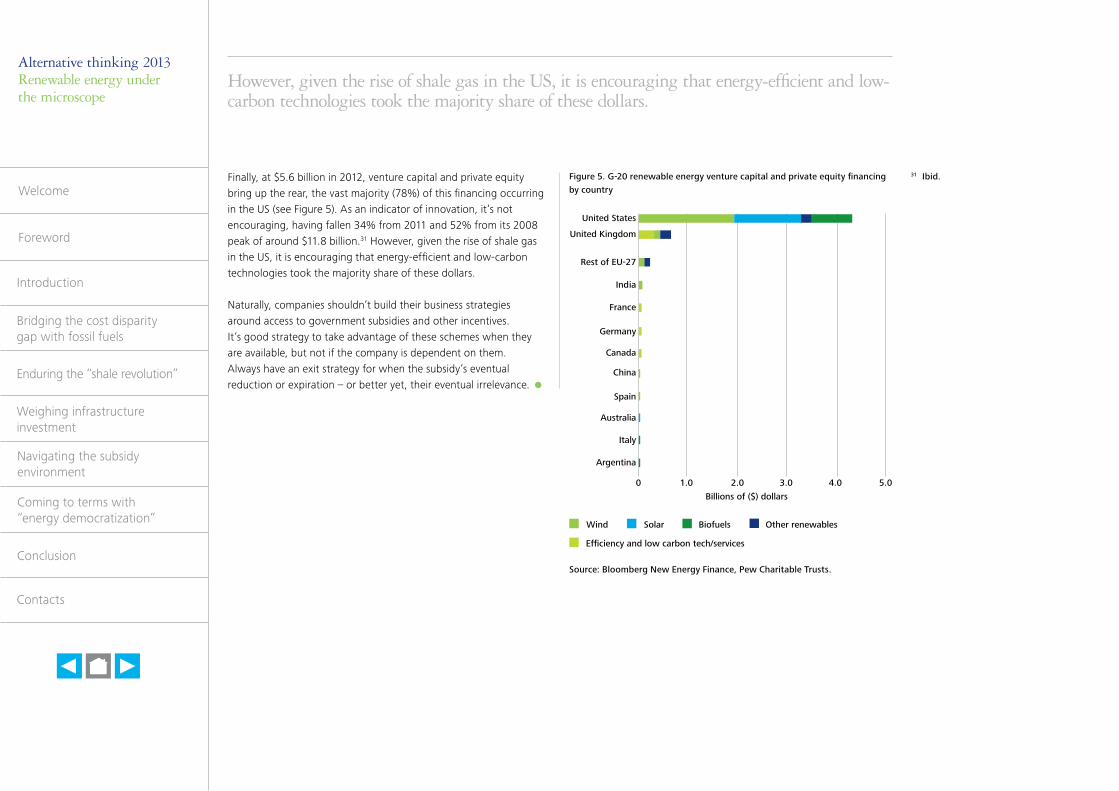
Finally, at $5.6 billion in 2012, venture capital and private equity bring up the rear, the vast majority (78%) of this financing occurring in the US (see Figure 5). As an indicator of innovation, it’s not encouraging, having fallen 34% from 2011 and 52% from its 2008 peak of around $11.8 billion.31 However, given the rise of shale gas in the US, it is encouraging that energy-efficient and low-carbon technologies took the majority share of these dollars.
Naturally, companies shouldn’t build their business strategies around access to government subsidies and other incentives. It’s good strategy to take advantage of these schemes when they are available, but not if the company is dependent on them. Always have an exit strategy for when the subsidy’s eventual reduction or expiration – or better yet, their eventual irrelevance.
Figure 5. G-20 renewable energy venture capital and private equity financing by country
Source: Bloomberg New Energy Finance, Pew Charitable Trusts.
However, given the rise of shale gas in the US, it is encouraging that energy-efficient and low-carbon technologies took the majority share of these dollars.
United States
United Kingdom
Rest of EU-27
India
France
Germany
Canada
China
Spain
Australia
Italy
Argentina
0 1.0 2.0
Billions of ($) dollars
Wind Solar Biofuels Other renewables
3.0 4.0 5.0
Efficiency and low carbon tech/services
31 Ibid.
18
19
Conclusion
Introduction
Welcome
Foreword
Contacts
Bridging the cost disparity gap with fossil fuels
Enduring the “shale revolution”
Navigating the subsidy environment
Weighing infrastructure investment
Coming to terms with “energy democratization”

Alternative thinking 2013Renewable energy under the microscope
In the Deloitte paper Energy’s Next Frontiers: How technology is radically reshaping supply, demand and the energy of geopolitics (2012), we talk about the “Power of One” –“how each and every one of us can become players in the energy game.”32
The concept is effectively identical to Jeremy Rifkin’s notion that the Third Industrial Revolution will consist in the “democratization” of energy, where:
“In the twenty-first century, hundreds of millions of human beings will be generating their own green energy in their homes, offices, and factories and sharing it with one another across intelligent distributed electricity networks – an intergrid – just like people now create their own information and share it on the Internet.”33
It’s not exactly a new idea – advanced metering and the smart grid have been more than conceptual since the late 1990s and early 2000s, having emerged from research into “intelligent flight control systems” conducted by NASA and Boeing in the 1980s amid growing recognition of congestion and inconsistencies that threatened to “overwhelm the system while demand increases for higher reliability and better security and protection.”34 In North America alone, the second half of the 1990s saw an increase of 41% over the first half of the decade in outages affecting 50,000 or more consumers. Ten million people in Canada and 45 million in the US were affected by the 2003 blackout; eight of those people died and an estimated $6 billion in economic activity was lost.
Apart from catastrophic explosions or nuclear meltdown, that’s basically the worst-case scenario, but catastrophe prevention isn’t the only driver of energy democratization and the smart grid. There’s also the fact that existing infrastructure is aging, that electricity demand continues to grow and that consumers demand reliability even as they seek to be protected from the price vagaries of peak demand.
“Smart grid technologies provide an opportunity,” says the IEA in its Smart Grid Technology Roadmap (2011), “to maximise the use of existing infrastructure through better monitoring and management, while new infrastructure can be more strategically deployed.”35 Of course, mechanisms like feed-in tariffs have long been used to enable individuals to install small-scale solar technology at their homes and businesses and sell excess power back into the grid.
Coming to terms with “energy democratization”
>
32 Deloitte Development LLC. Energy’s Next Frontiers: How technology is radically reshaping supply, demand and the energy of geopolitics. http://www.deloitte.com/view/en_US/us/Industries/power-utilities/33163e0c8b57310VgnVCM2000001b56f00aRCRD.htm
33 Rifkin, Jeremy. 2011. The Third Industrial Revolution. Palgrave MacMillan.
34 Amin, S. Massoud and Bruce F. Wollenberg. 2005. “Toward a Smart Grid.” IEEE Power & Energy Magazine. 34-41.
35 International Energy Agency. 2011. Technology Roadmap: Smart Grids. http://www.iea.org/publications/freepublications/publication/name,3972,en.html. Accessed February 19, 2013.
19
20
Conclusion
Introduction
Welcome
Foreword
Contacts
Bridging the cost disparity gap with fossil fuels
Enduring the “shale revolution”
Navigating the subsidy environment
Weighing infrastructure investment
Coming to terms with “energy democratization”
Alternative thinking 2013Renewable energy under the microscope
There is perhaps no better example of the effect of such policies than Germany, where in 2011 half of the country’s 53,000 MW of installed renewable energy was locally-owned.36 Importantly, price is insufficient to guarantee program success. Germany’s Renewable Energy Sources Act makes this explicit and is “as much about the right to connect and sell electricity as it is about the specific payment per kilowatt-hour for each technology.”
That’s a lesson worth learning.
Meanwhile, economists like Rifkin are looking at the long-term possibilities; we are concerned here with the short-term realities. And coming to terms with the “democratization” of energy – at least from the perspective of utilities – is really about business models.
Let’s assume the Third Industrial Revolution is going to happen anyway, that the spirit of democracy is sufficiently strong to transcend the purely political realm. Not everyone will want to participate, but many (maybe most) will. The immediate problem for conventional utilities will be a loss of customers and corresponding reduction in revenues as more and more everyday citizens install solar PV on their houses, commercial building owners do the same with their facilities, and supply chain managers more carefully monitor the carbon footprints of their vendors. But utilities are still going to be the best sources of information and knowledge on how to manage power generation and use.
In another Deloitte paper, Every company is an energy company (and if it isn’t, it will be soon), we say that “there’s no reason for companies to wait a decade – or even a year – to move toward an energy strategy.”37 That discussion was mostly about the rising imperative for companies of all kinds to dedicate time and resources to better understand and manage their energy use while also looking at opportunities to generate their own energy. But the lesson applies equally well to conventional energy companies, not only in the straight-forward terms of how they manage and sustain their existing generation and/or distribution businesses, but also the more speculative terms of how they will manage the transition to a market where centralized power generation and distribution is less in demand.
It could begin with the adoption of residential-scale infrastructure supply and installation services, creating new customers out of the old. From there, energy management consultants and efficiency specialists can help those new customers optimize their systems, while those who are also interested and/or able to generate enough power to sell back to the grid will depend to varying degrees on software developers, data managers, systems managers and control engineers – all of which, with specializations in energy, the utility could provide.
The desire of everyday citizens to more fully participate in the energy value and supply chains is bound to be offset by their comparative lack of knowledge and experience in managing energy systems. And, in a more energy-interconnected world where that knowledge and experience do in fact exist, the opportunities to build a business on them could well be limitless.
36 Institute for Local Self-Reliance. “Half of Germany’s 53,000 Megawatts of Renewable Energy is Locally Owned.” http://www.ilsr.org/half-germanys-53000-megawatts-renewable-energy-locally-owned/ Accessed April 2, 2013.
37 Deloitte Development LLC. Every company is an energy company (and if it isn’t, it will be soon). http://www.deloitte.com/view/en_US/us/Services/additional-services/deloitte-sustainabilityde5f70f1ba25e210VgnVCM1000001a56f00aRCRD.htm
20
21
Conclusion
Introduction
Welcome
Foreword
Contacts
Bridging the cost disparity gap with fossil fuels
Enduring the “shale revolution”
Navigating the subsidy environment
Weighing infrastructure investment
Coming to terms with “energy democratization”
Alternative thinking 2013Renewable energy under the microscope
Conclusion
While the road for renewable energy is likely to remain rough for some time, we have by no means come to its end. And anyway, even rough roads are traversable with the right preparation; just remember to keep an eye out for ruts and other impediments along the way.
For instance, subsidies and further technological refinement and innovation are going to continue to be needed in the short- to medium-term – take advantage of the subsidies where possible, but have an exit strategy that plans for an eventual phase out. The current low cost of natural gas in North America and the hope of this dynamic spreading globally will also suppress investment in renewables for the short-term, but this is expected to ease as gas prices correct with rising demand.
Longer-term, governments unwilling to give up on the promise of clean, secure, plentiful energy will continue to look for ways to encourage innovation and growth in renewables. Choosing, for instance, not to capitalize on the fact that the sun alone delivers more energy to the Earth in an hour than we need in a year simply won’t be an option for an increasing number of countries and states. Meanwhile, energy democratization will continue to spread – or the desire for it will, at least. This trend is a threat only to organizations unable or unwilling to adapt to an evolving market. Though the need for centralized energy generation is not about to disappear overnight, forward-thinking utilities, investors, and developers will see the opportunities to be had in smaller scale, decentralized power production from renewable sources and will adjust their strategies accordingly.
Much also rests on how fast and how thoroughly the smart grid matures. As noted, the smart grid is foundational – the more quickly it is fully deployed, the more quickly its ability to manage intermittency and peak demand will help more of the otherwise diffuse renewable energy technologies reach scale and grid parity while improving returns on investment in those technologies at the same time. It would be difficult to overstate the extent to which “everyone wins” with the smart grid.
If you’re invested in an energy future that is more renewable, now is not the time to turn back. For some organizations, however, it might be wise to slow down, or diversify the portfolio – because, ultimately, it’s not going to get any easier anytime soon. Then again, nothing much of worth ever came easy, and nothing much of lasting value ever came without the determination to make it so.
21
22
Conclusion
Introduction
Welcome
Foreword
Contacts
Bridging the cost disparity gap with fossil fuels
Enduring the “shale revolution”
Navigating the subsidy environment
Weighing infrastructure investment
Coming to terms with “energy democratization”

Alternative thinking 2013Renewable energy under the microscope
Contacts
AfricaShamal SivasankerJohannesburg, South Africa(also covers Angola and Djibouti)+27 [email protected]
Bill PageKampala, Uganda (also covers Kenya, Tanzania and Mozambique)+255 767 200 [email protected]
Ahmed BenabdelhalekCasablanca, [email protected]
Olufemi (Femi) AbegundeLagos, Nigeria (covers Ghana)[email protected]
AsiaDebasish MishraMumbai, India+91 22 6185 [email protected]
Kappei IsomataTokyo, Japan+ 81 92 751 [email protected]
Kessara Sakmaneevongsa Bangkok, Thailand+ 66 26765700 ext.6421 [email protected]
Ali HeryJakarta, Indonesia+ 62 21 2312879 [email protected]
Nizar NajibKuala Lumpur, Malaysia+60 3 7723 [email protected]
AustraliaKumar PadisettiMelbourne, Australia+61 3 9671 [email protected]
Brad PollockSydney, Australia+61 2 9322 [email protected]
Central America Daniel AguinagaMexico City, Mexico+52 55 [email protected]
Gustavo EisenmannPanama City, Panama+507 3034100, ext. 4175 [email protected]
Middle EastKenneth McKellarSaudi Arabia+966 3 [email protected]
Declan HayesDubai, UAE+971 4 [email protected]
Gil WeissTel-Aviv, Israel+972 3 [email protected]
Tim BullockAbu Dhabi, UAE (covers Kuwait)+971 2 408 [email protected]
Wafik HannaCairo, Egypt+20 2 2290 [email protected]
Dr. Marc NassimDubai, UAE (covers Jordan)+971 4 [email protected]
EuropeUygar YorukAnkara, Turkey+90 312 295 [email protected]
Sibel CetinkayaAnkara, Turkey+90 312 213 [email protected]
Farrukh Khan Bucharest, Romania+40 (21) 2075 [email protected]
Dean CookLondon, England+44 20 7007 [email protected]
Gert VanheesBrussels, Belgium+32 2 800 22 [email protected]
Javier AcevedoMadrid, Spain+915 145 [email protected]
22
23
Conclusion
Introduction
Welcome
Foreword
Contacts
Bridging the cost disparity gap with fossil fuels
Enduring the “shale revolution”
Navigating the subsidy environment
Weighing infrastructure investment
Coming to terms with “energy democratization”

Alternative thinking 2013Renewable energy under the microscope
North AmericaJane AllenCanada+1 [email protected]
Richard LongstaffDirector, Emerging MarketsArlington, Virginia+1 412 402 [email protected]
Marlene MotykaPrincipal, Financial Advisory ServicesNew York City, NY+1 212 436 [email protected]
South AmericaJaime RetamalSantiago, Chile+56 [email protected]
Daniel AguinagaMexico City, Mexico+52 55 [email protected]
Byron MartinezGuatemala City, Guatemala+502 23846500, [email protected]
Iara Pasian Sao Paulo, Brazil+55 11 5186 [email protected]
Jose B. OrtegaMendoza, Argentina+261 438 [email protected]
23
24
Conclusion
Introduction
Welcome
Foreword
Contacts
Bridging the cost disparity gap with fossil fuels
Enduring the “shale revolution”
Navigating the subsidy environment
Weighing infrastructure investment
Coming to terms with “energy democratization”

© 2013 Deloitte Global Services Limited
Deloitte refers to one or more of Deloitte Touche Tohmatsu Limited, a UK private company limited by guarantee, and its network of member firms, each of which is a legally separate and independent entity. Please see www.deloitte.com/about for a detailed description of the legal structure of Deloitte Touche Tohmatsu Limited and its member firms.
Deloitte provides audit, tax, consulting, and financial advisory services to public and private clients spanning multiple industries. With a globally connected network of member firms, Deloitte brings world-class capabilities and deep local expertise to help clients succeed wherever they operate. Deloitte’s approximately 195,000 professionals are committed to becoming the standard of excellence.
This publication contains general information only, and none of Deloitte Touche Tohmatsu Limited, any of its member firms or any of the foregoing’s affiliates (collectively the “Deloitte Network”) are, by means of this publication, rendering accounting, business, financial, investment, legal, tax, or other professional advice or services. This publication is not a substitute for such professional advice or services, nor should it be used as a basis for any decision or action that may affect your finances or your business. Before making any decision or taking any action that may affect your finances or your business, you should consult a qualified professional adviser. No entity in the Deloitte Network shall be responsible for any loss whatsoever sustained by any person who relies on this publication.
Designed and produced by The Creative Studio at Deloitte, London. 27560A
19
25