renewable energy projects handbook - world energy · pdf file1.2 leading renewable energy...
TRANSCRIPT
Renewable Energy Projects Handbook
APRIL 2004

RENEWABLE ENERGY PROJECTS HANDBOOK
Copyright 2004 World Energy Council
All rights reserved. No part of this publication may be reproduced, stored in a retrieval system or transmitted in any form or by any means electronic, electrostatic, magnetic, mechanical, photocopy, recording or otherwise, without prior permission of the copyright holder.
Published April 2004 by: World Energy Council 5th Floor, Regency House 1-4 Warwick Street London W1B 5LT United Kingdom www.worldenergy.org ISBN 0 946121 12 5

iii
ACKNOWLEDGEMENTS
WEC wishes to express gratitude to Mr Michael Lax who drafted this Handbook based on research and analysis carried out by the WEC Renewables Committee over the last two years under the guidance of Dr Chris Morris, the Committee’s Chairman, as well as Ms Elena Nekhaev. All Committee Members are thanked for their input and comments. Special thanks go to Mrs Ida Hurwitz of ORMAT, who contributed greatly to the typing and editing of this document.

iv
Officers of the World Energy Council
Antonio del Rosario Norberto de Franco Medeiros Chair World Energy Council Chair Programme Committee
Philip Aiken Shige-etsu Miyahara Vice Chair Sydney 2004 Vice Chair Asia
François Ailleret Kieran O’Brien Chair Studies Committee Vice Chair Europe
Asger Bundgaard-Jensen Fred Phaswana Vice Chair Finance Vice Chair Africa
John Derrick Carlos Pierro Vice Chair North America Vice Chair Latin America/Caribbean
Alioune Fall Gerald Doucet Vice Chair GEIS Initiative Secretary General
Member Committees of the World Energy Council
Algeria Angola Argentina Australia Austria Bangladesh Belarus Belgium Bolivia Botswana Brazil Bulgaria Cameroon Canada China Congo (Dem. Rep.) Côte d’Ivoire Croatia Czech Republic Denmark Ecuador Egypt (Arab Rep.) El Salvador Estonia Ethiopia Finland France Gabon Georgia Germany Ghana Greece
Guinea Hong Kong, China Hungary Iceland India Indonesia Iran (Islamic Rep.) Ireland Israel Italy Japan Jordan Kenya Korea (Rep.) Latvia Lebanon Libya/GSPLAJ Lithuania Luxembourg Macedonia (Rep.) Mali Mexico Monaco Mongolia Morocco Namibia Nepal Netherlands New Zealand Niger Nigeria Pakistan
Paraguay Peru Philippines Poland Portugal Romania Russian Federation Saudi Arabia Senegal Serbia & Montenegro Singapore Slovakia Slovenia South Africa Spain Sri Lanka Swaziland Sweden Switzerland Syria (Arab Rep.) Taiwan, China Tanzania Thailand Trinidad & Tobago Tunisia Turkey Ukraine United Kingdom United States Uruguay Venezuela Yemen
v
TABLE OF CONTENTS Page
ACKNOWLEDGEMENTS ............................................................................................................................ iii
WEC OFFICERS AND MEMBER COMMITTEES................................................................................... iv
FOREWORD ................................................................................................................................................... vii
1 RENEWABLES IN THE GLOBAL ENERGY ECONOMY: TODAY AND TOMORROW ... 1
1.1 Introduction ......................................................................................................................................... 1 1.2 Leading Renewable Energy Resources ............................................................................................... 3 1.2.1 Biomass ............................................................................................................................................ 3 1.2.2 Wind ................................................................................................................................................. 6 1.2.3 Geothermal ....................................................................................................................................... 10 1.2.4 Solar.................................................................................................................................................. 12 1.2.5 Hydropower ...................................................................................................................................... 14 1.2.6 IHRP ................................................................................................................................................. 15 1.3 Electrical Energy Storage Systems...................................................................................................... 16 1.4 Resources and Technology Summaries............................................................................................... 17 1.5 Policies, Economics, Social Considerations and Environment ........................................................... 18
2. FINANCIAL, TECHNICAL & OTHER CRITERIA FOR SELECTING AND EVALUATING RENEWABLE ENERGY PROJECTS ............................................................... 25
2.1 Resource Availability ......................................................................................................................... 25 2.2 Cost-Effectiveness, Affordability, Profitability, Subsidies ................................................................ 30 2.3 Development, Installation and O & M ................................................................................................ 34 2.4 Social and Environmental Aspects...................................................................................................... 36 2.5 Risk Analysis and Risk Management.................................................................................................. 38 2.6 Development of Local Expertise ......................................................................................................... 39 2.7 Stakeholders' Buy-in ........................................................................................................................... 39
3. STRATEGIES FOR SUCCESS ....................................................................................................... 41
3.1 Specific Steps for Renewable Energy Categories ............................................................................... 43 3.2 Renewable Energy in Developing Countries....................................................................................... 45 3.3 WEC Action Plan ................................................................................................................................ 45
4. PROJECT CHECK LIST................................................................................................................. 47
4.1 Evaluation, Selection of Technology, Financing Options, Project Documentation ............................ 47 4.2 Policy for Promotion of Renewables................................................................................................... 50 4.3 Cost Evaluations.................................................................................................................................. 70 4.4 Inclusion of Externalities..................................................................................................................... 77 WEC STUDY COMMITTEE MEMBERSHIP ........................................................................................... 78
LIST OF ACRONYMS & ABBREVIATIONS ........................................................................................... 79
LIST OF FIGURES & TABLES .................................................................................................................... 80
BIBLIOGRAPHY............................................................................................................................................ 81
ANNEX 1 Companies/Organisations in Different Renewables Categories
ANNEX 2 Resource Information
ANNEX 3 Country Information
ANNEX 4 British Petroleum’s Green Glossary
vii
F O R E W O R D
As part of the World Energy Council’s Technical Work Programme 2002-2004 a new Committee on Renewables was established. The Committee’s focus is on mainstream renewable resources: modern biomass, wind, solar, geothermal, hydro, and industrial waste heat (as a novel approach to industrial energy efficiency). Interest in renewable energy resources is burgeoning globally and many publications already exist. It was the intention of the Committee at its outset to bring together global information that would add value and support a more sustainable future for generations to come. It was agreed that this could be best done by examining the barriers and success factors relating to each technology, in general and in different economic contexts: developed and developing countries. The target audience is intended to be broad and should help politicians, financial institutions, consumers, media, regulators and industry leaders to see what is needed to promote a sustainable future, and the barriers that need to be overcome. Using this handbook and the associated information on the WEC’s Global Energy Information System (GEIS) the World Energy Council will actively contribute to the promotion of renewable energy as part of its mission to achieve the sustainable supply and use of energy for the greatest benefit of all. This Report is formally a report of WEC’s Committee on Renewables and our thanks go to all who contributed via debate and discussions at Committee meetings, and written contributions on case studies and drafts. However the majority of the underlying work and drafting was undertaken by Committee member, Mr Michael Lax and our special thanks go to him. Without his substantial and sustained efforts and general support from the WEC’s London Secretariat, in particular Ms Elena Nekhaev, Director of Programmes this report would not have been possible.
Dr Christopher W Morris, Chair (2001-2003) WEC Committee on Renewables
World Energy Council Renewable Energy Projects Handbook
1
1. RENEWABLES IN THE GLOBAL ENERGY ECONOMY: TODAY AND TOMORROW
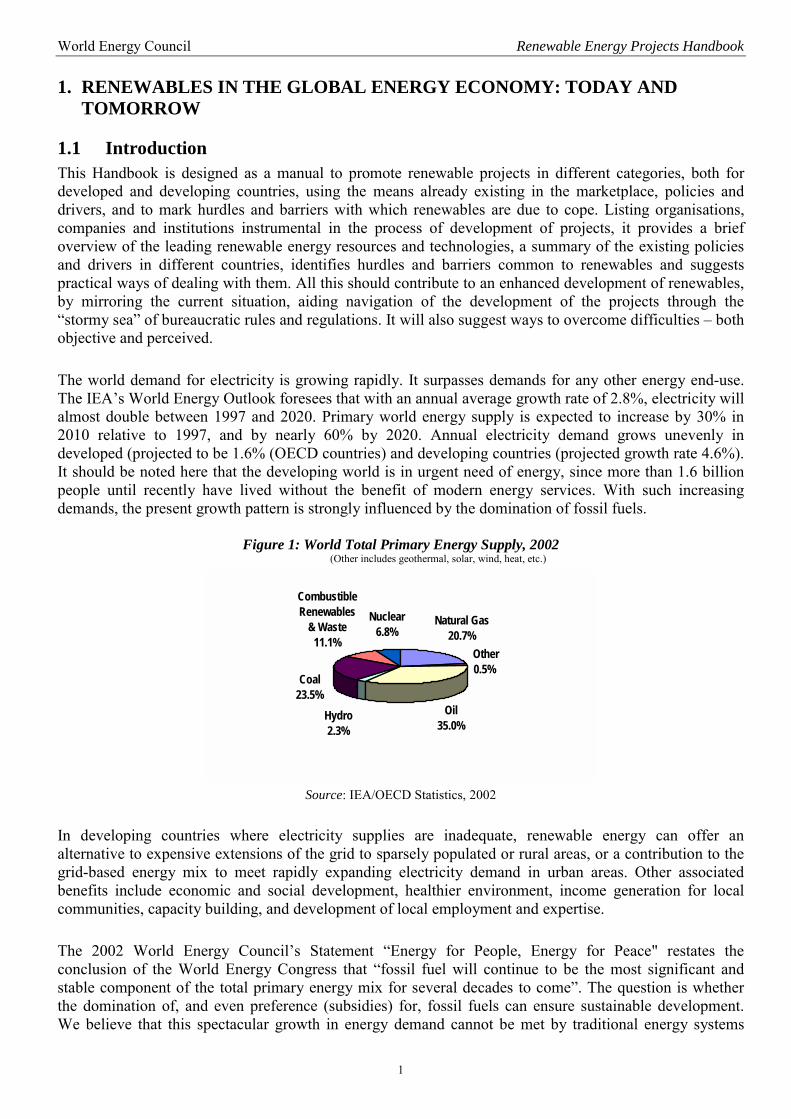
1.1 Introduction This Handbook is designed as a manual to promote renewable projects in different categories, both for developed and developing countries, using the means already existing in the marketplace, policies and drivers, and to mark hurdles and barriers with which renewables are due to cope. Listing organisations, companies and institutions instrumental in the process of development of projects, it provides a brief overview of the leading renewable energy resources and technologies, a summary of the existing policies and drivers in different countries, identifies hurdles and barriers common to renewables and suggests practical ways of dealing with them. All this should contribute to an enhanced development of renewables, by mirroring the current situation, aiding navigation of the development of the projects through the “stormy sea” of bureaucratic rules and regulations. It will also suggest ways to overcome difficulties – both objective and perceived. The world demand for electricity is growing rapidly. It surpasses demands for any other energy end-use. The IEA’s World Energy Outlook foresees that with an annual average growth rate of 2.8%, electricity will almost double between 1997 and 2020. Primary world energy supply is expected to increase by 30% in 2010 relative to 1997, and by nearly 60% by 2020. Annual electricity demand grows unevenly in developed (projected to be 1.6% (OECD countries) and developing countries (projected growth rate 4.6%). It should be noted here that the developing world is in urgent need of energy, since more than 1.6 billion people until recently have lived without the benefit of modern energy services. With such increasing demands, the present growth pattern is strongly influenced by the domination of fossil fuels.
Figure 1: World Total Primary Energy Supply, 2002 (Other includes geothermal, solar, wind, heat, etc.)
Nuclear6.8%
CombustibleRenewables
& Waste11.1%
Coal23.5%
Hydro2.3%
Oil35.0%
Natural Gas20.7%
Other0.5%
Source: IEA/OECD Statistics, 2002
In developing countries where electricity supplies are inadequate, renewable energy can offer an alternative to expensive extensions of the grid to sparsely populated or rural areas, or a contribution to the grid-based energy mix to meet rapidly expanding electricity demand in urban areas. Other associated benefits include economic and social development, healthier environment, income generation for local communities, capacity building, and development of local employment and expertise. The 2002 World Energy Council’s Statement “Energy for People, Energy for Peace" restates the conclusion of the World Energy Congress that “fossil fuel will continue to be the most significant and stable component of the total primary energy mix for several decades to come”. The question is whether the domination of, and even preference (subsidies) for, fossil fuels can ensure sustainable development. We believe that this spectacular growth in energy demand cannot be met by traditional energy systems
World Energy Council Renewable Energy Projects Handbook
2
alone without strongly increasing the pressure on reserves of natural resources, environment, public health/welfare and relations between nations. Renewable energy is closely associated with the concept of sustainable development introduced to the broad public in the report “Our Common Future” published in 1987 by the World Commission on Environment and Development chaired by Gro-Harlem Brundtland. The concept is defined in the report as: “Sustainable development is development that meets the needs of the present without compromising the ability of future
generations to meet their own needs.”
The World Energy Council, in its publication “Energy for Tomorrow’s World – Acting Now!” (ETWAN), has translated the challenges for sustainable energy development into three goals of accessibility, availability and acceptability. Accessibility requires provision of reliable and affordable energy services for all, availability addresses the quality and reliability of the service, stressing its long-term continuity determined by the right energy mix, while acceptability addresses environmental goals and public attitudes. To ensure development according to these principles of sustainable development, renewable energy is expected to provide an increasingly important contribution to supply diversification, emissions reduction and energy sustainability over the longer term. Renewable energies have a huge potential and can, theoretically, provide an unlimited supply of relatively clean and mostly local energy. In absolute terms, renewable energy supply has been growing strongly; albeit from a very low base. The annual growth for wind, for example, has in recent years been over 30%. In relative terms, on the other hand, the share of renewables, including large hydro, in the total primary energy supply has been around 14% for many years. Renewable is a term used for forms of energy which are not exhausted by use over time. It means that the renewable resources can be regenerated or renewed in a relatively short time. This Handbook focuses on the following leading renewable resources: biomass, wind, geothermal, solar and hydro. Industrial heat recovery power (IHRP) is a fairly novel approach to improving industrial energy efficiency by means of power generation, and in the US it is now included in the Renewable Energy Portfolio Standards. The sources of renewable energy can be divided, according to their origin, into natural renewable resources (wind, geothermal, solar, hydro, etc.) and renewable resources resulting from human activity (biomass, including landfill gas and industrial heat recovery power).
Modern biomass encompasses a range of products derived from photosynthesis and is essentially a chemical solar energy storage. It also represents a renewable storage of carbon in the biosphere. Wind energy is a result of thermal heating of the earth by the sun, having global patterns of a semi continuous nature. Geothermal energy refers to heat stored beneath the surface of the earth. It originates from the earth’s molten interior and the decay of radioactive materials. Solar energy is a result of radiation from the sun. Industrial waste heat is a result of unused heat streams from industrial processes. This source can be tapped in different configurations – gases, condensing vapours, fluids or hot oils. The resource is renewable in the sense that it does not deplete primary energy resources. Small hydro is power harnessed from small (capacity <10 MWe ) rivers and streams. The definition “new renewables” usually includes modern biomass, small hydro, geothermal, wind, solar and marine energy. Generally, WEC considers all hydropower as a renewable energy resource. However, the majority of tables in this Handbook refer to small hydro (<10 MW), to make it more comparable with the “new renewables”. Since wave and tidal energy renewable resources are scarcely implemented, they are not considered in this Handbook. By definition, renewables should provide a continuous and unlimited supply of energy. However, technical difficulties, the intermittent nature of some of the renewable energy resources, as well as other constraints still pose limits to their wider deployment. With installed electric power capacity in developed countries now exceeding 1.8 million MW, of which only about 40,000 MW is renewable energy, 98% of electricity is generated by conventional technologies (fossil fuel, nuclear, large hydro) while the share of new renewables is approximately 2%.
World Energy Council Renewable Energy Projects Handbook
3
The alternative scenario of the IEA World Energy Outlook 2000 projects that if OECD countries were to adapt new policies to encourage further use of renewables, their share in the electricity mix could increase from 2% in 1997 to 8.6% of electricity output in 2010 (590TWh). This corresponds to providing an additional 150 million people with renewable electricity in 10 years (assuming approximately 3,000 kWh per person per year for residential electricity needs in 2012). This would require an additional 160,000 to 180,000 MW of renewable energy capacity, representing capital investments of US $90-120 billion. As for the developing countries, the World Bank evaluates their needs for the next four decades as 5 million MW of electrical generating capacity. By 2010, IEA projections expect that investments for renewable energy in developing countries could exceed US $5 billion per year. However, these evaluations and projections were undertaken on a “business as usual” basis. A slight acceleration, and recently we have witnessed serious attempts to accelerate the development of renewable energy, can contribute to even more spectacular growth. 1.2 Leading Renewable Energy Resources Renewables are an almost unlimited supply of energy if one considers the energy required by mankind, compared with the extremely large amount of energy we receive from the sun. Modern energy services require the growing inclusion of renewable energy into the sustainable energy mix. A brief summary of the actual utilisation of renewable energy follows, together with the potential of various categories of renewables for future developments.
The technologies used for conversion of renewable energy sources to heat, electricity and/or fuels are plentiful. Their development has contributed to the gradual lowering of technology prices on the one hand, and to improvement in their efficiency on the other. Gradually renewable energy and its different energy conversion technologies have become economically viable, capable of competing with fossil-fuelled technologies in the energy market. 1.2.1 Biomass Biomass resources suitable for energy production covers a wide range of materials, from firewood collected in farmlands and natural woods to agricultural and forestry crops grown specifically for energy production purposes. It includes timber processing residues, solid municipal waste and sewage, aquatic flora, etc. Biomass can be divided into four sub-categories: • wood, logging and agricultural residue • animal dung • solid industrial waste • landfill biogas. The potential of landfill gas is dependent on environmental considerations and waste management practices. The potential available for exploitation increases as controlled landfill replaces other dumps and uncontrolled tipping. It is estimated that the global potential for landfill gas use by the year 2010 will be equivalent to 9,000 MWe. Biomass is one of the renewable sources capable of making a large contribution to the future world energy supply. Forms in which biomass can be used for energy are diverse:

World Energy Council Renewable Energy Projects Handbook
4
Table 1: Types of bioenergy supply
Residues Costs/Remarks
1. Primary Residues material from primary biomass production, especially forestry, agricultural crops, animal raising • Residues arising in concentrated form [dung from stalled livestock; harvested cereal
straws, stalks, husks] ............................................................................................................ • Residues that must be gathered together [dung from grazing livestock; crop residues
which are not normally harvested such as cotton and maize stalks] .....................................
low or negative low to medium
2. Secondary residues material from processing wood, food and other organic materials, usually in concentrated form [sawmill bark, chips, sawdust; liquors in paper manufacture].
low or negative (avoided disposal costs)
3. Tertiary residues wastes arising after the consumption of biomass [sewage, municipal sold wastes, landfill gas]
low to medium
Natural Resources
4. Biomass gathered from natural resources [fallen tree branches, woody weeds, shrubs] low to high
Energy Crops
5. Dedicated energy crops biofuels as sole or principal product [trees, grasses inc. sugarcane, sweet sorghum, starchy roots, oil crops] • not replacing conventional crops e.g. on field boundaries, “waste” land............... • replacing conventional crops..................................................................................
medium to high employment usually: - increased - reduced
6. Biofuel co-production pre-planned multi-output production including biofuels [sugarcane to produce sugar, ethanol, electricity; timber or tree-fruit production designed to deliver thinnings and harvest wastes as biofuels]
low to medium
Note: Broadly speaking, the potential size of biomass resources and risks associated with their production increases as one moves from the top to the bottom of the table
Source: Shell Foundation, Using modern bioenergy.p.7
Availability of these sources would vary, depending on their attractiveness to the end user. It should be remembered that biomass differs markedly from conventional fuels and other renewable energy resources by having a wide range of competing uses (e.g. food, fodder, fibre, agricultural fertilisers, fuels, etc.). In many places, some types of biomass are less valuable as a source of energy than as sources fulfilling other needs.
Biomass production requires land. The net energy production per hectare of various crops depends on climatic and soil conditions. Land availability for biomass production should not be a bottleneck provided it is combined with modernisation of conventional agricultural production. Bioenergy is very land intensive. One may expect an electrical output of about 20 MWh from each hectare committed to growing biomass (assuming annual production of 15 dry tons of biomass per hectare, 19.2 GJ per dry ton and conversion to electricity at 25%).
The potential of landfill gas to energy schemes is dependent on environmental considerations and changes in waste management practices. The potential available for exploitation will increase as controlled landfill replaces other dumps and uncontrolled tipping. It is estimated that the global potential for landfill gas use by the year 2010 will be equivalent to 9,000MWe.
Preliminary Resource Assessment will take into account the following parameters: • Local conditions, both physical and socio-economic • Crop availability, land conditions, local climatic conditions • Local stock and flow of biomass resources • Amount of biomass source to apply adequate conversion technology • Affordable biomass supplies for long-term project sustainability • Alternative use for the biomass source • Evaluation of energy resource alternatives
World Energy Council Renewable Energy Projects Handbook
5
Mainstream Technologies for Biomass The technologies used to convert biomass into energy range from simple open fires for cooking in developing countries to sophisticated pyrolysis units producing solid, liquid and gaseous fuels. The modern biomass conversion technologies can be separated into three basic categories:
• direct combustion processes • thermo chemical processes • biochemical processes
Heat from biomass Combustion of biomass for steam is used globally: advanced domestic heaters or district heating, with heat efficiencies of over 70% and with strongly reduced atmospheric emissions are widely used in Scandinavia, Austria and various Eastern European countries.
Production of liquid and gaseous fuels from biomass Pyrolysis converts biomass (at temperatures of about 500ºC) to liquid bio oil, gaseous and solid
(charcoal) fractions. Ethanol is produced via fermentation of sugar in a classic conversion of sugar cane, maize and corn. Esters from oilseed: Oilseed, like rapeseed, can be converted to esters to replace diesel. Methanol production using gasification technology and traditional syngas conversion & hydrogen processes, could offer an attractive longer-term conversion route for biomass.
Electricity from biomass It should be noted that biomass is not used primarily for electricity generation. Direct use for heating and bio-fuels for transportation is widespread, mainly in developing countries. The potential of biomass is very large, and some forecasts up to 2025 envisage approximately 2.6 Gtep based on biogas energy. At present biomass accounts for 10-14% of the world’s energy supply. The largest contribution – an average of about 33% - is found in developing countries, whereas in industrialised countries the contribution of biomass is an average of about 3%. The increasing use of biomass should, however, be carefully balanced with the risks of deforestation.
Combustion of biomass for electricity generation is widespread across the world. Advanced combustion technologies, such as the application of fluidised bed combustion and advanced gas cleaning allow efficient production of electricity and heat in Combined Heat and Power installations (CHP). Within the range of about 50-80 MWe, electrical efficiencies of 30-40% are possible today. Hybrid systems combining biomass with natural gas or coal can provide economies of scale, as well as reduce fuel supply disruption risks.
Gasification technologies can be used to convert biomass into fuel gas. The gas must be cleaned prior to combustion in gas turbines or diesel engines.
Biomass integrated gasification/combined cycle systems (BIG/CC) combine flexibility of final characteristics with a high electrical efficiency. Electrical conversion efficiencies up to 40% are possible on a scale of about 30 MWe on the short term.
A Princeton University study forecasts that the biomass-integrated gasifiers/steam-injected gas turbine (BIG/STIG) technology will compete with conventional coal, nuclear and hydroelectric power in both developed and developing countries.
Small scale, fixed bed gasifiers coupled to diesel/gas engines (typically for 100-200 kWe systems with an approximate electrical efficiency of 15-25%) are commercially available on the market. However, gas cleaning, relatively high costs and required careful operation have so far blocked application of these systems in large numbers.
As gasification showed so much promise as an economical source of energy for power and process heat in developing countries, extensive demonstration Programmes were started by donor and national governments. The United Nations Development Program (UNDP) and the World Bank have carried out a wide-ranging review of these Programmes, and conclude that commercially proven power and heat
World Energy Council Renewable Energy Projects Handbook
6
gasifiers are available to run on biomass fuels such as charcoal, wood, coconut shells and rice husks. Heat gasifiers are more tolerant of other biomass fuels, but only limited experience with biomass fuels other than the above is available for small-scale power gasifiers. The current economics of biomass gasification are marginal for most areas, with the heat gasifiers being more viable than power gasifiers.
Anaerobic digestion of biomass has been demonstrated and applied commercially for a variety of feedstock, such as organic domestic waste, organic industrial waste, manure, sludge, etc. Biogas is then applied for cooking and power generation. Digestion has a low overall electrical efficiency: 10-15%. A specific source of biogas is methane-rich landfills used in gas turbines for electricity generation. Advanced technologies for producing small-scale electricity from biomass are being developed, for example: Microturbines that could use typical biomass-derived thermal gas or digester gas. They might eventually become competitive with diesel engines for village-scale power applications, offering relatively low capital and maintenance costs, high reliability and long lifetime. Stirling engines that could potentially use a wide range of fuels with little need for processing. Recent technical advances in “free-piston Stirling designs” might eventually yield commercial models with high reliability and engine efficiency, making them a particularly interesting power generating option at very small scales (1 – 3 kW).
Fuel cells that could generate power at a village scale from gasified biomass, at efficiencies more than twice as great as the gasifier/diesel engine systems that are now being commercialised. If fuel cells and gas clean-up systems come to be mass produced for vehicle applications (as is likely), it may mean that rugged systems could be available at costs low enough to make village scale generation at the scale of ~100 kW roughly cost-competitive with today’s centralised power plants.
The potential of biomass is very large, but tends to occur in a dilute form. The forecast for 2025 envisages approximately 2.6 Gtep based on biogas energy (growth from 1.16 Mtep in 1998).
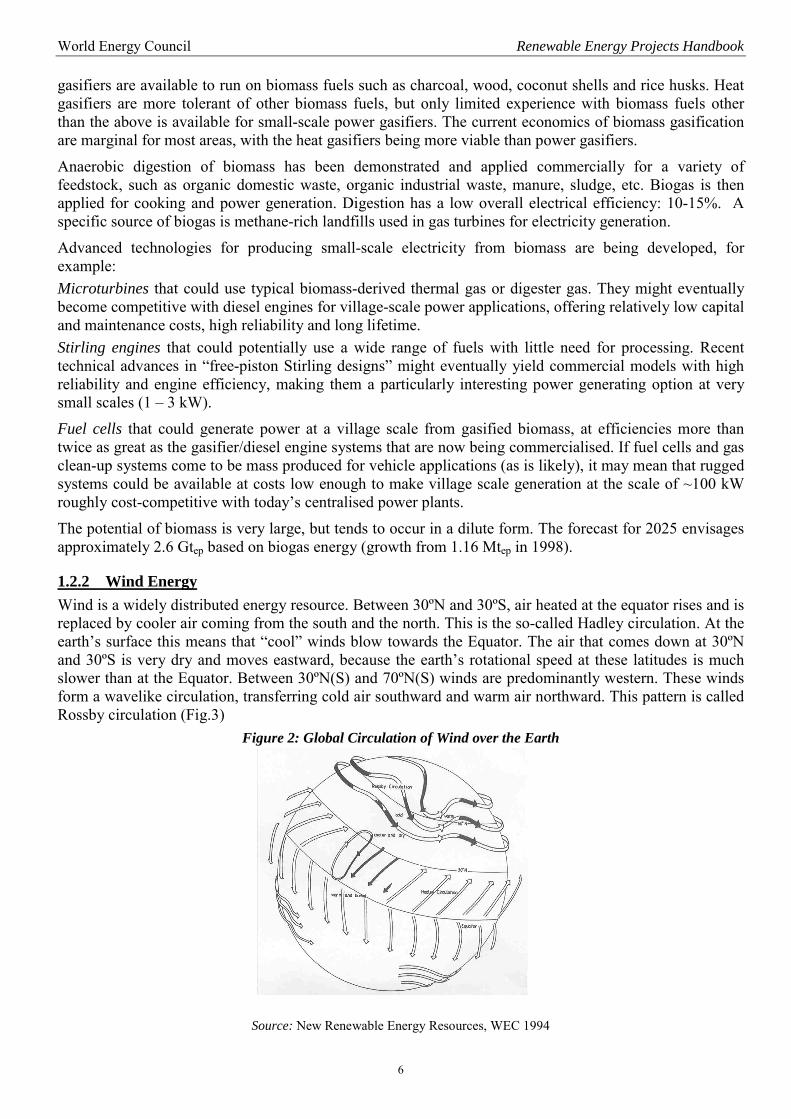
1.2.2 Wind Energy Wind is a widely distributed energy resource. Between 30ºN and 30ºS, air heated at the equator rises and is replaced by cooler air coming from the south and the north. This is the so-called Hadley circulation. At the earth’s surface this means that “cool” winds blow towards the Equator. The air that comes down at 30ºN and 30ºS is very dry and moves eastward, because the earth’s rotational speed at these latitudes is much slower than at the Equator. Between 30ºN(S) and 70ºN(S) winds are predominantly western. These winds form a wavelike circulation, transferring cold air southward and warm air northward. This pattern is called Rossby circulation (Fig.3)
Figure 2: Global Circulation of Wind over the Earth
Source: New Renewable Energy Resources, WEC 1994
World Energy Council Renewable Energy Projects Handbook
7
The availability of wind varies for different regions. It should be noted that the mean wind speed may differ by as much as 25% from year to year. In most areas there are also significant seasonal differences. Generally, wind speeds are higher in winter, although there are exceptions. In California (USA), for example, summer winds are stronger due to local topography and sea breeze effects. Due to seasonal variations, the potential of wind energy for power production can be significantly higher than the annual mean wind speed would indicate. Therefore, not only the mean wind speed but also the wind speed frequency distribution, commonly described by a Weibull distribution, have to be taken into account in order to estimate the amount of electricity that can be produced by wind turbines in a certain region, on average. The wind speed varies with height, depending on surface roughness and atmospheric conditions. The increase in wind speed with height is usually described in terms of a power law or by a logarithmic expression. Daily and hourly variations in the wind speed are also important for scheduling the operation of conventional power plants and adjusting their output to meet these variations. On the time scales of minutes and seconds, the variations in wind speed (turbulence) are important for wind turbine manufacturers as they influence the optimum design of a wind turbine.
Wind resources can be exploited mainly in areas where wind power density is at least 400 W/m2 at 30 metres above the ground. It is supposed that continuing technical advances will open new areas to development. The assessment includes regions where the annual average wind power density exceeds 250-300 W/m2 at 50 meters.
Because of the sensitivity of the potential to the value of the wind speed, the determination of specific sites for wind energy projects will be dependent on accurate meteorological measurements, wind energy maps and handbooks, site measurements, etc. Even in the best sites, the wind does not blow continuously. Therefore it can never achieve the 100% load factor but, in most systems, wind would be able to attain a 23-28% factor.
Preliminary Wind Resource Assessment will include the following: � Wind mapping dependent on the nature of regional wind flows and the complexity of the terrain. � Site potential evaluation based on the meteorological potential � Wind prospecting – evaluation of all the above data and preparation of prospectuses for wind project
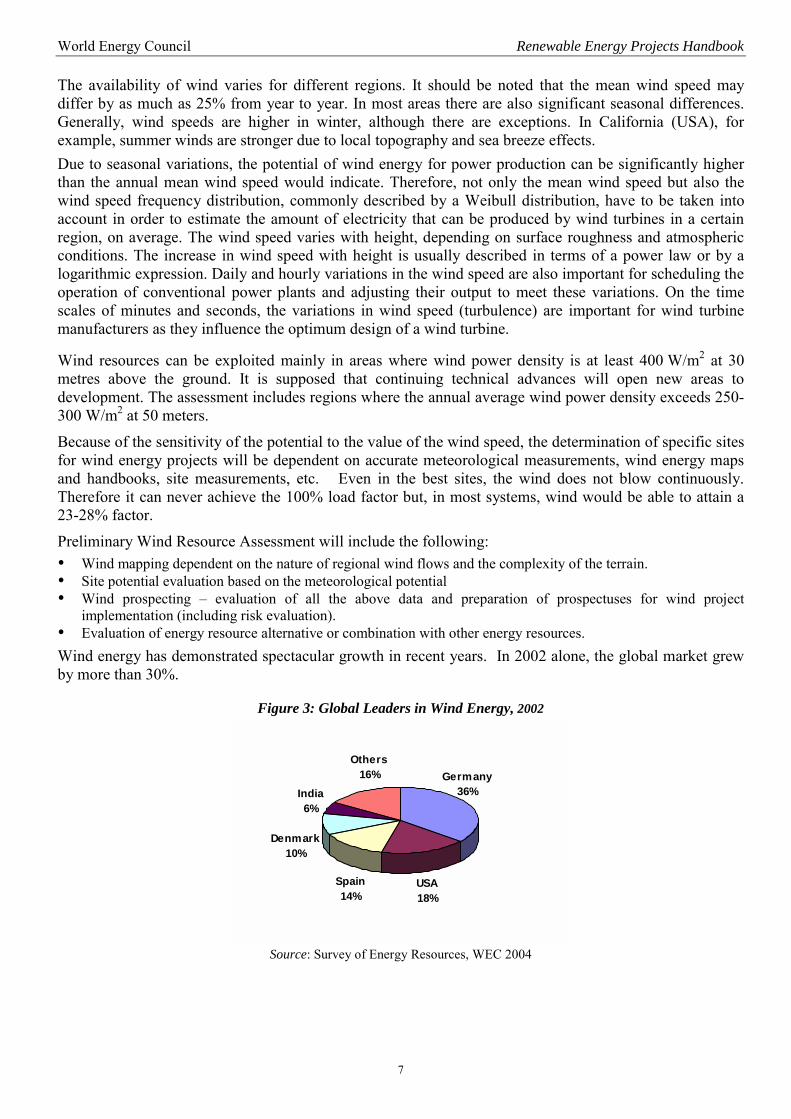
implementation (including risk evaluation). � Evaluation of energy resource alternative or combination with other energy resources. Wind energy has demonstrated spectacular growth in recent years. In 2002 alone, the global market grew by more than 30%.
Figure 3: Global Leaders in Wind Energy, 2002
Others16% Germany
36%India6%
Denmark10%
Spain14%
USA18%
Source: Survey of Energy Resources, WEC 2004
World Energy Council Renewable Energy Projects Handbook
8
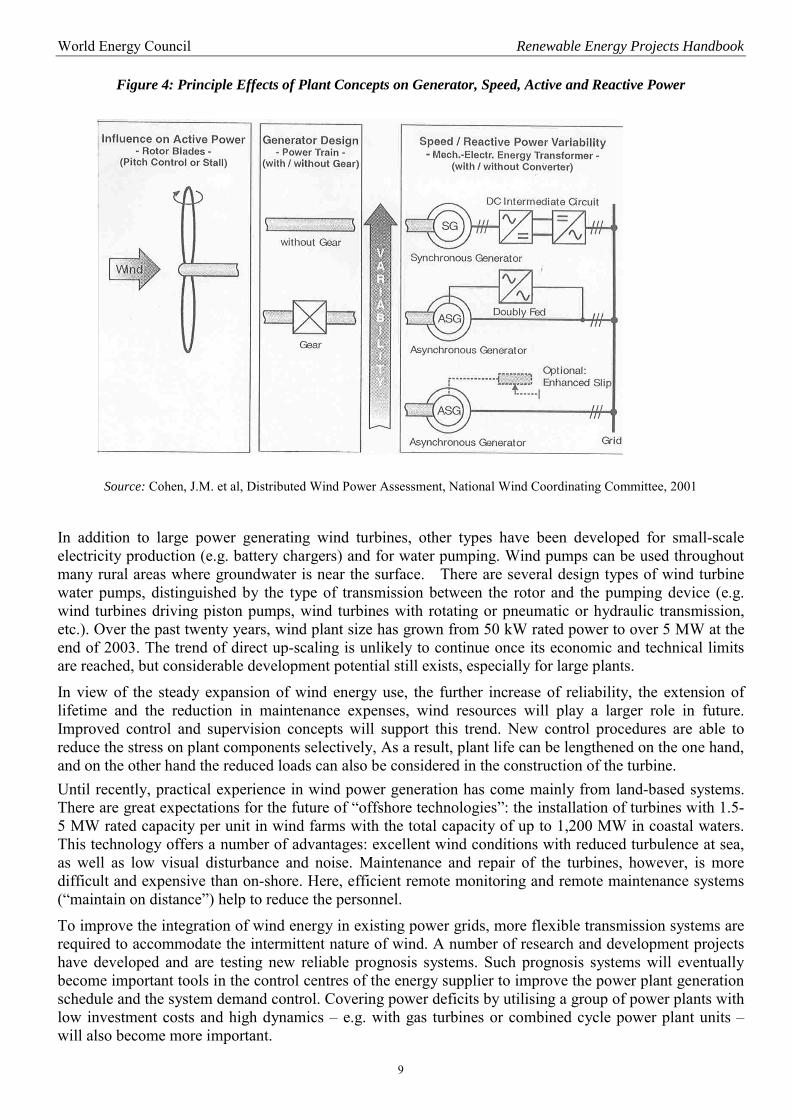
The market today is dominated by the “big five” countries with over 1,000 MW of wind generating capacity: Germany, the US, Spain, Denmark and India. Since 1995, the installed capacity of wind power plants worldwide has grown from some 5,000 MW to over 31,000 MW (end of 2002). The potential of wind energy is significant, and it is estimated that by 2010 the total installed wind generating capacity will reach approximately 90,000 MWe whereof 60,000 MWe will be in Europe. Mainstream Technologies for Wind Although the concept of wind turbines is old, a large-scale development of a new generation of turbines for power generation only began in the mid-seventies, as a consequence of the energy crisis of 1973. Technology concepts of modern wind turbines can be distinguished by two basic characteristics: “power limitation” and “rotor speed”. The scheme of power limitation can either be active “pitch” or passive “stall”. The rotor speed can be designed as constant or variable. The control of active and reactive power and the rotation speed is crucial for the operation of the turbines and their integration into the grid. The different technical concepts are illustrated in Figure 4 below.
One option to limit the active power is given by pitching the rotor-blades in their longitudinal axis. Without the active pitching of the rotor-blades the active power can be limited by stall-operation. However, this concept does not allow such a continuous control as in the case of the blade pitch setting.
If the rotor speed is not transmitted by a gearbox, the generator must have a large diameter together with as many electrical or permanent excited poles, in order to meet the requirements of an induction machine. It also has to be constructed in a large and heavy manner. If the rotor speed should be de-coupled from the constant grid frequency and the plant should run with variable speed (e.g. for power equalisation or reduction of mechanical loads), an electronic link between generator and grid is necessary. The two most common options are shown at the top and the middle of Figure 4. • The synchronous generator with a DC-rectifier on the machine side and an inverter on the grid side, the
so-called “DC intermediate circuit” or “DC link”. This system is characterised by a large speed range of the rotor.
• The double-fed induction generator with a variable frequency rotor supply through a frequency converter. This concept was already realised with MW sized turbines in the 1980s. Its rotor speed range is much smaller in comparison with the DC-link concept. However, both systems are able to control the reactive power and can also be used to stabilise the voltage.
• In the third option (Figure 4, bottom right) the turbine with the directly coupled induction generator has an almost constant speed connection with the grid. When adding an external resistor to the rotor of the generator to enlarge its slip, a dynamic load reduction of the mechanical components leads to a variation of the rotor speed during gusts. However, this kind of grid connection, does not allow the opportunity to control the reactive power or to influence the voltage.
World Energy Council Renewable Energy Projects Handbook
9
Figure 4: Principle Effects of Plant Concepts on Generator, Speed, Active and Reactive Power
Source: Cohen, J.M. et al, Distributed Wind Power Assessment, National Wind Coordinating Committee, 2001
In addition to large power generating wind turbines, other types have been developed for small-scale electricity production (e.g. battery chargers) and for water pumping. Wind pumps can be used throughout many rural areas where groundwater is near the surface. There are several design types of wind turbine water pumps, distinguished by the type of transmission between the rotor and the pumping device (e.g. wind turbines driving piston pumps, wind turbines with rotating or pneumatic or hydraulic transmission, etc.). Over the past twenty years, wind plant size has grown from 50 kW rated power to over 5 MW at the end of 2003. The trend of direct up-scaling is unlikely to continue once its economic and technical limits are reached, but considerable development potential still exists, especially for large plants.
In view of the steady expansion of wind energy use, the further increase of reliability, the extension of lifetime and the reduction in maintenance expenses, wind resources will play a larger role in future. Improved control and supervision concepts will support this trend. New control procedures are able to reduce the stress on plant components selectively, As a result, plant life can be lengthened on the one hand, and on the other hand the reduced loads can also be considered in the construction of the turbine. Until recently, practical experience in wind power generation has come mainly from land-based systems. There are great expectations for the future of “offshore technologies”: the installation of turbines with 1.5-5 MW rated capacity per unit in wind farms with the total capacity of up to 1,200 MW in coastal waters. This technology offers a number of advantages: excellent wind conditions with reduced turbulence at sea, as well as low visual disturbance and noise. Maintenance and repair of the turbines, however, is more difficult and expensive than on-shore. Here, efficient remote monitoring and remote maintenance systems (“maintain on distance”) help to reduce the personnel.
To improve the integration of wind energy in existing power grids, more flexible transmission systems are required to accommodate the intermittent nature of wind. A number of research and development projects have developed and are testing new reliable prognosis systems. Such prognosis systems will eventually become important tools in the control centres of the energy supplier to improve the power plant generation schedule and the system demand control. Covering power deficits by utilising a group of power plants with low investment costs and high dynamics – e.g. with gas turbines or combined cycle power plant units – will also become more important.
World Energy Council Renewable Energy Projects Handbook
10
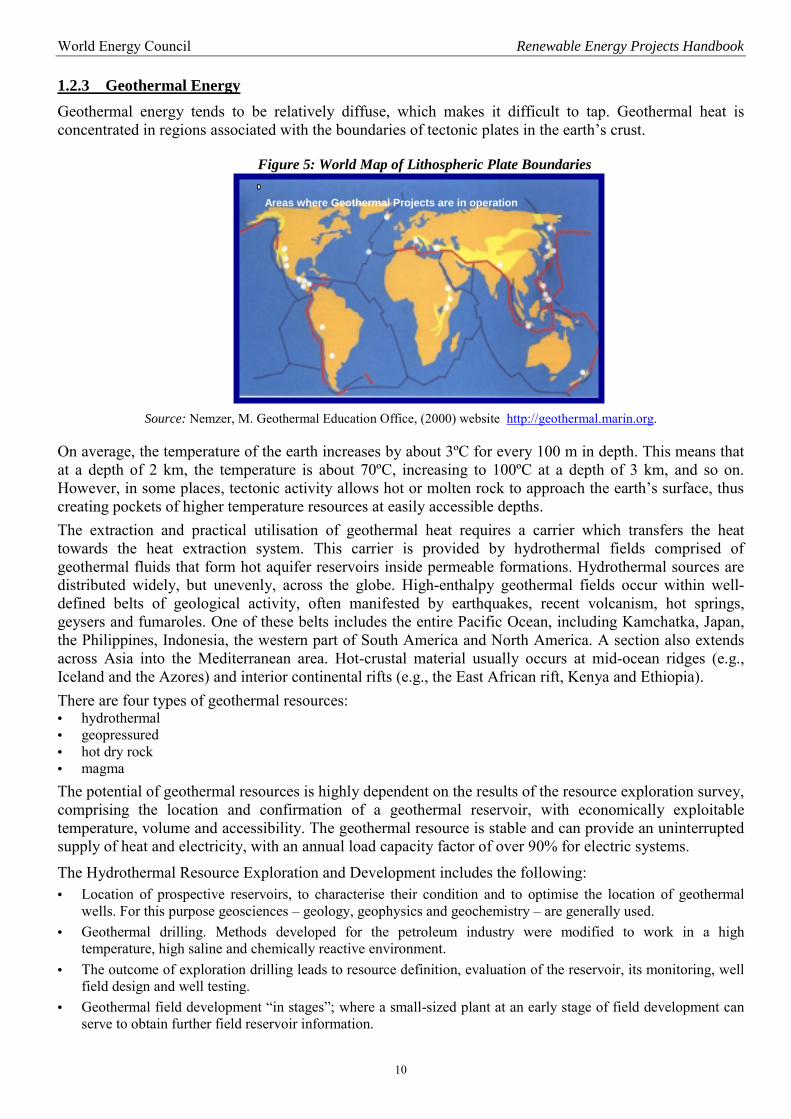
1.2.3 Geothermal Energy Geothermal energy tends to be relatively diffuse, which makes it difficult to tap. Geothermal heat is concentrated in regions associated with the boundaries of tectonic plates in the earth’s crust.
Figure 5: World Map of Lithospheric Plate Boundaries
Source: Nemzer, M. Geothermal Education Office, (2000) website http://geothermal.marin.org.
On average, the temperature of the earth increases by about 3ºC for every 100 m in depth. This means that at a depth of 2 km, the temperature is about 70ºC, increasing to 100ºC at a depth of 3 km, and so on. However, in some places, tectonic activity allows hot or molten rock to approach the earth’s surface, thus creating pockets of higher temperature resources at easily accessible depths. The extraction and practical utilisation of geothermal heat requires a carrier which transfers the heat towards the heat extraction system. This carrier is provided by hydrothermal fields comprised of geothermal fluids that form hot aquifer reservoirs inside permeable formations. Hydrothermal sources are distributed widely, but unevenly, across the globe. High-enthalpy geothermal fields occur within well-defined belts of geological activity, often manifested by earthquakes, recent volcanism, hot springs, geysers and fumaroles. One of these belts includes the entire Pacific Ocean, including Kamchatka, Japan, the Philippines, Indonesia, the western part of South America and North America. A section also extends across Asia into the Mediterranean area. Hot-crustal material usually occurs at mid-ocean ridges (e.g., Iceland and the Azores) and interior continental rifts (e.g., the East African rift, Kenya and Ethiopia). There are four types of geothermal resources: • hydrothermal • geopressured • hot dry rock • magma The potential of geothermal resources is highly dependent on the results of the resource exploration survey, comprising the location and confirmation of a geothermal reservoir, with economically exploitable temperature, volume and accessibility. The geothermal resource is stable and can provide an uninterrupted supply of heat and electricity, with an annual load capacity factor of over 90% for electric systems.
The Hydrothermal Resource Exploration and Development includes the following: • Location of prospective reservoirs, to characterise their condition and to optimise the location of geothermal
wells. For this purpose geosciences – geology, geophysics and geochemistry – are generally used. • Geothermal drilling. Methods developed for the petroleum industry were modified to work in a high
temperature, high saline and chemically reactive environment. • The outcome of exploration drilling leads to resource definition, evaluation of the reservoir, its monitoring, well
field design and well testing. • Geothermal field development “in stages”; where a small-sized plant at an early stage of field development can
serve to obtain further field reservoir information.
Areas where Geothermal Projects are in operation
World Energy Council Renewable Energy Projects Handbook
11
• Geothermal field development includes drilling of production and reinjection wells, production stimulation (if needed), injection tests, well maintenance and erection of fluid transport to the energy conversion system (pumps, pipes, separators, valves, etc.).
Other types of geothermal energy have special requirements in the exploration phase. For example, the forces that drive fluids from geopressured brine reservoirs differ greatly from those in conventional oil and gas reservoirs and require a special technology for forecasting geopressured reservoir performance. Better sensing techniques besides seismic methods are needed for exploring magma deposits. Drilling technology requirements and costs increase as the geothermal environment becomes hotter, deeper and more abrasive to drill. Recovery of geopressured energy requires high-pressure technology and the use of heavy drilling muds. Hot dry rock requires the drilling of deep wells in very hard rock and the creation of artificial heat exchange fractures through which fluid can be circulated, with entering and leaving facilitated through one or more deep well bores.
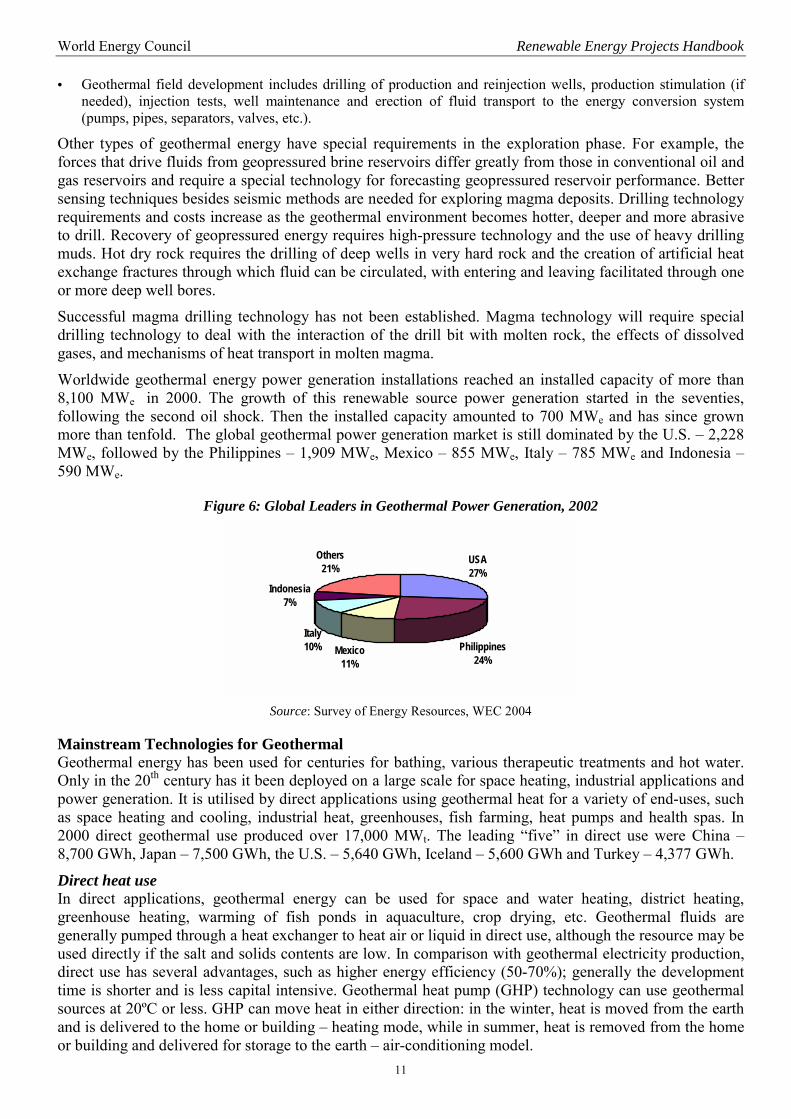
Successful magma drilling technology has not been established. Magma technology will require special drilling technology to deal with the interaction of the drill bit with molten rock, the effects of dissolved gases, and mechanisms of heat transport in molten magma. Worldwide geothermal energy power generation installations reached an installed capacity of more than 8,100 MWe in 2000. The growth of this renewable source power generation started in the seventies, following the second oil shock. Then the installed capacity amounted to 700 MWe and has since grown more than tenfold. The global geothermal power generation market is still dominated by the U.S. – 2,228 MWe, followed by the Philippines – 1,909 MWe, Mexico – 855 MWe, Italy – 785 MWe and Indonesia – 590 MWe.
Figure 6: Global Leaders in Geothermal Power Generation, 2002
USA27%
Indonesia7%
Italy10% Mexico
11%Philippines
24%
Others21%
Source: Survey of Energy Resources, WEC 2004
Mainstream Technologies for Geothermal Geothermal energy has been used for centuries for bathing, various therapeutic treatments and hot water. Only in the 20th century has it been deployed on a large scale for space heating, industrial applications and power generation. It is utilised by direct applications using geothermal heat for a variety of end-uses, such as space heating and cooling, industrial heat, greenhouses, fish farming, heat pumps and health spas. In 2000 direct geothermal use produced over 17,000 MWt. The leading “five” in direct use were China – 8,700 GWh, Japan – 7,500 GWh, the U.S. – 5,640 GWh, Iceland – 5,600 GWh and Turkey – 4,377 GWh.
Direct heat use In direct applications, geothermal energy can be used for space and water heating, district heating, greenhouse heating, warming of fish ponds in aquaculture, crop drying, etc. Geothermal fluids are generally pumped through a heat exchanger to heat air or liquid in direct use, although the resource may be used directly if the salt and solids contents are low. In comparison with geothermal electricity production, direct use has several advantages, such as higher energy efficiency (50-70%); generally the development time is shorter and is less capital intensive. Geothermal heat pump (GHP) technology can use geothermal sources at 20ºC or less. GHP can move heat in either direction: in the winter, heat is moved from the earth and is delivered to the home or building – heating mode, while in summer, heat is removed from the home or building and delivered for storage to the earth – air-conditioning model.
World Energy Council Renewable Energy Projects Handbook
12
Geothermal power generation technologies There are several types of geothermal energy conversion processes: • Dry Steam Plants produce energy for vapour-dominated reservoirs with a typical unit capacity of 35 – 120 MWe. • Flashed Steam Plants produce energy from liquid-dominated reservoirs which are sufficiently hot to flash a large
proportion of the liquid to steam. Typical units have a capacity of 10 – 55 MWe. Single flash systems evaporate hot geothermal fluids to steam by reducing the pressure of the entering liquid and directing it through the turbine. In dual-flash systems steam is flashed from the remaining hot fluid of the first stage, separated, and fed into a dual-inlet turbine or into two separate turbines.
• Binary-Cycle Plants. For low-enthalpy resources binary plants based on the use of Organic Rankine Cycles (ORC) are utilised to convert the resource to electricity. The hot brine or geothermal steam is used as the heat source for a secondary, organic fluid, which is the working fluid of the ORC.
• A supercritical cycle using isobutane, as well as a cascade concept, were developed in the early eighties in order to increase the power output by increasing the thermal cycle efficiency. For moderate enthalpy, two-phase resources with steam quality between 10-30%, binary plants are efficient. When the geothermal fluid has high non-condensable gas (NCG) content even higher efficiency can be achieved with a special tailored binary two-phase configuration than with condensing steam turbines.
• For efficient use of steam-dominated resource a geothermal combined cycle is applied. The steam first flows through a backpressure steam turbine and is then condensed in the organic turbine vaporiser. The condensate and brine are used to preheat the organic fluid as in the two-phase binary configuration. Geothermal Combined Cycle Plants have electric efficiencies of 10-25%, while the capacity factors are frequently above 90%; the plants are independent of climate and seasons and can be operated 24 hours a day providing stable base-load generation to the grid or to remote off-grid rural areas.
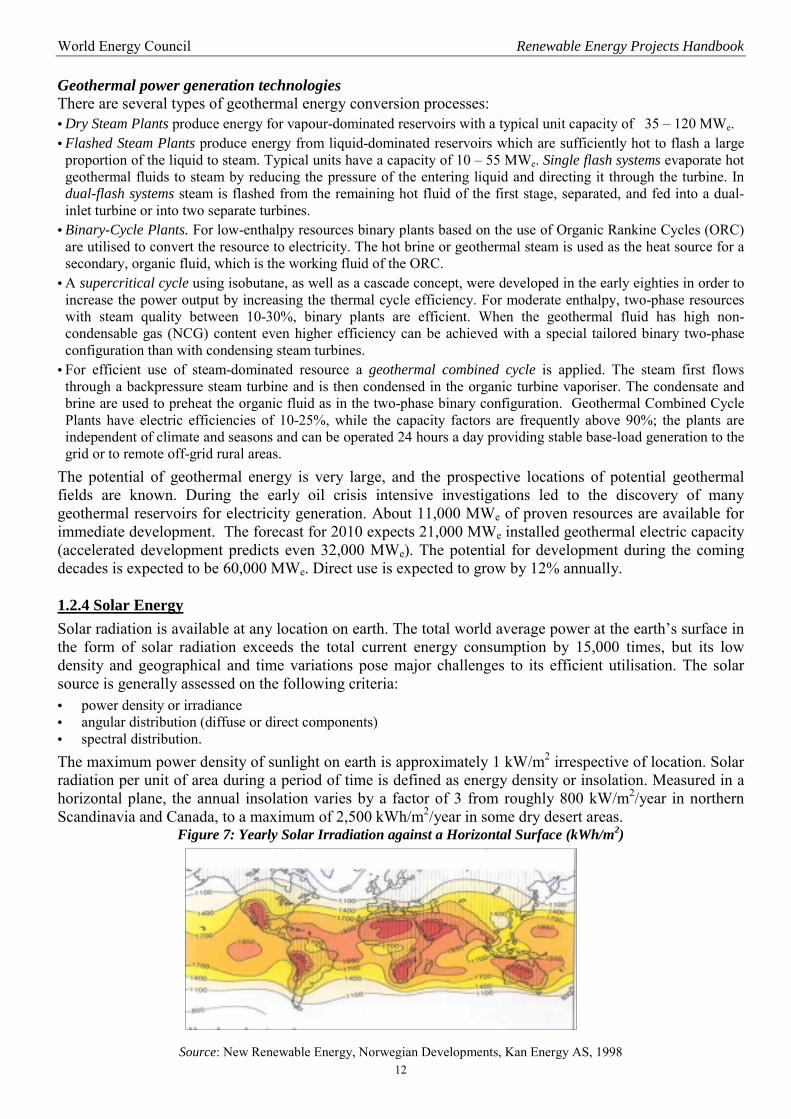
The potential of geothermal energy is very large, and the prospective locations of potential geothermal fields are known. During the early oil crisis intensive investigations led to the discovery of many geothermal reservoirs for electricity generation. About 11,000 MWe of proven resources are available for immediate development. The forecast for 2010 expects 21,000 MWe installed geothermal electric capacity (accelerated development predicts even 32,000 MWe). The potential for development during the coming decades is expected to be 60,000 MWe. Direct use is expected to grow by 12% annually. 1.2.4 Solar Energy Solar radiation is available at any location on earth. The total world average power at the earth’s surface in the form of solar radiation exceeds the total current energy consumption by 15,000 times, but its low density and geographical and time variations pose major challenges to its efficient utilisation. The solar source is generally assessed on the following criteria: • power density or irradiance • angular distribution (diffuse or direct components) • spectral distribution. The maximum power density of sunlight on earth is approximately 1 kW/m2 irrespective of location. Solar radiation per unit of area during a period of time is defined as energy density or insolation. Measured in a horizontal plane, the annual insolation varies by a factor of 3 from roughly 800 kW/m2/year in northern Scandinavia and Canada, to a maximum of 2,500 kWh/m2/year in some dry desert areas.
Figure 7: Yearly Solar Irradiation against a Horizontal Surface (kWh/m2)
Source: New Renewable Energy, Norwegian Developments, Kan Energy AS, 1998
World Energy Council Renewable Energy Projects Handbook
13
For many practical applications of solar energy the absolute value of yearly insolation is less important than the differences in average monthly insolation values. These differences vary greatly: from 25% close to the equator, to a factor of 10 in the most northern and southern areas. Since the average power density of solar radiation is 100-300W/m2 and the net plant conversion efficiencies are typically 10% or less, substantial areas are needed to capture and convert significant amounts of solar energy. For example, at a plant efficiency of 10%, it takes 3-10 km2 to generate an average 100 MW of electricity (i.e. 0.9 TWhe or 3.2 PJe per year) using a PV or solar thermal electric system. The range of capacity factors of a modern solar energy system would be 10-20%.
Preliminary Solar Resource Assessment will include the following: • Clear sky seasonal solar irradiance data, with the focus on prospective locations with annual average solar
irradiance • Site insolation data for evaluating the economic potential of solar energy project • Review of land or surfaces available for solar systems • Energy infrastructure, population density, geographical conditions review • Technical potential for solar project development
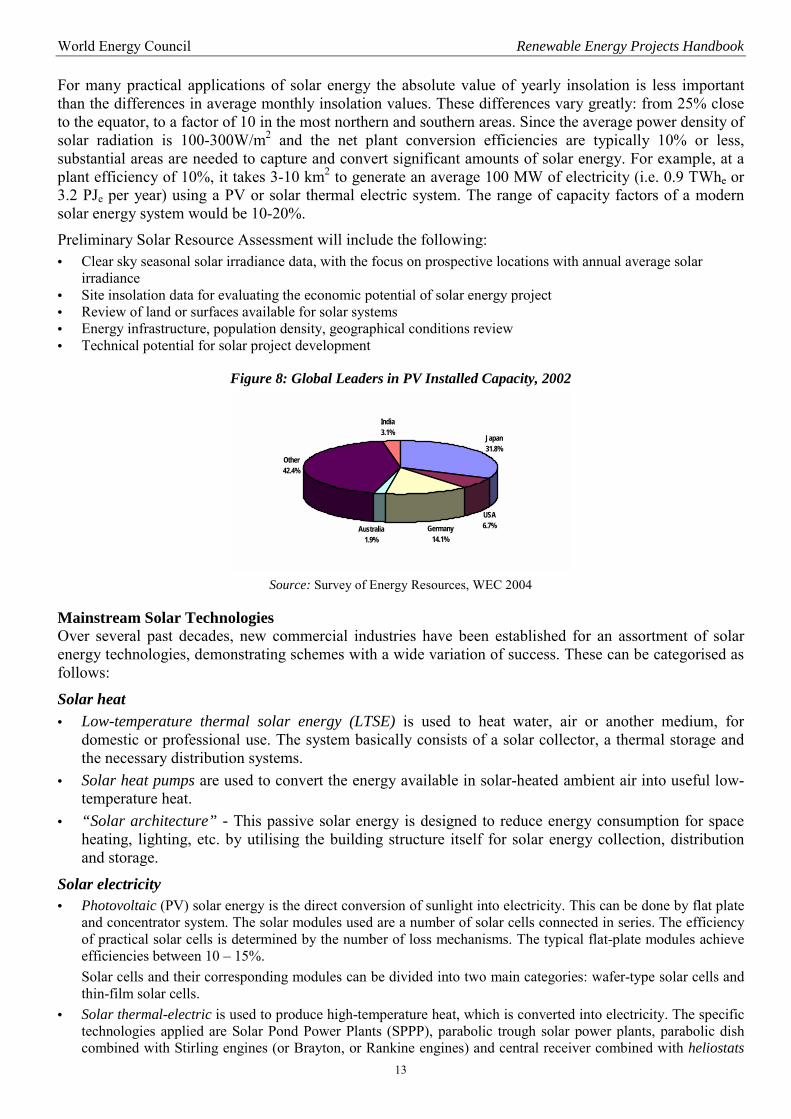
Figure 8: Global Leaders in PV Installed Capacity, 2002
India3.1%
Japan31.8%
Other42.4%
Australia1.9%
Germany14.1%
USA6.7%
Source: Survey of Energy Resources, WEC 2004
Mainstream Solar Technologies Over several past decades, new commercial industries have been established for an assortment of solar energy technologies, demonstrating schemes with a wide variation of success. These can be categorised as follows:
Solar heat • Low-temperature thermal solar energy (LTSE) is used to heat water, air or another medium, for
domestic or professional use. The system basically consists of a solar collector, a thermal storage and the necessary distribution systems.
• Solar heat pumps are used to convert the energy available in solar-heated ambient air into useful low-temperature heat.
• “Solar architecture” - This passive solar energy is designed to reduce energy consumption for space heating, lighting, etc. by utilising the building structure itself for solar energy collection, distribution and storage.
Solar electricity • Photovoltaic (PV) solar energy is the direct conversion of sunlight into electricity. This can be done by flat plate
and concentrator system. The solar modules used are a number of solar cells connected in series. The efficiency of practical solar cells is determined by the number of loss mechanisms. The typical flat-plate modules achieve efficiencies between 10 – 15%. Solar cells and their corresponding modules can be divided into two main categories: wafer-type solar cells and thin-film solar cells.
• Solar thermal-electric is used to produce high-temperature heat, which is converted into electricity. The specific technologies applied are Solar Pond Power Plants (SPPP), parabolic trough solar power plants, parabolic dish combined with Stirling engines (or Brayton, or Rankine engines) and central receiver combined with heliostats
World Energy Council Renewable Energy Projects Handbook
14
(individually focused mirrors). The SPPP can achieve an electric efficiency of 10%, whereas the dish-Stirling combination can convert sunlight into electricity with an efficiency of 30%.
Artificial photosynthesis Artificial photosynthesis represents a future intermediate between natural biomass production and electricity production, using “organic” solar cells. In an ideal situation it would yield hydrogen or hydrogen-rich fuels.
The potential for solar energy is extremely large and the growth rate of PV installations in recent years has been spectacular. In 2002 PV shipments grew by some 62%, and this rapid growth is expected to continue in the coming years. The US expects to have 3,200 MWp of installed PV modules by the year 2020, Japan plans to achieve 4,600 MWp in 2010, and the European Union has set a PV target to achieve an installed capacity of 3,000 MWp by 2010. Solar thermal installations should achieve 100 million m2 by 2010. 1.2.5 Hydropower Hydropower is the world’s largest source of renewable energy used for power generation and today accounts for nearly one fifth of the world’s electricity production (some 2,700 TWh), with more than 720 GW installed capacity worldwide. Further 100 GW were under construction in 2003. Hydro resources are widespread around the globe, and potential sites can be found in about 150 countries. About two-thirds of the economically feasible hydropower potential remains to be developed. Total worldwide hydro potential is estimated at some 1,400 GW – twice the present installed hydro capacity.
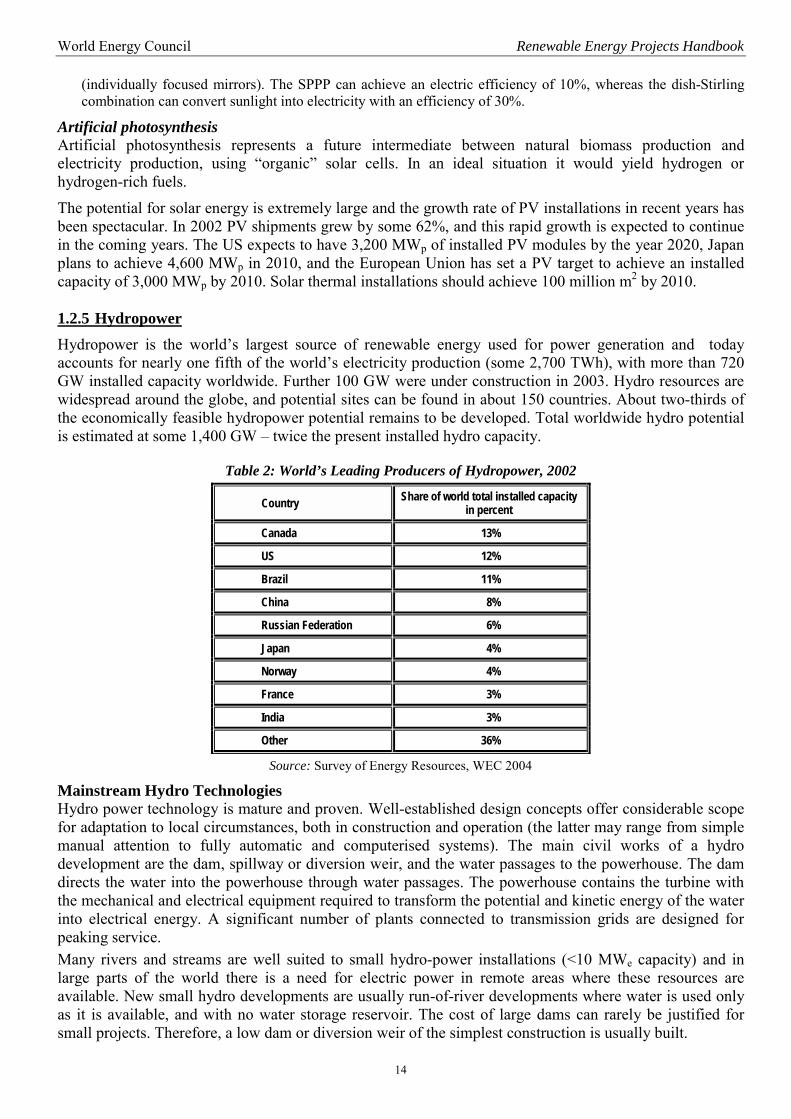
Table 2: World’s Leading Producers of Hydropower, 2002
Country Share of world total installed capacity in percent
Canada 13%
US 12%
Brazil 11%
China 8%
Russian Federation 6%
Japan 4%
Norway 4%
France 3%
India 3%
Other 36%
Source: Survey of Energy Resources, WEC 2004
Mainstream Hydro Technologies Hydro power technology is mature and proven. Well-established design concepts offer considerable scope for adaptation to local circumstances, both in construction and operation (the latter may range from simple manual attention to fully automatic and computerised systems). The main civil works of a hydro development are the dam, spillway or diversion weir, and the water passages to the powerhouse. The dam directs the water into the powerhouse through water passages. The powerhouse contains the turbine with the mechanical and electrical equipment required to transform the potential and kinetic energy of the water into electrical energy. A significant number of plants connected to transmission grids are designed for peaking service. Many rivers and streams are well suited to small hydro-power installations (<10 MWe capacity) and in large parts of the world there is a need for electric power in remote areas where these resources are available. New small hydro developments are usually run-of-river developments where water is used only as it is available, and with no water storage reservoir. The cost of large dams can rarely be justified for small projects. Therefore, a low dam or diversion weir of the simplest construction is usually built.
World Energy Council Renewable Energy Projects Handbook
15
Inventories of small hydro sites are not complete for many areas of the world, nor is the capacity range of individual sites assessed in any reliable way. An estimate of 5% of the total hydro potential currently thought to be exploitable is expected to be small hydro. Canada has completed an inventory of small hydro sites, which identified over 3,600 sites having a total technical potential of about 9,000 MWe. Approximately 15% of this potential was found to be economically viable. An estimate of total small hydro development in the range of 1,000 - 2,000 MWe per year is considered realistic. However, a comprehensive mapping of small hydro potential sites is still not available. Survey of hydrological resources will provide more reliable information on optimum siting of new plants. Computerised data acquisition and handling will facilitate classification and evaluation of the data needed for site selection and environmental impact assessment. Techniques for monitoring water resources and their use will offer more reliable information on hydrology, which is the backbone for hydro generation. Such knowledge is also vital for multi-purpose applications. More attention will be paid to comprehensive resource utilisation studies covering all purposes. Scarcity of water will dictate this approach.
1.2.6 Industrial Heat Recovery Power (IHRP) IHRP represents a poorly known, often unused and therefore, often wasted, distributed resource in energy intensive industries. The resource can provide fuel-free “green” electricity but has been widely neglected, mainly due to the general lack of knowledge about its vast potential. The United States’ definition of IHRP is: “a system that converts the lost heat from the exhaust stacks of engines, manufacturing or industrial processes, in a system with a nameplate capacity of less than 20 MW”.
This definition excludes lost heat from electricity generating engines. There are only dozens of megawatts of installed industrial waste heat units for electricity generation. The leading countries producing IHRP are the US, Western European countries, Canada, Japan and China. IRHP projects use a wide variety of heat resources in applications such as chemical, cement and glass plants, oil refineries, waste incinerators, pulp and paper mills, gas pipeline compressor stations, landfill gas reciprocating engine exhausts, etc. Industrial waste heat processes, even co-generation based, with waste heat at different temperatures: gases of 275ºC-500ºC, condensing vapours and fluids of 100ºC-250ºC and hot oil of 200ºC-350ºC, can increase their eco-efficiency by adding power to their basic process. The industrial applications for waste heat recovery do not require new siting; the power units are installed within the boundaries of the existing industrial site. It does not influence the industrial process, and does not interfere with the basic aim of production. Preliminary Waste Heat Resource Assessment will include the following: • Industrial plant characteristics, including its siting data; plant working hours per year; its electricity capacity needs,
electricity resources, etc. • The wasted heat data, including their possible aggregation. The nature should be specified (gas, condensing vapour,
liquids), the available flow rate, temperatures, pressure and their availability (hours/year) should be measured. • Other site data, e.g. site elevation, ambient air temperatures, availability of cooling water, etc.
Mainstream Technologies for IHRP The heat conversion technology applied for electricity generation based on industrial heat recovery is the Organic Rankine Cycle (ORC). The organic motive fluid is selected to optimise power output for specific waste heat applications. Thermal energy in the exhaust gas or other heat stream is transferred to the ORC’s vaporiser by non-flammable heat transfer fluid (hot water or oil) through the Heat Recovery Unit. The ORC working fluid is vaporised by the heat transfer unit. The resulting organic vapour drives a special turbine, which is coupled to the electricity generator. The turbine exhaust vapour flows through the recuperator and is condensed and recycled by the motive fluid pump. The electricity conversion efficiency is 10-20%.
The potential is large. There are many such heat streams, especially in industrialised countries. Potential generation in the USA alone was estimated at 8,000 MW, equivalent to 16 utility size power plants and enough for 8 million homes. There is potential worldwide – in the European countries (both west and east) and industrialised developing countries, such as India, China, Brazil, Mexico, Argentina and many others.
World Energy Council Renewable Energy Projects Handbook
16
1.3 Electrical Energy Storage Systems Energy storage improves the efficiency and reliability of the electric supply system by reducing the requirements for spinning reserves to meet peak power demands, making better use of efficient base load generation, and allowing greater use of intermittent renewable energy technologies. Energy storage technologies include: • hydropower storage schemes • battery storage • flywheel storage • super conducting magnetic energy storage • compressed air energy storage • super capacitors. New electricity storage technologies with better performance are being introduced each year. Energy storage can help increase energy security, reduce the environmental impact of electricity generation, transmission and use, and broaden the diversification opportunities for utilities by adding more generation options to their portfolios, e.g. distributed power and renewable energy. The main electricity storage technologies available today are: Hydropower Storage Schemes are the most widely used technology to store energy. They contribute to grid stability and provide ancillary services such as stand-by and reserve duties, black start-up, frequency control and flexible reactive loading. Hydro plants can also be used as synchronous condensers to stabilise the power system voltage by supplying reactive power to the system. Pumped-storage hydropower facilities use off-peak electricity to pump water from a lower reservoir into one at a higher elevation. When the water stored in the upper reservoir is released, it is passed through hydraulic turbines to generate electricity. Utility Battery Systems (UBS) allow utilities or utility customers to store electrical energy for dispatch at a time when its use is more economical, strategic or efficient. Existing UBS systems use lead-acid batteries. Compact, low-maintenance valve regulated lead-acid (VRLA) batteries have been developed for distributed power applications. The suitability of a battery system to utility applications is affected by factors such as its response time, power density (the amount of power available from a battery in relation to its mass or volume), discharge rate and life cycle costs. A Flywheel spinning at very high speeds can be used to store energy when combined with a device that operates either as an electric motor that accelerates the flywheel to store energy or as a generator that produces electricity from the energy stored in the flywheel. Modern flywheels use composite rotors made of carbon-fibre materials. The rotors have a very high strength-to-density ratio, and rotate in a vacuum chamber to minimise aerodynamic losses. Super Conducting Magnetic Energy Systems (SMES) store energy in a magnetic field created by the flow of direct current in a coil of super conducting material that has been cryogenically cooled. Compressed Air Energy Storage (CAES) is used by utilities that can use off-peak electricity to compress air and store it in airtight underground caverns. When the air is released from storage, it expands through a combustion turbine to generate electricity. Super Capacitors (also called electrochemical capacitors or ultra capacitors) have characteristics of both batteries and capacitors and could be used by utilities to regulate power quality. Fuel Cells are fairly similar to the ordinary battery. Both produce electricity through electrochemical reactions. The difference lies in a fuel cell’s ability to constantly produce electricity as long as it has a source of fuel, whereas a battery needs to be recharged. Consequently, since a fuel cell does not store energy internally, it will not “run down” like a battery. Fuel cells directly convert the fuel into electricity whereas battery has to replenish its electricity from an internal source. This makes it possible to utilise a fuel cell to generate electricity into hydrogen and oxygen. Hydrogen, the most abundant element on earth, is rarely found in its pure form. Most fuel cell systems employ a component called a reformer to extract hydrogen from hydrogen rich fossil fuels. The level of carbon dioxide emissions produced in this process is less than half the amount generated by traditional electricity generation methods and only trace amounts
World Energy Council Renewable Energy Projects Handbook
17
of nitrous oxide are produced. The hydrogen purity requirement and the need for reforming are dependent on the type of fuel cell stack employed.
Today, only batteries and the reversible fuel cells are capable of storing enough energy to power certain applications and processes.
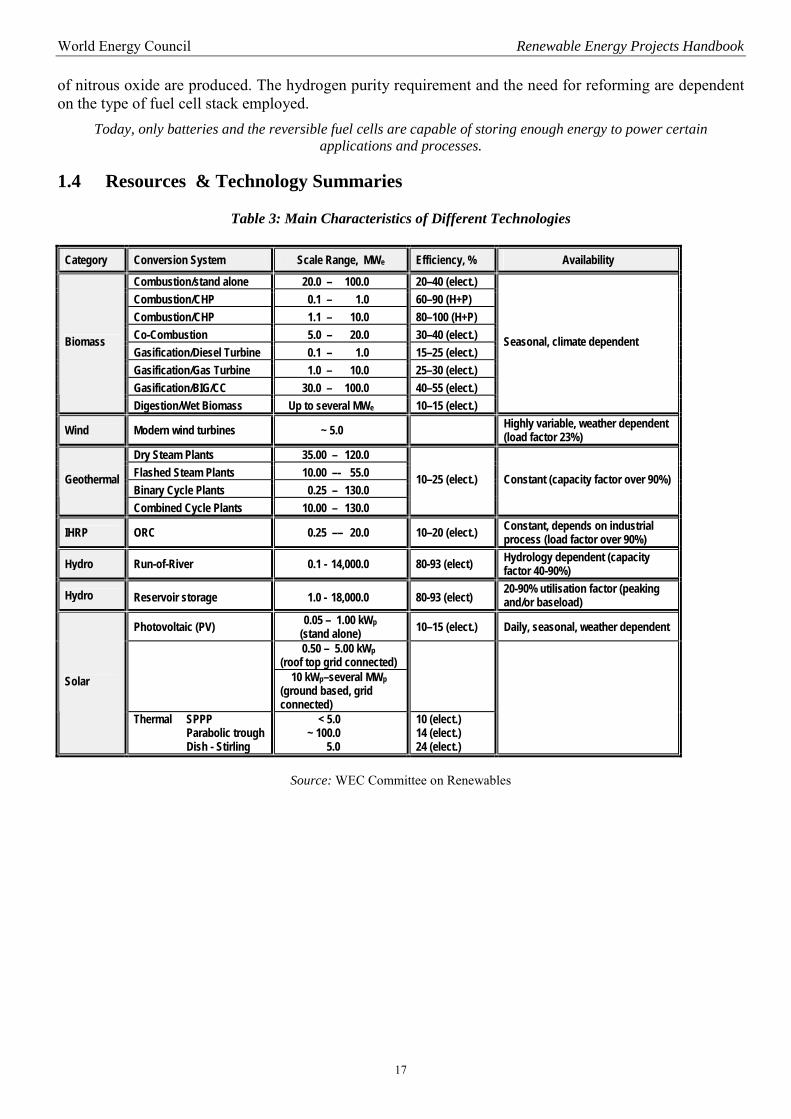
1.4 Resources & Technology Summaries
Table 3: Main Characteristics of Different Technologies
Category Conversion System Scale Range, MWe Efficiency, % Availability
Combustion/stand alone 20.0 – 100.0 20–40 (elect.) Combustion/CHP 0.1 – 1.0 60–90 (H+P) Combustion/CHP 1.1 – 10.0 80–100 (H+P) Co-Combustion 5.0 – 20.0 30–40 (elect.) Gasification/Diesel Turbine 0.1 – 1.0 15–25 (elect.) Gasification/Gas Turbine 1.0 – 10.0 25–30 (elect.) Gasification/BIG/CC 30.0 – 100.0 40–55 (elect.)
Biomass
Digestion/Wet Biomass Up to several MWe 10–15 (elect.)
Seasonal, climate dependent
Wind Modern wind turbines ~ 5.0 Highly variable, weather dependent (load factor 23%)
Dry Steam Plants 35.00 – 120.0 Flashed Steam Plants 10.00 –- 55.0 Binary Cycle Plants 0.25 – 130.0
Geothermal
Combined Cycle Plants 10.00 – 130.0
10–25 (elect.) Constant (capacity factor over 90%)
IHRP ORC 0.25 –– 20.0 10–20 (elect.) Constant, depends on industrial process (load factor over 90%)
Hydro Run-of-River 0.1 - 14,000.0 80-93 (elect) Hydrology dependent (capacity factor 40-90%)
Hydro Reservoir storage 1.0 - 18,000.0 80-93 (elect) 20-90% utilisation factor (peaking and/or baseload)
Photovoltaic (PV) 0.05 – 1.00 kWp (stand alone) 10–15 (elect.) Daily, seasonal, weather dependent
0.50 – 5.00 kWp (roof top grid connected)
10 kWp–several MWp (ground based, grid connected)
Solar
Thermal SPPP Parabolic trough Dish - Stirling
< 5.0 ~ 100.0 5.0
10 (elect.) 14 (elect.) 24 (elect.)
Source: WEC Committee on Renewables
World Energy Council Renewable Energy Projects Handbook
18
1.5 Policies, Economics, Social Considerations and Environment The gradual development of renewable energy technologies over the past 30-40 years does not necessarily hold true for the coming decades. However, it is a living testimony of market-driven behaviour, determined by the existing market conditions (supremacy of fossil-driven energy) on one hand, and the growing need for energy source diversification for sustainable development, on the other hand.
Business as a Driver for Promotion of Renewables The rapid growth of the energy sector during the last century was closely connected to the growing utilisation of fossil resources, which were relatively cheap and affordable for the developing industrial societies. Renewable energy resources were known during that period, but their utilisation was marginal, technologically under-developed and therefore considered unreliable and expensive. The real major incentive for renewable energy development emerged as a result of the oil crisis in 1973-74. The crisis clearly demonstrated the need to diversify the use of energy resources, to develop indigenous resources, and to invest in alternative energy technologies. The supporting policy measures were introduced almost in parallel.
The United States’ Public Utilities Regulatory Policies Act (PURPA) adopted in 1978 led almost immediately to a spectacular development of renewables based power generation – mostly geothermal and solar. This example clearly demonstrated that at an early stage of technological development, government support was critical to success. The experience of the vast majority of the countries, both developed and developing, where renewable energy today plays a significant role, confirms this conclusion. Government subsidies for development of wind energy introduced in 1979, have beyond any doubt helped Denmark to achieve a leading role in the global wind energy sector. The severe energy crisis of the late Eighties in the Philippines stimulated the international financing institution – Global Environment Facility – to invest in development of geothermal fields. The favourable legislation introduced by the government and aimed at facilitating foreign investment and private sector participation enticed foreign companies to get involved in the development of BOT projects for geothermal power generating facilities. Over the last 25 years, renewable resources have been researched in depth, their immediate potential has been defined, and a number of viable, economically promising technological solutions have been developed. The energy market is 'ready' for further deployment of renewables, yet a major 'break through' has not materialised. The market barriers are still there and it will require more than just recognition of the importance of renewables to stimulate action in terms of the policy reforms, innovative strategies and economic tools that are required for the development of renewable energies on a significant scale. The steps required are:
New Policies to Promote Renewables Growing worldwide recognition of the need to put renewable energy on the energy development agenda, resulted in a gradual creation of policies, plans, laws, market mechanisms, financial tools, strategies, incentives, etc. The goal is apparent: to widen market opportunities to stimulate renewables while coping with restraining market forces.
Policies in Developed Countries The last 10-15 years has seen a growing understanding by developed countries of the importance of renewable energy and its role in sustainable energy development, in diversification of energy supplies and in curbing global warming. This has led decision makers in the developed countries to introduce various incentives and policies to create a framework for the stimulation of renewables. Moreover, they have begun to recognise their global responsibility to promote renewable energy and have contributed to create means applicable to the developing countries. Common renewable promotion policies in developed countries are:
World Energy Council Renewable Energy Projects Handbook
19
• National plans: Numerous plans exist either promoting renewable energy in general, or some specific type in particular. The plans set stated objectives, nominate institutions to implement the plans and allocate means to support the objectives. This category includes the EU Green and White papers, the United States’ Distributed generation policy plans, Australia’s Prime Minister’s Measures for Better Environment, etc.
• Legislation: Specific laws are adopted to set up a legal framework for promotion of renewable energies. They often set national targets and provide the means to meet these targets, for example, preferential prices or premiums for renewables, environmental taxes, levies, etc. The following examples of legislation can be mentioned: the EU Directive on Renewables Promotion (Sept. 2001), German Renewable Energy Law (Feb. 2000), Spain’s Royal Decree (2818/1998) on production of electricity by facilities powered by renewable energy resources (Dec. 1998), the Australian Renewable Energy (Electricity) Act 2000, etc.
• Regulations to support growth in renewables: To ensure that a certain share of electricity is generated from renewable resources, delivery obligations or quotas are imposed on electric utilities. The Renewable Portfolio Standard (RPS) introduced or proposed in the US on federal and state levels, set percentage targets for electricity generation by renewable sources. On the federal level the target of 10% was set for 2019-2020. The UK policy of Renewables Obligation (RO) introduced in April 2002 requires electricity suppliers to produce 3% of supplies from renewable sources. By the year 2010, 10% of the electric power in the UK should be from renewables. Italy has introduced a quota system – Compulsory Renewable System (CRS) – obliging each power supplier to feed electricity from renewable sources to the National Electricity System. Similar schemes are under preparation in several other countries, such as Japan and China.
• Climate change and other environmental policies: Universal recognition of the need for environmental policy on local, regional and global levels has led to policies for the protection of the environment and thereby to the enhancement of renewables. (The system of emissions trading, still in its initial stages, is discussed later in this chapter).
• Tax arrangements and other fiscal incentives: Several countries have introduced financial and tax incentives to boost the development of renewable energies, such as tax exemptions (Norway), production tax credits (PTC) (US), income tax write-offs (Canada), investment credits and subsidised loans (Canada), etc. Exports of renewable technologies are supported by national Export Credit Agencies (ECAs), such as the United States Export-Import Bank or the Japanese Ex-Im Bank, Canada’s Economic Development Corporation (EDC) or French COFACE.
• Demand side initiatives: The effort to boost renewable energy deployment is also supported by customers, who are encouraged to purchase renewable energy, both voluntarily and through tax incentives. Also large multi-national companies have been forming “coalitions” to purchase renewable energy. For example, members of a coalition led by the World Resources Institute, multi-nationals such as IBM and General Motors, committed themselves to using renewable energy (wind, landfill gas) in their US facilities.
Policies in Developing Countries Developing countries generally do not have complex policies to support development of renewables. Yet there also we witness growing interest in the indigenous renewable energy sources as a means of local energy development. • National plans: Some developing nations have declared numerous far-reaching national plans, some of them
comprehensive, e.g. China’s “Renewable Energy Plan”, India’s “Renewable Energy Programme”, Korea’s “Basic Plan for Renewable Energy Technology Development and Dissemination”, or Thailand’s “Small Power Producer Programme (SPPP)”. Others focus on promotion of rural electrification like Argentina’s “Renewable Energy and Rural Markets” (PERMER), Morocco’s ambitious “Global Rural Electrification Programme (PERG)”, or Chile’s “Rural National Electrification Programme 2003-2006”.
• Local incentive packages: Several governments in developing countries and economies in transition have designed incentive packages (e.g. India), soft loans (e.g. Slovenia) and tax reductions (e.g. China) to attract foreign direct investment (FDI) into their infrastructure development.
• Enhancing conditions for overseas development assistance (ODA): Developing countries are increasingly participating in certain international development programmes designed to promote renewable energies with the active role of bi-lateral and multilateral assistance agencies, international financial institutions (IFIs) or private foundations. These programmes, combined with creative funding, represent a spectacular part of the development of renewables in the developing world.

World Energy Council Renewable Energy Projects Handbook
20
• Climate change policies: A number of emissions trade schemes have been designed to boost renewable energies in developing countries. The Clean Development Mechanism (CDM) can be used to promote renewables projects in developing countries to off-set emission reduction commitments under the Kyoto protocol in developed countries which by investing in developing countries can earn credits.
Social Considerations Development of renewable energies has a number of social implications:
In developed countries Renewables contribute to energy security and sustainable development. Diversification of the energy mix to include indigenous, locally available energy sources contributes to national economies, lessens the dependence on imported fuels and can help mitigate impacts of fossil fuel price swings on national budgets. The environmental benefits of using renewable energy support global efforts to decrease greenhouse gas (GHG) emissions and also have a positive influence on the global environment and on public health. In developed countries, renewable energy options often engage the community in energy decision making by encouraging individual responsibility. This trend will grow in the future.
In developing countries National economies benefit from using indigenous energy resources, as this improves their trade balances. Small scale and modular renewable technologies are suited to the energy needs of remote, off-grid areas. The provision of modern energy services to people living in rural areas helps decrease migration to cities, creates local jobs, provides power for agriculture (pumping, etc.) and supports village-scale activities, skills and technology transfer.
The use of pollution-free modern renewable energy technologies by the energy industries of developing countries could leapfrog the usual development patterns and diminish the role of the robust, fossil technologies in such countries.
Environment Concerns about the environment and the perceived dangers to humanity from the uncontrolled increase of greenhouse gas (GHG) emissions have focused international efforts on the promotion of clean, environmentally friendly policies, which almost without exception also promote renewables. These efforts are still in the initial phase, and though the will is there, the high price of applying the specific steps does restrict the process.
Reduction of Emissions International policy developments to curb global GHG emissions are based on the 1992 UN Framework Convention on Climate Change (UNFCCC) and the Kyoto Protocol (KP). The UNFCCC represents an international agreement to stabilise GHG concentrations in the atmosphere on 1990 levels. The KP calls for developed nations to cut their GHG emissions by an average of 5.2% from the 1990 levels by 2008-2012. The expected goal for EU countries is 8% reduction from their 1990 GHG emission level by 2008-2012. The Protocol needs to be ratified by 55 countries representing 55% of the 1990 global emissions in order to be valid.
Emissions reductions on national levels can be met with the help of environmental pollution standards, green certification programmes, and promotion of renewable energy (e.g. Renewable Portfolio Standards in the US, Renewables Obligation in the UK, etc.), climate change levies (e.g. the UK Climate Change Levy), and maximum emission allowances. Renewable certificates, green certificates, and carbon credits are often designed to be tradable in the emissions market. The UK Government, for example, in April 2002, launched its Emission Trading Scheme (ETS) and a broad pan-European trading system is planned for 2005.
World Energy Council Renewable Energy Projects Handbook
21
International GHG Emissions Trading In order to comply with emissions reduction targets, there are three separate market mechanisms for managing GHG Emissions: • Quantified Emissions Limitation and Reduction Obligation Trading (QUELRO) which allows trading in
assigned amounts of GHG emissions among emissions-capped Annex I countries (developed countries and economies in transition).
• Joint Implementation (JI) – emission trading implemented between two Annex I countries which allows the creation, acquisition and transfer of “emissions reduction units” (ERUs).
• Clean Development Mechanism (CDM) – applicable in developing countries, by allowing the developed countries projects there to generate “certified emission reductions” (CERs). SENTER, a Dutch government agency, has been set-up to assess JI and CDM projects for compliance with the rules governing allocation of carbon credits by the UNFCCC. The assessment is done on the basis of the difference between the emissions in baseline/reference scenarios and the emissions achieved due to evaluated project activities (project scenario). The World Bank in 1999 launched its Prototype Carbon Fund (PCF) to lend money to fund CDM projects. The PCF raised some US$145 million and around 50 proposals are being evaluated to generate US$350 million of carbon emission credits.
The potential market for GHG emissions could be huge. A study by Deutsche Bank suggests that the GHG emissions trading is going to be the biggest market of the century. The study estimates its value at US$100 billion annually. The market will boost clean energy, including renewable energy projects, and will generate movement of funds for environmentally benign projects from the developed world to developing countries. Barriers to Promoting Renewable Energy Despite their market penetration, renewables are still perceived as “niche” energy resources. Barriers to their enhanced development are on all levels - cognitive, perceptual, in practical policy attitudes, in legislation and in the economic sphere.
Perceptions: Renewables are perceived by many as complementary energy, still in the “learning curve” phase. Renewables technologies are viewed as relatively new, not sufficiently field proven, under constant R&D; expensive to purchase, to install and to maintain. They are often viewed as small, dispersed (though abundant) resources, of unstable output, incapable of providing sustainable energy. In short, both the resources and the heat conversion technologies lack broad base expertise; information on cost is imprecise; and therefore there are high impediments to possible capital investment.
In developing countries the position of renewables is even more difficult. The technologies are perceived as suitable only for the rich; too sophisticated, difficult to maintain and therefore unaffordable to the poorer nations. The problems developing countries face cannot, in their opinion, be addressed, by renewable energies. The “big” electrification problem is seen to be solved by robust, fossil technologies (as in the developed world).
Policies: On a higher level, the energy market still lacks a coherent and comprehensive policy. In many countries there is a still unsettled, even preferential, policy subsidising fossil energy. On the other hand, policy in the main still does not take into account the socio-environmental costs of fossil fuels and the possible contribution of clean, environmentally friendly renewables in this respect. The implementation of energy market de-regulation in certain developed countries is accompanied by a laissez-faire policy, which harms, inter alia, renewable energy development. The subsidy system or other support systems for promoting renewables were put on “hold”. Vested interests of the influential “fossil lobby” prevailed. In developing countries the policy barriers to the development of renewable energy are inherent in the local energy system structure. The quest for rapid development leads the decision makers to unclear policies, lack of consistency, and lack of a regulatory framework to support private ownership. These often lead to unsustainable, sporadic energy infrastructure development, to spectacular, centre-oriented projects and quick-fix policies. As a result of such short-term policies, numbers of diesel generators are installed in
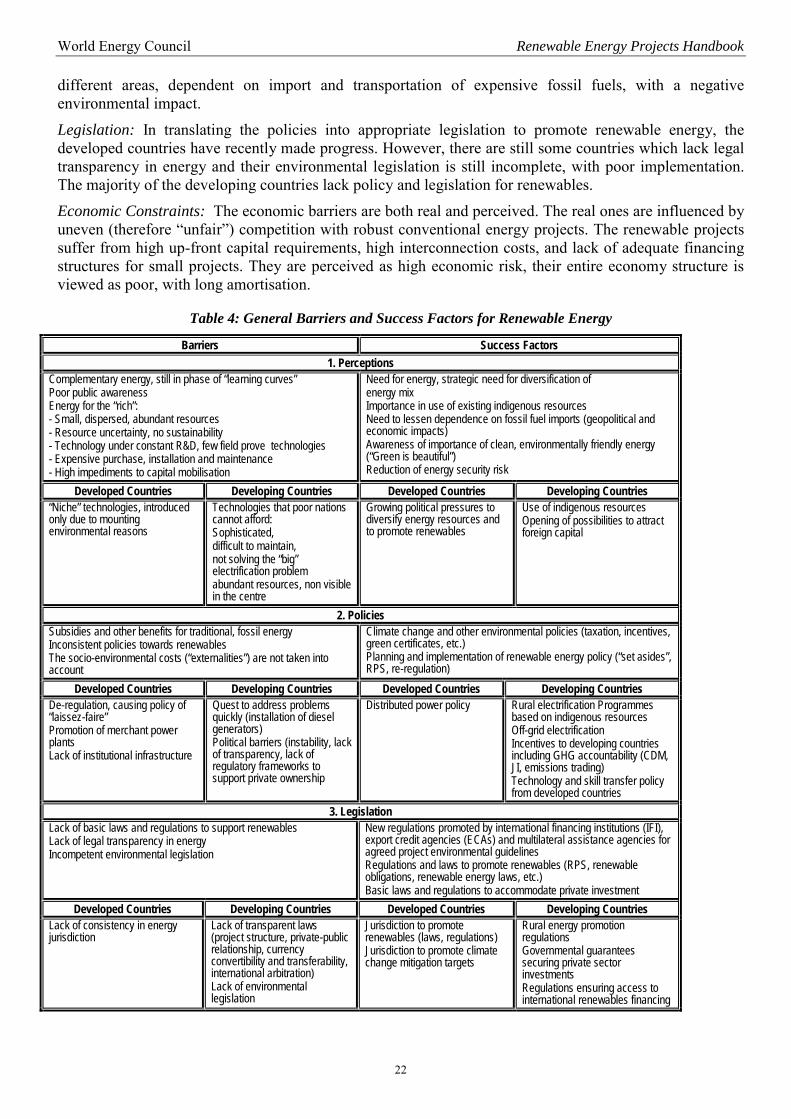
World Energy Council Renewable Energy Projects Handbook
22
different areas, dependent on import and transportation of expensive fossil fuels, with a negative environmental impact.
Legislation: In translating the policies into appropriate legislation to promote renewable energy, the developed countries have recently made progress. However, there are still some countries which lack legal transparency in energy and their environmental legislation is still incomplete, with poor implementation. The majority of the developing countries lack policy and legislation for renewables. Economic Constraints: The economic barriers are both real and perceived. The real ones are influenced by uneven (therefore “unfair”) competition with robust conventional energy projects. The renewable projects suffer from high up-front capital requirements, high interconnection costs, and lack of adequate financing structures for small projects. They are perceived as high economic risk, their entire economy structure is viewed as poor, with long amortisation.
Table 4: General Barriers and Success Factors for Renewable Energy
Barriers Success Factors 1. Perceptions
Complementary energy, still in phase of “learning curves” Poor public awareness Energy for the “rich”: - Small, dispersed, abundant resources - Resource uncertainty, no sustainability - Technology under constant R&D, few field prove technologies - Expensive purchase, installation and maintenance - High impediments to capital mobilisation
Need for energy, strategic need for diversification of energy mix Importance in use of existing indigenous resources Need to lessen dependence on fossil fuel imports (geopolitical and economic impacts) Awareness of importance of clean, environmentally friendly energy (“Green is beautiful”) Reduction of energy security risk
Developed Countries Developing Countries Developed Countries Developing Countries “Niche” technologies, introduced only due to mounting environmental reasons
Technologies that poor nations cannot afford: Sophisticated, difficult to maintain, not solving the “big” electrification problem abundant resources, non visible in the centre
Growing political pressures to diversify energy resources and to promote renewables
Use of indigenous resources Opening of possibilities to attract foreign capital
2. Policies Subsidies and other benefits for traditional, fossil energy Inconsistent policies towards renewables The socio-environmental costs (“externalities”) are not taken into account
Climate change and other environmental policies (taxation, incentives, green certificates, etc.) Planning and implementation of renewable energy policy (“set asides”, RPS, re-regulation)
Developed Countries Developing Countries Developed Countries Developing Countries De-regulation, causing policy of “laissez-faire” Promotion of merchant power plants Lack of institutional infrastructure
Quest to address problems quickly (installation of diesel generators) Political barriers (instability, lack of transparency, lack of regulatory frameworks to support private ownership
Distributed power policy
Rural electrification Programmes based on indigenous resources Off-grid electrification Incentives to developing countries including GHG accountability (CDM, JI, emissions trading) Technology and skill transfer policy from developed countries
3. Legislation Lack of basic laws and regulations to support renewables Lack of legal transparency in energy Incompetent environmental legislation
New regulations promoted by international financing institutions (IFI), export credit agencies (ECAs) and multilateral assistance agencies for agreed project environmental guidelines Regulations and laws to promote renewables (RPS, renewable obligations, renewable energy laws, etc.) Basic laws and regulations to accommodate private investment
Developed Countries Developing Countries Developed Countries Developing Countries Lack of consistency in energy jurisdiction
Lack of transparent laws (project structure, private-public relationship, currency convertibility and transferability, international arbitration) Lack of environmental legislation
Jurisdiction to promote renewables (laws, regulations) Jurisdiction to promote climate change mitigation targets
Rural energy promotion regulations Governmental guarantees securing private sector investments Regulations ensuring access to international renewables financing
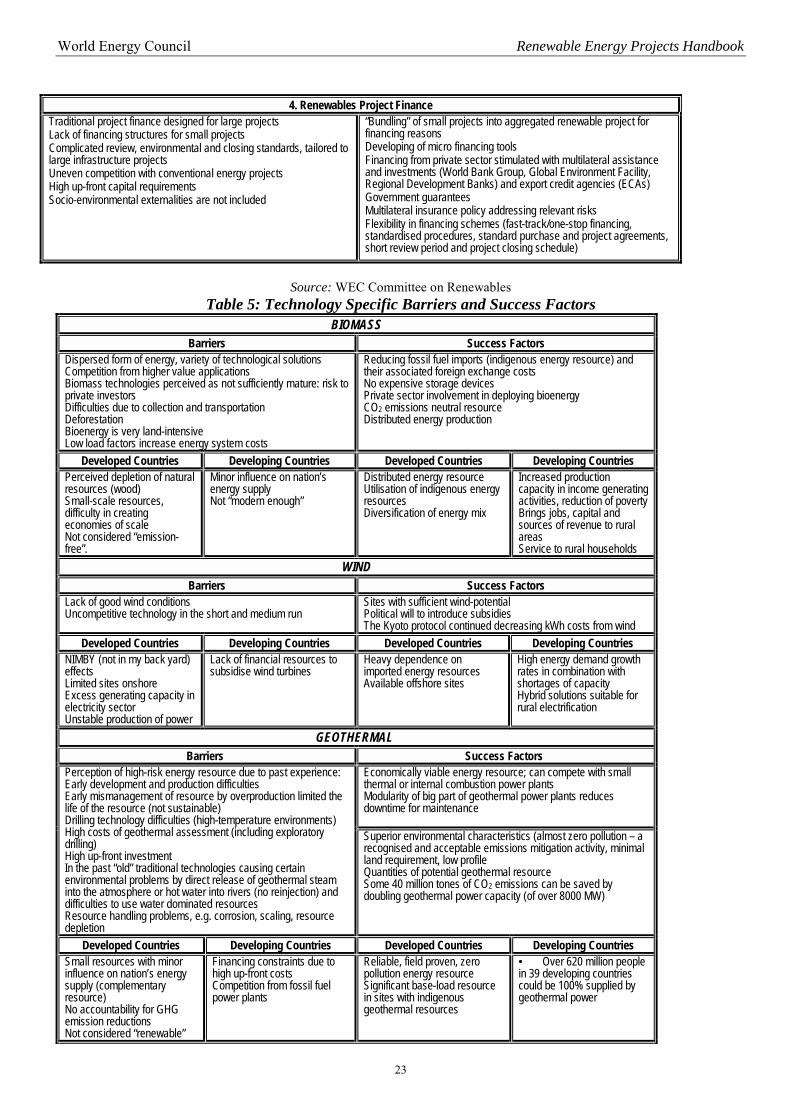
World Energy Council Renewable Energy Projects Handbook
23
4. Renewables Project Finance
Traditional project finance designed for large projects Lack of financing structures for small projects Complicated review, environmental and closing standards, tailored to large infrastructure projects Uneven competition with conventional energy projects High up-front capital requirements Socio-environmental externalities are not included
“Bundling” of small projects into aggregated renewable project for financing reasons Developing of micro financing tools Financing from private sector stimulated with multilateral assistance and investments (World Bank Group, Global Environment Facility, Regional Development Banks) and export credit agencies (ECAs) Government guarantees Multilateral insurance policy addressing relevant risks Flexibility in financing schemes (fast-track/one-stop financing, standardised procedures, standard purchase and project agreements, short review period and project closing schedule)
Source: WEC Committee on Renewables Table 5: Technology Specific Barriers and Success Factors
BIOMASS Barriers Success Factors
Dispersed form of energy, variety of technological solutions Competition from higher value applications Biomass technologies perceived as not sufficiently mature: risk to private investors Difficulties due to collection and transportation Deforestation Bioenergy is very land-intensive Low load factors increase energy system costs
Reducing fossil fuel imports (indigenous energy resource) and their associated foreign exchange costs No expensive storage devices Private sector involvement in deploying bioenergy CO2 emissions neutral resource Distributed energy production
Developed Countries Developing Countries Developed Countries Developing Countries Perceived depletion of natural resources (wood) Small-scale resources, difficulty in creating economies of scale Not considered “emission-free”.
Minor influence on nation’s energy supply Not “modern enough”
Distributed energy resource Utilisation of indigenous energy resources Diversification of energy mix
Increased production capacity in income generating activities, reduction of poverty Brings jobs, capital and sources of revenue to rural areas Service to rural households
WIND Barriers Success Factors
Lack of good wind conditions Uncompetitive technology in the short and medium run
Sites with sufficient wind-potential Political will to introduce subsidies The Kyoto protocol continued decreasing kWh costs from wind
Developed Countries Developing Countries Developed Countries Developing Countries NIMBY (not in my back yard) effects Limited sites onshore Excess generating capacity in electricity sector Unstable production of power
Lack of financial resources to subsidise wind turbines
Heavy dependence on imported energy resources Available offshore sites
High energy demand growth rates in combination with shortages of capacity Hybrid solutions suitable for rural electrification
GEOTHERMAL Barriers Success Factors
Economically viable energy resource; can compete with small thermal or internal combustion power plants Modularity of big part of geothermal power plants reduces downtime for maintenance
Perception of high-risk energy resource due to past experience: Early development and production difficulties Early mismanagement of resource by overproduction limited the life of the resource (not sustainable) Drilling technology difficulties (high-temperature environments) High costs of geothermal assessment (including exploratory drilling) High up-front investment In the past “old” traditional technologies causing certain environmental problems by direct release of geothermal steam into the atmosphere or hot water into rivers (no reinjection) and difficulties to use water dominated resources Resource handling problems, e.g. corrosion, scaling, resource depletion
Superior environmental characteristics (almost zero pollution – a recognised and acceptable emissions mitigation activity, minimal land requirement, low profile Quantities of potential geothermal resource Some 40 million tones of CO2 emissions can be saved by doubling geothermal power capacity (of over 8000 MW)
Developed Countries Developing Countries Developed Countries Developing Countries Small resources with minor influence on nation’s energy supply (complementary resource) No accountability for GHG emission reductions Not considered “renewable”
Financing constraints due to high up-front costs Competition from fossil fuel power plants
Reliable, field proven, zero pollution energy resource Significant base-load resource in sites with indigenous geothermal resources
• Over 620 million people in 39 developing countries could be 100% supplied by geothermal power
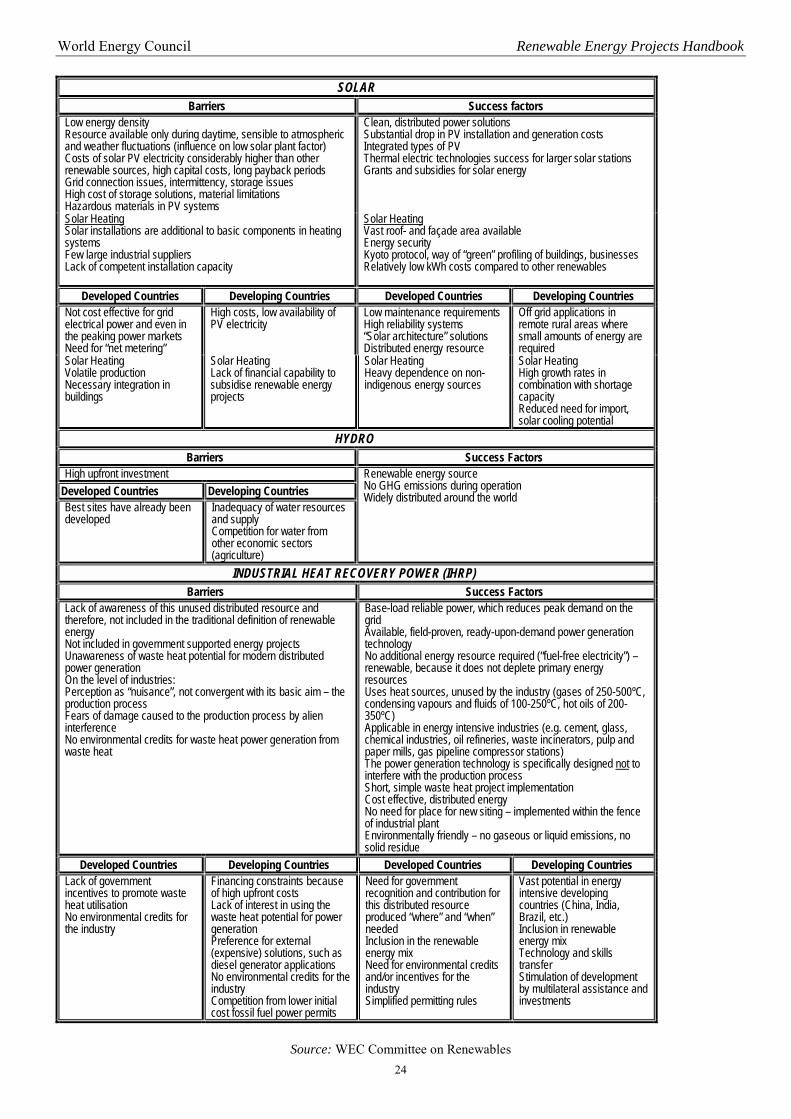
World Energy Council Renewable Energy Projects Handbook
24
SOLAR Barriers Success factors
Low energy density Resource available only during daytime, sensible to atmospheric and weather fluctuations (influence on low solar plant factor) Costs of solar PV electricity considerably higher than other renewable sources, high capital costs, long payback periods Grid connection issues, intermittency, storage issues High cost of storage solutions, material limitations Hazardous materials in PV systems
Clean, distributed power solutions Substantial drop in PV installation and generation costs Integrated types of PV Thermal electric technologies success for larger solar stations Grants and subsidies for solar energy
Solar Heating Solar installations are additional to basic components in heating systems Few large industrial suppliers Lack of competent installation capacity
Solar Heating Vast roof- and façade area available Energy security Kyoto protocol, way of “green” profiling of buildings, businesses Relatively low kWh costs compared to other renewables
Developed Countries Developing Countries Developed Countries Developing Countries Not cost effective for grid electrical power and even in the peaking power markets Need for “net metering”
High costs, low availability of PV electricity
Low maintenance requirements High reliability systems “Solar architecture” solutions Distributed energy resource
Off grid applications in remote rural areas where small amounts of energy are required
Solar Heating Volatile production Necessary integration in buildings
Solar Heating Lack of financial capability to subsidise renewable energy projects
Solar Heating Heavy dependence on non-indigenous energy sources
Solar Heating High growth rates in combination with shortage capacity Reduced need for import, solar cooling potential
HYDRO Barriers Success Factors
High upfront investment Developed Countries Developing Countries Best sites have already been developed
Inadequacy of water resources and supply Competition for water from other economic sectors (agriculture)
Renewable energy source No GHG emissions during operation Widely distributed around the world
INDUSTRIAL HEAT RECOVERY POWER (IHRP) Barriers Success Factors
Lack of awareness of this unused distributed resource and therefore, not included in the traditional definition of renewable energy Not included in government supported energy projects Unawareness of waste heat potential for modern distributed power generation On the level of industries: Perception as “nuisance”, not convergent with its basic aim – the production process Fears of damage caused to the production process by alien interference No environmental credits for waste heat power generation from waste heat
Base-load reliable power, which reduces peak demand on the grid Available, field-proven, ready-upon-demand power generation technology No additional energy resource required (“fuel-free electricity”) – renewable, because it does not deplete primary energy resources Uses heat sources, unused by the industry (gases of 250-500ºC, condensing vapours and fluids of 100-250ºC, hot oils of 200-350ºC) Applicable in energy intensive industries (e.g. cement, glass, chemical industries, oil refineries, waste incinerators, pulp and paper mills, gas pipeline compressor stations) The power generation technology is specifically designed not to interfere with the production process Short, simple waste heat project implementation Cost effective, distributed energy No need for place for new siting – implemented within the fence of industrial plant Environmentally friendly – no gaseous or liquid emissions, no solid residue
Developed Countries Developing Countries Developed Countries Developing Countries Lack of government incentives to promote waste heat utilisation No environmental credits for the industry
Financing constraints because of high upfront costs Lack of interest in using the waste heat potential for power generation Preference for external (expensive) solutions, such as diesel generator applications No environmental credits for the industry Competition from lower initial cost fossil fuel power permits
Need for government recognition and contribution for this distributed resource produced “where” and “when” needed Inclusion in the renewable energy mix Need for environmental credits and/or incentives for the industry Simplified permitting rules
Vast potential in energy intensive developing countries (China, India, Brazil, etc.) Inclusion in renewable energy mix Technology and skills transfer Stimulation of development by multilateral assistance and investments
Source: WEC Committee on Renewables
World Energy Council Renewable Energy Projects Handbook
25
2. FINANCIAL, TECHNICAL & OTHER CRITERIA FOR SELECTING AND EVALUATING RENEWABLE ENERGY PROJECTS
This section presents the different criteria a prospective project developer has to take into consideration in evaluating specific renewable energy projects. 2.1 Resource Availability Renewable energy resources are broadly distributed but relatively diffuse. The initial stage of resource location, identification and exploration demands special exploration techniques and technology evaluation tools, as well as economical estimates regarding the viability of resource exploration. This first crucial step is broadly recognised as one of the potential risks, which will influence the viability of the project as a whole. Demand Side Considerations The demand for energy varies over a 24-hour day. Renewable energies can provide electricity according to their basic characteristics. Some renewables can operate in base load (i.e. geothermal, IHRP, hydro), while intermittent resources (e.g. wind, solar) are best suited as stand-alone power sources or as complementary sources. Interconnected grids enable renewable energy transfer from regions of production to the customers in populated centres. Energy demand is closely tied to economic activities, which vary across the world. The deployment of renewables depends on its basic characteristics as well as on the nature of the energy market. The basic four different markets are: • Off-grid markets in developing countries • Grid markets in developing countries • Off-grid markets in developed countries • Grid markets in developed countries Off-grid markets in developing countries Nearly 1.6 billion people living in developing countries do not have access to modern energy; therefore the first priority is to ensure more effective and sustainable use of biomass for cooling, heating and cooking. The off-grid electricity in remote rural areas can be generated in several ways, both by fossil-fired power generators (mostly diesel) and by renewable sources. Geothermal energy, modern biomass or hydro can generate the base load, provided the resources are identified, available, accessible and acceptable. Solar and wind sources are suitable as basic off-grid power resources in conjunction with solar batteries, wind storage, or a mix of resources to enable electricity supply 24 hours a day.
The provision of reliable electric power, modern cooking and heating to rural areas of developing countries is a precondition for the sustainable development of these areas, by opening wide horizons to their development (avoiding migration, the development of small industry agriculture, domestic manufacturing, with positive socio-economic contribution).
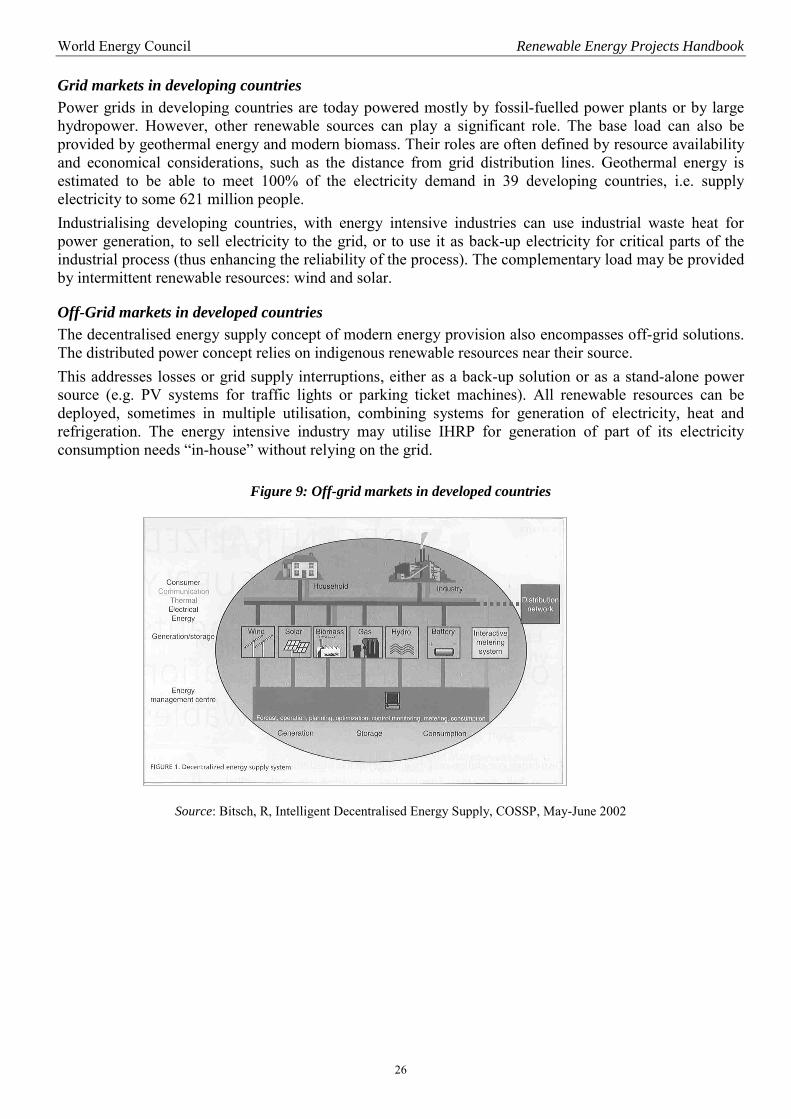
World Energy Council Renewable Energy Projects Handbook
26
Grid markets in developing countries Power grids in developing countries are today powered mostly by fossil-fuelled power plants or by large hydropower. However, other renewable sources can play a significant role. The base load can also be provided by geothermal energy and modern biomass. Their roles are often defined by resource availability and economical considerations, such as the distance from grid distribution lines. Geothermal energy is estimated to be able to meet 100% of the electricity demand in 39 developing countries, i.e. supply electricity to some 621 million people. Industrialising developing countries, with energy intensive industries can use industrial waste heat for power generation, to sell electricity to the grid, or to use it as back-up electricity for critical parts of the industrial process (thus enhancing the reliability of the process). The complementary load may be provided by intermittent renewable resources: wind and solar.
Off-Grid markets in developed countries The decentralised energy supply concept of modern energy provision also encompasses off-grid solutions. The distributed power concept relies on indigenous renewable resources near their source. This addresses losses or grid supply interruptions, either as a back-up solution or as a stand-alone power source (e.g. PV systems for traffic lights or parking ticket machines). All renewable resources can be deployed, sometimes in multiple utilisation, combining systems for generation of electricity, heat and refrigeration. The energy intensive industry may utilise IHRP for generation of part of its electricity consumption needs “in-house” without relying on the grid.
Figure 9: Off-grid markets in developed countries
Source: Bitsch, R, Intelligent Decentralised Energy Supply, COSSP, May-June 2002
World Energy Council Renewable Energy Projects Handbook
27
Grid markets in developed countries These markets are already highly developed, and based mostly on fossil fuels, large hydro and nuclear power. The role of renewable energy depends on governmental schemes for the promotion of renewables. Their role in the coming decades is expected to grow, but will remain marginal. Geothermal, IHRP, hydro are capable of contributing continuous energy input to the baseload, while biomass will feed the intermediate load and solar and wind the peak load. Modern grid markets in the future are expected to be more complex than the current centralised grid system. A new, integrated mixed centralised/decentralised system is expected to appear comprising small-scale power generation units (e.g. from wind, solar, hydro, biomass or gas), storage units, (e.g. in the form of batteries), and industrial and private consumers (see schematic below). They will be operated with or without a network system connection. Existing diesel generating stations or other fossil-fuel generating plants may be integrated in the system. In biomass and IHRP power plants, heat is generated in addition to electrical energy, and it can be separated and supplied to consumers both for production processes and, of course, for heating. To make the system work, the parameters of the generating and storage units are defined and passed on to an energy management centre. They will be then matched to the load requirements on the consumer side by a load centred management system. It will also be possible for the customer to influence energy imports by means of net metering, either arbitrarily or on the basis of flexible tariffs. This will encourage the customer to adopt a more efficient energy consumption pattern. Success will depend on effective communication channels between generation, storage, the consumer and the control centre, in addition to an innovative, decentralised energy management system with forecasting, scheduling and on-line optimisation.
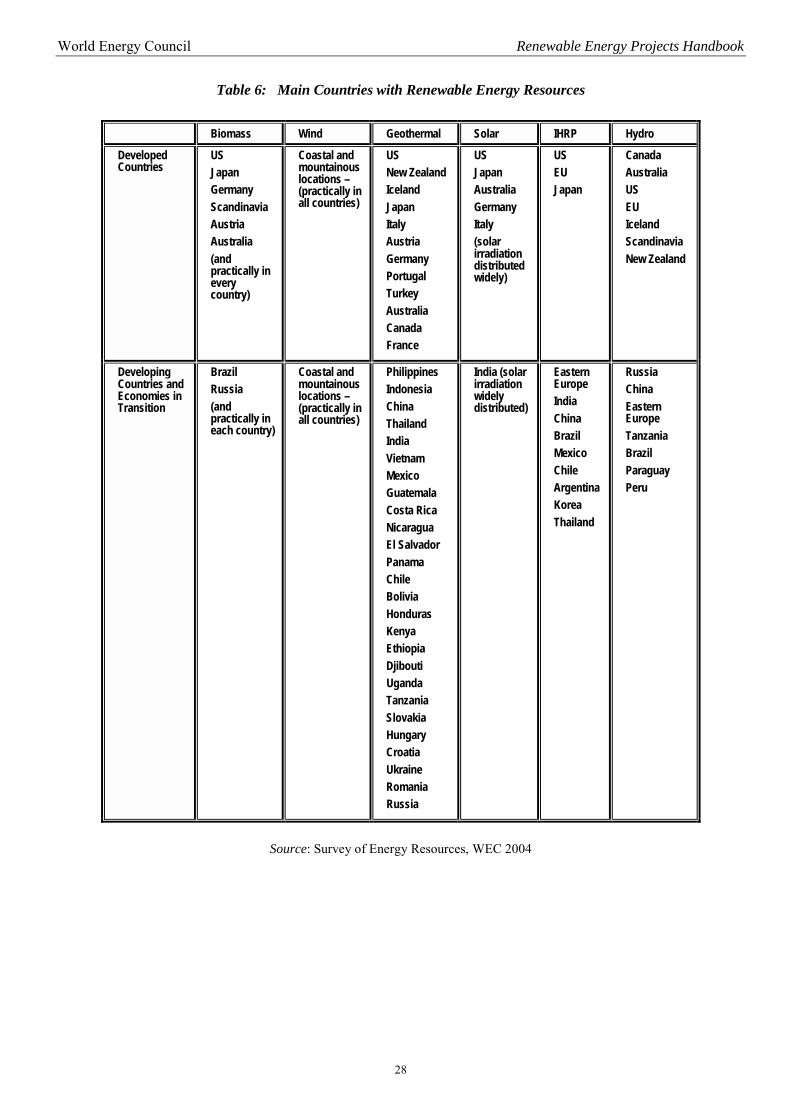
World Energy Council Renewable Energy Projects Handbook
28
Table 6: Main Countries with Renewable Energy Resources
Biomass Wind Geothermal Solar IHRP Hydro
Developed Countries
US Japan Germany Scandinavia Austria Australia (and practically in every country)
Coastal and mountainous locations – (practically in all countries)
US New Zealand Iceland Japan Italy Austria Germany Portugal Turkey Australia Canada France
US Japan Australia Germany Italy (solar irradiation distributed widely)
US EU Japan
Canada Australia US EU Iceland Scandinavia New Zealand
Developing Countries and Economies in Transition
Brazil Russia (and practically in each country)
Coastal and mountainous locations – (practically in all countries)
Philippines Indonesia China Thailand India Vietnam Mexico Guatemala Costa Rica Nicaragua El Salvador Panama Chile Bolivia Honduras Kenya Ethiopia Djibouti Uganda Tanzania Slovakia Hungary Croatia Ukraine Romania Russia
India (solar irradiation widely distributed)
Eastern Europe India China Brazil Mexico Chile Argentina Korea Thailand
Russia China Eastern Europe Tanzania Brazil Paraguay Peru
Source: Survey of Energy Resources, WEC 2004
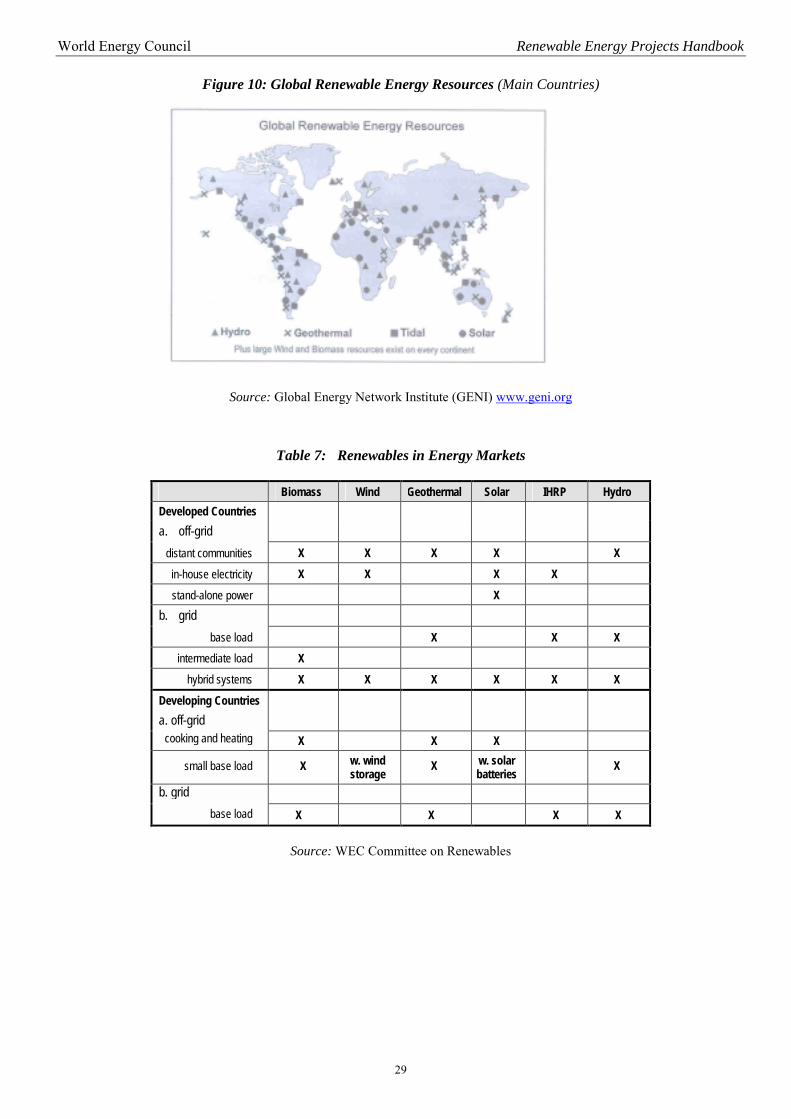
World Energy Council Renewable Energy Projects Handbook
29
Figure 10: Global Renewable Energy Resources (Main Countries)
Source: Global Energy Network Institute (GENI) www.geni.org
Table 7: Renewables in Energy Markets
Biomass Wind Geothermal Solar IHRP Hydro Developed Countries a. off-grid
distant communities X X X X X
in-house electricity X X X X
stand-alone power X b. grid
base load X X X intermediate load X
hybrid systems X X X X X X
Developing Countries a. off-grid
cooking and heating X X X
small base load X w. wind storage X w. solar
batteries X
b. grid base load X X X X
Source: WEC Committee on Renewables
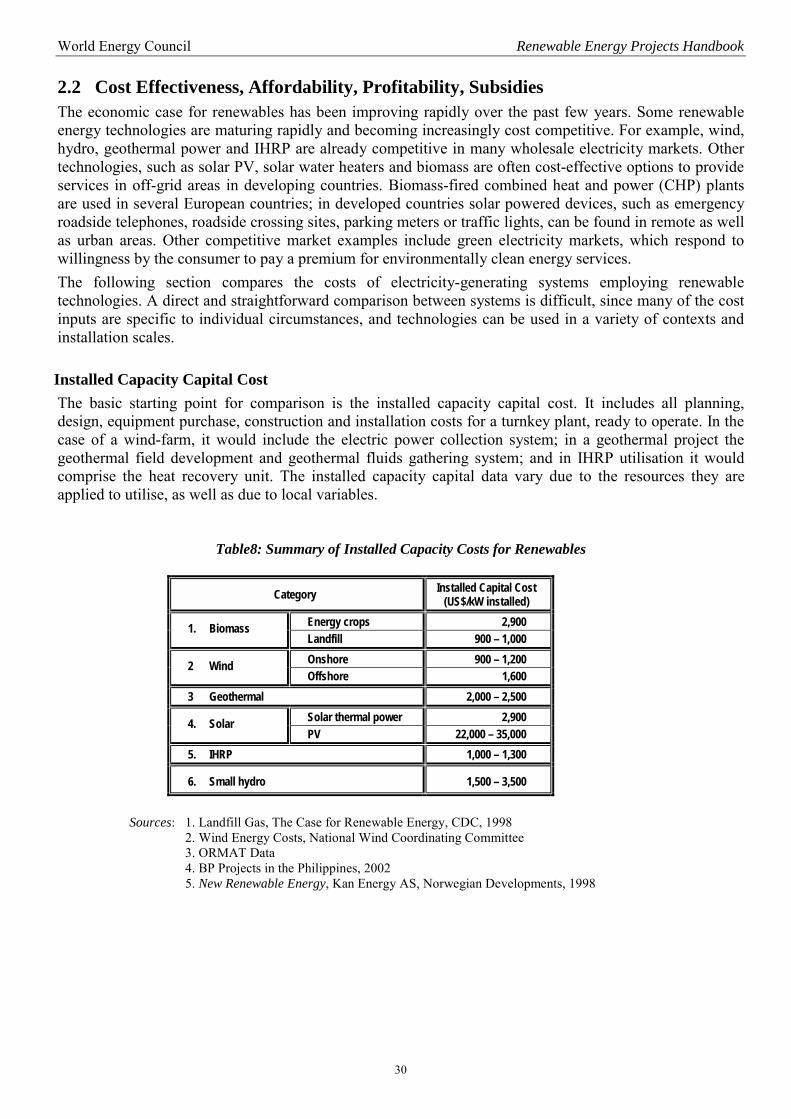
World Energy Council Renewable Energy Projects Handbook
30
2.2 Cost Effectiveness, Affordability, Profitability, Subsidies The economic case for renewables has been improving rapidly over the past few years. Some renewable energy technologies are maturing rapidly and becoming increasingly cost competitive. For example, wind, hydro, geothermal power and IHRP are already competitive in many wholesale electricity markets. Other technologies, such as solar PV, solar water heaters and biomass are often cost-effective options to provide services in off-grid areas in developing countries. Biomass-fired combined heat and power (CHP) plants are used in several European countries; in developed countries solar powered devices, such as emergency roadside telephones, roadside crossing sites, parking meters or traffic lights, can be found in remote as well as urban areas. Other competitive market examples include green electricity markets, which respond to willingness by the consumer to pay a premium for environmentally clean energy services. The following section compares the costs of electricity-generating systems employing renewable technologies. A direct and straightforward comparison between systems is difficult, since many of the cost inputs are specific to individual circumstances, and technologies can be used in a variety of contexts and installation scales. Installed Capacity Capital Cost The basic starting point for comparison is the installed capacity capital cost. It includes all planning, design, equipment purchase, construction and installation costs for a turnkey plant, ready to operate. In the case of a wind-farm, it would include the electric power collection system; in a geothermal project the geothermal field development and geothermal fluids gathering system; and in IHRP utilisation it would comprise the heat recovery unit. The installed capacity capital data vary due to the resources they are applied to utilise, as well as due to local variables.
Table8: Summary of Installed Capacity Costs for Renewables
Category Installed Capital Cost (US$/kW installed)
Energy crops 2,900 1. Biomass Landfill 900 – 1,000 Onshore 900 – 1,200 2 Wind Offshore 1,600
3 Geothermal 2,000 – 2,500 Solar thermal power 2,900 4. Solar PV 22,000 – 35,000
5. IHRP 1,000 – 1,300
6. Small hydro 1,500 – 3,500
Sources: 1. Landfill Gas, The Case for Renewable Energy, CDC, 1998 2. Wind Energy Costs, National Wind Coordinating Committee 3. ORMAT Data 4. BP Projects in the Philippines, 2002 5. New Renewable Energy, Kan Energy AS, Norwegian Developments, 1998
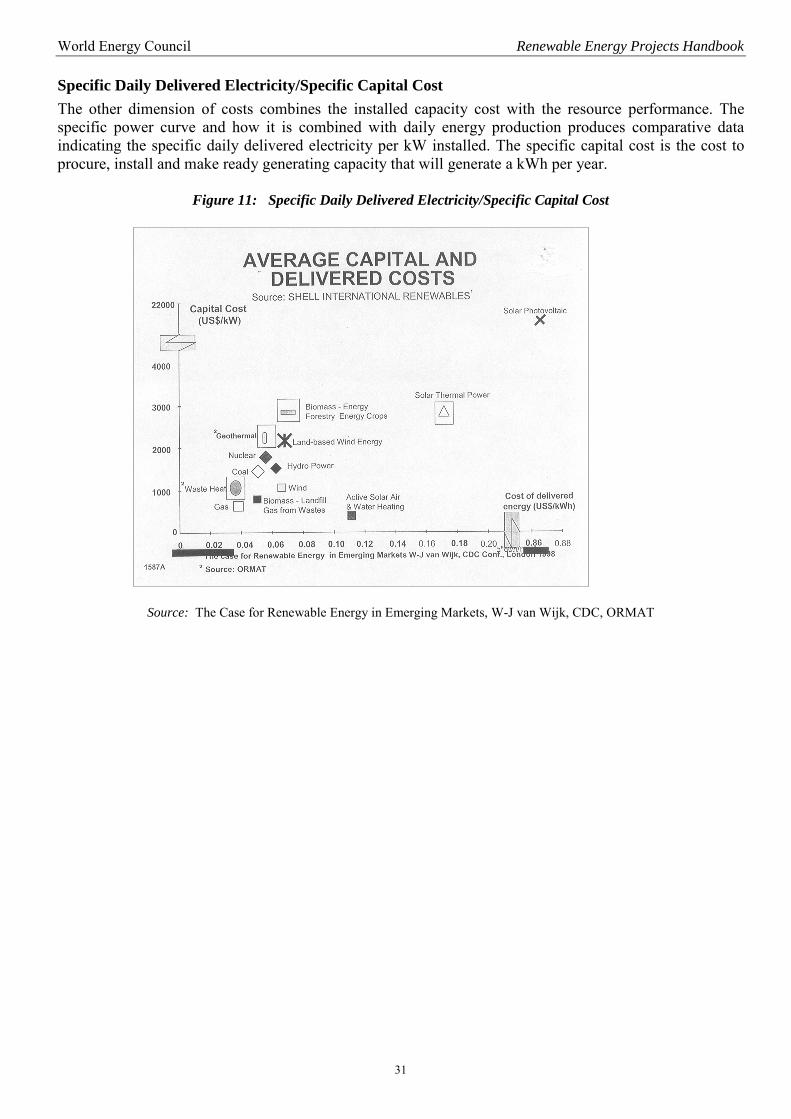
World Energy Council Renewable Energy Projects Handbook
31
Specific Daily Delivered Electricity/Specific Capital Cost The other dimension of costs combines the installed capacity cost with the resource performance. The specific power curve and how it is combined with daily energy production produces comparative data indicating the specific daily delivered electricity per kW installed. The specific capital cost is the cost to procure, install and make ready generating capacity that will generate a kWh per year.
Figure 11: Specific Daily Delivered Electricity/Specific Capital Cost
Source: The Case for Renewable Energy in Emerging Markets, W-J van Wijk, CDC, ORMAT
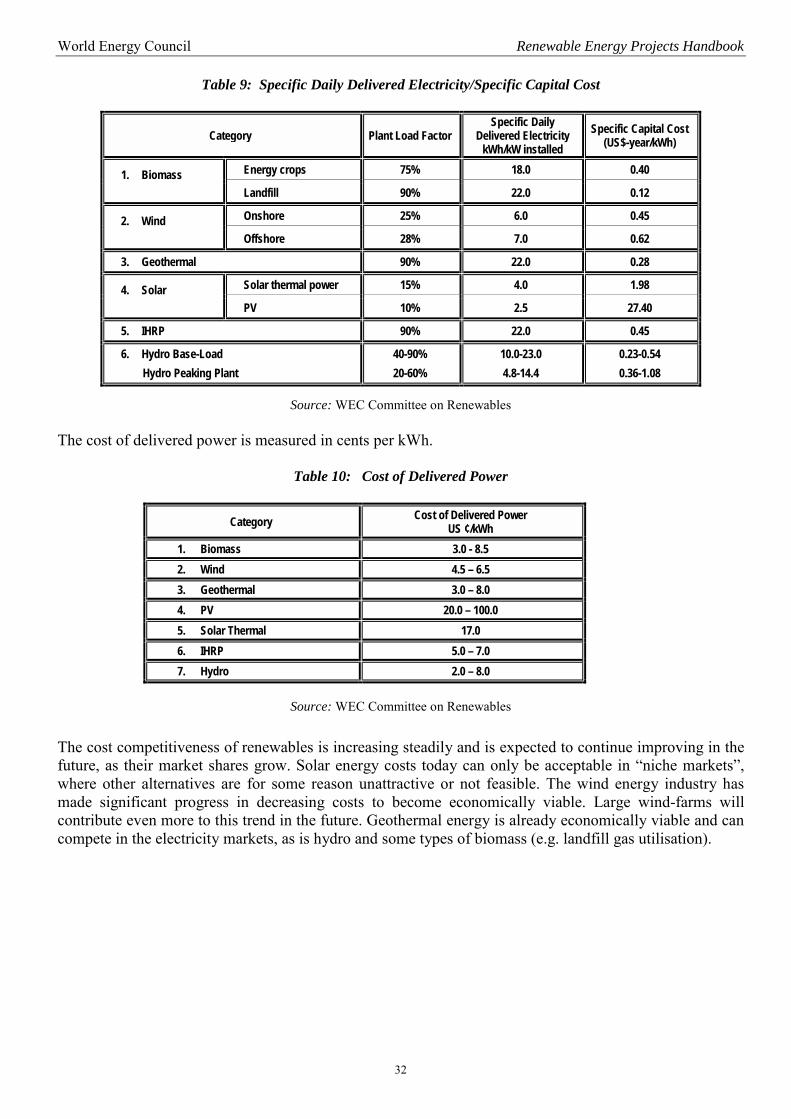
World Energy Council Renewable Energy Projects Handbook
32
Table 9: Specific Daily Delivered Electricity/Specific Capital Cost
Category Plant Load Factor Specific Daily
Delivered Electricity kWh/kW installed
Specific Capital Cost (US$-year/kWh)
Energy crops 75% 18.0 0.40 1. Biomass Landfill 90% 22.0 0.12
Onshore 25% 6.0 0.45 2. Wind Offshore 28% 7.0 0.62
3. Geothermal 90% 22.0 0.28
Solar thermal power 15% 4.0 1.98 4. Solar PV 10% 2.5 27.40
5. IHRP 90% 22.0 0.45
6. Hydro Base-Load Hydro Peaking Plant
40-90% 20-60%
10.0-23.0 4.8-14.4
0.23-0.54 0.36-1.08
Source: WEC Committee on Renewables
The cost of delivered power is measured in cents per kWh.
Table 10: Cost of Delivered Power
Category Cost of Delivered Power US ¢/kWh
1. Biomass 3.0 - 8.5 2. Wind 4.5 – 6.5 3. Geothermal 3.0 – 8.0 4. PV 20.0 – 100.0 5. Solar Thermal 17.0 6. IHRP 5.0 – 7.0 7. Hydro 2.0 – 8.0
Source: WEC Committee on Renewables
The cost competitiveness of renewables is increasing steadily and is expected to continue improving in the future, as their market shares grow. Solar energy costs today can only be acceptable in “niche markets”, where other alternatives are for some reason unattractive or not feasible. The wind energy industry has made significant progress in decreasing costs to become economically viable. Large wind-farms will contribute even more to this trend in the future. Geothermal energy is already economically viable and can compete in the electricity markets, as is hydro and some types of biomass (e.g. landfill gas utilisation).
World Energy Council Renewable Energy Projects Handbook
33
Financing Barriers There are two main barriers to the large-scale development of renewable energy: • Uneven terms of competition with conventional energy projects • Lack of adequate financing structures for small projects (the majority of renewable projects are small). The traditional project finance is designed for large projects. Moreover, the fossil-energy industry has for years dominated the market and often received subsidies. Most of the current structures were designed for rapid promotion of robust projects (to meet the requirements of rapid growth of the energy sector). In this structure there is only a “niche” place for renewables. Small renewable projects have to cope with the difficulties posed by the structure of the market and the traditional tools the financing institutions have designed for that structure. Renewable energy projects which are small-sized, with high up-front capital requirements and which are relatively unknown, have to be “balanced” by their benefits, i.e. social and environmental contributions and their role in sustainable energy development. It is hoped that the new energy market will evaluate energy resources in a more comprehensive way by including these “externalities” and by assessing projects through the entire life cycle. For the transition period, however, the countries are developing schemes to boost the penetration of renewable energies into their energy mix by means of policy, such as laws, regulations, subsidies and tax incentives. Role of Incentives and their Influence on Project Profitability Many governments, international finance institutions (IFIs), and non-governmental organisations (NGOs) have put in place incentives to make renewable energy more affordable. The incentives are designed as a catalyst for renewable energy projects in both developed and developing countries and to enhance their economic viability. This can help meet the goals set out by governments in their national energy strategies, by diversification of energy resources in the energy mix and also reap the benefits of environmentally benign technologies. The incentives vary across countries and for each specific project it is important to find out which incentives are available, since they do not always cover all the renewable categories. The main incentives may be divided as follows: • Policy means to restructure the energy markets, such as laws to promote renewables (EU, Germany, Spain) or
regulated “set-asides” for renewables (e.g. RPS in the US, RO in the UK, Italy’s CRS or Australia’s Mandated Renewable Energy Target) and the system of renewable certificates trade.
• Financial incentives including capital grants, low interest subsidised loans (e.g. EU Programmes, ALTENER, SAVE, “Intelligent Energy for Europe”); mandated premium prices for renewable categories known as feed-in-tariffs (e.g. for wind industry in Denmark, Germany, France); investment subsidies (e.g. in Sweden), investment credits (e.g. in Canada); loan guarantees, production and installation subsidies (in the past in Denmark for wind projects); production tax credits (PTC) (in the U.S.); investment tax credits (ITC) (in the U.S.); sales tax reductions (in the U.S.); tax holidays (e.g. in India), etc.
• Loans by IFIs (International Financial Institutions). The IFIs (i.e. WBG, GEF, IFC, BID, EBRD, ADB, etc.) set up funds to invest subsidised loans in renewable energy projects, mostly in developing countries.
• Environmental certificates market. Recently developed additional source for subsidising renewable projects based on trading with green certificates, promoting flow of investments from the developed countries to economies in transition (JI projects) or to the developing countries (CDM projects).
Subsidies demonstrate significant variations. The most supported renewables are solar and wind. Recently support for biomass projects has been growing, while the geothermal and small hydro energy projects have been receiving less support during the last decade, and as a consequence the pace of their development had slowed down, but appears to be now increasing. It would make sense to include IHRP in the renewables promotion packages to recognise its potential contribution to sustainable energy development.
World Energy Council Renewable Energy Projects Handbook
34
2.3 Development, Installation and O&M Installation of Renewable Energy Plants Installation costs vary for each renewable category and nearly for each single project. It is therefore necessary to evaluate the technical capabilities available on the prospective site to construct and run a renewable project. Installation stages comprise: • Resource assessment and analysis • Permitting, surveying, resource development (i.e. development of geothermal field/drilling; developing biomass
crop fields), siting arrangements, etc. • Financing process • Site construction, including service and auxiliary infrastructure (for example, service roads between the wind
turbines) • Construction of the power plant, including the balance of plant • Construction of operation and maintenance facilities, communication and measurement facilities • Integration of the system, checkout and start-up • Commissioning of the project and final commencement of commercial operation. The project developer needs skills and experience in all the above disciplines. In addition to technology transfer, projects in developing countries also often require a transfer of skills. There is a growing trend toward the development of simple, almost automatic, power generation systems that would require minimum maintenance. Such technologies (i.e. geothermal energy, biomass, small hydro, solar PV) have the apparent advantage for installation in developing countries.
Operation and Maintenance The O&M costs for a modern renewable energy power generating project are generally low, since the projects are mostly automated. Maintenance costs include: • preventive maintenance, according to log books by checking the “critical parts” of the project. This minimises
capacity losses or occurrence of unexpected malfunctions • unscheduled maintenance, i.e. repairs following system outages • major overhaul – occurs only every 5-15 years, therefore, only marginally influences the overall O&M costs Recently modern renewable power generating projects have been structured modularly, therefore maintenance outages have only minimal impact on the output of power plants. The modern operation requires few staff, since the generating equipment is mostly automatic. In addition to the costs of the O&M staff, replacement parts and other maintenance items (oils, lubricants, motive fluids, etc.), the O&M cost element includes other routine costs: • property and other taxes • land-use payments (leases and resource acquisition payments) • insurance • transmission access and wheeling fees
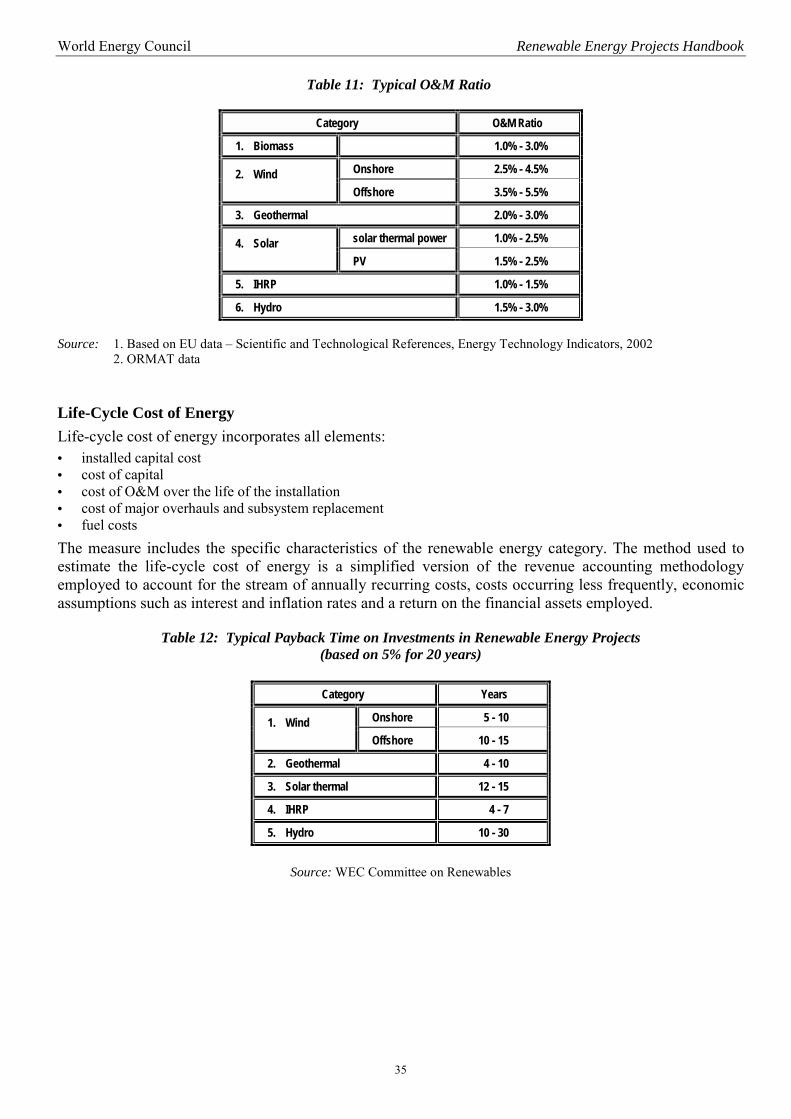
World Energy Council Renewable Energy Projects Handbook
35
Table 11: Typical O&M Ratio
Category O&M Ratio
1. Biomass 1.0% - 3.0%
Onshore 2.5% - 4.5% 2. Wind Offshore 3.5% - 5.5%
3. Geothermal 2.0% - 3.0%
solar thermal power 1.0% - 2.5% 4. Solar PV 1.5% - 2.5%
5. IHRP 1.0% - 1.5%
6. Hydro 1.5% - 3.0%
Source: 1. Based on EU data – Scientific and Technological References, Energy Technology Indicators, 2002
2. ORMAT data Life-Cycle Cost of Energy Life-cycle cost of energy incorporates all elements: • installed capital cost • cost of capital • cost of O&M over the life of the installation • cost of major overhauls and subsystem replacement • fuel costs The measure includes the specific characteristics of the renewable energy category. The method used to estimate the life-cycle cost of energy is a simplified version of the revenue accounting methodology employed to account for the stream of annually recurring costs, costs occurring less frequently, economic assumptions such as interest and inflation rates and a return on the financial assets employed.
Table 12: Typical Payback Time on Investments in Renewable Energy Projects
(based on 5% for 20 years)
Category Years
Onshore 5 - 10 1. Wind Offshore 10 - 15
2. Geothermal 4 - 10
3. Solar thermal 12 - 15
4. IHRP 4 - 7
5. Hydro 10 - 30
Source: WEC Committee on Renewables
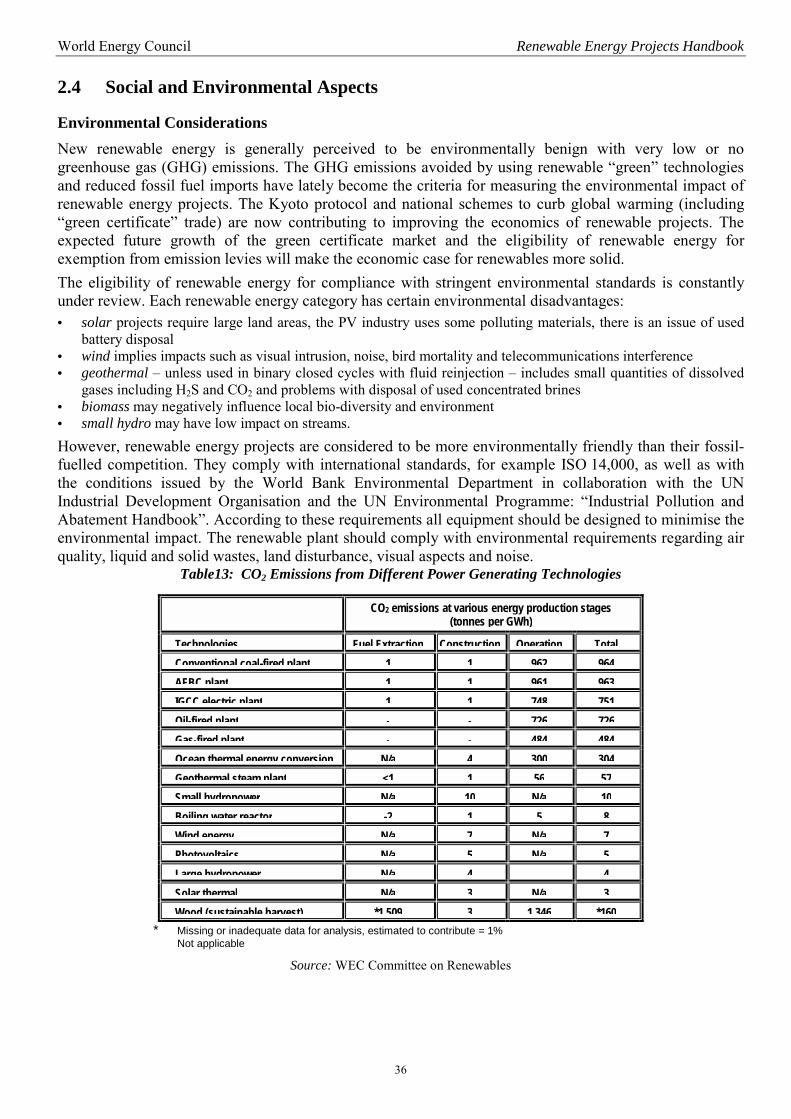
World Energy Council Renewable Energy Projects Handbook
36
2.4 Social and Environmental Aspects
Environmental Considerations New renewable energy is generally perceived to be environmentally benign with very low or no greenhouse gas (GHG) emissions. The GHG emissions avoided by using renewable “green” technologies and reduced fossil fuel imports have lately become the criteria for measuring the environmental impact of renewable energy projects. The Kyoto protocol and national schemes to curb global warming (including “green certificate” trade) are now contributing to improving the economics of renewable projects. The expected future growth of the green certificate market and the eligibility of renewable energy for exemption from emission levies will make the economic case for renewables more solid. The eligibility of renewable energy for compliance with stringent environmental standards is constantly under review. Each renewable energy category has certain environmental disadvantages: • solar projects require large land areas, the PV industry uses some polluting materials, there is an issue of used
battery disposal • wind implies impacts such as visual intrusion, noise, bird mortality and telecommunications interference • geothermal – unless used in binary closed cycles with fluid reinjection – includes small quantities of dissolved
gases including H2S and CO2 and problems with disposal of used concentrated brines • biomass may negatively influence local bio-diversity and environment • small hydro may have low impact on streams. However, renewable energy projects are considered to be more environmentally friendly than their fossil-fuelled competition. They comply with international standards, for example ISO 14,000, as well as with the conditions issued by the World Bank Environmental Department in collaboration with the UN Industrial Development Organisation and the UN Environmental Programme: “Industrial Pollution and Abatement Handbook”. According to these requirements all equipment should be designed to minimise the environmental impact. The renewable plant should comply with environmental requirements regarding air quality, liquid and solid wastes, land disturbance, visual aspects and noise.
Table13: CO2 Emissions from Different Power Generating Technologies
* Missing or inadequate data for analysis, estimated to contribute = 1% Not applicable
Source: WEC Committee on Renewables
CO2 emissions at various energy production stages (tonnes per GWh)
Technologies Fuel Extraction Construction Operation TotalConventional coal-fired plant 1 1 962 964AFBC plant 1 1 961 963IGCC electric plant 1 1 748 751Oil-fired plant - - 726 726Gas-fired plant - - 484 484Ocean thermal energy conversion N/a 4 300 304Geothermal steam plant <1 1 56 57Small hydropower N/a 10 N/a 10Boiling water reactor -2 1 5 8Wind energy N/a 7 N/a 7Photovoltaics N/a 5 N/a 5Large hydropower N/a 4 4Solar thermal N/a 3 N/a 3Wood (sustainable harvest) *1 509 3 1 346 *160
World Energy Council Renewable Energy Projects Handbook
37
The environmental advantage of renewable energy is measurable and it is becoming an important economic factor in the energy market. This is true for both developed and developing countries. The inclusion of the environmental contribution of renewables, so called “externality” into the life-cycle assessment of energy projects, will positively influence the competitiveness of renewable energy projects in the energy market. Social Impact To help facilitate the achievement of the Millennium Development Goals of reducing poverty and hunger in the world, a comprehensive strategy for rural development has recently been developed. The World Bank Rural Development Strategy stresses the inter-disciplinary, broad-based need for growth, including growth in rural infrastructure investments. Renewable energy can serve as one of the key drivers for rural development in a number of ways - enhancing local micro-economic development (agriculture, manufacturing, small industry); providing vital income generating activities for the community (such as water pumping, battery charging, ice making, crop drying, milk refrigeration, etc.); improving human development (accessibility to modern education, improved health services); helping to lower the pace of migration to already overcrowded cities and preventing social unrest. The pattern of energy poverty is changing, since 95% of the increase in population in the next three decades is expected to occur in urban areas. Large, central systems will be required to supply the exploding urban population. At present, in many cases the most common solution for rural electrification would be installation of diesel generators (DG). Whereas this looks like a rapid quick-fix solution with relatively low initial costs, it is actually unsustainable. It leads to high costs for operation and also due to high fuel costs and the logistics involved, is totally dependent on imported fuels. It also produces high emissions, and as a result, DG systems operating in rural areas are used only a few hours a day. Renewable energy for rural electrification is more sustainable, as renewables are suitable for supplying geographically dispersed villages by distributed energy, often without relying on a conventional grid. Where grid connection is expensive and technically difficult, local mini-grids can be established or stand-alone power generating solutions implemented. • Solar PV systems are the most widely accepted renewable technical solution for rural electrification. It is widely
used in poverty eradication projects for the electrification of remote underdeveloped areas (e.g. MISDP PV project in the Philippines lead by BP, or solar PV electrification project in Zanzibar, Tanzania - Umbuji Village, etc.), supported by multi-nationals, ICIs and NGOs. Solar PV can be deployed as stand-alone systems, as well as in mini-grid applications.
• Wind turbines and mini-hydro systems can provide modern, clean, sustainable and economical energy for remote village areas, either via local mini-grids or as a stand-alone option. However, they can be installed only in specific, suitable locations and their availability will be dependent on climate and weather conditions.
• Geothermal energy can provide sustainable continuous energy, independent of weather conditions, if local geothermal resources are identified and explored in a correct manner
• Biomass represents an additional source for energy in rural areas. The majority of the rural population living in developing countries rely on traditional biomass (fuel wood, dung, rice husks, and other forms of “bio-fuels”) to meet their cooking and heating needs. The challenge is to ensure more efficient and sustainable use of biomass for heat extraction, cooking and generation of electricity. Biomass residues (such as wood, sugar, rice, etc.) can be used as low-to-medium cost energy for electricity generation. Biomass technological applications, like gasifiers or small ORC biomass-fuelled systems are in advanced stages for market deployment.
The poverty reduction objectives in the developing countries, focusing on rural areas are a top priority for the world in the 21st Century. Development of renewable energy infrastructure can effectively contribute to this effort.
World Energy Council Renewable Energy Projects Handbook
38
2.5 Risk Analysis and Risk Management Perception of Risk versus Reality Renewable energy technologies are relatively new, and their market position is sill fairly weak for a number of reasons. The situation is reinforced by the significant power of established market players and to a certain extent also by poor understanding of the risks involved. The common misperceptions about renewable energy can be traced through all stages of a prospective project. The perceived risks include: • risk of energy resource; renewables are often perceived as unsustainable, unreliable and unstable • renewable technologies are perceived as ongoing RD&D projects, and therefore not field proven and containing
application risks • financial risk assessments are often based on the above perceptions. The technologies are perceived as expensive
(almost un-financeable), suitable for a “rich” environment (not for developing countries “unless someone pays for it”) and carrying risks for project developers, energy off-takers as well as for project financiers
The reality, however, is different. The common perceptions are not completely wrong, but they are based on a biased interpretation of actual or historical experience with renewable energy.
Renewable Project Risk Evaluation Renewable energy projects do involve risks which influence prospective project development, the costs of the project, the risk sharing amongst project developers, stake-holders, financiers, insurers and off-takers and the risk mitigation during the life-cycle of the project.
Resource Exploration Risks Renewable resources comprise different resource exploration connected risks: • Biomass energy is dependent on uncertain delivery of energy resources, which can be influenced by alternative
utilisation, by growing constraints or by legal restrictions (for example for prevention of deforestation) • Wind energy is intermittent, highly dependent on climate and weather conditions • Geothermal energy resource must be identified, its sustainability may be influenced by reservoir degradation,
well scaling, pressure drops • Solar energy is highly dependent on weather conditions • Industrial Waste Heat utilisation is dependent on a continuous flow of heat streams to the power generating unit • Hydro is dependent on water inputs, highly dependent on climatic conditions. The resource development risks are relevant only for geothermal, biomass and sometimes hydro (if water reservoir is involved). The risks are generally “covered” by institutional bodies in conjunction with active governmental participation. Generally multi-lateral, bi-lateral or domestic agencies (e.g. development funds), provide support and bear the risk for the development of the resource, while the government “delivers” appropriate legislation and guarantees for exploration conditions and private investments. The private developer will seldom be ready to bear the resource development risk, and usually only when this stage is self-funded, in cases of exceptionally favourable conditions perceived as a business opportunity.
Technology Risks The last two decades of experience in renewable energy business development demonstrate that the private sector will take the lead and bear the risks. Government sponsored RD&D programmes are being reduced all over the world as public budgets decrease. At the same time, an impressive inflow of venture capital and a broader opening of financial markets to energy-related RD&D are taking place. The venture capital investments in pioneering renewable energy companies in the US and the EU indicate the trend of future developments. At the stage of project erection and equipment installation, the technology risk is fully underwritten by the private sector. Generally, there is a need for transparent “market-rules”, which guide business behaviour in the market. In this case the scheme of business development is of less importance (whether a turnkey project or BOT, BOO, BOOT, or others).
World Energy Council Renewable Energy Projects Handbook
39
Business Development/Financing Risks Governments should introduce basic laws and regulations to support private investment and ownership, within a legal and regulatory framework that facilitates transfer of private investors’ earnings.
The project “background” should be thoroughly investigated: • country risk, including market conditions, political and economical stability, transparency of laws • currency convertibility and transferability • dispute resolution conditions (i.e. “neutral” arbitration or litigation)
Project structure, the power purchase agreement (PPA), has to satisfactorily address the following: • revenues and positive cash-flow, including guaranteed payments from the government or credible energy off-
taker • project risk sharing between the stake-holders and the energy off-taker • risk mitigation arrangements, e.g. insurance, (by an internationally recognised insurance institution such as the
Multilateral Investment Guarantee Agency (MIGA)) and credible means for dispute resolution Risk Mitigation Costs In order to develop a “bankable” renewable project, the above risks have to be mitigated. The steps are thoroughly checked by the financing institutions that employ independent experts to verify compliance of the renewable project, in order to ensure only the minimum of risks. The whole process of checking and risk sharing is costly and adds to the overall project cost, influencing the price of electricity and the revenues of project developers.
2.6 Development of Local Expertise From past experience, many renewable energy projects have been hampered by inadequate attention to the availability of local skills for design, installation, operation, maintenance, repair, spare parts management and technology transfer. This is true for both the developed and developing countries, although the developing countries sense their lack of local expertise more widely, as their labour force is less skilled. The renewable technology industry should not only transfer technologies, but also develop training programmes to transfer skills connected with the application of renewables. In this context simple technologies, with modest O&M requirements, stand a better chance. Training of local technicians and managers will have a positive impact on local employment opportunities (important in rural poor areas, by offsetting some of the pressure to move to urban areas). 2.7 Stakeholders' Buy-in Public-Private Partnership (PPP) The growth rate of renewable energy projects is heavily dependent on the optimal input from both public and private sources. The project developer, whether that be the local utility or a private power producer, needs support from the public sector to act in favourable market conditions to challenge the project risks involved. The public sector is sometimes required to provide guarantees connected with the project’s long-term credibility and the customers' ability to purchase the output (heat and/or electricity).
The public utility may also acquire a financial stake in the power or CHP generating project. In that case its role will be identical to the private energy producer.

World Energy Council Renewable Energy Projects Handbook
40
Private Partnerships The structuring of private partnerships may occur prior to the project’s development, when a group of companies, each holding part of experience or assets or funds, decide to join forces to develop the project. This partnership/joint venture together enters into the bidding process to develop the project on an agreed-in-advance basis. A partnership structured on an experienced technology provider with proven experience in renewable energy project development, prospective land owner and venture capital provider(s) backed by a supra-national financing institution, may provide a suitable mix for successful project development.
The partnership may also be formed during project construction or during project operation, provided it can obtain consent to such a step by all contractual parties.
It is useful for renewable projects in developing countries to include with project stakeholders a partner focusing on providing equity capital to businesses in poor countries.
World Energy Council Renewable Energy Projects Handbook
41
3. STRATEGIES FOR SUCCESS
The following strategies, policies and specific steps are likely to intensify the pace of development of renewable energy projects and help them move out of the niche of complementary, “nice-to-have energy machines”, to become a basic pillar of sustainable energy development. Accelerated development of renewable energy systems will benefit both developed and developing countries. To achieve this goal, a concerted effort by supra-national organisations, national governments, NGOs, IFIs, private sector entities, private finance institutions, as well as consumers is urgently needed. In general, new strategies should address and remove the majority of existing barriers in renewable project development. We shall focus on the specific measures to accelerate the development of renewable energy on three levels: • general strategies to promote renewable energy • specific steps required for renewable energy categories • renewable energy development in developing countries
General Strategies for Renewable Energy Promotion In general, the new strategies should address and remove maximum of existing barriers in renewable project development.
Resource Development Stage At the resource development stage, new strategies should primarily address the high up-front costs of renewable projects. In order to cope with risk mitigation, which is acute at this early stage, smart optimisation of input from both public and private sources should be initiated. What is needed is active governmental or multilateral agency participation in the initial project development. Governments should contribute to project creditability by appropriate renewable legislation (renewable “set-asides”, carbon taxes, emissions trading, tax credits) to meet private and banking sector expectations. Multilateral and bilateral agencies should provide support to decrease exploration costs and risk perception. Governments should prepare laws, rules and regulations to enable a quicker introduction of renewable energy, to ease the efforts for promotion of energy diversification. Furthermore, governments should focus on the preparation of a legal environmental and regulatory framework, which supports private ownership in the energy domain, including transfer (repatriation) of private investors' rights. Enforceability of international arbitration is another element required to support a potential renewable project.
Technology Development and Implementation Provided that the basic project framework is insured by the public sector, the area of “technology” can be covered by the private sector. The coordinated public-private partnership should focus on creating confidence in the current and future performance of renewable technologies. Expanding markets for renewable projects will bring down the costs of the appropriate technologies.
Difficulties Due to the Small-Scale Nature of Most Renewable Projects Renewable energy projects are generally small and often located in rural areas, far from the decision makers. From the financing point of view, a “small” project can be seen as a “thin” project: the one that cannot bear all of the transaction costs and financial hurdles resulting from some of the traditional project finances. This problem can be mitigated by “bundling” together prospective projects to achieve economies of scale. This can be done mainly under two different structures. The first, by the entity issuing the project by taking separate facilities and “binding” them into one project, under one set of documents, with joint structure (duration, tariff, securities, etc.). The second structure can be created by the sponsor by taking a few separate facilities, with no, or a limited, relationship between them, and “bundling” them into one project to be financed by one financing scheme.
World Energy Council Renewable Energy Projects Handbook
42
Net Metering Net metering can be an important incentive for small renewable systems. In net metering a customer uses a meter that can run in both directions, depending on whether he is purchasing electricity from or feeding it back to the grid. Therefore, net metering allows the customer “to bank” excess generation for later use. Depending on the details of each net metering programme, if net energy production is greater than consumption from the grid for each billing period, the customer may be paid for excess generation (typically at the utility’s avoided cost), and allowed to carry the amount forward to offset consumption in future periods, or required to forfeit or “grant” the excess electricity to the utility. Net metering will have an important role in future decentralised energy supply systems based on the contribution of several renewable and non-renewable sources.
Contracting and Financing Financing structures, contract reviews, costs, procedures, timetable and review standards are usually geared toward large-scale projects. For “small” projects not all traditional “project financing” elements are a “must” and therefore, adjustment of the financing package is required in order to fit the specific nature and structure of “small” projects. Lenders to small projects should show flexibility by keeping their requirements at a reasonable level. The implementation of small projects can be accelerated by reducing the expenses and time delays required to arrange and close financing.
Fast Track Process for “One Stop” Financing Financing of renewable projects should be processed on a fast track, utilising experience with similar projects, standardised procedures and increased reliance on the historical background of the project participants.
Financing Requirements The financing requirement should be identified at the beginning of the review period to keep the financing process on a smooth fast track: • The review period for the project through financing approval should be targeted at six months. This period is
generally sufficient for a diligent and thorough review of a renewable project. • The participants should choose a team leader, who would represent the needs of the participants without having
to coordinate the time schedules. This will keep the financing process on schedule and control its costs. Limitations on the percentage of investment that a single agency can undertake should be raised to 75% to minimise the number of participants.
• Financing agency teams should be assigned to the projects from inception through project review and financial closing. The shorter financing period will avoid the need to change teams during the process because of the needs of other projects, resulting in a smoother financing process.
• Standard Power Purchase and Project Agreements, pre-defined as those used in the US for small power projects in the past, would simplify negotiations and reduce transaction costs for both sales and purchasing parties of the project. It would also speed up the contracting process and improve prospects for project financing.
• The Closing Schedule, including costs and timetable should be agreed upon during the review period, with reasonable efforts made by all parties to adhere to this schedule.
Demand-Side Initiatives Apart from the strategies initiated from the supply-side, renewables have lately been promoted by important demand-side initiatives. Voluntary commitments by large and small customers – from the large multinationals down to private customers – to procure and use renewable energy are becoming more common in developed markets. Innovative solutions to reward green customers with smart subsidies initiated by governments contribute to the success of such schemes.
World Energy Council Renewable Energy Projects Handbook
43
Broadening the Market-Based Mechanisms To promote renewable projects a concerted effort to broaden the base of energy project evaluation should be adopted. It should take into account the full societal costs of a project, to promote inclusion of “externalities” (i.e. GHG emission reduction accountability, avoided fossil fuel costs, etc.) into power tariffs and cost evaluations. The life cycle cost evaluation of energy projects in the future will enable “fair” competition in the energy market and broaden the chances for enlarging the stake for renewables.
3.1 Specific Steps for Renewable Energy Categories Biomass Modern biomass is expected to become the renewable equivalent of fossil fuels of the future. In the short and medium term, waste and residues utilisation is expected to dominate the market, while in the long run energy crop share will rise.
To promote biomass energy penetration we have to address three basic impediments: • Resource availability at reasonable prices (both social and economic). The resource cost considerations also
include land availability, improvements in productivity and coping with alternative resource utilisation. Governments will have to set up their site-specific preferences to include the biomass options in their energy development plans.
• Technologies. Under current economic conditions bioenergy technological solutions seem to be expensive. Biomass technologies may not be mature or technological information is not accessible enough to attract potential investors. Industry should first address the problem of information dissemination regarding technologies already available and market-proven. An additional effort should be made by private sector industry to develop, improve and demonstrate new innovative technologies and by implementing them to disseminate them to attain economy of scale.
• Environmental effects. The development of biomass energy might result in some negative environmental effects (starting from production of vast quantities of solid, liquid and gaseous wastes, through causing of negative social effects, i.e. by competing with society’s food production requirements, up to the threats to nature, i.e. forests, etc.). All these perceived threats have to be addressed. Biomass development has to be consistent with the Convention on Biological Diversity; it has to comply with environmental standards of the modern energy industry.
Industrial Waste Heat (IWH) Like biomass, IWH belongs to human activity renewable resources. Unlike biomass, in most regions, IWH does not enjoy wide recognition as a renewable energy resource. The public sector – governments, international finance institutions, organisations – as well as the private sector (private industry) should recognise unused industrial waste heat as renewable energy and include it in the promotion of renewables legislation and/or regulation. The set-asides for the Renewable Portfolio should include IWH as it saves primary energy resources and avoids additional fossil fuel utilisation.
The energy intensive industry will be more receptive to including waste heat utilisation for power generation in its backyard if the process is recognised, promoted and supported by the government. The inclusion of IWH in renewable regulations/incentives will open the door for this renewable resource and save alternative fuels to national economies. Moreover, the industries involved must be allowed to aggregate environmental credits together with other incentives (e.g. premiums for avoidance of transmission costs) to make the IWH utilisation even more attractive. Governments may contribute further by implementing more flexible general rules for IWH utilisation projects, e.g. eliminate the need for permitting (“inside the fence” the units are to be considered as energy saving equipment and not power plants), eliminate costly utility interconnection delays, etc.
The establishment of public-private interest groups for promotion of IWH projects could also contribute to the development of this still hidden fuel-free distributed renewable power.
World Energy Council Renewable Energy Projects Handbook
44
Wind Wind energy is today the most rapidly developing renewable energy in the world. Working mechanisms to promote wind energy implementation (feed-in tariffs, incentives, tax credits, renewable set-asides, green certificates, etc.) are field-proven and enabled the industry to grow by more than 30% yearly.
From the technological point of view the modern wind energy should focus on addressing advanced materials development, and noise problems. The economy of scale requirements will dictate the growth of individual wind devices, implementation of wind farms as well as offshore wind farms.
Solar The photovoltaic industry’s main objective for the coming years will be to reduce technology costs. It will be done by a concerted effort to decrease the cost of materials and components, by further RD&D processes to increase module efficiency and on efforts to expand markets (to lower costs by massive deployment).
The public sector has developed a legal/procedural background for solar development. The successful models implemented in several developed countries should be duplicated in other parts of the world.
Solar thermal power generation seems to be economically viable if it is combined with other energy resources (i.e. gas) to ensure uninterrupted base-load energy provision. Decentralised energy systems of the future will be another utilisation pattern where solar energy will be used economically.
Geothermal Properly implemented, geothermal energy is a renewable and sustainable energy resource. In the past some environmental problems were created by the direct release of steam into the atmosphere, the geothermal reservoirs were depleted, and hot water was released into rivers. The perception was of an unreliable, unsustainable resource. Modern reinjection techniques have eliminated the environmental impact of geothermal energy and have provided an adequate solution to reservoir depletion. Misperceptions based on obsolete geothermal technologies of the past have led to an inappropriate judgement of unsustainablity of geothermal energy. However, modern geothermal energy is sustainable and is a crucial part of renewable energy developments worldwide. Mostly, geothermal energy is part of renewable legislation/regulation. Where there are some doubts, these are based on past perceptions and should be removed.
The early stage of geothermal resource development is identified as a stage where many business risks are involved. At this preliminary stage, public investment and other governmental involvement is more than necessary to secure inflow of private capital at a later stage. Moreover, well drilling costs and rates of exploration success can vary widely, increasing even more the perception of risk. To cope with the exploration problems we need active public sector participation.
Project developers, often from the private sector address the technology risks as well as reservoir management risks.
In the long run, development of effective means for extracting useful energy from hot dry rock, as well as geopressured and magma resources with the incentives from the public sector, will greatly expand the potential contribution of geothermal energy.
Small Hydro Small hydropower is facing the following issues: • on the governmental level, to be taken into consideration as part of the energy mix. Governments mostly
recognise the large hydropower dams (hundreds of MW) and do not pay attention to small hydropower schemes. Small hydropower should be included in the renewable power inventory and rewarded by renewable legislation/regulation.
• on the technological level, industry should be driven to initiate improvements in turbine design for small applications, low cost construction techniques and combined applications for power and agriculture.
World Energy Council Renewable Energy Projects Handbook
45
3.2 Renewable Energy in Developing Countries
Growing poverty in the developing world, together with the high indebtedness of most of the developing countries suggests that the governments in developing countries will be unable – and therefore unwilling - to cope effectively with a lack of commercial energy in vast areas under their jurisdiction. Moreover, the Millennium Development Goals as well as poverty reduction strategies cannot be met by the insufficient institutional and human infrastructure of these countries. The developed world bears responsibility for overall poverty eradication, including developing countries. The modern, sustainable energy infrastructure in the developing countries – part of the effort to decrease poverty – will not emerge without substantial contribution from the developed world. The wealthy “North” should play the role of infrastructure initiator in the poor “South”. It could play the role of “public sector”; to initiate, to finance and to generate the initial infrastructure development in developing countries, without adding any burden of additional debts on local governments. The developed countries and their groupings – G8, OECD, EU, in particular their governments, multi-national companies, or any other groups established in the “North” – should initiate special purpose fund(s) for energy infrastructure projects. With the money should also come transfer of skills (training, transfer of experience) to the partners. The fund should prepare – jointly with the governments of developing countries - a mix of policy instruments for the promotion of energy infrastructure based on resource diversification, with a special effort to develop indigenous renewable energy resources and balance their use for sustainable development. The fund should work in conjunction with the recently established Global Network on Energy for Sustainable Development (GNESD), a partnership initiated by UNEP at the Johannesburg World Summit (September 2002).
In its joint actions with local governments, the fund should prepare the legal, economic and infrastructure background to attract renewable industry private venture capital to join in the effort, both in urban and rural electrification.Innovative financing schemes (including micro lending, “patient capital funds”, etc.) shall be instrumental as a complementary financial resource in service of the overall effort. Local governments in developing countries will be asked to guarantee local mobilisation of forces, to oversee the process of transfer of skills and technology and might be involved in the development and dissemination of successful programmes in the framework of future “South-South” development schemes. 3.3 WEC Action Plan Using this Handbook and the associated information on its Global Energy Information System (GEIS) at www.worldenergy.org, the WEC will actively contribute to the promotion of renewable energy as a part of its mission to achieve the sustainable supply and use of energy for the greatest benefit of all.
It will work with the relevant bodies at international and national levels (for example, G-8, OECD, IEA, UN, UNEP, UNDP, WB, GEF, IFIs, ECAs, NGOs, the private sector, private finance institutions, and other relevant organisations) to achieve co-ordinated promotion of the above mentioned goals.
It will be necessary to not only gather, evaluate and disseminate information on renewables promotion, but also to take an active role in specific efforts for the promotion of renewables, such as: • preparing policy proposal for legislators • initiating dialogue with IFIs, ECAs and private banks about the relevant tools for fast-track financing of
renewable projects, (e.g. predefined Power Purchase Agreements, predefined project review standards, micro-lending schemes, etc.);
• initiating multi-party, multi-national activities for the promotion of renewables, taking an active role in the future effort to internalise social and environmental costs and other externalities in the evaluation of energy options;
• communicating the emerging messages and other information to governments, financial institutions, consumers, media, regulators, and their stakeholders.
• Establish a dialogue, both through holding meetings and workshops and through the online community in GEIS, between energy producers, financiers and consumers.

World Energy Council Renewable Energy Projects Handbook
46

World Energy Council Renewable Energy Projects Handbook
47
4. PROJECT CHECK LIST 4.1 Evaluation, Selection of Technology, Financing Options, Project Documentation Renewable energy projects are usually small-scale, in many cases based on highly dispersed resources, whereas usual power generation projects are robust multi-megawatt projects. The project finance approach is widely applied along the lines drawn for large projects and this mismatch is one of the major hurdles the renewable energy sector has to address. New adjusted, imaginative schemes have to be designed. A checklist for a typical renewable project used today can give an idea of the actual sequence of actions. A separate column is dedicated to different documents serving the particular project development stage.
Table 14: Renewable Project Development Stages
No. Project Development Stages Documents
1. Preliminary, Early Stage
Pre Feasibility Study – evaluates the energy resource, its availability, options to utilise it, opportunities and obstacles, identifies the influential elements and draw primary conclusions Feasibility Study – gathers all the relevant information regarding the renewable resources, evaluates its prospects, draws conclusions as to the actual availability of the resource, analyses the options of resource exploration and utilisation, defines different technological options (may lead to conclusions as to the preferred option), provides financial/economical analysis and leads to overall conclusions. It is possible for the two above studies to be united in a comprehensive feasibility study where the project options are evaluated in detail.
Feasibility Study
2. Resource Development
This stage is implemented differently in different renewable projects. The solar, wind, IHRP only need identification at this preliminary stage, and measurements as to resource availability. On the other hand geothermal energy needs actual resource development comprising geothermal field definition and development (exploration and drilling). As a matter of fact, one-third of the investment in a geothermal facility has to be made before the resource is clearly defined. In the modern biomass there is also in many cases a separate stage of energy resource development. The resource development may be defined in the last two cases as a separate project, leading to separate project development lines. Since it is perceived as a higher risk, it will be mostly led by the public sector, often with government participation, with public funding and/or with international aid funds. Sometimes the resource development constitutes an integral part of the renewable project development, with all implications on assessment risk evaluation and project finance.
3. Contracting
Prequalification of project developer. Prior to initial steps for project development, the prospective developers/groups of renewable project, development companies/joint ventures are asked to present a set of documents confirming their ability to develop a successful renewable project. The required documents usually include the following: - list of past references confirming the ability to develop similar projects (in agnitude, complexity, technological standards). - proof of adequate personnel abilities for the prospective project and availability of other means for its development - general background data on the proposing company/companies or joint venture (including financial statements, compliance with international standards – production standards, quality standards, environmental standards – company policies, letters of recommendation, etc.) Sometimes minimum requirements are published in the request for prequalification. There are cases where the project initiator possesses a list of known project developers (either from previous projects or in another way) and therefore may skip this stage. There are project initiators who prefer to work with specific developers chosen in advance. As a result of prequalification evaluation the chosen prospective developers are addressed and may participate in further project stages Request for Proposal (RFP)/Request for Quotation (RFQ)/Call for Bid – call for all pre-qualified contenders to submit their proposals for project development. It contains exact requirements – technical, economical and procedural. It also contains the rules for evaluation of the proposals Proposal will be prepared according to the terms specified in the RFP/RFQ/Bid Submission. It will comprise technical and commercial parts in conjunction with other required documents. In case of bid submission, the proposal usually contains a bid bond, a security issued by a banking or insurance authority on behalf of the bidder, securing the proposal terms in front of the bid issuer. Project agreement negotiations follow the announcement of successful proposal. According to
Pre-qualification Documents
RFP/RFQ/Call for Bid
Proposal documents
Bidder’s Legal
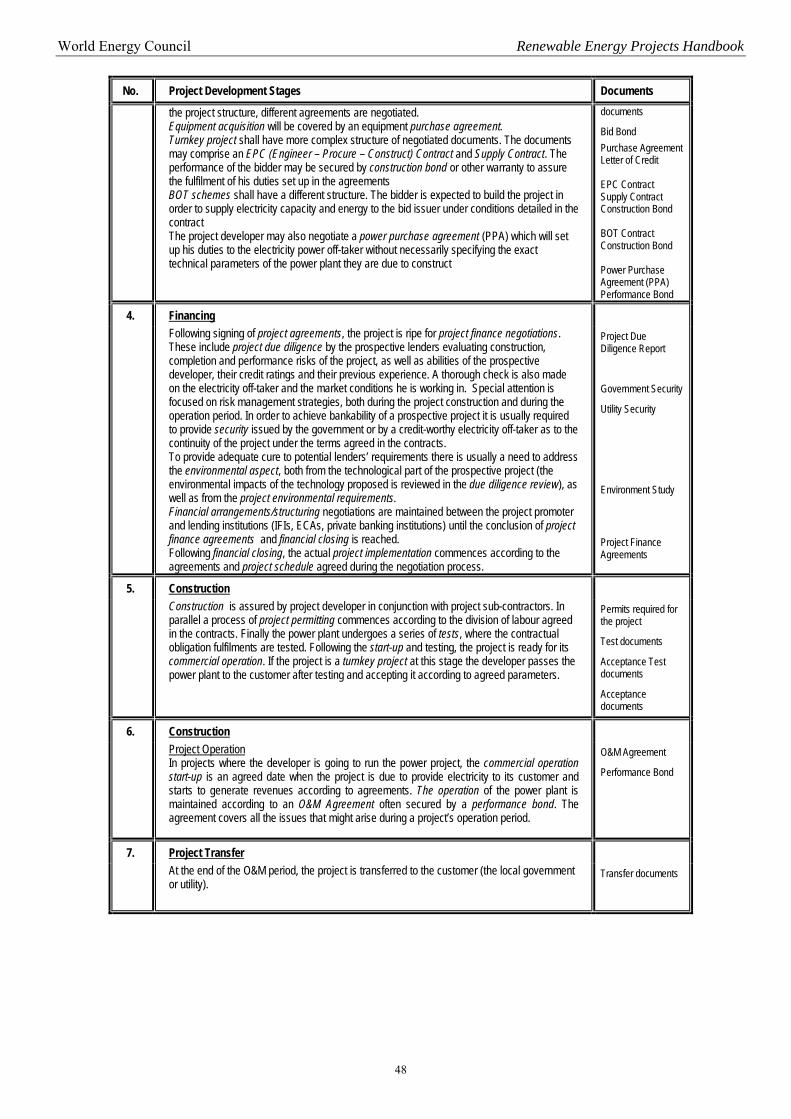
World Energy Council Renewable Energy Projects Handbook
48
No. Project Development Stages Documents
the project structure, different agreements are negotiated. Equipment acquisition will be covered by an equipment purchase agreement. Turnkey project shall have more complex structure of negotiated documents. The documents may comprise an EPC (Engineer – Procure – Construct) Contract and Supply Contract. The performance of the bidder may be secured by construction bond or other warranty to assure the fulfilment of his duties set up in the agreements BOT schemes shall have a different structure. The bidder is expected to build the project in order to supply electricity capacity and energy to the bid issuer under conditions detailed in the contract The project developer may also negotiate a power purchase agreement (PPA) which will set up his duties to the electricity power off-taker without necessarily specifying the exact technical parameters of the power plant they are due to construct
documents
Bid Bond Purchase Agreement Letter of Credit EPC Contract Supply Contract Construction Bond BOT Contract Construction Bond Power Purchase Agreement (PPA) Performance Bond
4. Financing
Following signing of project agreements, the project is ripe for project finance negotiations. These include project due diligence by the prospective lenders evaluating construction, completion and performance risks of the project, as well as abilities of the prospective developer, their credit ratings and their previous experience. A thorough check is also made on the electricity off-taker and the market conditions he is working in. Special attention is focused on risk management strategies, both during the project construction and during the operation period. In order to achieve bankability of a prospective project it is usually required to provide security issued by the government or by a credit-worthy electricity off-taker as to the continuity of the project under the terms agreed in the contracts. To provide adequate cure to potential lenders’ requirements there is usually a need to address the environmental aspect, both from the technological part of the prospective project (the environmental impacts of the technology proposed is reviewed in the due diligence review), as well as from the project environmental requirements. Financial arrangements/structuring negotiations are maintained between the project promoter and lending institutions (IFIs, ECAs, private banking institutions) until the conclusion of project finance agreements and financial closing is reached. Following financial closing, the actual project implementation commences according to the agreements and project schedule agreed during the negotiation process.
Project Due Diligence Report
Government Security
Utility Security
Environment Study
Project Finance Agreements
5. Construction
Construction is assured by project developer in conjunction with project sub-contractors. In parallel a process of project permitting commences according to the division of labour agreed in the contracts. Finally the power plant undergoes a series of tests, where the contractual obligation fulfilments are tested. Following the start-up and testing, the project is ready for its commercial operation. If the project is a turnkey project at this stage the developer passes the power plant to the customer after testing and accepting it according to agreed parameters.
Permits required for the project
Test documents
Acceptance Test documents
Acceptance documents
6. Construction
Project Operation In projects where the developer is going to run the power project, the commercial operation start-up is an agreed date when the project is due to provide electricity to its customer and starts to generate revenues according to agreements. The operation of the power plant is maintained according to an O&M Agreement often secured by a performance bond. The agreement covers all the issues that might arise during a project’s operation period.
O&M Agreement
Performance Bond
7. Project Transfer
At the end of the O&M period, the project is transferred to the customer (the local government or utility).
Transfer documents
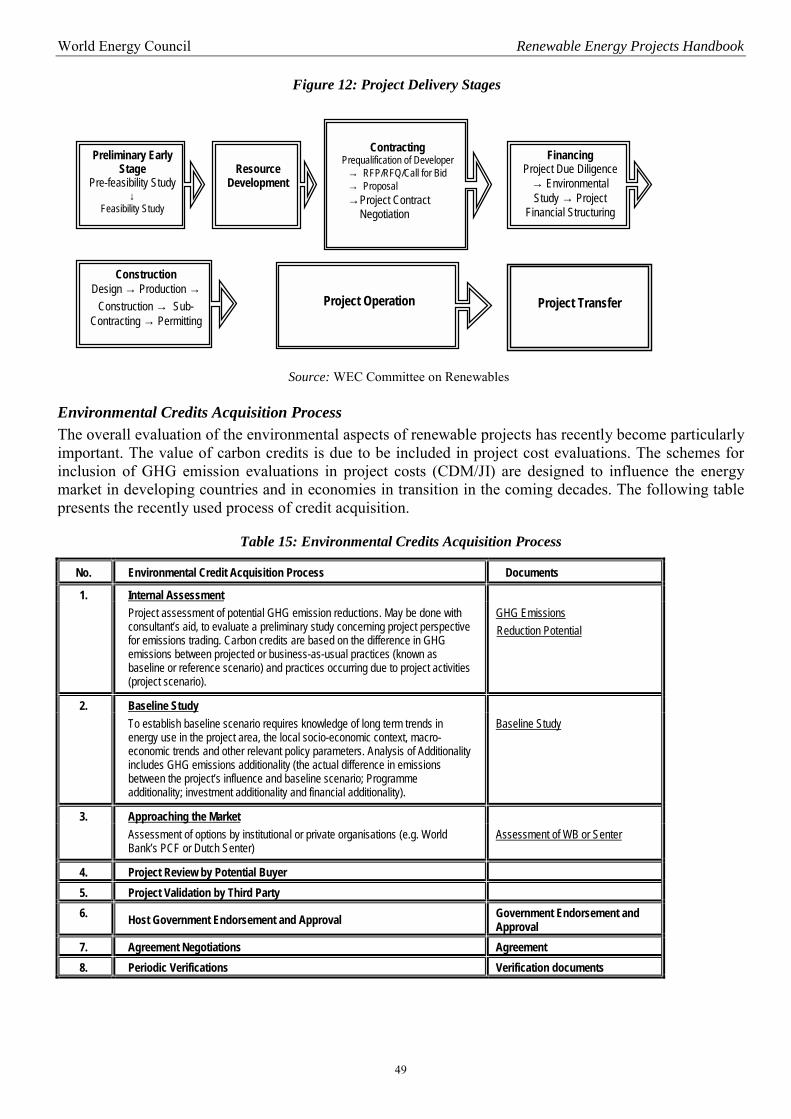
World Energy Council Renewable Energy Projects Handbook
49
Figure 12: Project Delivery Stages
Source: WEC Committee on Renewables
Environmental Credits Acquisition Process The overall evaluation of the environmental aspects of renewable projects has recently become particularly important. The value of carbon credits is due to be included in project cost evaluations. The schemes for inclusion of GHG emission evaluations in project costs (CDM/JI) are designed to influence the energy market in developing countries and in economies in transition in the coming decades. The following table presents the recently used process of credit acquisition.
Table 15: Environmental Credits Acquisition Process
No. Environmental Credit Acquisition Process Documents
1. Internal Assessment Project assessment of potential GHG emission reductions. May be done with
consultant’s aid, to evaluate a preliminary study concerning project perspective for emissions trading. Carbon credits are based on the difference in GHG emissions between projected or business-as-usual practices (known as baseline or reference scenario) and practices occurring due to project activities (project scenario).
GHG Emissions Reduction Potential
2. Baseline Study To establish baseline scenario requires knowledge of long term trends in
energy use in the project area, the local socio-economic context, macro-economic trends and other relevant policy parameters. Analysis of Additionality includes GHG emissions additionality (the actual difference in emissions between the project’s influence and baseline scenario; Programme additionality; investment additionality and financial additionality).
Baseline Study
3. Approaching the Market Assessment of options by institutional or private organisations (e.g. World
Bank’s PCF or Dutch Senter) Assessment of WB or Senter
4. Project Review by Potential Buyer 5. Project Validation by Third Party 6. Host Government Endorsement and Approval Government Endorsement and
Approval 7. Agreement Negotiations Agreement 8. Periodic Verifications Verification documents
Preliminary Early Stage
Pre-feasibility Study ↓
Feasibility Study
Resource
Development
Contracting Prequalification of Developer → RFP/RFQ/Call for Bid → Proposal → Project Contract Negotiation
Financing Project Due Diligence
→ Environmental Study → Project
Financial Structuring
Construction Design → Production →
Construction → Sub-Contracting → Permitting
Project Operation Project Transfer

World Energy Council Renewable Energy Projects Handbook
50
4.2 Policy for Promotion of Renewables A partial list of means for promotion of renewables follows. The lists are divided into categories, according to the initiator of the specific policy. The subdivisions include means initiated in developed countries, means initiated by supra-national organisations or NGOs, mostly for developments in developing countries, and means initiated by developing countries.
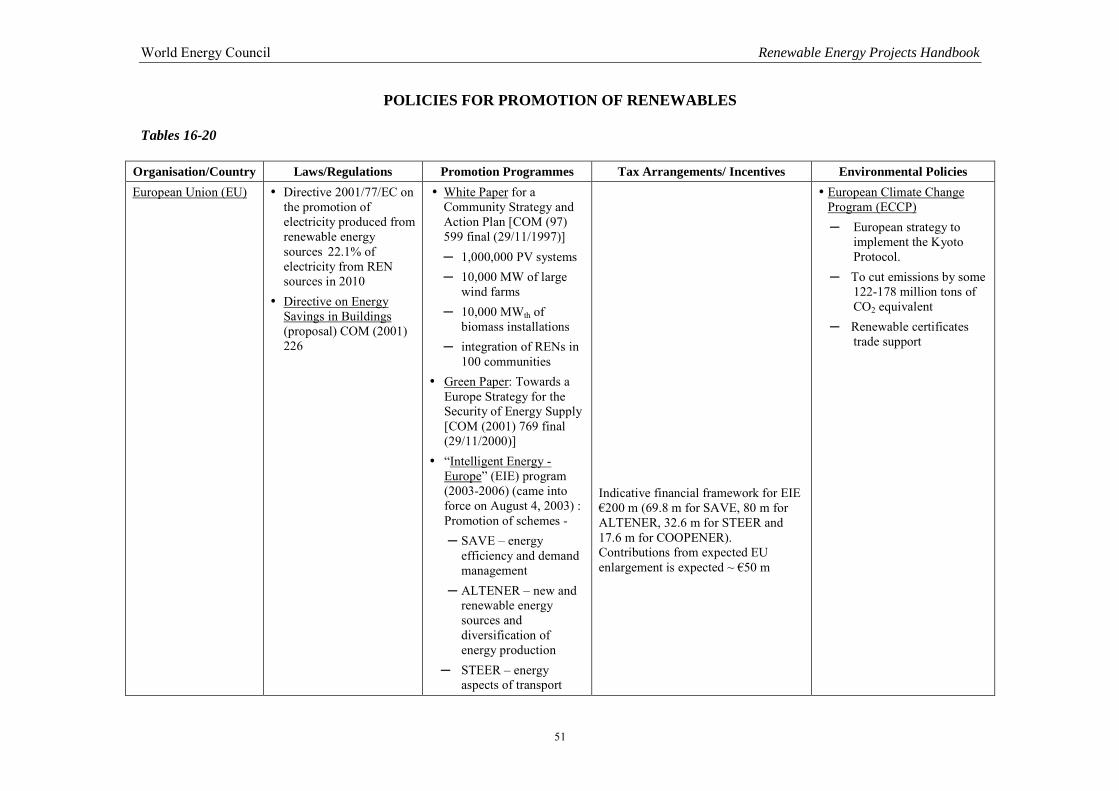
World Energy Council Renewable Energy Projects Handbook
51
POLICIES FOR PROMOTION OF RENEWABLES
Tables 16-20
Organisation/Country Laws/Regulations Promotion Programmes Tax Arrangements/ Incentives Environmental Policies European Union (EU) � Directive 2001/77/EC on
the promotion of electricity produced from renewable energy sources 22.1% of electricity from REN sources in 2010
� Directive on Energy Savings in Buildings (proposal) COM (2001) 226
� White Paper for a Community Strategy and Action Plan [COM (97) 599 final (29/11/1997)] ─ 1,000,000 PV systems ─ 10,000 MW of large
wind farms ─ 10,000 MWth of
biomass installations ─ integration of RENs in
100 communities � Green Paper: Towards a
Europe Strategy for the Security of Energy Supply [COM (2001) 769 final (29/11/2000)]
� “Intelligent Energy -Europe” (EIE) program (2003-2006) (came into force on August 4, 2003) : Promotion of schemes - ─ SAVE – energy
efficiency and demand management
─ ALTENER – new and renewable energy sources and diversification of energy production
─ STEER – energy aspects of transport
Indicative financial framework for EIE €200 m (69.8 m for SAVE, 80 m for ALTENER, 32.6 m for STEER and 17.6 m for COOPENER). Contributions from expected EU enlargement is expected ~ €50 m
� European Climate Change Program (ECCP) ─ European strategy to
implement the Kyoto Protocol.
─ To cut emissions by some 122-178 million tons of CO2 equivalent
─ Renewable certificates trade support
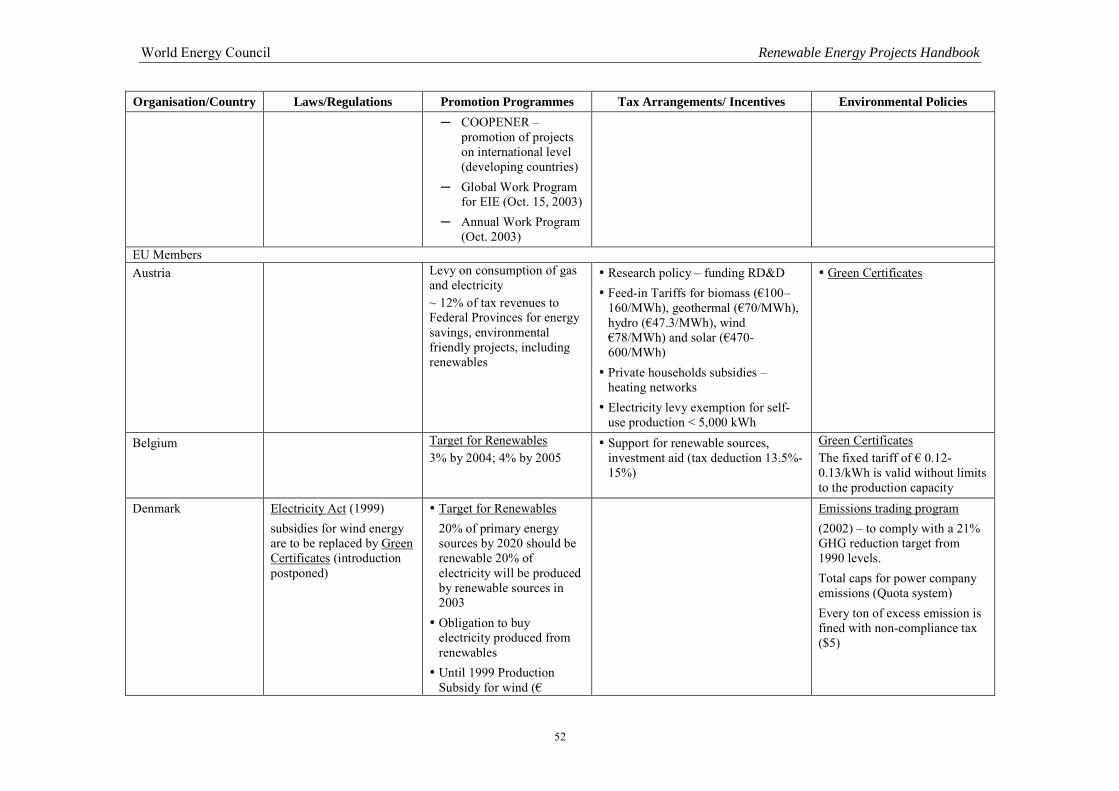
World Energy Council Renewable Energy Projects Handbook
52
Organisation/Country Laws/Regulations Promotion Programmes Tax Arrangements/ Incentives Environmental Policies ─ COOPENER –
promotion of projects on international level (developing countries)
─ Global Work Program for EIE (Oct. 15, 2003)
─ Annual Work Program (Oct. 2003)
EU Members Austria Levy on consumption of gas
and electricity ~ 12% of tax revenues to Federal Provinces for energy savings, environmental friendly projects, including renewables
� Research policy – funding RD&D � Feed-in Tariffs for biomass (€100–
160/MWh), geothermal (€70/MWh), hydro (€47.3/MWh), wind €78/MWh) and solar (€470-600/MWh) � Private households subsidies –
heating networks � Electricity levy exemption for self-
use production < 5,000 kWh
� Green Certificates
Belgium Target for Renewables 3% by 2004; 4% by 2005
� Support for renewable sources, investment aid (tax deduction 13.5%-15%)
Green Certificates The fixed tariff of € 0.12-0.13/kWh is valid without limits to the production capacity
Denmark Electricity Act (1999) subsidies for wind energy are to be replaced by Green Certificates (introduction postponed)
� Target for Renewables 20% of primary energy sources by 2020 should be renewable 20% of electricity will be produced by renewable sources in 2003 � Obligation to buy
electricity produced from renewables � Until 1999 Production
Subsidy for wind (€
Emissions trading program (2002) – to comply with a 21% GHG reduction target from 1990 levels. Total caps for power company emissions (Quota system) Every ton of excess emission is fined with non-compliance tax ($5)
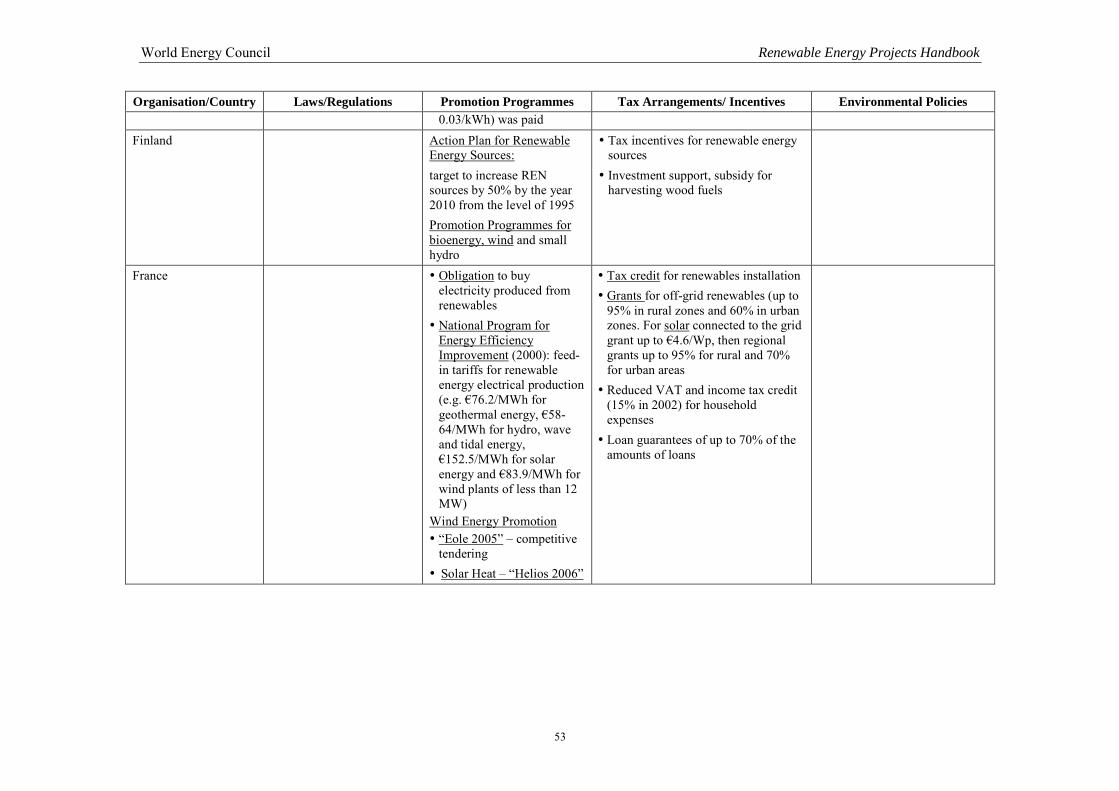
World Energy Council Renewable Energy Projects Handbook
53
Organisation/Country Laws/Regulations Promotion Programmes Tax Arrangements/ Incentives Environmental Policies 0.03/kWh) was paid
Finland Action Plan for Renewable Energy Sources: target to increase REN sources by 50% by the year 2010 from the level of 1995 Promotion Programmes for bioenergy, wind and small hydro
� Tax incentives for renewable energy sources � Investment support, subsidy for
harvesting wood fuels
France � Obligation to buy electricity produced from renewables � National Program for
Energy Efficiency Improvement (2000): feed-in tariffs for renewable energy electrical production (e.g. €76.2/MWh for geothermal energy, €58-64/MWh for hydro, wave and tidal energy, €152.5/MWh for solar energy and €83.9/MWh for wind plants of less than 12 MW)
Wind Energy Promotion � “Eole 2005” – competitive
tendering � Solar Heat – “Helios 2006”
� Tax credit for renewables installation � Grants for off-grid renewables (up to
95% in rural zones and 60% in urban zones. For solar connected to the grid grant up to €4.6/Wp, then regional grants up to 95% for rural and 70% for urban areas � Reduced VAT and income tax credit
(15% in 2002) for household expenses � Loan guarantees of up to 70% of the
amounts of loans
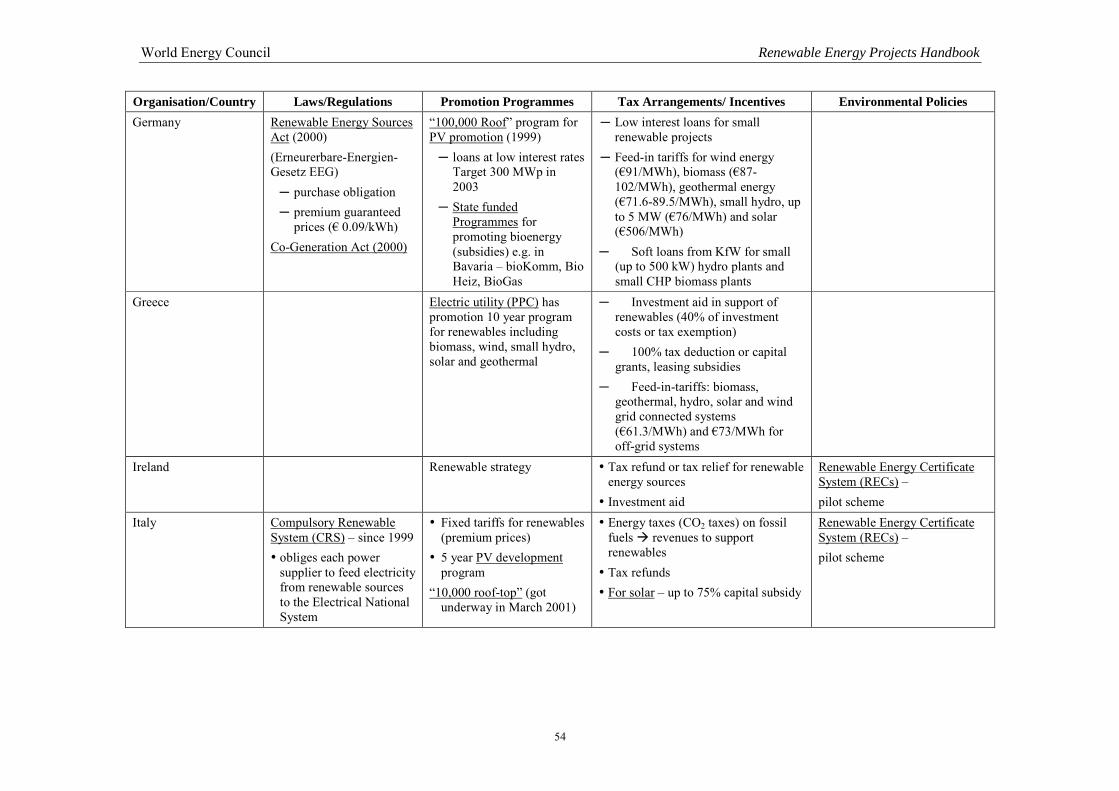
World Energy Council Renewable Energy Projects Handbook
54
Organisation/Country Laws/Regulations Promotion Programmes Tax Arrangements/ Incentives Environmental Policies Germany Renewable Energy Sources
Act (2000) (Erneurerbare-Energien-Gesetz EEG) ─ purchase obligation ─ premium guaranteed
prices (€ 0.09/kWh) Co-Generation Act (2000)
“100,000 Roof” program for PV promotion (1999) ─ loans at low interest rates
Target 300 MWp in 2003
─ State funded Programmes for promoting bioenergy (subsidies) e.g. in Bavaria – bioKomm, Bio Heiz, BioGas
─ Low interest loans for small renewable projects
─ Feed-in tariffs for wind energy (€91/MWh), biomass (€87-102/MWh), geothermal energy (€71.6-89.5/MWh), small hydro, up to 5 MW (€76/MWh) and solar (€506/MWh)
─ Soft loans from KfW for small (up to 500 kW) hydro plants and small CHP biomass plants
Greece Electric utility (PPC) has promotion 10 year program for renewables including biomass, wind, small hydro, solar and geothermal
─ Investment aid in support of renewables (40% of investment costs or tax exemption)
─ 100% tax deduction or capital grants, leasing subsidies
─ Feed-in-tariffs: biomass, geothermal, hydro, solar and wind grid connected systems (€61.3/MWh) and €73/MWh for off-grid systems
Ireland Renewable strategy � Tax refund or tax relief for renewable energy sources � Investment aid
Renewable Energy Certificate System (RECs) – pilot scheme
Italy Compulsory Renewable System (CRS) – since 1999 � obliges each power
supplier to feed electricity from renewable sources to the Electrical National System
� Fixed tariffs for renewables (premium prices) � 5 year PV development
program “10,000 roof-top” (got
underway in March 2001)
� Energy taxes (CO2 taxes) on fossil fuels � revenues to support renewables � Tax refunds � For solar – up to 75% capital subsidy
Renewable Energy Certificate System (RECs) – pilot scheme
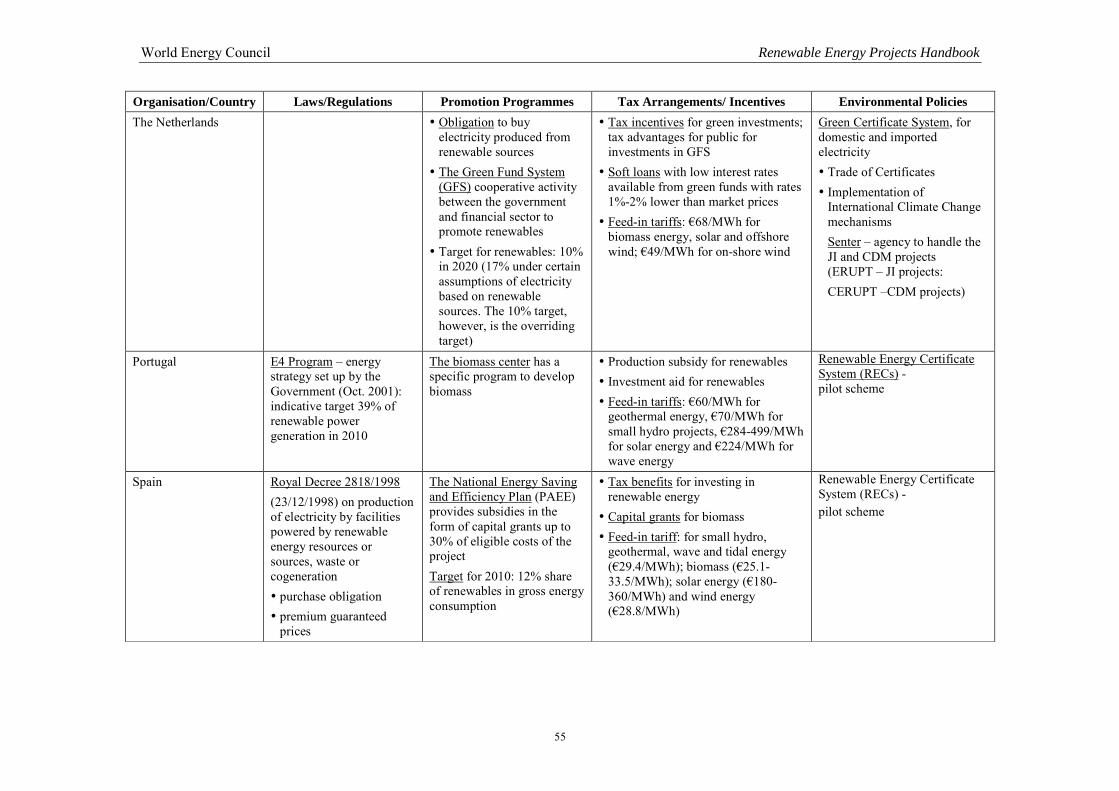
World Energy Council Renewable Energy Projects Handbook
55
Organisation/Country Laws/Regulations Promotion Programmes Tax Arrangements/ Incentives Environmental Policies The Netherlands � Obligation to buy
electricity produced from renewable sources � The Green Fund System
(GFS) cooperative activity between the government and financial sector to promote renewables � Target for renewables: 10%
in 2020 (17% under certain assumptions of electricity based on renewable sources. The 10% target, however, is the overriding target)
� Tax incentives for green investments; tax advantages for public for investments in GFS � Soft loans with low interest rates
available from green funds with rates 1%-2% lower than market prices � Feed-in tariffs: €68/MWh for
biomass energy, solar and offshore wind; €49/MWh for on-shore wind
Green Certificate System, for domestic and imported electricity � Trade of Certificates � Implementation of
International Climate Change mechanisms Senter – agency to handle the JI and CDM projects (ERUPT – JI projects: CERUPT –CDM projects)
Portugal E4 Program – energy strategy set up by the Government (Oct. 2001): indicative target 39% of renewable power generation in 2010
The biomass center has a specific program to develop biomass
� Production subsidy for renewables � Investment aid for renewables � Feed-in tariffs: €60/MWh for
geothermal energy, €70/MWh for small hydro projects, €284-499/MWh for solar energy and €224/MWh for wave energy
Renewable Energy Certificate System (RECs) - pilot scheme
Spain Royal Decree 2818/1998 (23/12/1998) on production of electricity by facilities powered by renewable energy resources or sources, waste or cogeneration � purchase obligation � premium guaranteed
prices
The National Energy Saving and Efficiency Plan (PAEE) provides subsidies in the form of capital grants up to 30% of eligible costs of the project Target for 2010: 12% share of renewables in gross energy consumption
� Tax benefits for investing in renewable energy � Capital grants for biomass � Feed-in tariff: for small hydro,
geothermal, wave and tidal energy (€29.4/MWh); biomass (€25.1-33.5/MWh); solar energy (€180-360/MWh) and wind energy (€28.8/MWh)
Renewable Energy Certificate System (RECs) - pilot scheme
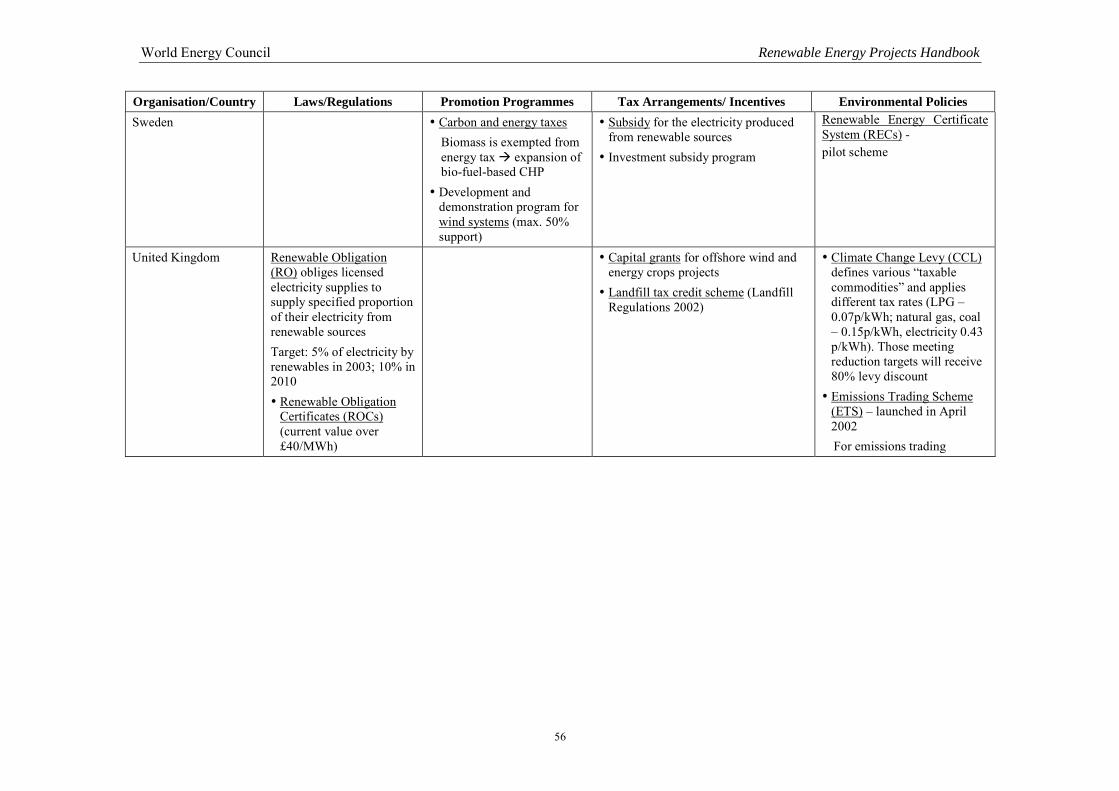
World Energy Council Renewable Energy Projects Handbook
56
Organisation/Country Laws/Regulations Promotion Programmes Tax Arrangements/ Incentives Environmental Policies Sweden � Carbon and energy taxes
Biomass is exempted from energy tax � expansion of bio-fuel-based CHP � Development and
demonstration program for wind systems (max. 50% support)
� Subsidy for the electricity produced from renewable sources � Investment subsidy program
Renewable Energy Certificate System (RECs) - pilot scheme
United Kingdom Renewable Obligation (RO) obliges licensed electricity supplies to supply specified proportion of their electricity from renewable sources Target: 5% of electricity by renewables in 2003; 10% in 2010 � Renewable Obligation
Certificates (ROCs) (current value over £40/MWh)
� Capital grants for offshore wind and energy crops projects � Landfill tax credit scheme (Landfill
Regulations 2002)
� Climate Change Levy (CCL) defines various “taxable commodities” and applies different tax rates (LPG – 0.07p/kWh; natural gas, coal – 0.15p/kWh, electricity 0.43 p/kWh). Those meeting reduction targets will receive 80% levy discount � Emissions Trading Scheme
(ETS) – launched in April 2002 For emissions trading
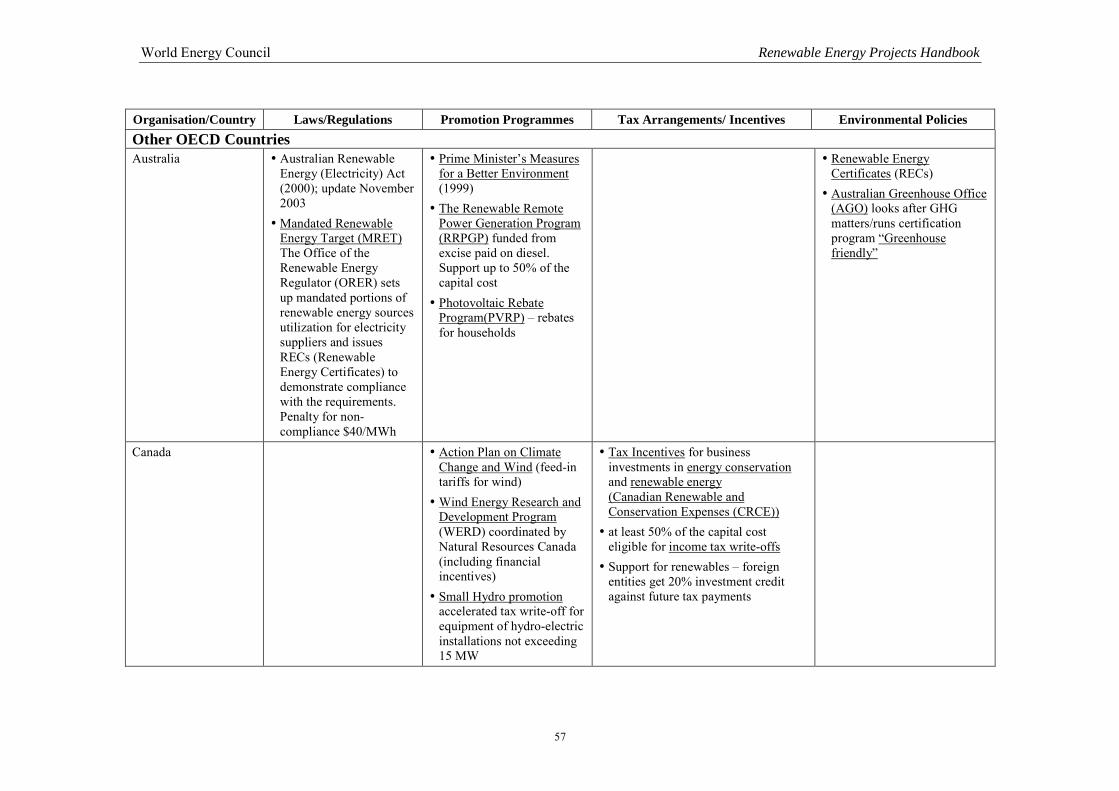
World Energy Council Renewable Energy Projects Handbook
57
Organisation/Country Laws/Regulations Promotion Programmes Tax Arrangements/ Incentives Environmental Policies Other OECD Countries Australia � Australian Renewable
Energy (Electricity) Act (2000); update November 2003 � Mandated Renewable
Energy Target (MRET) The Office of the Renewable Energy Regulator (ORER) sets up mandated portions of renewable energy sources utilization for electricity suppliers and issues RECs (Renewable Energy Certificates) to demonstrate compliance with the requirements. Penalty for non-compliance $40/MWh
� Prime Minister’s Measures for a Better Environment (1999) � The Renewable Remote
Power Generation Program (RRPGP) funded from excise paid on diesel. Support up to 50% of the capital cost � Photovoltaic Rebate
Program(PVRP) – rebates for households
� Renewable Energy Certificates (RECs) � Australian Greenhouse Office
(AGO) looks after GHG matters/runs certification program “Greenhouse friendly”
Canada � Action Plan on Climate Change and Wind (feed-in tariffs for wind) � Wind Energy Research and
Development Program (WERD) coordinated by Natural Resources Canada (including financial incentives) � Small Hydro promotion
accelerated tax write-off for equipment of hydro-electric installations not exceeding 15 MW
� Tax Incentives for business investments in energy conservation and renewable energy (Canadian Renewable and Conservation Expenses (CRCE)) � at least 50% of the capital cost
eligible for income tax write-offs � Support for renewables – foreign
entities get 20% investment credit against future tax payments
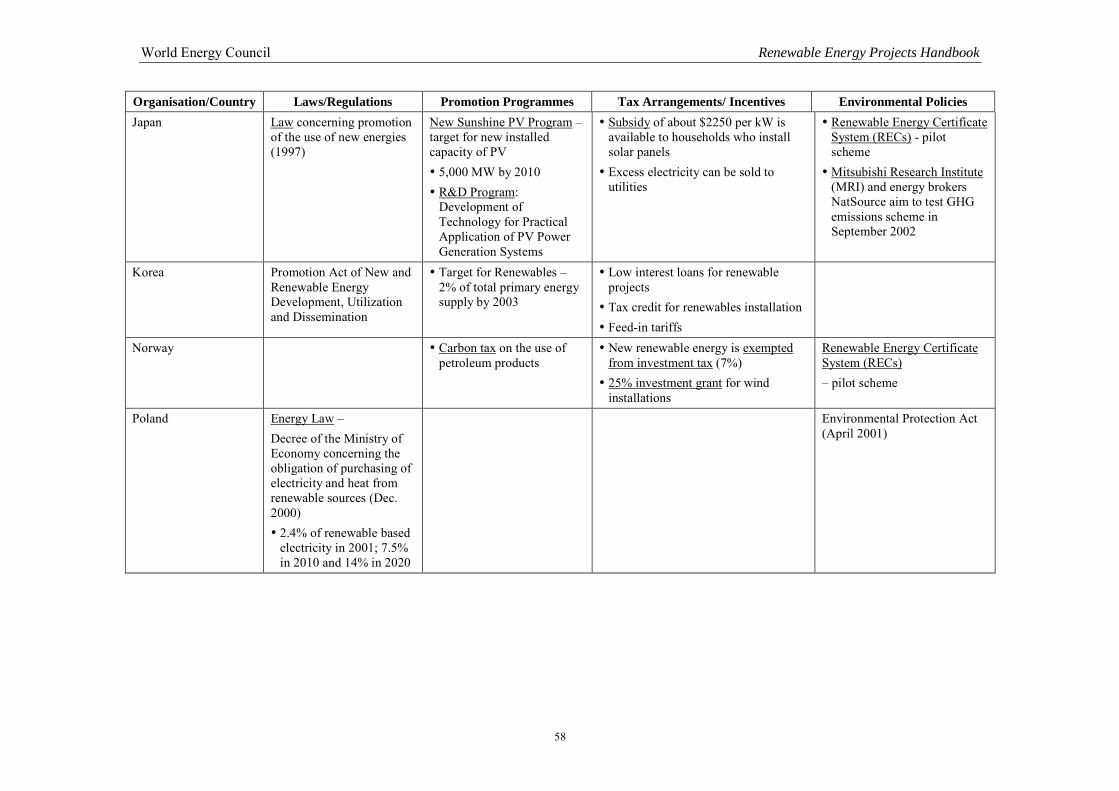
World Energy Council Renewable Energy Projects Handbook
58
Organisation/Country Laws/Regulations Promotion Programmes Tax Arrangements/ Incentives Environmental Policies Japan Law concerning promotion
of the use of new energies (1997)
New Sunshine PV Program – target for new installed capacity of PV � 5,000 MW by 2010 � R&D Program:
Development of Technology for Practical Application of PV Power Generation Systems
� Subsidy of about $2250 per kW is available to households who install solar panels � Excess electricity can be sold to
utilities
� Renewable Energy Certificate System (RECs) - pilot scheme � Mitsubishi Research Institute
(MRI) and energy brokers NatSource aim to test GHG emissions scheme in September 2002
Korea Promotion Act of New and Renewable Energy Development, Utilization and Dissemination
� Target for Renewables – 2% of total primary energy supply by 2003
� Low interest loans for renewable projects � Tax credit for renewables installation � Feed-in tariffs
Norway � Carbon tax on the use of petroleum products
� New renewable energy is exempted from investment tax (7%) � 25% investment grant for wind
installations
Renewable Energy Certificate System (RECs) – pilot scheme
Poland Energy Law – Decree of the Ministry of Economy concerning the obligation of purchasing of electricity and heat from renewable sources (Dec. 2000) � 2.4% of renewable based
electricity in 2001; 7.5% in 2010 and 14% in 2020
Environmental Protection Act (April 2001)
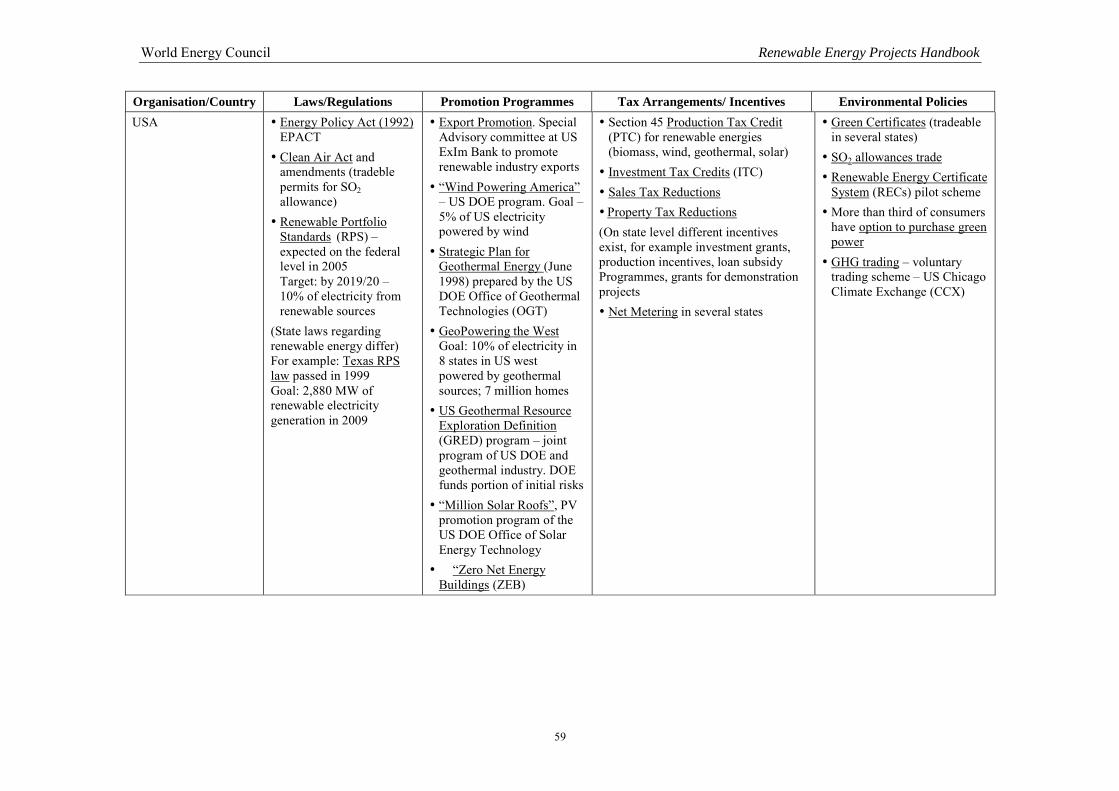
World Energy Council Renewable Energy Projects Handbook
59
Organisation/Country Laws/Regulations Promotion Programmes Tax Arrangements/ Incentives Environmental Policies USA � Energy Policy Act (1992)
EPACT � Clean Air Act and
amendments (tradeble permits for SO2 allowance) � Renewable Portfolio
Standards (RPS) – expected on the federal level in 2005 Target: by 2019/20 – 10% of electricity from renewable sources
(State laws regarding renewable energy differ) For example: Texas RPS law passed in 1999 Goal: 2,880 MW of renewable electricity generation in 2009
� Export Promotion. Special Advisory committee at US ExIm Bank to promote renewable industry exports � “Wind Powering America”
– US DOE program. Goal – 5% of US electricity powered by wind � Strategic Plan for
Geothermal Energy (June 1998) prepared by the US DOE Office of Geothermal Technologies (OGT) � GeoPowering the West
Goal: 10% of electricity in 8 states in US west powered by geothermal sources; 7 million homes � US Geothermal Resource
Exploration Definition (GRED) program – joint program of US DOE and geothermal industry. DOE funds portion of initial risks � “Million Solar Roofs”, PV
promotion program of the US DOE Office of Solar Energy Technology � “Zero Net Energy
Buildings (ZEB)
� Section 45 Production Tax Credit (PTC) for renewable energies (biomass, wind, geothermal, solar) � Investment Tax Credits (ITC) � Sales Tax Reductions � Property Tax Reductions (On state level different incentives exist, for example investment grants, production incentives, loan subsidy Programmes, grants for demonstration projects � Net Metering in several states
� Green Certificates (tradeable in several states) � SO2 allowances trade � Renewable Energy Certificate
System (RECs) pilot scheme � More than third of consumers
have option to purchase green power � GHG trading – voluntary
trading scheme – US Chicago Climate Exchange (CCX)
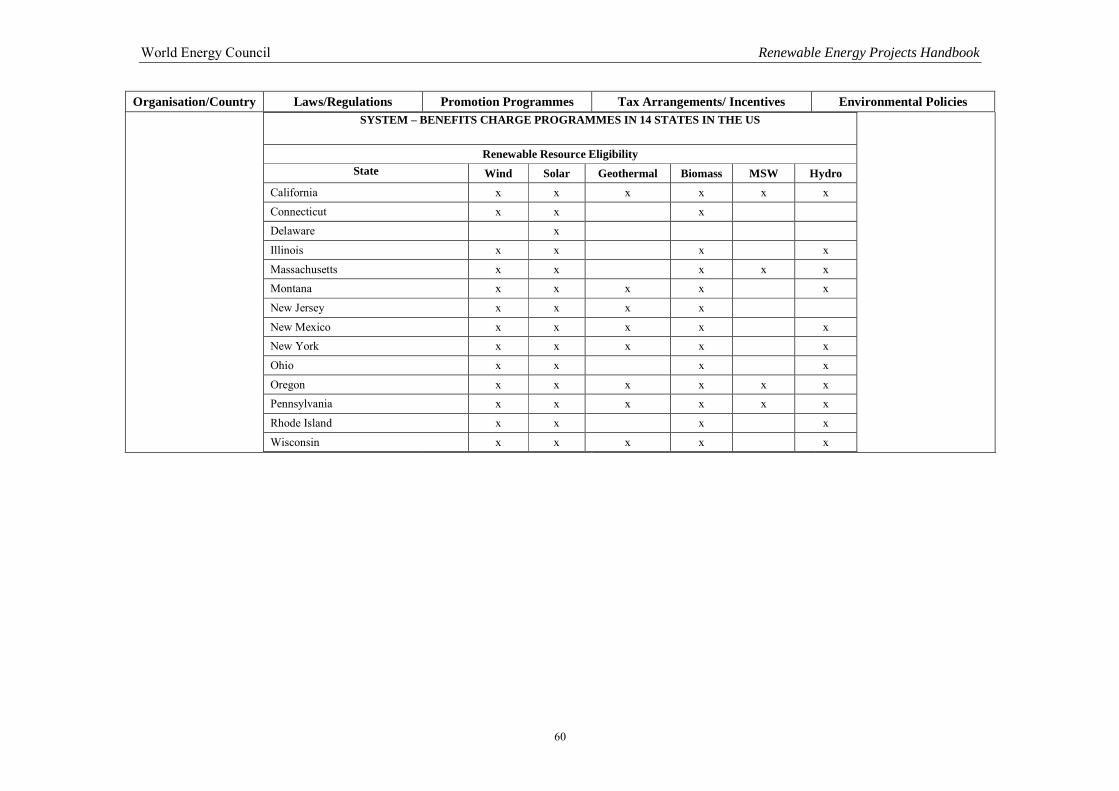
World Energy Council Renewable Energy Projects Handbook
60
Organisation/Country Laws/Regulations Promotion Programmes Tax Arrangements/ Incentives Environmental Policies SYSTEM – BENEFITS CHARGE PROGRAMMES IN 14 STATES IN THE US
Renewable Resource Eligibility
State Wind Solar Geothermal Biomass MSW Hydro California x x x x x x
Connecticut x x x
Delaware x
Illinois x x x x
Massachusetts x x x x x Montana x x x x x
New Jersey x x x x
New Mexico x x x x x New York x x x x x
Ohio x x x x
Oregon x x x x x x Pennsylvania x x x x x x
Rhode Island x x x x
Wisconsin x x x x x
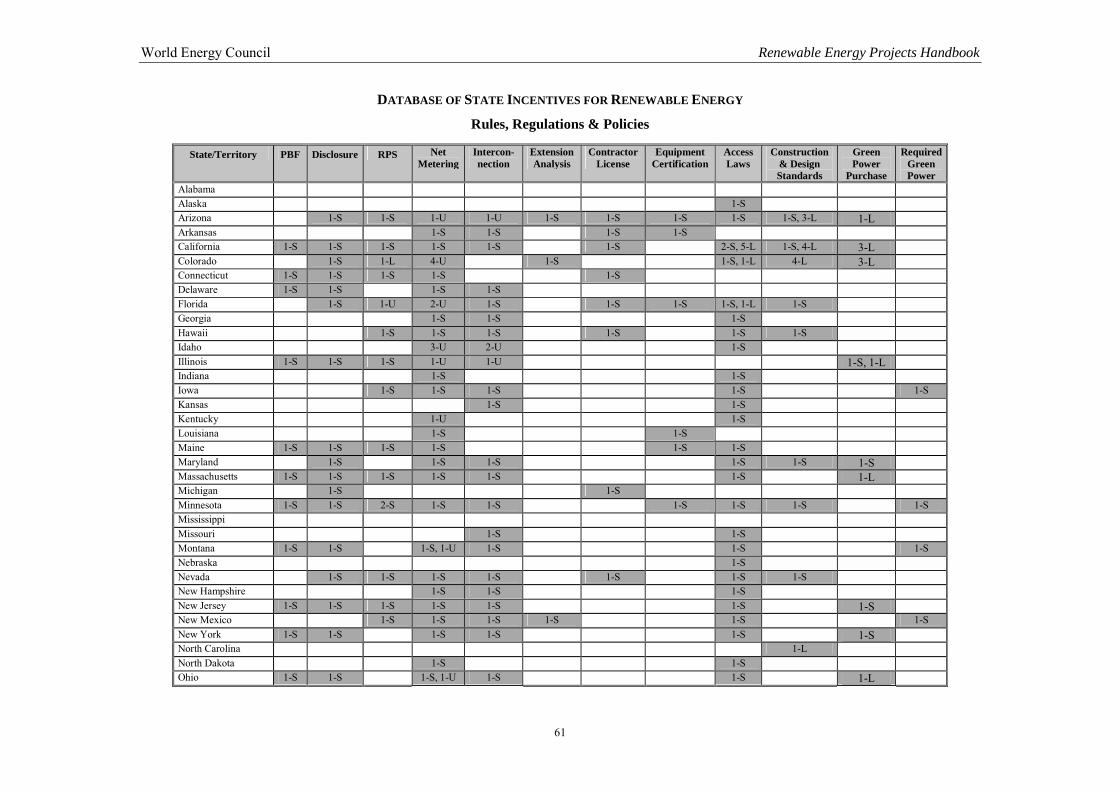
World Energy Council Renewable Energy Projects Handbook
61
DATABASE OF STATE INCENTIVES FOR RENEWABLE ENERGY
Rules, Regulations & Policies State/Territory PBF Disclosure RPS Net
Metering Intercon-nection
Extension Analysis
Contractor License
Equipment Certification
Access Laws
Construction & Design Standards
Green Power
Purchase
RequiredGreen Power
Alabama Alaska 1-S Arizona 1-S 1-S 1-U 1-U 1-S 1-S 1-S 1-S 1-S, 3-L 1-L Arkansas 1-S 1-S 1-S 1-S California 1-S 1-S 1-S 1-S 1-S 1-S 2-S, 5-L 1-S, 4-L 3-L Colorado 1-S 1-L 4-U 1-S 1-S, 1-L 4-L 3-L Connecticut 1-S 1-S 1-S 1-S 1-S Delaware 1-S 1-S 1-S 1-S Florida 1-S 1-U 2-U 1-S 1-S 1-S 1-S, 1-L 1-S Georgia 1-S 1-S 1-S Hawaii 1-S 1-S 1-S 1-S 1-S 1-S Idaho 3-U 2-U 1-S Illinois 1-S 1-S 1-S 1-U 1-U 1-S, 1-L Indiana 1-S 1-S Iowa 1-S 1-S 1-S 1-S 1-S Kansas 1-S 1-S Kentucky 1-U 1-S Louisiana 1-S 1-S Maine 1-S 1-S 1-S 1-S 1-S 1-S Maryland 1-S 1-S 1-S 1-S 1-S 1-S Massachusetts 1-S 1-S 1-S 1-S 1-S 1-S 1-L Michigan 1-S 1-S Minnesota 1-S 1-S 2-S 1-S 1-S 1-S 1-S 1-S 1-S Mississippi Missouri 1-S 1-S Montana 1-S 1-S 1-S, 1-U 1-S 1-S 1-S Nebraska 1-S Nevada 1-S 1-S 1-S 1-S 1-S 1-S 1-S New Hampshire 1-S 1-S 1-S New Jersey 1-S 1-S 1-S 1-S 1-S 1-S 1-S New Mexico 1-S 1-S 1-S 1-S 1-S 1-S New York 1-S 1-S 1-S 1-S 1-S 1-S North Carolina 1-L North Dakota 1-S 1-S Ohio 1-S 1-S 1-S, 1-U 1-S 1-S 1-L
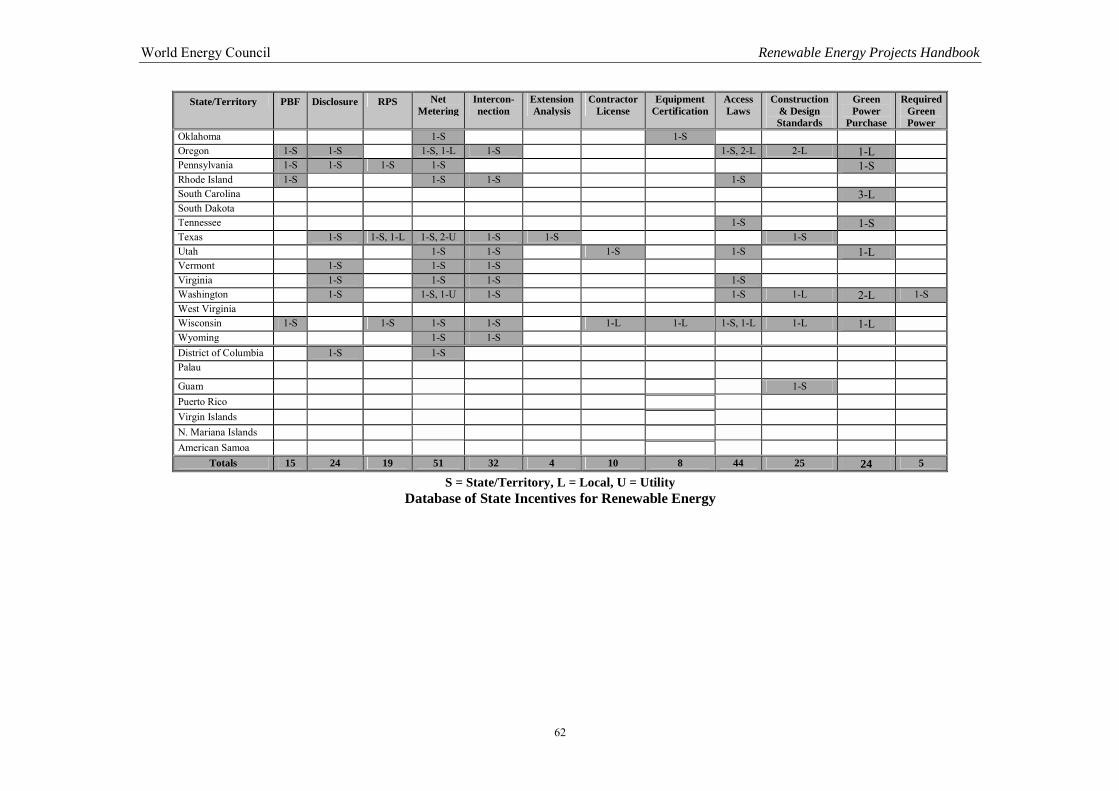
World Energy Council Renewable Energy Projects Handbook
62
State/Territory PBF Disclosure RPS Net Metering
Intercon-nection
Extension Analysis
Contractor License
Equipment Certification
Access Laws
Construction & Design Standards
Green Power
Purchase
RequiredGreen Power
Oklahoma 1-S 1-S Oregon 1-S 1-S 1-S, 1-L 1-S 1-S, 2-L 2-L 1-L Pennsylvania 1-S 1-S 1-S 1-S 1-S Rhode Island 1-S 1-S 1-S 1-S South Carolina 3-L South Dakota Tennessee 1-S 1-S Texas 1-S 1-S, 1-L 1-S, 2-U 1-S 1-S 1-S Utah 1-S 1-S 1-S 1-S 1-L Vermont 1-S 1-S 1-S Virginia 1-S 1-S 1-S 1-S Washington 1-S 1-S, 1-U 1-S 1-S 1-L 2-L 1-S West Virginia Wisconsin 1-S 1-S 1-S 1-S 1-L 1-L 1-S, 1-L 1-L 1-L Wyoming 1-S 1-S District of Columbia 1-S 1-S Palau
Guam 1-S Puerto Rico Virgin Islands N. Mariana Islands American Samoa
Totals 15 24 19 51 32 4 10 8 44 25 24 5
S = State/Territory, L = Local, U = Utility Database of State Incentives for Renewable Energy
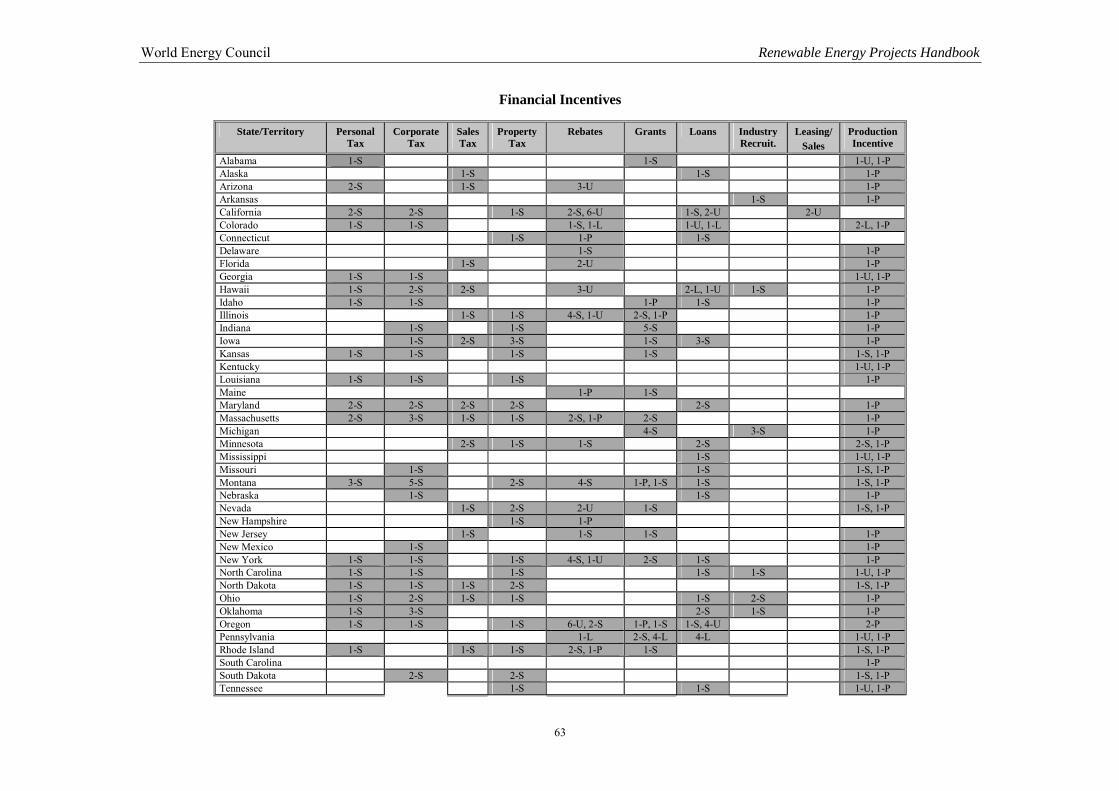
World Energy Council Renewable Energy Projects Handbook
63
Financial Incentives
State/Territory Personal Tax
Corporate Tax
Sales Tax
Property Tax
Rebates Grants Loans Industry Recruit.
Leasing/ Sales
Production Incentive
Alabama 1-S 1-S 1-U, 1-P Alaska 1-S 1-S 1-P Arizona 2-S 1-S 3-U 1-P Arkansas 1-S 1-P California 2-S 2-S 1-S 2-S, 6-U 1-S, 2-U 2-U Colorado 1-S 1-S 1-S, 1-L 1-U, 1-L 2-L, 1-P Connecticut 1-S 1-P 1-S Delaware 1-S 1-P Florida 1-S 2-U 1-P Georgia 1-S 1-S 1-U, 1-P Hawaii 1-S 2-S 2-S 3-U 2-L, 1-U 1-S 1-P Idaho 1-S 1-S 1-P 1-S 1-P Illinois 1-S 1-S 4-S, 1-U 2-S, 1-P 1-P Indiana 1-S 1-S 5-S 1-P Iowa 1-S 2-S 3-S 1-S 3-S 1-P Kansas 1-S 1-S 1-S 1-S 1-S, 1-P Kentucky 1-U, 1-P Louisiana 1-S 1-S 1-S 1-P Maine 1-P 1-S Maryland 2-S 2-S 2-S 2-S 2-S 1-P Massachusetts 2-S 3-S 1-S 1-S 2-S, 1-P 2-S 1-P Michigan 4-S 3-S 1-P Minnesota 2-S 1-S 1-S 2-S 2-S, 1-P Mississippi 1-S 1-U, 1-P Missouri 1-S 1-S 1-S, 1-P Montana 3-S 5-S 2-S 4-S 1-P, 1-S 1-S 1-S, 1-P Nebraska 1-S 1-S 1-P Nevada 1-S 2-S 2-U 1-S 1-S, 1-P New Hampshire 1-S 1-P New Jersey 1-S 1-S 1-S 1-P New Mexico 1-S 1-P New York 1-S 1-S 1-S 4-S, 1-U 2-S 1-S 1-P North Carolina 1-S 1-S 1-S 1-S 1-S 1-U, 1-P North Dakota 1-S 1-S 1-S 2-S 1-S, 1-P Ohio 1-S 2-S 1-S 1-S 1-S 2-S 1-P Oklahoma 1-S 3-S 2-S 1-S 1-P Oregon 1-S 1-S 1-S 6-U, 2-S 1-P, 1-S 1-S, 4-U 2-P Pennsylvania 1-L 2-S, 4-L 4-L 1-U, 1-P Rhode Island 1-S 1-S 1-S 2-S, 1-P 1-S 1-S, 1-P South Carolina 1-P South Dakota 2-S 2-S 1-S, 1-P Tennessee 1-S 1-S 1-U, 1-P
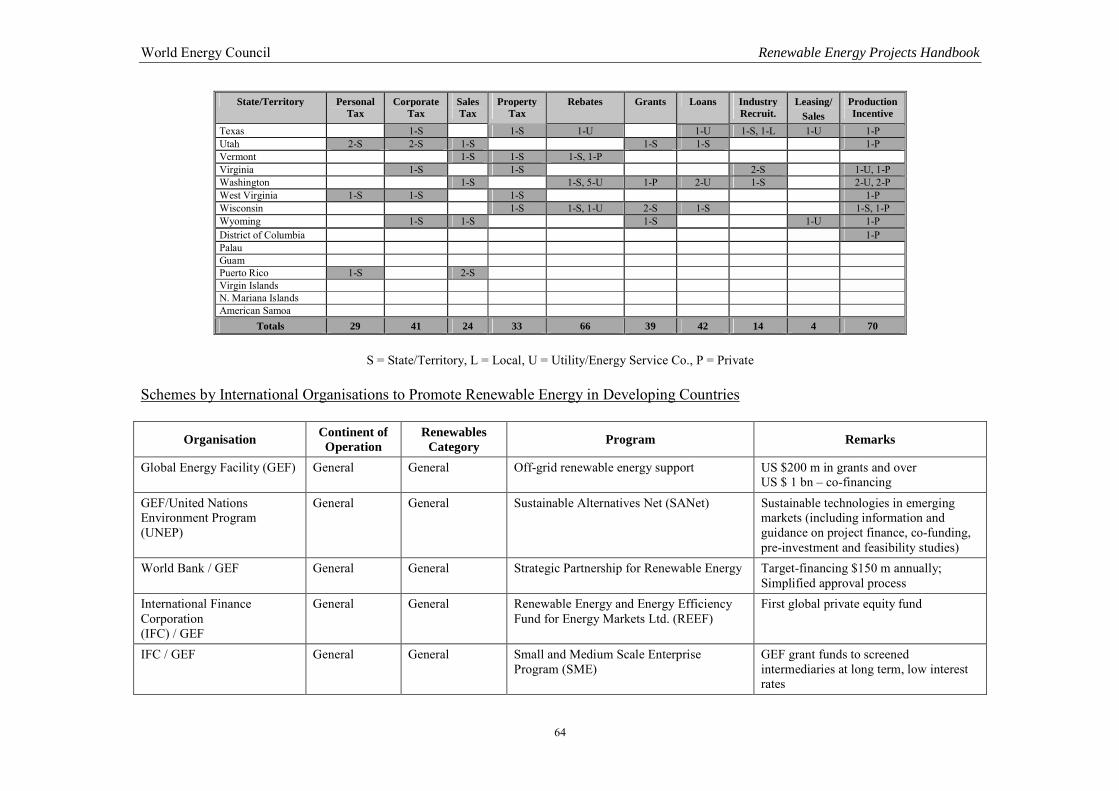
World Energy Council Renewable Energy Projects Handbook
64
State/Territory Personal Tax
Corporate Tax
Sales Tax
Property Tax
Rebates Grants Loans Industry Recruit.
Leasing/ Sales
Production Incentive
Texas 1-S 1-S 1-U 1-U 1-S, 1-L 1-U 1-P Utah 2-S 2-S 1-S 1-S 1-S 1-P Vermont 1-S 1-S 1-S, 1-P Virginia 1-S 1-S 2-S 1-U, 1-P Washington 1-S 1-S, 5-U 1-P 2-U 1-S 2-U, 2-P West Virginia 1-S 1-S 1-S 1-P Wisconsin 1-S 1-S, 1-U 2-S 1-S 1-S, 1-P Wyoming 1-S 1-S 1-S 1-U 1-P District of Columbia 1-P Palau Guam Puerto Rico 1-S 2-S Virgin Islands N. Mariana Islands American Samoa
Totals 29 41 24 33 66 39 42 14 4 70
S = State/Territory, L = Local, U = Utility/Energy Service Co., P = Private
Schemes by International Organisations to Promote Renewable Energy in Developing Countries
Organisation Continent of Operation
Renewables Category Program Remarks
Global Energy Facility (GEF) General General Off-grid renewable energy support US $200 m in grants and over US $ 1 bn – co-financing
GEF/United Nations Environment Program (UNEP)
General General Sustainable Alternatives Net (SANet) Sustainable technologies in emerging markets (including information and guidance on project finance, co-funding, pre-investment and feasibility studies)
World Bank / GEF General General Strategic Partnership for Renewable Energy Target-financing $150 m annually; Simplified approval process
International Finance Corporation (IFC) / GEF
General General Renewable Energy and Energy Efficiency Fund for Energy Markets Ltd. (REEF)
First global private equity fund
IFC / GEF General General Small and Medium Scale Enterprise Program (SME)
GEF grant funds to screened intermediaries at long term, low interest rates
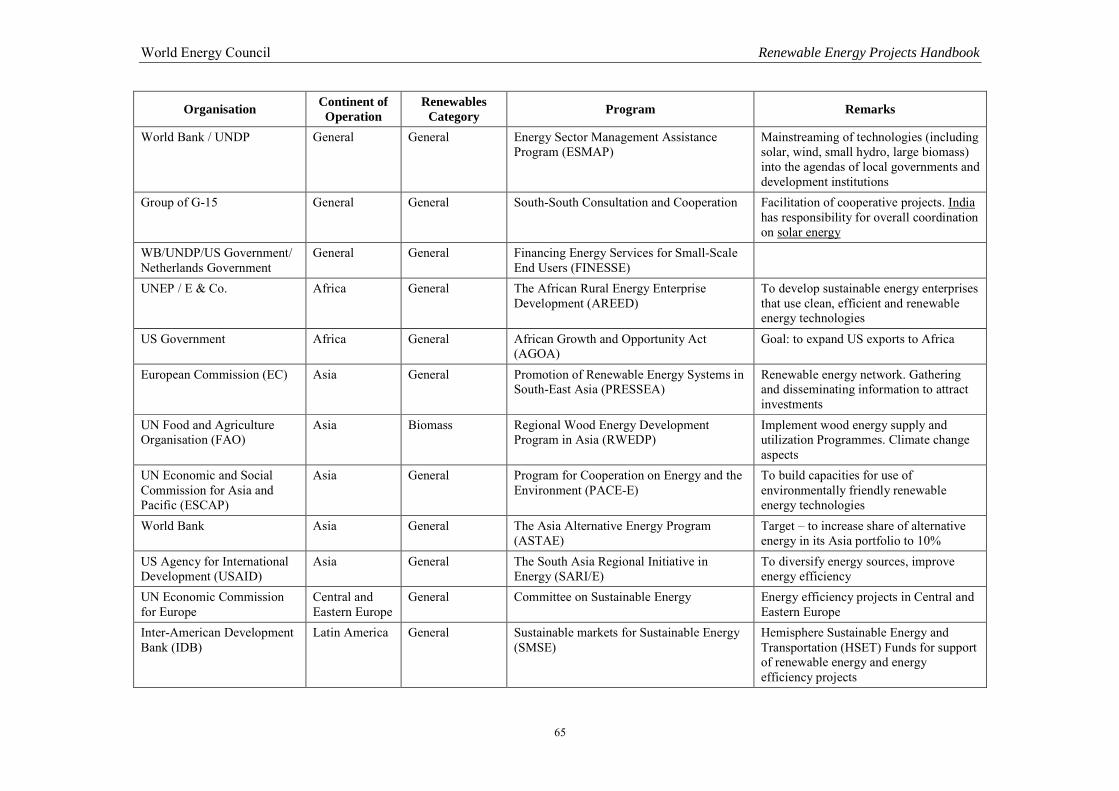
World Energy Council Renewable Energy Projects Handbook
65
Organisation Continent of Operation
Renewables Category Program Remarks
World Bank / UNDP General General Energy Sector Management Assistance Program (ESMAP)
Mainstreaming of technologies (including solar, wind, small hydro, large biomass) into the agendas of local governments and development institutions
Group of G-15 General General South-South Consultation and Cooperation Facilitation of cooperative projects. India has responsibility for overall coordination on solar energy
WB/UNDP/US Government/ Netherlands Government
General General Financing Energy Services for Small-Scale End Users (FINESSE)
UNEP / E & Co. Africa General The African Rural Energy Enterprise Development (AREED)
To develop sustainable energy enterprises that use clean, efficient and renewable energy technologies
US Government Africa General African Growth and Opportunity Act (AGOA)
Goal: to expand US exports to Africa
European Commission (EC) Asia General Promotion of Renewable Energy Systems in South-East Asia (PRESSEA)
Renewable energy network. Gathering and disseminating information to attract investments
UN Food and Agriculture Organisation (FAO)
Asia Biomass Regional Wood Energy Development Program in Asia (RWEDP)
Implement wood energy supply and utilization Programmes. Climate change aspects
UN Economic and Social Commission for Asia and Pacific (ESCAP)
Asia General Program for Cooperation on Energy and the Environment (PACE-E)
To build capacities for use of environmentally friendly renewable energy technologies
World Bank Asia General The Asia Alternative Energy Program (ASTAE)
Target – to increase share of alternative energy in its Asia portfolio to 10%
US Agency for International Development (USAID)
Asia General The South Asia Regional Initiative in Energy (SARI/E)
To diversify energy sources, improve energy efficiency
UN Economic Commission for Europe
Central and Eastern Europe
General Committee on Sustainable Energy Energy efficiency projects in Central and Eastern Europe
Inter-American Development Bank (IDB)
Latin America General Sustainable markets for Sustainable Energy (SMSE)
Hemisphere Sustainable Energy and Transportation (HSET) Funds for support of renewable energy and energy efficiency projects
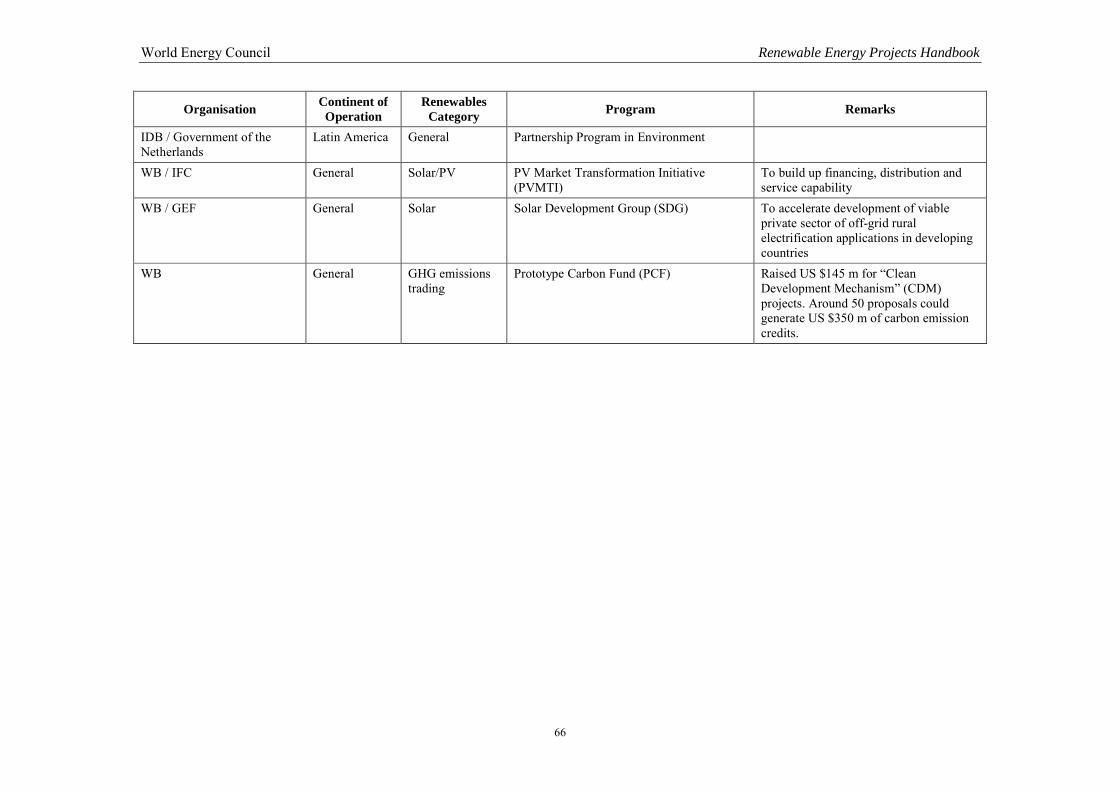
World Energy Council Renewable Energy Projects Handbook
66
Organisation Continent of Operation
Renewables Category Program Remarks
IDB / Government of the Netherlands
Latin America General Partnership Program in Environment
WB / IFC General Solar/PV PV Market Transformation Initiative (PVMTI)
To build up financing, distribution and service capability
WB / GEF General Solar Solar Development Group (SDG) To accelerate development of viable private sector of off-grid rural electrification applications in developing countries
WB General GHG emissions trading
Prototype Carbon Fund (PCF) Raised US $145 m for “Clean Development Mechanism” (CDM) projects. Around 50 proposals could generate US $350 m of carbon emission credits.
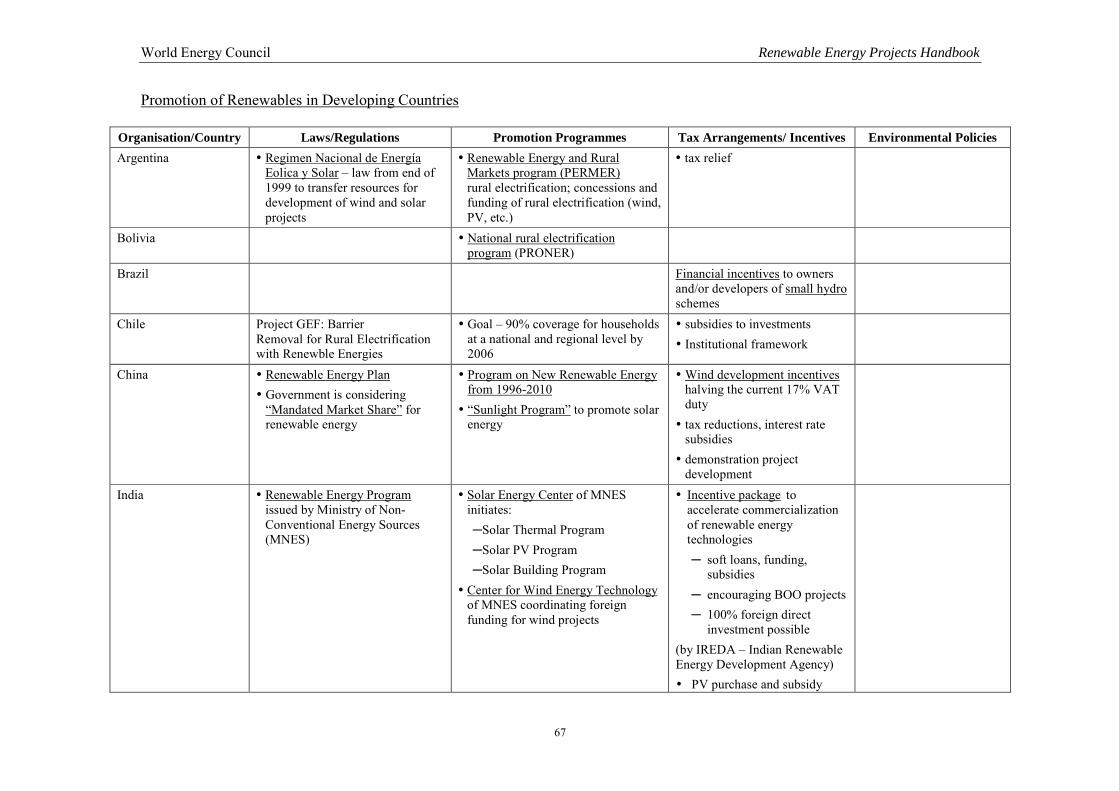
World Energy Council Renewable Energy Projects Handbook
67
Promotion of Renewables in Developing Countries
Organisation/Country Laws/Regulations Promotion Programmes Tax Arrangements/ Incentives Environmental Policies Argentina � Regimen Nacional de Energía
Eolica y Solar – law from end of 1999 to transfer resources for development of wind and solar projects
� Renewable Energy and Rural Markets program (PERMER) rural electrification; concessions and funding of rural electrification (wind, PV, etc.)
� tax relief
Bolivia � National rural electrification program (PRONER)
Brazil Financial incentives to owners and/or developers of small hydro schemes
Chile Project GEF: Barrier Removal for Rural Electrification with Renewble Energies
� Goal – 90% coverage for households at a national and regional level by 2006
� subsidies to investments � Institutional framework
China � Renewable Energy Plan � Government is considering
“Mandated Market Share” for renewable energy
� Program on New Renewable Energy from 1996-2010 � “Sunlight Program” to promote solar
energy
� Wind development incentives halving the current 17% VAT duty � tax reductions, interest rate
subsidies � demonstration project
development
India � Renewable Energy Program issued by Ministry of Non-Conventional Energy Sources (MNES)
� Solar Energy Center of MNES initiates: ─ Solar Thermal Program ─ Solar PV Program ─ Solar Building Program
� Center for Wind Energy Technology of MNES coordinating foreign funding for wind projects
� Incentive package to accelerate commercialization of renewable energy technologies ─ soft loans, funding,
subsidies ─ encouraging BOO projects ─ 100% foreign direct
investment possible (by IREDA – Indian Renewable Energy Development Agency) � PV purchase and subsidy
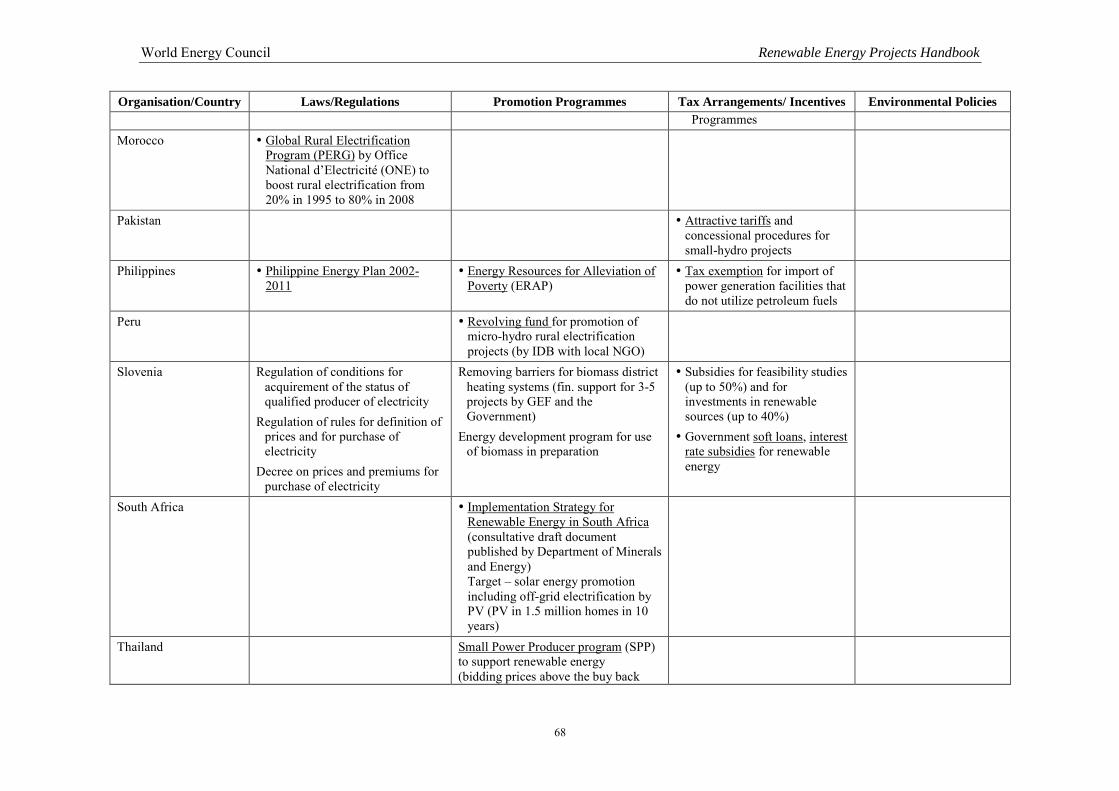
World Energy Council Renewable Energy Projects Handbook
68
Organisation/Country Laws/Regulations Promotion Programmes Tax Arrangements/ Incentives Environmental Policies Programmes
Morocco � Global Rural Electrification Program (PERG) by Office National d’Electricité (ONE) to boost rural electrification from 20% in 1995 to 80% in 2008
Pakistan � Attractive tariffs and concessional procedures for small-hydro projects
Philippines � Philippine Energy Plan 2002-2011
� Energy Resources for Alleviation of Poverty (ERAP)
� Tax exemption for import of power generation facilities that do not utilize petroleum fuels
Peru � Revolving fund for promotion of micro-hydro rural electrification projects (by IDB with local NGO)
Slovenia Regulation of conditions for acquirement of the status of qualified producer of electricity
Regulation of rules for definition of prices and for purchase of electricity
Decree on prices and premiums for purchase of electricity
Removing barriers for biomass district heating systems (fin. support for 3-5 projects by GEF and the Government)
Energy development program for use of biomass in preparation
� Subsidies for feasibility studies (up to 50%) and for investments in renewable sources (up to 40%) � Government soft loans, interest
rate subsidies for renewable energy
South Africa � Implementation Strategy for Renewable Energy in South Africa (consultative draft document published by Department of Minerals and Energy) Target – solar energy promotion including off-grid electrification by PV (PV in 1.5 million homes in 10 years)
Thailand Small Power Producer program (SPP) to support renewable energy (bidding prices above the buy back
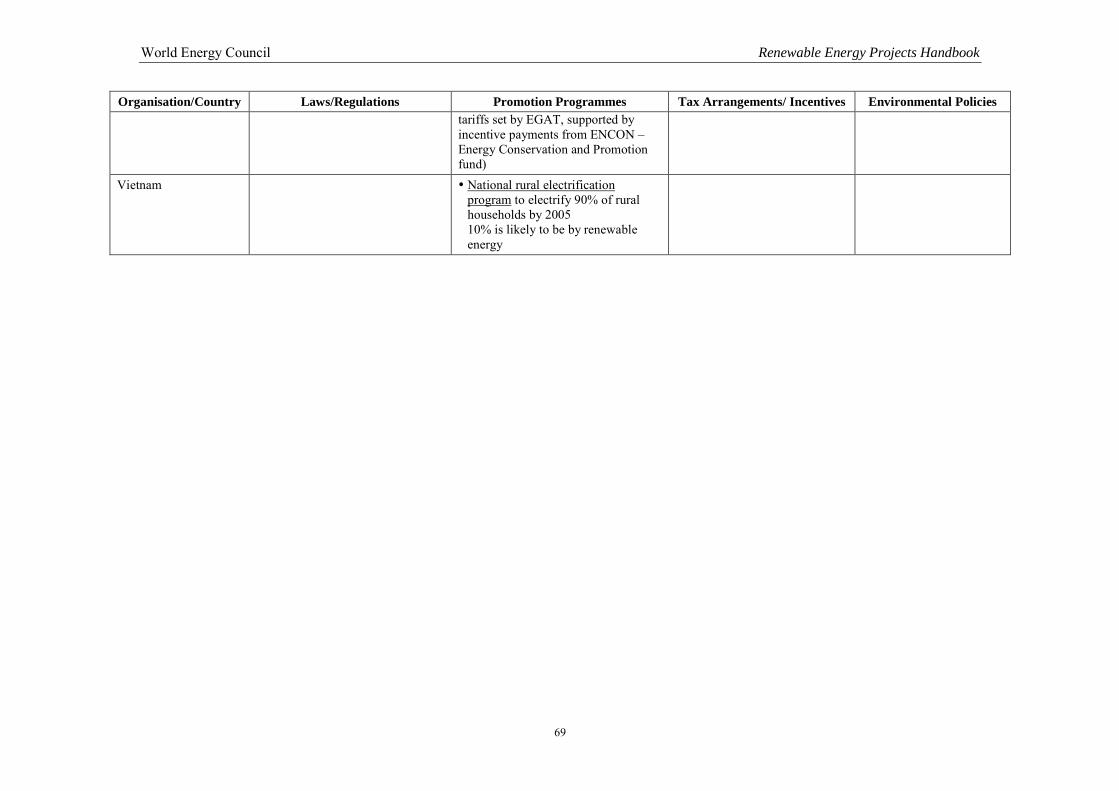
World Energy Council Renewable Energy Projects Handbook
69
Organisation/Country Laws/Regulations Promotion Programmes Tax Arrangements/ Incentives Environmental Policies tariffs set by EGAT, supported by incentive payments from ENCON – Energy Conservation and Promotion fund)
Vietnam � National rural electrification program to electrify 90% of rural households by 2005 10% is likely to be by renewable energy

World Energy Council Renewable Energy Projects Handbook
70
4.3 Cost Evaluations Models Analysing Renewable Projects’ IRR Sensitivity Examples of simplified financial models for renewable energy categories analysing the sensitivity of the projects internal rate of return (IRR), compared with the installed capital cost and the cost of delivered power are presented in the following pages (tables 21-26). Standard input assumptions have been used for ease of comparison. It is assumed that all projects are fully integrated and sizeable at 10 MW. Assumed capacity factors and capital costs are representative of recent projects. Solar PV projects are not included, since their capital cost greatly exceeds what is perceived as “economically viable” cost efficiency. Their deployment may be feasible in remote off-grid installations where solar irradiation is substantive and other alternatives expensive or in special purpose installation. The PV capital costs decrease with increasing numbers of installations and serial production of PV units. It is expected that in the future, PV projects will attain viable capital costs comparable with other renewable projects .
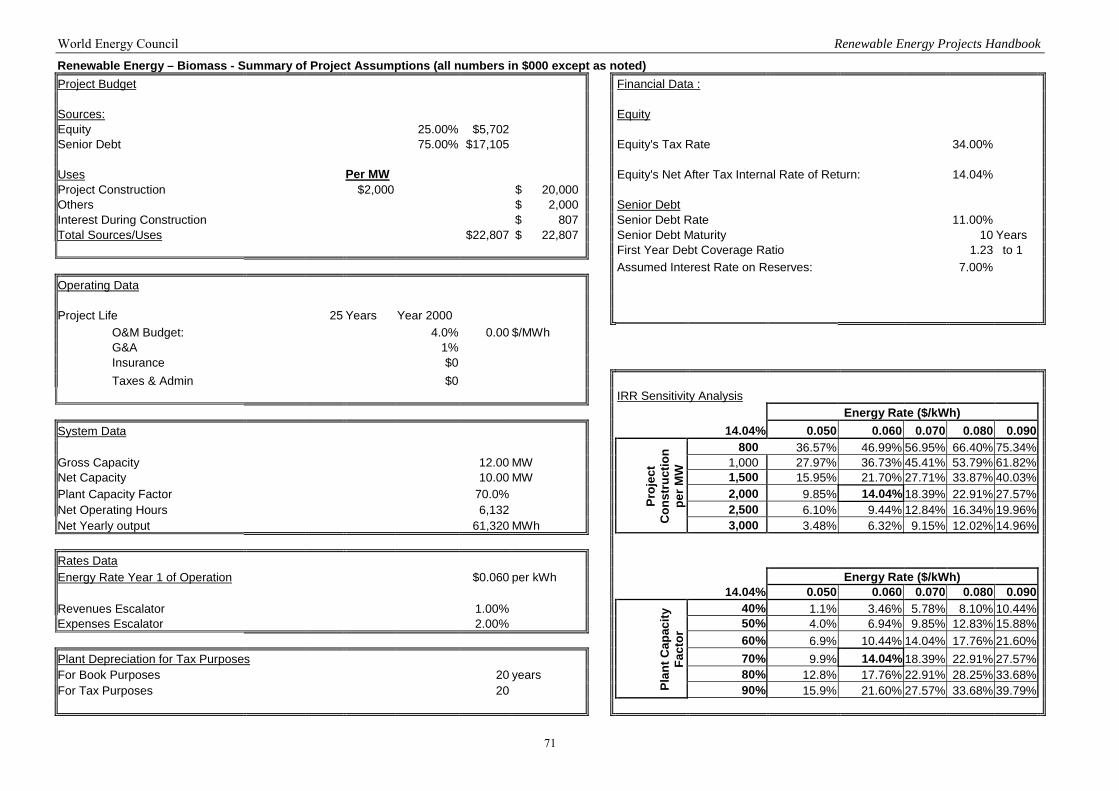
World Energy Council Renewable Energy Projects Handbook
71
Renewable Energy – Biomass - Summary of Project Assumptions (all numbers in $000 except as noted) Project Budget Financial Data : Sources: Equity Equity 25.00% $5,702 Senior Debt 75.00% $17,105 Equity's Tax Rate 34.00% Uses Per MW Equity's Net After Tax Internal Rate of Return: 14.04% Project Construction $2,000 $ 20,000 Others $ 2,000 Senior Debt Interest During Construction $ 807 Senior Debt Rate 11.00% Total Sources/Uses $22,807 $ 22,807 Senior Debt Maturity 10 Years First Year Debt Coverage Ratio 1.23 to 1 Assumed Interest Rate on Reserves: 7.00% Operating Data Project Life 25 Years Year 2000
O&M Budget: 4.0% 0.00 $/MWh G&A 1% Insurance $0 Taxes & Admin $0
IRR Sensitivity Analysis Energy Rate ($/kWh) System Data 14.04% 0.050 0.060 0.070 0.080 0.090 800 36.57% 46.99% 56.95% 66.40% 75.34% Gross Capacity 12.00 MW 1,000 27.97% 36.73% 45.41% 53.79% 61.82% Net Capacity 10.00 MW 1,500 15.95% 21.70% 27.71% 33.87% 40.03% Plant Capacity Factor 70.0% 2,000 9.85% 14.04% 18.39% 22.91% 27.57% Net Operating Hours 6,132 2,500 6.10% 9.44% 12.84% 16.34% 19.96% Net Yearly output 61,320 MWh
Proj
ect
Con
stru
ctio
n pe
r MW
3,000 3.48% 6.32% 9.15% 12.02% 14.96% Rates Data Energy Rate Year 1 of Operation $0.060 per kWh Energy Rate ($/kWh) 14.04% 0.050 0.060 0.070 0.080 0.090 Revenues Escalator 1.00% 40% 1.1% 3.46% 5.78% 8.10% 10.44% Expenses Escalator 2.00% 50% 4.0% 6.94% 9.85% 12.83% 15.88% 60% 6.9% 10.44% 14.04% 17.76% 21.60% Plant Depreciation for Tax Purposes 70% 9.9% 14.04% 18.39% 22.91% 27.57% For Book Purposes 20 years 80% 12.8% 17.76% 22.91% 28.25% 33.68% For Tax Purposes 20 Pl
ant C
apac
ity
Fact
or
90% 15.9% 21.60% 27.57% 33.68% 39.79%
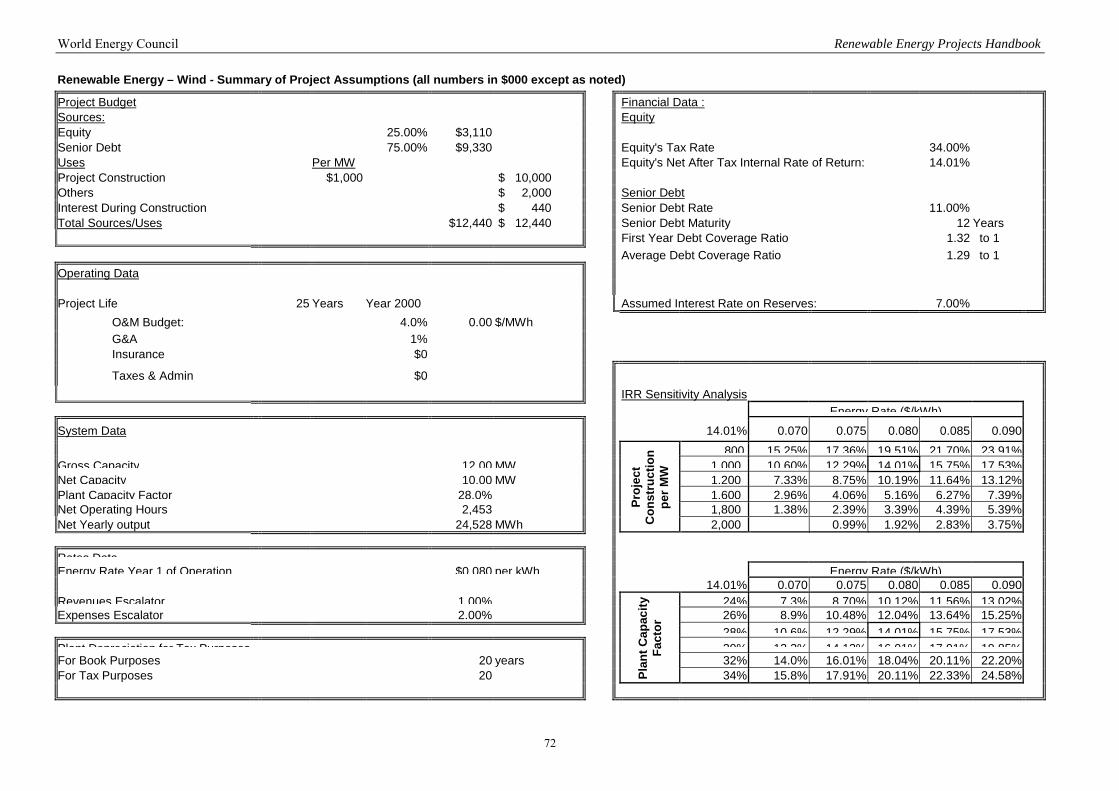
World Energy Council Renewable Energy Projects Handbook
72
Renewable Energy – Wind - Summary of Project Assumptions (all numbers in $000 except as noted)
Project Budget Financial Data : Sources: Equity Equity 25.00% $3,110 Senior Debt 75.00% $9,330 Equity's Tax Rate 34.00% Uses Per MW Equity's Net After Tax Internal Rate of Return: 14.01% Project Construction $1,000 $ 10,000 Others $ 2,000 Senior Debt Interest During Construction $ 440 Senior Debt Rate 11.00% Total Sources/Uses $12,440 $ 12,440 Senior Debt Maturity 12 Years First Year Debt Coverage Ratio 1.32 to 1 Average Debt Coverage Ratio 1.29 to 1 Operating Data Project Life 25 Years Year 2000 Assumed Interest Rate on Reserves: 7.00%
O&M Budget: 4.0% 0.00 $/MWh G&A 1% Insurance $0
Taxes & Admin $0 IRR Sensitivity Analysis
Energy Rate ($/kWh)System Data 14.01% 0.070 0.075 0.080 0.085 0.090
800 15 25% 17 36% 19 51% 21 70% 23 91%Gross Capacity 12 00 MW 1 000 10 60% 12 29% 14 01% 15 75% 17 53%Net Capacity 10.00 MW 1,200 7.33% 8.75% 10.19% 11.64% 13.12%Plant Capacity Factor 28.0% 1,600 2.96% 4.06% 5.16% 6.27% 7.39%Net Operating Hours 2,453 1,800 1.38% 2.39% 3.39% 4.39% 5.39% Net Yearly output 24,528 MWh
Proj
ect
Con
stru
ctio
n pe
r MW
2,000 0.99% 1.92% 2.83% 3.75%
Rates DataEnergy Rate Year 1 of Operation $0 080 per kWh Energy Rate ($/kWh) 14.01% 0.070 0.075 0.080 0.085 0.090 Revenues Escalator 1 00% 24% 7 3% 8 70% 10 12% 11 56% 13 02%Expenses Escalator 2.00% 26% 8.9% 10.48% 12.04% 13.64% 15.25%
28% 10 6% 12 29% 14 01% 15 75% 17 53%Plant Depreciation for Tax Purposes 30% 12 3% 14 13% 16 01% 17 91% 19 85%For Book Purposes 20 years 32% 14.0% 16.01% 18.04% 20.11% 22.20% For Tax Purposes 20 Pl
ant C
apac
ity
Fact
or
34% 15.8% 17.91% 20.11% 22.33% 24.58%
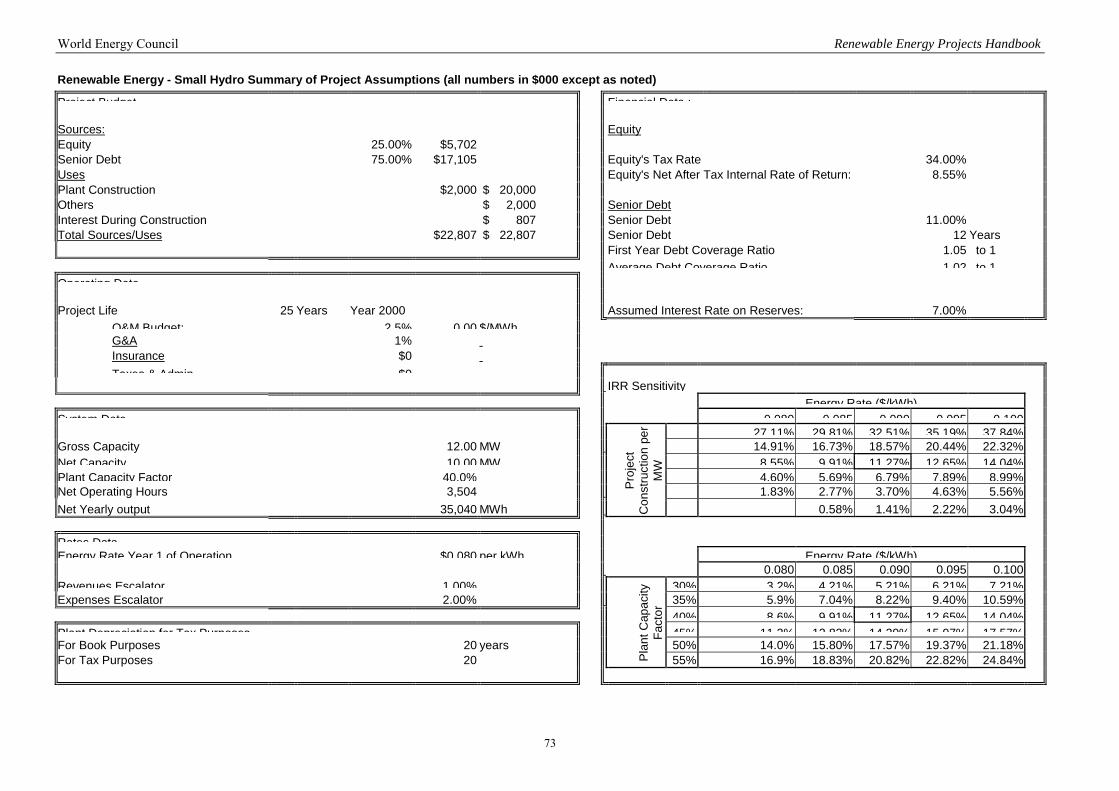
World Energy Council Renewable Energy Projects Handbook
73
Renewable Energy - Small Hydro Summary of Project Assumptions (all numbers in $000 except as noted)
Project Budget Financial Data : Sources: Equity Equity 25.00% $5,702 Senior Debt 75.00% $17,105 Equity's Tax Rate 34.00% Uses Equity's Net After Tax Internal Rate of Return: 8.55% Plant Construction $2,000 $ 20,000 Others $ 2,000 Senior Debt Interest During Construction $ 807 Senior Debt 11.00% Total Sources/Uses $22,807 $ 22,807 Senior Debt 12 Years First Year Debt Coverage Ratio 1.05 to 1
Average Debt Coverage Ratio 1 02 to 1Operating Data Project Life 25 Years Year 2000 Assumed Interest Rate on Reserves: 7.00%
O&M Budget: 2 5% 0 00 $/MWhG&A 1% Insurance $0 Taxes & Admin $0
IRR Sensitivity Energy Rate ($/kWh)
System Data 8 55 0 080 0 085 0 090 0 095 0 10027 11% 29 81% 32 51% 35 19% 37 84%
Gross Capacity 12.00 MW 14.91% 16.73% 18.57% 20.44% 22.32% Net Capacity 10 00 MW 8 55% 9 91% 11 27% 12 65% 14 04%Plant Capacity Factor 40.0% 4.60% 5.69% 6.79% 7.89% 8.99%Net Operating Hours 3,504 1.83% 2.77% 3.70% 4.63% 5.56% Net Yearly output 35,040 MWh
Pro
ject
C
onst
ruct
ion
per
MW
0.58% 1.41% 2.22% 3.04%
Rates DataEnergy Rate Year 1 of Operation $0 080 per kWh Energy Rate ($/kWh) 8.55 0.080 0.085 0.090 0.095 0.100 Revenues Escalator 1 00% 30% 3 2% 4 21% 5 21% 6 21% 7 21%Expenses Escalator 2.00% 35% 5.9% 7.04% 8.22% 9.40% 10.59%
40% 8 6% 9 91% 11 27% 12 65% 14 04%Plant Depreciation for Tax Purposes 45% 11 3% 12 82% 14 39% 15 97% 17 57%For Book Purposes 20 years 50% 14.0% 15.80% 17.57% 19.37% 21.18% For Tax Purposes 20 P
lant
Cap
acity
Fa
ctor
55% 16.9% 18.83% 20.82% 22.82% 24.84%
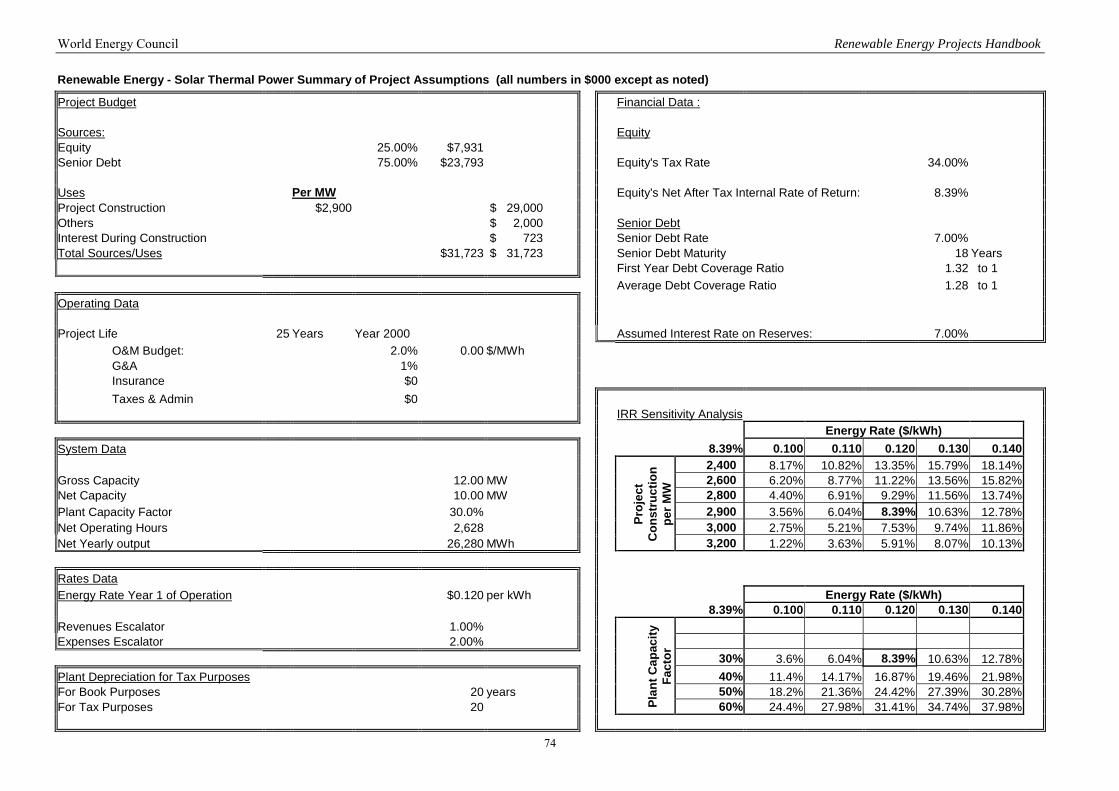
World Energy Council Renewable Energy Projects Handbook
74
Renewable Energy - Solar Thermal Power Summary of Project Assumptions (all numbers in $000 except as noted)
Project Budget Financial Data : Sources: Equity Equity 25.00% $7,931 Senior Debt 75.00% $23,793 Equity's Tax Rate 34.00% Uses Per MW Equity's Net After Tax Internal Rate of Return: 8.39% Project Construction $2,900 $ 29,000 Others $ 2,000 Senior Debt Interest During Construction $ 723 Senior Debt Rate 7.00% Total Sources/Uses $31,723 $ 31,723 Senior Debt Maturity 18 Years First Year Debt Coverage Ratio 1.32 to 1 Average Debt Coverage Ratio 1.28 to 1 Operating Data Project Life 25 Years Year 2000 Assumed Interest Rate on Reserves: 7.00%
O&M Budget: 2.0% 0.00 $/MWh G&A 1% Insurance $0 Taxes & Admin $0
IRR Sensitivity Analysis Energy Rate ($/kWh) System Data 8.39% 0.100 0.110 0.120 0.130 0.140 2,400 8.17% 10.82% 13.35% 15.79% 18.14% Gross Capacity 12.00 MW 2,600 6.20% 8.77% 11.22% 13.56% 15.82% Net Capacity 10.00 MW 2,800 4.40% 6.91% 9.29% 11.56% 13.74% Plant Capacity Factor 30.0% 2,900 3.56% 6.04% 8.39% 10.63% 12.78% Net Operating Hours 2,628 3,000 2.75% 5.21% 7.53% 9.74% 11.86% Net Yearly output 26,280 MWh
Proj
ect
Con
stru
ctio
n pe
r MW
3,200 1.22% 3.63% 5.91% 8.07% 10.13% Rates Data Energy Rate Year 1 of Operation $0.120 per kWh Energy Rate ($/kWh) 8.39% 0.100 0.110 0.120 0.130 0.140 Revenues Escalator 1.00% Expenses Escalator 2.00% 30% 3.6% 6.04% 8.39% 10.63% 12.78% Plant Depreciation for Tax Purposes 40% 11.4% 14.17% 16.87% 19.46% 21.98% For Book Purposes 20 years 50% 18.2% 21.36% 24.42% 27.39% 30.28% For Tax Purposes 20 Pl
ant C
apac
ity
Fact
or
60% 24.4% 27.98% 31.41% 34.74% 37.98%
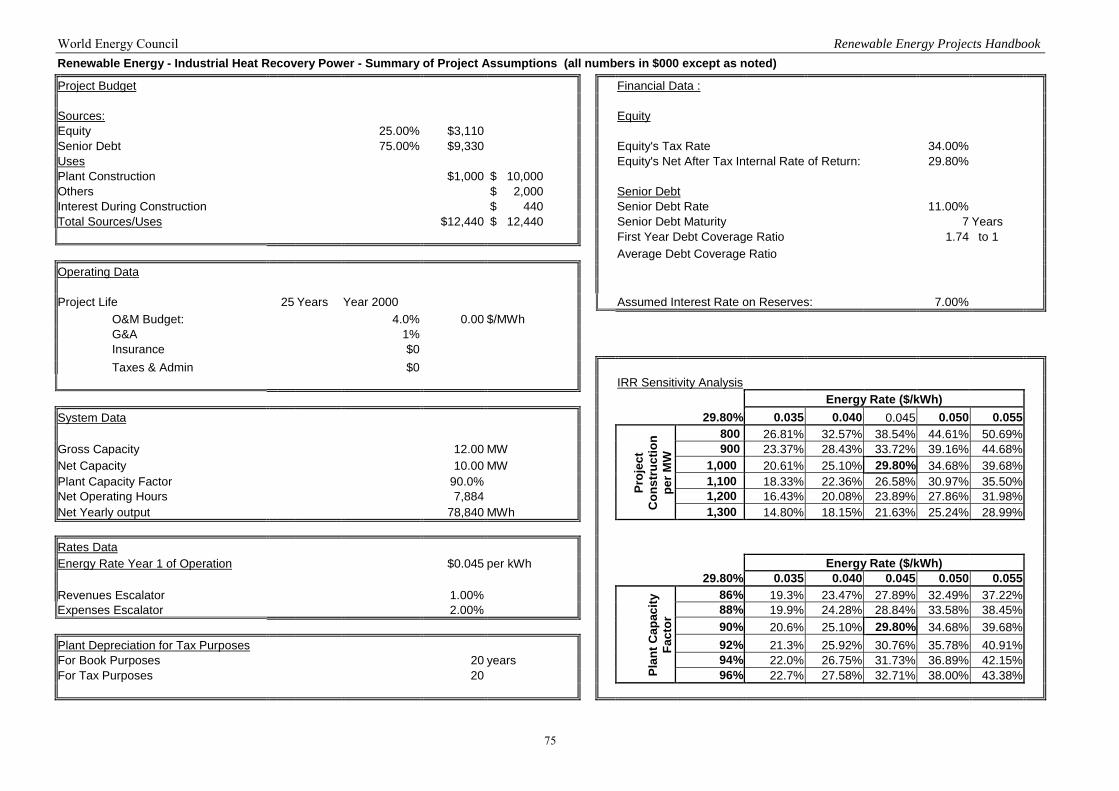
World Energy Council Renewable Energy Projects Handbook
75
Renewable Energy - Industrial Heat Recovery Power - Summary of Project Assumptions (all numbers in $000 except as noted)
Project Budget Financial Data : Sources: Equity Equity 25.00% $3,110 Senior Debt 75.00% $9,330 Equity's Tax Rate 34.00% Uses Equity's Net After Tax Internal Rate of Return: 29.80% Plant Construction $1,000 $ 10,000 Others $ 2,000 Senior Debt Interest During Construction $ 440 Senior Debt Rate 11.00% Total Sources/Uses $12,440 $ 12,440 Senior Debt Maturity 7 Years First Year Debt Coverage Ratio 1.74 to 1 Average Debt Coverage Ratio Operating Data Project Life 25 Years Year 2000 Assumed Interest Rate on Reserves: 7.00%
O&M Budget: 4.0% 0.00 $/MWh G&A 1% Insurance $0 Taxes & Admin $0
IRR Sensitivity Analysis Energy Rate ($/kWh) System Data 29.80% 0.035 0.040 0.045 0.050 0.055 800 26.81% 32.57% 38.54% 44.61% 50.69% Gross Capacity 12.00 MW 900 23.37% 28.43% 33.72% 39.16% 44.68% Net Capacity 10.00 MW 1,000 20.61% 25.10% 29.80% 34.68% 39.68% Plant Capacity Factor 90.0% 1,100 18.33% 22.36% 26.58% 30.97% 35.50% Net Operating Hours 7,884 1,200 16.43% 20.08% 23.89% 27.86% 31.98% Net Yearly output 78,840 MWh
Proj
ect
Con
stru
ctio
n pe
r MW
1,300 14.80% 18.15% 21.63% 25.24% 28.99% Rates Data Energy Rate Year 1 of Operation $0.045 per kWh Energy Rate ($/kWh) 29.80% 0.035 0.040 0.045 0.050 0.055 Revenues Escalator 1.00% 86% 19.3% 23.47% 27.89% 32.49% 37.22% Expenses Escalator 2.00% 88% 19.9% 24.28% 28.84% 33.58% 38.45% 90% 20.6% 25.10% 29.80% 34.68% 39.68% Plant Depreciation for Tax Purposes 92% 21.3% 25.92% 30.76% 35.78% 40.91% For Book Purposes 20 years 94% 22.0% 26.75% 31.73% 36.89% 42.15% For Tax Purposes 20 Pl
ant C
apac
ity
Fact
or
96% 22.7% 27.58% 32.71% 38.00% 43.38%
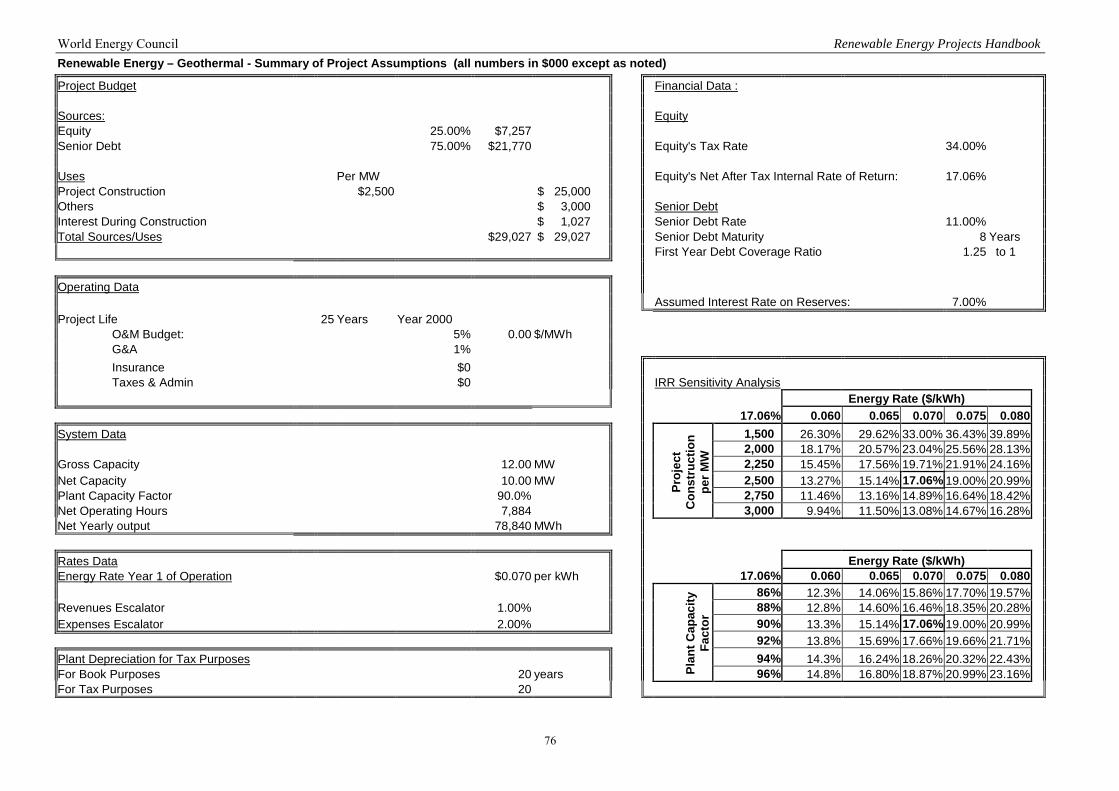
World Energy Council Renewable Energy Projects Handbook
76
Renewable Energy – Geothermal - Summary of Project Assumptions (all numbers in $000 except as noted)
Project Budget Financial Data : Sources: Equity Equity 25.00% $7,257 Senior Debt 75.00% $21,770 Equity's Tax Rate 34.00% Uses Per MW Equity's Net After Tax Internal Rate of Return: 17.06% Project Construction $2,500 $ 25,000 Others $ 3,000 Senior Debt Interest During Construction $ 1,027 Senior Debt Rate 11.00% Total Sources/Uses $29,027 $ 29,027 Senior Debt Maturity 8 Years First Year Debt Coverage Ratio 1.25 to 1 Operating Data Assumed Interest Rate on Reserves: 7.00% Project Life 25 Years Year 2000
O&M Budget: 5% 0.00 $/MWh G&A 1% Insurance $0 Taxes & Admin $0 IRR Sensitivity Analysis
Energy Rate ($/kWh) 17.06% 0.060 0.065 0.070 0.075 0.080 System Data 1,500 26.30% 29.62% 33.00% 36.43% 39.89% 2,000 18.17% 20.57% 23.04% 25.56% 28.13% Gross Capacity 12.00 MW 2,250 15.45% 17.56% 19.71% 21.91% 24.16% Net Capacity 10.00 MW 2,500 13.27% 15.14% 17.06% 19.00% 20.99% Plant Capacity Factor 90.0% 2,750 11.46% 13.16% 14.89% 16.64% 18.42% Net Operating Hours 7,884
Proj
ect
Con
stru
ctio
n pe
r MW
3,000 9.94% 11.50% 13.08% 14.67% 16.28% Net Yearly output 78,840 MWh Rates Data Energy Rate ($/kWh) Energy Rate Year 1 of Operation $0.070 per kWh 17.06% 0.060 0.065 0.070 0.075 0.080 86% 12.3% 14.06% 15.86% 17.70% 19.57% Revenues Escalator 1.00% 88% 12.8% 14.60% 16.46% 18.35% 20.28% Expenses Escalator 2.00% 90% 13.3% 15.14% 17.06% 19.00% 20.99% 92% 13.8% 15.69% 17.66% 19.66% 21.71% Plant Depreciation for Tax Purposes 94% 14.3% 16.24% 18.26% 20.32% 22.43% For Book Purposes 20 years Pl
ant C
apac
ity
Fact
or
96% 14.8% 16.80% 18.87% 20.99% 23.16% For Tax Purposes 20
World Energy Council Renewable Energy Projects Handbook
77
4.4 Inclusion of Externalities
Capital cost comparisons of energy projects in many cases lack an overall life cycle cost evaluation. The high, up-front costs of renewable energy projects are a disadvantage vis-à-vis fossil-fuelled projects, especially low-cost high efficiency gas-fuelled combined cycle projects. The comparison would be more “fair” if environmental contributions, life-cycle fuel consumption and other social-impact issues – what is called “externalities” – were included in the project evaluation. The renewable energy projects would get an additional dimension, improving their competitiveness.
GHG emissions reductions: The most advanced “externality” that will contribute to cost evaluations of renewable energy projects is the developing market of GHG Emissions Reduction Certificates. Renewables, mostly zero or minimum emissions technologies, become eligible for tradable certificates according to their contribution to avoid carbon emissions. WEC has developed an interactive database for registering GHG emission reduction projects around the world. By January 2004, GHG emission reduction projects with a total saving of 2.1 Gt of CO2e per annum have been identified and entered in the database. The UNEP has developed Guidelines for calculating GHG emissions reduction as a tool to assess the potential of projects in the process of capitalising from this contribution. GHG Emission Reductions can be calculated according to the UNEP GHG Indicator. [Total Project Electricity Output x Country grid CO2 emissions factor].
World Energy Council Renewable Energy Projects Handbook
78
WEC COMMITTEE ON RENEWABLES
MEMBERSHIP
Chairman: Dr. Christopher W. Morris Powergen Renewables (UK) Members:
Brazil: Dr. Plinio Mário Nastari Datagro Publicações
Canada: Mr. Bruce Sampson Powerex
Chile: Mr. Carlos E. Bonifetti Termofluidos Ltd
Egypt: Eng. Bothayna A. Rashed New & Renewable Energy Authority (NREA)
Finland: Dr. Timo Nyrönen Vapo Oy
Germany: Mr. Erwin Haydn & E.ON Energie AG Dr. Frank Höpner Israel: Dr. Lucien Y. Bronicki & Ormat Industries Ltd Mr. Michael Lax
Japan: Dr. Takeshi Kaneda Mitsubishi Research Institute Inc.
Korea: Dr. Jae-Hoon Lee Korea Energy Management Corporation
Luxembourg: Prof. Marcel Oberweis Institut Supérieur de Technologie
Norway: Mr. Christian Grorud Kan Energi AS
Senegal: Mr. Louis Seck Ministry of Energy, Solar Energy Division
Slovenia: Mr. Franko Nemac APE- Energy Restructuring Agency
Thailand: Mr. Amnuay Thongsathitya & Department of Energy Development and Dr. Boonrod Sajjakulnukit Promotion, Bureau of Energy Study, R&D Turkey: Mr. Ahmet F. Karamustafaoğlu General Directorate of Electrical Power & Mr. Kemal Koman Resources Survey and Development Admin.
UK: Mr. Anthony Derrick IT Power
Venezuela: Mr. Pablo R. Varela Ministry of Energy & Mines
International Organisations: IHA: Mr. Richard Taylor
WREN: Dr. G Wisniewski/Dr. Bernhard Krahl-Urban
WEC: Ms. Elena V. Nekhaev
World Energy Council Renewable Energy Projects Handbook
79
LIST OF ACRONYMS & ABBREVIATIONS
°C degrees Celsius BOO Build-Own-Operate BOOT Build-Own-Operate-Transfer BOT Build-Own-Transfer CAES Compressed Air Energy Storage CDM Clean Development Mechanism CERs Certified Emissions Reductions CHP Combined Heat and Power CO2 Carbon Dioxide DG Distributed Generation ECA Export Credit Agency ETS Emission Trading Scheme ETWAN Energy for Tomorrow’s World – Acting Now! (WEC’s Millennium Statement-2000) EU European Union FDI Foreign Direct Investment GEIS Global Energy Information System GHG Greenhouse Gas Gt gigatonne GW gigawatt H+P Heat and Power H2S Hydrogen Sulphide ICI International Credit Institution IFI International Financial Institution IHA International Hydropower Association IHRP Industrial Heat Recovery Power IWH Industrial Waste Heat JI Joint Implementation km kilometre kW kilowatt kWh kilowatt hour kWp kilowatt peak m metre M2 square metre MIGA Multilateral Investment Guarantee Agency Mt megatonne MW megawatt MWe megawatt electricity MWp megawatt peak MWt megawatt thermal NGO Non-Governmental Organisation O&M Operation and Maintenance OECD Organisation for Economic Cooperation & Development ORC Organic Rankine Cycle PJ petajoule PPA Power Purchase Agreement PV Photovoltaic RD&D Research, Development and Demonstration RFQ Request for Quotation RFT Request for Proposal RO Renewables Obligation RPS Renewable Portfolio Standard TWh terrawatt hour TWhe terawatt hour electric UBS Utility Battery Systems UNFCCC United Nations Framework Convention on Climate Change VRLA Value Regulated Lead-Acid Wp watts peak WREN World Renewable Energy Network
World Energy Council Renewable Energy Projects Handbook
80
LIST OF FIGURES AND TABLES
Figures Page
1 World Total Primary Energy Supply, 2002 ............................................................................. 1 2 Global Circulation of Wind Around the Earth......................................................................... 6 3 Global Leaders in Wind Energy, 2002 .................................................................................... 7 4 Principle Effects of Plant Concepts on Generator, speed, active & reactive power ................ 9 5 World Map of Lithospheric Plate Boundaries ......................................................................... 10 6 Global Leaders in Geothermal Power Generation, 2002 ......................................................... 11 7 Yearly Solar Irradiation Against a Horizontal Surface (kWH/m2) .......................................... 12 8 Global Leaders in PV Installed Capacity, 2002....................................................................... 13 9 Off-grid markets in Developed Countries ............................................................................... 26
10 Global Renewable Energy Resources (main countries)........................................................... 29 11 Specific Daily Delivered Electricity/Specific Capital Cost ..................................................... 31 12 Project Delivery Stages. .......................................................................................................... 49
Tables Page
1 Types of Bioenergy Supply………………………………………………………………… 4 2 World’s Leading Producers of Hydropower at the end of 2002 ................................................ 14 3 Main Characteristics of Different Technologies........................................................................ 17 4 General Barriers and Success Factors for Renewable Energy ................................................... 22 5 Technology Specific Barriers and Success Factors ................................................................... 23 6 Main Countries with Renewable Energy Resources.................................................................. 28 7 Renewables in Energy Markets ................................................................................................. 29 8 Summary of Installed Capacity Costs for Renewables.............................................................. 30 9 Specific Daily Delivered Electricity/Specific Capital Cost ....................................................... 32
10 Cost of Delivered Power............................................................................................................ 32 11 Typical O&M Ratio................................................................................................................... 35 12 Typical Payback Time on Investments in Renewable Energy Projects ..................................... 35 13 CO2 Emissions from Different Power Generating Technologies .............................................. 36 14 Renewable Project Development Stages ................................................................................... 47 15 Environmental Credits Acquisition Process .............................................................................. 52
16-20 Policies for Promotion of Renewables....................................................................................... 51 21-26 Samples of Simplified Financial Models…………………………………………………….. 71
World Energy Council Renewable Energy Projects Handbook
81
BIBLIOGRAPHY
BC Hydro with assistance of the Sheltair Group Resource Consultants, Canadian Experience with Barriers to Development of Small and Micro Hydro Energy, 2002
Bitsch Rainer, Intelligent Decentralized Energy Supply, Increasing the Benefits of Distributed Generation and Renewables, Cogeneration and On-Site Power Production, Vol. 3, Issue 3, May-June 2002, pp. 31-37
Bronicki, Lucien Y., Geothermal Power Stations, Encyclopedia of Physical Science and Technology, Third Edition, 2002, pp. 709-718
Bronicki, Lucien Y., Solar Ponds, Encyclopedia of Physical Science and Technology, Third Edition, 2002, pp. 149-166
Department for International Development, Khennas, Smail & Barnett, Andrew, Best Practices for Sustainable Development of Micro Hydro Power in Developing Countries, 2000
Edge Energy Services, Evaluation of the greenhouse gas emission reductions potential of Phase II, Olkaria III geothermal project, Kenya, 2001
Energy Information Administration, Washington DC, Voluntary Reporting of Greenhouse Gases 2000, 2002 (www.eia.gov/oiaf/1605/vrrpt/index.html)
European Commission, Directive 2001/77/EC of the European Parliament and of the Council of 27 September 2001 on the Promotion of Electricity Produced from Renewable Energy sources in the Internal Electricity Market, Official Journal of the European Communities L283/33, 2001
European Commission CMT – ENERG, Scientific and Technological References, Energy Technology Indicators, 2002-07 (draft), 20 March 2002
European Union, Landfill Gas – Current Market Position and Future Potential, (www.europa.eu.int)
G8 Renewable Energy Task Force, Final Report, 2001
GEA, Gawell, Karl, Reed, Marshall, Wright, Michael P., Preliminary Report: Geothermal Energy The Potential for Clean Power from Earth, 1999 (http://www.geo.energy.org/Potential Report.htm)
GEF, Renewable Energy:GEF Partners with Business for a Better World, (www.gefweb.org)
Hall, D.O., Rosillo-Calle F., Williams R.H., Woods, J., Biomass for Energy; supply prospects, in: “Renewable Energy, Source for Fuels and Electricity, 1993
Hassing, Henriette & Varming, Søren Life Cycle Assessment for Wind Turbines, 2001 European Wind Energy Conference, Copenhagen, 2001
International Energy Agency (IEA), World Energy Outlook, 2000
KanEnergy AS, Norwegian Developments, New Renewable Energy, 1998
Kartha, Sivan & Leach, Gerald, Report to the Shell Foundation, Using Modern Bioenergy to Reduce Rural Poverty, 2001
Lawrence Berkeley National Laboratory, Bolinger, Mark, Wiser, Ryan, Golove, William, Revisiting the “Buy versus Build” Decision for Publicly Owned Utilities in California Considering Wind and Geothermal Resources, 2001, (http://eetd.lbl.gov/EA/EMP)
World Energy Council Renewable Energy Projects Handbook
82
Lax, Michael, Industrial Waste Heat Utilization – A Novel Approach to Industrial Energy Efficiency with Positive Environmental Contributions, 2001
Lund, John W., World Geothermal Congress Proceedings 2000, World Status of Geothermal Energy Use, Overview 1995-1998, pp. 4105-4111
National Renewable Energy Laboratory (NREL), “An Economic Valuation of a Geothermal Production Tax Credit”, (www.nrel.gov/publications/)
National Wind Coordinating Committee, Wind Energy Costs, 1997 (www.nationalwind.org)
National Wind Coordinating Committee, Cohen, Joseph M. & Wind, Thomas A., Distributed Wind Power Assessment, 2001 (www.nationalwind.org)
ORMAT, Legmann, Hilel, Recovery of Industrial Heat in the Cement Industry by Means of the ORC Process, 2002
Pembina Institute for Appropriate Development, Raynolds, Marlo & Pape, Andrew, The Pembina Institute Green Power Guidelines for Canada, 2000 (www.pembina.org)
Pew Center on Global climate Change, Smith, Douglas W., Nordhous, Robert R., Roberts, Thomas C., Fidler S., Anderson J., Danish K., Agnew R. & Chupka M., Designing a Climate-Friendly Energy Policy: Options for the Near Term, 2002 (www.pewclimate.org)
SOLEL Presentation, Parabolic Troughs Integrated with Thermal Power Machines, June 2002
Tech-wise AS, Barriers and Success Factors for Wind Power, 2002
Tomer, Reshef, Financing of Small Power Projects, Proceedings WEC/MIEC Symposium on Distributed Power, Ramat Gan, 2001
UNDP/WEC, World Energy Assessment, 2000
UNEP, Thomas, Charles, Tennant, Tessa & Rolls, Jon, The GHG Indicator: UNEP Guidelines for Calculating Greenhouse Gas Emissions for Business and Non-Commercial Organisations, 2000
US DOE, Bolinger, Mark, Wiser, Ryan, Milford, Lew, Stoddard, Michael & Porter, Keven, Clean Energy Funds: An Overview of State Support for Renewable Energy, 2001
Washington Post editorial board, Renewable Energy Fact Sheet, February 13, 2001
WGC, Bronicki, Lucien Y., WGC, Financing Private Power Geothermal Energy Projects, Hurdles and Opportunities, 2000
WGC, Huttrer, Gerald W., World Geothermal Congress Proceedings, The Status of Geothermal Power Generation 1995-2000, 2000
World Energy Council, Energy for Tomorrow’s World, the Realities, the Real Options, and the Agents for Achievement, 1993
World Energy Council, New Renewable Energy Resources, A Guide to the Future, 1994
World Energy Council, Energy for Tomorrow’s World – Acting Now!, 2000
World Energy Council and South Asian Association for Regional Cooperation (SAARC), Renewable Energy in South Asia, Status and Prospects, 2000
World Energy Council, Performance of Generating Plant, 2001
World Energy Council Renewable Energy Projects Handbook
83
World Energy Council, Renewable Energy Targets, 2003
Questionnaires on Renewable Reference Projects, prepared for the WEC Renewables Committee, July – September 2001 by: Entwistle Richard, Hong Kong, CLP Research Institute Gada Bülent, Turkey, Foreign Relations Department Grorud Christian, Norway, Kan Energi AS Hoepner Frank, Germany, E.O.N Energie Kaneda Takeshi, Japan, Mitsubishi Research Institute Inc. Lax Michael, Israel, ORMAT Industries Ltd Nemac Franko, Slovenia, APE Energy Restructuring Agency Rekstad John, Norway, SolarNor AS Rogulska Magdalena & Wisniewski Grzegorz, Poland, EC BREC
Sajjakulnukit Boonrod & Thongsathitya Amnuay, Thailand, Department of Energy Development and Promotion Seck Louis, Senegal, Ministry of Energy, Solar Energy Division
World Energy Council, Grorud, Christian & Bugge, Lars, WEC Review on Renewable Energy/Solar Heating, 2002