alternative n-fertilizers: do they work...
TRANSCRIPT

Alternative N-fertilizers:
Do They Work Better?

Nitrogen Management
Goal:
- Match crop need with fertilizer and/or manure applied
to optimize production economics
- Ensure maximum nutrient use efficiency by timing
and placement of N in such a way as to reduce losses
to the environment
- Use the more effective source of nitrogen
• How can we manage to improve nitrogen use
efficiency (NUE)?

Nitrogen Use Efficiency is Increasing
Figure 1. Trends in maize grain yield, use
of N fertilizer, and Partial Factor
Productivity from applied N fertilizer (PFPN,
kg grain yield kg−1 N applied) in the USA.
Sources of data: Mean annual maize
yields, National Agricultural Statistics
Service, USDA www.usda.gov/nass/; mean
annual N fertilizer N use, USDA Annual
Cropping Practices Surveys (> 2000 farms
representing 80 to 90% of the USA maize
area), Economic Research Service, USDA,
www.ers.usda.gov/
From Cassman et al., 2002
•U.S corn grain
production has
increased
• Fertilizer N use
has leveled off
since 1980

Optimizing Nitrogen Use
• Exploit improvements in nitrogen use efficiency
(NUE) from genetics and cultural practices
• Manage N to avoid losses
- Improve N rate decisions
- Placement – Control NH3 and NO3 loss
- Timing – Use sidedress or delayed applications if
leaching or denitrification risk is high
- Use effective sources
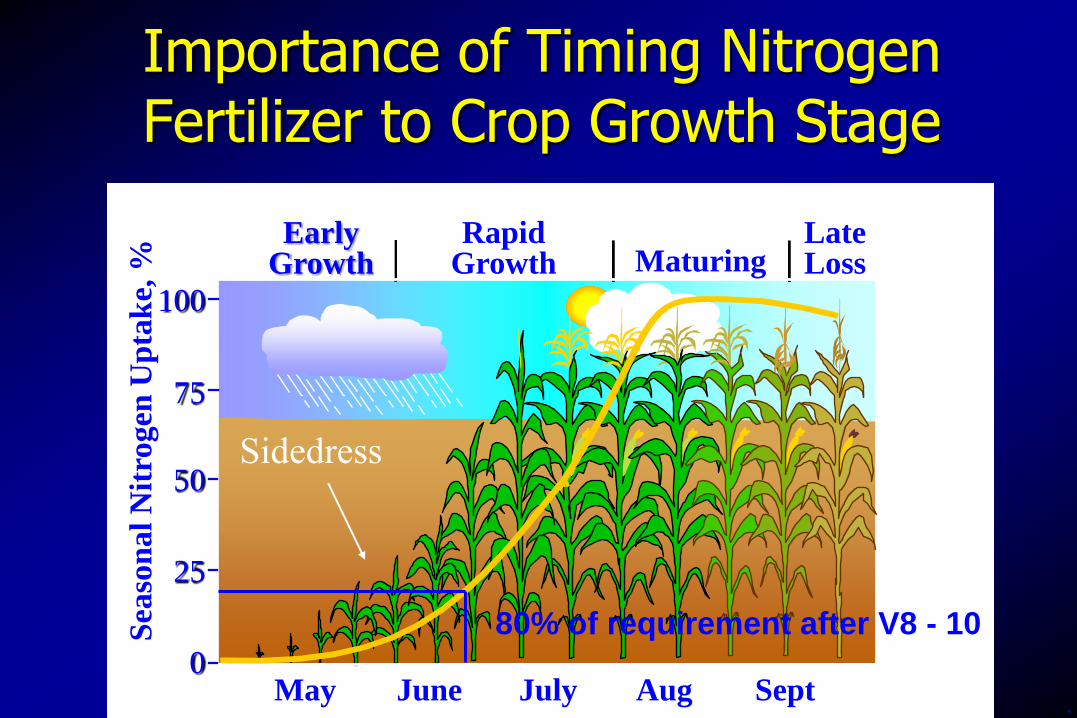
Importance of Timing Nitrogen Fertilizer to Crop Growth Stage
Early Growth
Rapid Growth Maturing
Late Loss
100
75
50
25
0 May June July Aug Sept
80% of requirement after V8 - 10
Sidedress
Sea
son
al
Nit
rogen
Up
tak
e, %

Alternative Nitrogen Fertilizer Products
Slow Release
• Coated fertilizers
• More complex materials
Additives
• Microbial inhibitors
• Others
Objectives of Southern Region Water Program: Nutrient Management Team
Within each state:
- Compare yields from replicated studies for
different N fertilizer sources (alternative N
fertilizers vs the standard N fertilizer used in
that state).
- Each state will compare Nutrisphere and ESN,
where appropriate. Some states will compare
additional slow release fertilizers or additives.

Individual State
Nitrogen Fertilizer Trials

Wheat Results

50 lb N
2010 Wheat Yield: Oklahoma
No-till: There was no significant yield
benefit of using a product or additive
compared to UREA at the same rate.
Optimum yield at 75 lb N/ac.
Conv.: There was no significant yield
benefit of using a product or additive
compared to UREA at the same
rate. Significant rate difference.
Optimum yield at 75 lb N/ac.
75 lb N 100 lb N
0
10
20
30
40
50
60
70
Yie
ld B
u/a
c
Conventional
50 lb N 75 lb N 100 lb N
0
10
20
30
40
50
Yie
ld B
u/a
c
No-Till

2011 Wheat Yield: Oklahoma Conv.: There was no significant yield
benefit of using a product or additive
compared to UREA at the same rate.
Significant rate difference. Optimum
rate at 100 lb N/ac.
No-Till: There was no significant yield
benefit of using a product or additive
compared to UREA at the same rate.
Significant rate difference. Optimum rate
at 75 lb N/ac.
50 lb N 75 lb N 100 lb N
0
5
10
15
20
25
30
35
Yie
ld B
u a
c-1
Conventional
50 lb N 75 lb N 100 lb N
0
5
10
15
20
25
30
Yie
ld B
u a
c-1
No-till

Wheat Protein: Oklahoma
• Across both locations and years there was no
significant difference in grain protein when a
product or additive was added when
compared to UREA at the same nitrogen
rate.

Wheat Yields: Piedmont, North Carolina
0
1000
2000
3000
4000
5000
6000
0 45 70 95 120 145
Gra
in Y
ield
(lb
/acr
e)
N Fertilizer Application (lb/ac)
UFP UAN
Control
*Year, Rate, Source
UAN>UFP
95 lb N
UAN better
than
Nitamin.
Optimum
rate at 95
lb N/ac.
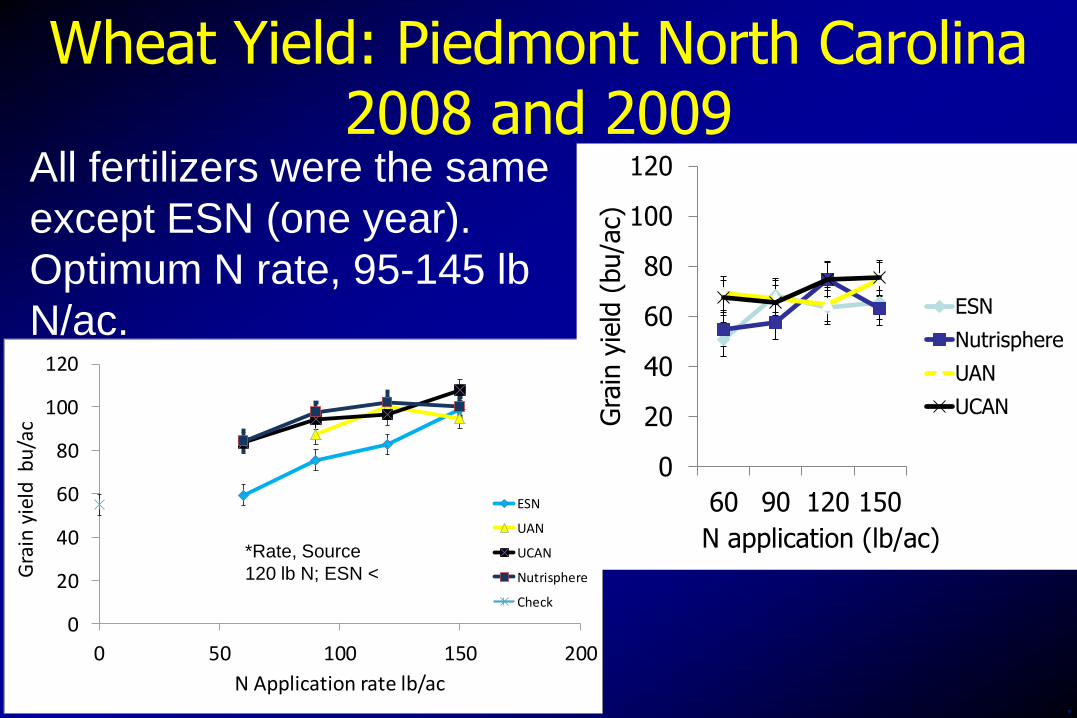
Wheat Yield: Piedmont North Carolina 2008 and 2009
0
20
40
60
80
100
120
0 50 100 150 200
Gra
in y
ield
bu
/ac
N Application rate lb/ac
ESN
UAN
UCAN
Nutrisphere
Check
*Rate, Source
120 lb N; ESN <
0
20
40
60
80
100
120
60 90 120 150
Gra
in y
ield
(bu/a
c)
N application (lb/ac)
ESN
Nutrisphere
UAN
UCAN
All fertilizers were the same
except ESN (one year).
Optimum N rate, 95-145 lb
N/ac.

Corn Results

Relative Corn Yield: Alabama, 2008-2011

Corn Yield and N Response: Arkansas 2010
0
40
80
120
160
Corn
gra
in y
ield
(bu/a
cre
) ESN Urea
N source
**
0
40
80
120
160
13
Corn
gra
in y
ield
(bu/a
cre
)
60 120 180
a
b
c LSD = 12
ESN produced greater yields than UAN. Yield
increased up to 180 lb N/ac.

Corn Yield: New Mexico
UAN,
Urea, and
Agrotain
with Urea
performed
the same
under
irrigated
conditions.

Corn Yields: North Carolina
0
50
100
150
200
0 50 100 150 200 250
Gra
in y
ield
(bu/a
c)
N application rate (lb/ac)
UFP 04
UFP 05
*Year, Rate, Source
UAN>UFP in 2005
175 lb N
Piedmont
0
50
100
150
200
0 50 100 150 200 250
Gra
in y
ield
s (b
u/a
c)
N application rate (lb/ac)
UFP Tidewater 04
UFP Tidewater 05
Coastal Plain
*Year, Rate
175 lb N
All fertilizers performed the
same except Nitamin.
Optimum rate, 175 lb N/ac.
All fertilizers performed
the same. Optimum rate,
175 lb N/ac.

Corn Grain Yield: North Carolina, 2008 and/or 2009
0
20
40
60
80
100
120
140
160
0 50 100 150 200 250
Gra
in y
ield
(bu/a
c)
N application rate (lb/ac)
ESN
Nutrisphere
UCAN
UAN *Rate
145 lb N
Coastal Plain
All fertilizers performed the
same. Rate differences.
Optimum rate, 145 lb N/ac.
0
50
100
150
200
250
0 100 200 300
Gra
in y
ield
(bu/a
c)
N application rate (lb/ac)
ESN
Nutrisphere
Mountains
All fertilizers performed
the same. Rate
differences. Optimum
rate, 180 lb N/ac.

Grain Yield†
Nitrogen
Rate
(lbs/A)
UAN
UAN +
Nutrisphere
(0.5% v/v)
UAN +
Agrotain Ultra
(0.2% v/v)
UAN +
N-Sure
(50/50)
UAN +
CoRoN
(50/50)
UAN +
NDemand
(50/50)
--------------------------------------------------bu/A--------------------------------------------------
0 74 ‡
50 76
75 86
100 77 73 74 79 81 88
125 85 74 82 83 78 79 † Yields corrected to 15.5% moisture. ‡Means within the UAN column and rows are not significantly different (P=0.05).
Corn Yield: Texas Blacklands, 2010

Cotton Yields
Need a picture of a cotton field
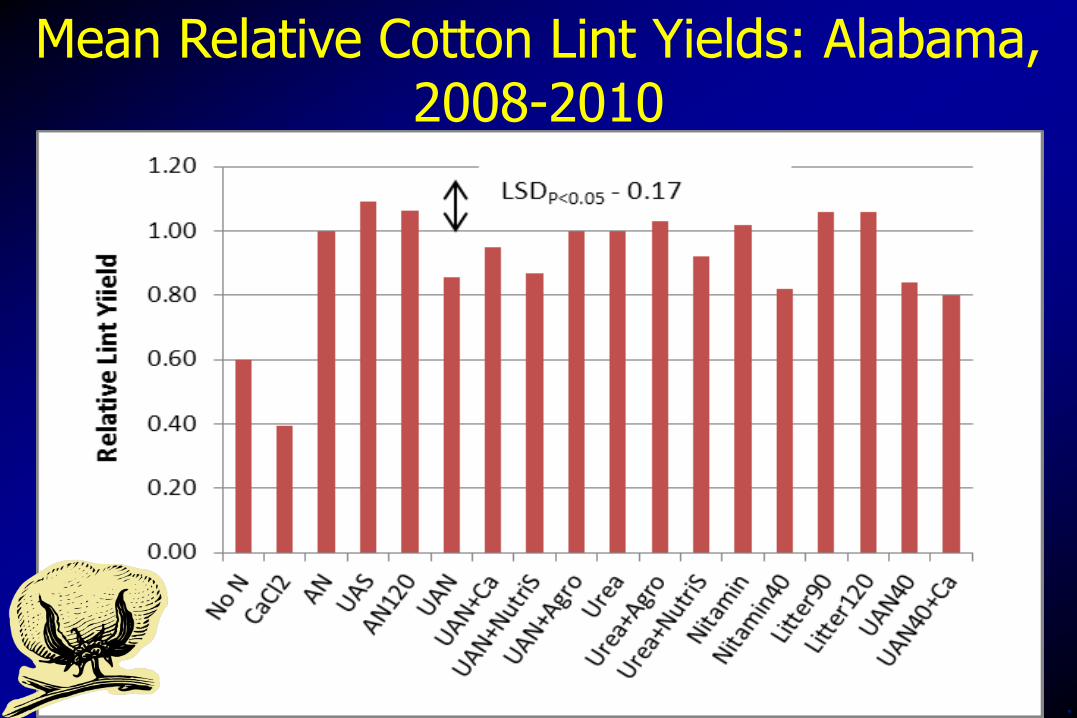
Mean Relative Cotton Lint Yields: Alabama, 2008-2010

Seed Cotton Yield Response: Arkansas 2010
500
1,000
1,500
2,000
2,500
0 30 60 90 120 150 Seed
-co
tto
n y
ield
(lb
/acre
)
Total N Rate (lb/acre)
Control
500
800
1,100
1,400
1,700
2,000
Seedcotton y
ield
(lb
/acre
) ESN
Urea
*

Cotton Yields: New Mexico
UAN, Urea,
and Agrotain
with Urea
performed the
same under
irrigated
conditions,
except the 1X
Agrotain Urea.

Lint Yield†
Nitrogen
Rate
(lbs/A)
UAN
UAN +
Nutrisphere
(0.5 % v/v)
UAN +
Agrotain Ultra
(0.2% v/v)
UAN +
N-Sure
(50/50)
UAN +
CoRoN
(50/50)
UAN +
NDemand
(50/50)
---------------------------------------------lbs/A----------------------------------------------
0 1075 ‡
40 1053
60 971
80 1057 984 926 937 961 974
100 1040 937 1073 1020 1010 1064 † Yield based on five replications. ‡Means within the UAN (only) column and rows are not significantly different (P=0.05).
Cotton Yields: Texas Blacklands, 2010

Cotton Lint Yield: Texas
Brazos River Valley, 2007
0
100
200
300
400
500
600
700
800
900
Untreated
CoRoN 128 oz/A (2X)
CoRoN 128 oz/A (3X)
Lin
t yie
ld,
lbs./acre
P>F = 0.8099
CV% = 5.2
Mean = 846 lbs/acre
(2X) – CoRoN applied @ 1st bloom
14 days later
(3X) - CoRoN applied @ 1st bloom
14 days later
14 days later
All treatments (including untreated)
received recommended soil fertility
based on soil test.
CoRoN UNT
2x 3x

Cotton Lint Yield: Texas
Lamesa AGCARES, 2007
0
250
500
750
1000
1250
1500
1750
Untreated
CoRoN 128 oz/A (2X)
CoRoN 128 oz/A (3X)
Lin
t yie
ld,
lbs./acre
P>F = 0.5366
CV% = 4.6
Mean = 1579 lbs/acre
(2X) – CoRoN applied @ 1st bloom
14 days later
(3X) - CoRoN applied @ 1st bloom
14 days later
14 days later
All treatments (including untreated)
received recommended soil fertility
based on soil test.
CoRoN UNT 3x 2x

Cotton Lint Yield: Texas
St Lawrence, 2007
0
200
400
600
800
1000
1200
1400
1600
Untreated
CoRoN 128 oz/A (2X)
CoRoN 128 oz/A (3X)
Lin
t yie
ld,
lbs./
acre
P>F = 0.6333
CV% = 3.8
Mean = 1549 lbs/acre
(2X) – CoRoN applied @ 1st bloom
14 days later
(3X) - CoRoN applied @ 1st bloom
14 days later
14 days later
All treatments (including untreated)
received recommended soil fertility
based on soil test.
CoRoN UNT
2x 3x

Cotton Lint Yield: Texas Blacklands, 2007
0
200
400
600
800
1000
1200
1400L
int
Yie
ld (
lb/A
)
Check UAN
100
Treatment
b
a a a a a a
Nfusion
30:70
Nfusion
20:80
LSD = 105
125 100 125 100 125 0
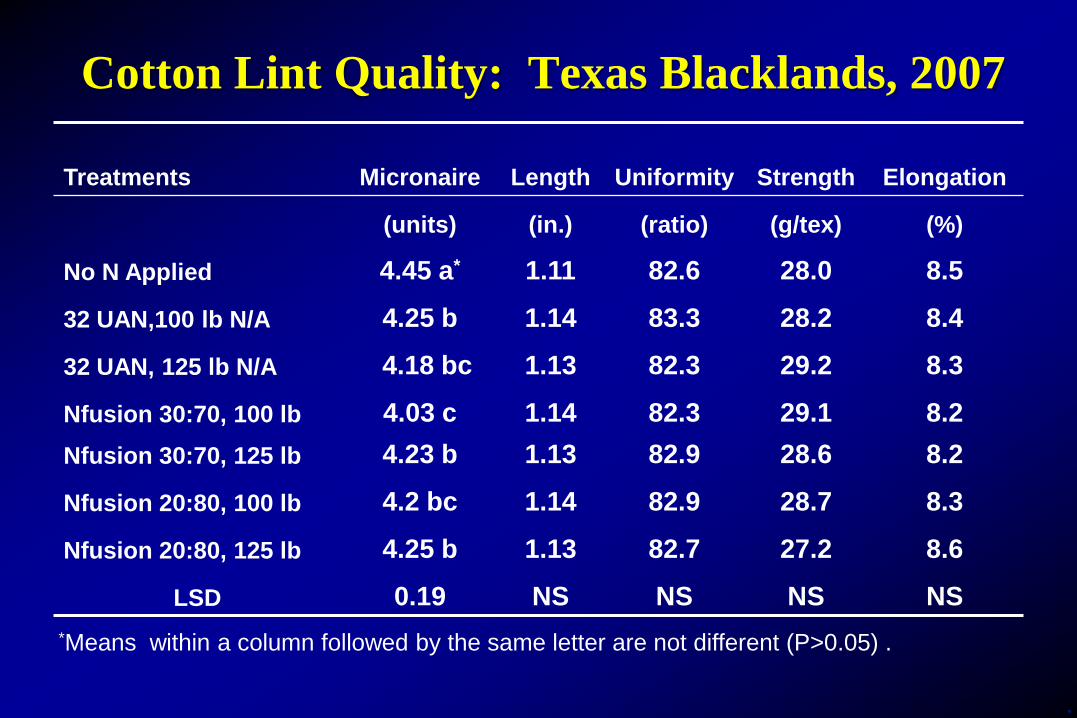
Cotton Lint Quality: Texas Blacklands, 2007
Treatments Micronaire Length Uniformity Strength
Elongation
(units) (in.) (ratio) (g/tex) (%)
No N Applied 4.45 a* 1.11 82.6 28.0 8.5
32 UAN,100 lb N/A 4.25 b 1.14 83.3 28.2 8.4
32 UAN, 125 lb N/A 4.18 bc 1.13 82.3 29.2 8.3
Nfusion 30:70, 100 lb 4.03 c 1.14 82.3 29.1 8.2
Nfusion 30:70, 125 lb 4.23 b 1.13 82.9 28.6 8.2
Nfusion 20:80, 100 lb 4.2 bc 1.14 82.9 28.7 8.3
Nfusion 20:80, 125 lb 4.25 b 1.13 82.7 27.2 8.6
LSD 0.19 NS NS NS NS
*Means within a column followed by the same letter are not different (P>0.05) .

Grain Sorghum Yields

Grain Sorghum Yields: Texas Blacklands, 2011
Grain Yield†
Nitrogen
Rate
(lbs/A)
UAN
UAN +
Agrotain Ultra
(0.2% v/v)
Urea
(granular)
Super U
(granular)
ESN
(granular)
-------------------------------------------lbs/A-------------------------------------------
0 4442 b‡
30 4499 b 4335 4473 4328 4541
60 4965 ab 4802 4841 4715 4523
90 5301 a
120 5565 a † Yields corrected to 15.5% moisture. ‡Means within the UAN (only) column followed by the same letter are not significantly different (P=0.05).

Take Home Message
There were few differences due to
Nitrogen Fertilizer Sources
for any of the soils, crops, or climates in the Southeast!
• Nutrisphere, Nitamin and Agrotain did not produce better
yields at any location for any crop where tested.
• ESN performed better than urea on corn and cotton in
Arkansas.
• ESN performed similarly or worse to UAN or urea in
Alabama (corn), North Carolina (corn and wheat), and
Oklahoma (wheat).

Authors
• Brian Arnall, Oklahoma State University
• Robert Flynn, New Mexico State University
• Mark McFarland, Texas A&M
• Charles Mitchell, Auburn University
• Morteza Mozaffari, University of Arkansas
• Deanna Osmond, NC State University

Publications
• Cahill, S., D. Osmond, C. Crozier, D. Israel, and R. Weisz. 2007.
Winter wheat and maize response to urea ammonium nitrate and a
new urea formaldehyde polymer fertilizer. Agron J. 99:1645-1653
• Cahill, S., D. Osmond, R. Weisz, And R. Heiniger. 2010.
Evaluation of alternative nitrogen fertilizers for corn and winter
wheat production. Agron J. 102:1226-1236.

Funding
We are indebted to multiple funding sources
• All projects: USDA NIFA Southern Region Water Program
• AL: Alabama Wheat & Feed Grain Committee, Alabama Cotton
Commission
• AR: University of Arkansas Division of Agriculture, Agrium
Advanced Technologies
• NM: Agrotain International for product and New Mexico
Agricultural Experiment Station
• NC: USEPA 319 through NCDENR, Agrium, Corn Growers
Association of NC, Georgia Pacific, NC Cooperative Extension,
NC Small Grain Growers Association, Southern States, and Yara
• TX: United Sorghum Checkoff Program, Georgia Pacific