alkyl ketene dimer and precipitated calcium carbonate...
TRANSCRIPT

Alkyl ketene dimer and precipitated calcium carbonate interactions in wet-end papermaking
by
Agatha Poraj-Kozminski
Department of Chemical Engineering McGill University, Montreal
March 2006
A thesis submitted to McGiII University in partial fulfillment of the
requirements of the degree of Master of Engineering
©Agatha Poraj-Kozminski
2006

1+1 Library and Archives Canada
Bibliothèque et Archives Canada
Published Heritage Branch
Direction du Patrimoine de l'édition
395 Wellington Street Ottawa ON K1A ON4 Canada
395, rue Wellington Ottawa ON K1A ON4 Canada
NOTICE: The author has granted a nonexclusive license allowing Library and Archives Canada to reproduce, publish, archive, preserve, conserve, communicate to the public by telecommunication or on the Internet, loan, distribute and sell th es es worldwide, for commercial or noncommercial purposes, in microform, paper, electronic and/or any other formats.
The author retains copyright ownership and moral rights in this thesis. Neither the thesis nor substantial extracts from it may be printed or otherwise reproduced without the author's permission.
ln compliance with the Canadian Privacy Act some supporting forms may have been removed from this thesis.
While these forms may be included in the document page count, their removal does not represent any loss of content from the thesis.
• •• Canada
AVIS:
Your file Votre référence ISBN: 978-0-494-25006-8 Our file Notre référence ISBN: 978-0-494-25006-8
L'auteur a accordé une licence non exclusive permettant à la Bibliothèque et Archives Canada de reproduire, publier, archiver, sauvegarder, conserver, transmettre au public par télécommunication ou par l'Internet, prêter, distribuer et vendre des thèses partout dans le monde, à des fins commerciales ou autres, sur support microforme, papier, électronique et/ou autres formats.
L'auteur conserve la propriété du droit d'auteur et des droits moraux qui protège cette thèse. Ni la thèse ni des extraits substantiels de celle-ci ne doivent être imprimés ou autrement reproduits sans son autorisation.
Conformément à la loi canadienne sur la protection de la vie privée, quelques formulaires secondaires ont été enlevés de cette thèse.
Bien que ces formulaires aient inclus dans la pagination, il n'y aura aucun contenu manquant.

f/-'"
~ ..
ABSTRACT
This thesis investigates the interactions between alkyl ketene dimer (AKD)
and precipitated calcium carbonate (PCC). Although the mechanisms behind AKD
sizing and reactions with cellulose have been studied in-depth, methods describing
AKD retenti on are poorly understood. The aim of this research was to determine the
conditions and time-scale under which AKD and PCC heteroflocculate, and to
determine the influence of PCC on non-retained AKD. We also wanted to understand
the mechanisms behind AKD interactions with cP AM, and perform experiments on
the twin-wire sheet former. We outline a procedure for creating an AKD emulsion
coated by cationic starch and free of extraneous substances. We find that AKD and
PCC each homoflocculate, but no heteroflocculation occurs between the two
chemicals. This suggests that PCC and AKD do not directly interact. Instead, starch
removal from the AKD partic1e surface aids the homoflocculation of PCC (via
polymer bridging). This indicates that the alkaline environment is the most significant
factor contributing to AKD hydrolysis. More importantly, we find that AKD and PCC
are not likely to interact in the whitewater cycle. This refutes the general idea that
PCC lowers AKD retention. Adsorption kinetic experiments revealed that although
cationic AKD and cP AM do not flocculate, cP AM does increase the retention of
AKD by assisting its deposition onto fibers. Asymmetrical polymer bridging explains
both the increase in AKD retention and the behavior of AKD flocculation kinetics
with cP AM. Although the initial kinetics are nearly independent of cP AM dosage,
excess cP AM delays the achievement of maximum possible AKD retention due to
starch and cP AM re-conformation. Lastly, it was found that the addition of cP AM
results in an increase in the bond strength between AKD and fibers, thereby
eliminating AKD detachment. Studies on the twin-wire sheet former found that
cP AM increases the first-pass retenti on of AKD three-fold. The twin-wire former was
proven to be a useful tool for studying AKD retention.
ii
RESUMÉ
Le sujet de cette thèse porte sur l'étude des interactions entre le dimère de
cétène alkylé (AKD) et le carbonate de calcium précipité (PCC). Bien que les
mécanismes de l'encollage à l'AKD et de sa réaction avec la cellulose aient été
étudiés en profondeur, ceux qui gouvernent la rétention de l'AKD sont encore mal
définis. Nos recherches visaient à déterminer les conditions et l'échelle de temps sous
lesquelles l' AKD et le PCC hétéro-floculent et à déterminer l'effet du PCC sur
l'AKD non retenu. Nous voulions aussi comprendre les mécanismes de l'interaction
de l'AKD avec le polyacrylamide cationique (cP AM) et réaliser des expériences sur
la machine à p_apier à double toile. Nous décrivons un procédé pour créer une
émulsion d'AKD englobé par de l'amidon cationique sans aucune autre substance.
Nous avons observé que l'AKD et le PCC homo-floculent, mais qu'il n'y a pas
d'hétéro-floculation entre les deux produits. Ceci indique que le PCC et l'AKD
n'interagissent pas directement. Ce qui se produit plutôt est que l'amidon détaché de
la surface des particules d'AKD contribue à l'homo-floculation du PCC (par le biais
de ponts polymériques). Ceci indique qu'un environnement alcalin est le facteur
dominant qui contribue à l'hydrolyse de l'AKD. De plus grande importance est notre
découverte que l'AKD et le PCC sont peu enclin à interagir dans le cycle de l'eau
blanche. Ceci réfute la théorie que le PCC réduit la rétention de l'AKD. Des
expériences de cinétique d'adsorption ont révélé que même si l' AKD cationique et le
cP AM ne floculent pas, le cP AM augmente la rétention de l' AKD en contribuant à sa
déposition sur les fibres. La formation de ponts de polymères asymétriques explique à
la fois la hausse de la rétention de l' AKD et le comportement de la cinétique de
floculation de l'AKD avec le cPAM. Même si la cinétique initiale est indépendante
du dosage de cPAM, un excès de cPAM retarde l'atteinte du niveau maximal de
rétention à cause de la re-conformation de l'amidon et du cPAM. Enfin, nous avons
découvert que l'ajout de cPAM augmente la force des liens entre l'AKD et les fibres,
ce qui empêche le détachement de l'AKD. Nos expériences sur la machine à papier à
double toile démontrent que le cP AM multiplie par trois le niveau de rétention de
première passe de l'AKD. La machine à papier à double toile s'avère être un outil
utile pour l'étude de la rétention de l' AKD.
111

Acknowledgements
1 would like to thank Dr. Theo van de Ven and Dr. Reghan Hill for their continued
guidance and encouragement, and for their dedication to the project. They have made
me a better researcher, and 1 am etemally grateful to them for their support.
My sincere thanks to my colleagues at the Pulp and Paper Center, and particularly to
the members ofmy research group: Lojza, Marcius, Jimmy, Prasad, and Meng.
Many thanks to Louis Godbout, Dr. Alince, Dr. Petlicki, Lou Cusmich, Helen
Campbell and Ed Siliauskas, for their invaluable contributions to this project. A
special thanks to Christopher Hammock, creator of the laboratory twin-wire former.
My sincere gratitude to B. Sithole, J. Pimentel, and A. Gagne at Paprican, Pointe
Claire, for their help with AKD analysis.
And finally, thank you to my parents and friends, and to my husband Christopher, for
all your love and support, and without whom, none of this would have been possible.
IV

TABLE OF CONTENTS
Abstract
Resumé
Acknowledgements
Contents
List of Figures
List of Tables
Chapter 1: Introduction
1.1 Background
1.2 Objectives of the Thesis
1.3 Literature Review
1.3.1 Major Chemical Components
1.3.1.1 Alkyl ketene dimer (AKD)
1.3.1.2 Precipitated Calcium Carbonate (PCC)
1.3 .1.3 Retention Aids
1.3.1.4 Fibers
1.3.2 Retention Mechanisms
1.4 References
Chapter 2: AKD and PCC Interactions
2.1 Abstract
2.2 Introduction
v
ii
111
iv
v
ix
XlI
2
5
7
7
8
10
11
12
13
14
17
18

r--, 2.3 Emulsification of AKD Stabilized with Cationic Starch 19
2.3.1 Materials and Methods 20
2.4 Emulsion Analysis 21
2.4.1 Particle Size Analysis 21
2.4.2 Electrophoretic Mobility Analysis 23
2.4.3 Effect of Starch Concentration and Ratio 25
2.4.4 Comparison to Commercial Emulsion 27
2.5 Photometrie Dispersion Ana1yzer Experiments 27
2.5.1 Materials and Methods 28
2.5.2 PDA Parameters 30
2.5.3 Results and Discussion 32
2.5.3.1 PCC Homoflocculation 32
2.5.3.2 PCC and AKD F10cculation 32
2.5.3.3 PCC and Starch Flocculation 34
2.5.3.4 Effects of Starch filtration 36
2.6 Scanning Electron Microscopy Analysis 39
2.7 Conclusions 42
2.8 Acknowledgements 43
2.9 References 44
VI

Chapter 3: AKD Interactions with cP AM and Fibers
3.1 Abstract
3.2 Introduction
3.3 Materials and Methods
3.4 Materials
3.4.1 Methods: Photometric Dispersion Analyzer
3.4.2 Methods: Adsorption Kinetics
3.5 Results
3.5.1 AKD Flocculation
3.5.2 Cationic AKD Deposition on Fibers
3.5.3 Anionic AKD Deposition on Fibers
3.6 Conclusions
3.7 Acknowledgements
3.8 References
Chapter 4: Interactions of AKD and Other Papermaking Additives on a Laboratory Twin-wire Sheet Former Machine
4.1 Abstract
4.2 Introduction
4.3 Machine Description
4.4 Materials and Methods
4.5 Analysis of Results
4.6 Outline of Experiments
vu
47
48
50
50
51
52
53
53
54
60
62
62
64
66
67
67
72
74
75

4.6.1 Reproducibility Experiments 75
4.6.2 PCC Retention with Cationic Retention Aid 77
4.6.3 First-Pass Retention vs. Second-Pass Retention with AKD 78
4.6.4 AKD Retention at Various Additions 79
4.6.5 AKD Retention with cP AM 79
4.7 Conclusions 80
4.8 Acknowledgements 81
4.9 References 82
Chapter 5: Conclusions
5.1 Overview 84
5.2 Recommendations for Further Work 87
Appendix A. Principles of Flocculation 89
Appendix B. Starch Clustering and Effects of Shear and Sonication 93
Appendix C. Twin-Wire Sheet Former Machine (TWF) Instructions 96
V111

LIST OF FIGURES
CHAPTERI
Figure 1.1: Typical Approach System of a Paper Machine 3
Figure 1.2: AKD p-esterification with cellulose 8
Figure 1.3: Hydrolysis of AKD to palmitone 9
CHAPTERII
Figure 2.1: Partic1e-size distribution of AKD emulsion 22
Figure 2.2: SEM image of AKD emulsion at 1O,000X magnification 23
Figure 2.3: Theoretical and experimental values of AKD partic1e diameter 25
Figure 2.4: PDA arrangement with circulation and pump 29
Figure 2.5: RATIO of dispersed versus aggregated partic1es 30
Figure 2.6 a: Effect of varying flowrate on the floc formation in PDA for a stirring rate of 150 rpm 31
Figure 2.6 b: Effect ofvarying stirring speed in beaker on the floc formation in PDA for a flowrate of 150 mL/min. 32
Figure 2.7: PCC flocculation with AKD emulsion 34
Figure 2.8: PCC flocculation with sonicated starch (low starch additions) 35
Figure 2.9: PCC flocculation with sonicated starch (high starch additions) 35
Figure 2.10: Schematics of energy of interaction between two PCC partic1es: a) partially coated by starch- van der Waals and electrostatic attraction b) fully coated- van der Waals attractions and steric repu1sions 36
Figure 2.11: Successive filtration schematic of AKD drop lets and starch stabilizer 37
Figure 2.12: PCC flocculation with "AKD2" (AKD filtered twice) 39
Figure 2.13: SEM image of PCC partic1es 39
IX

Figure 2.14: SEM image of AKD emulsion 40
Figure 2.15(a,b,c): PCC and AKD at a 1:1 Ratio 41
Figure 2.16: SEM image of AKD emulsion after filtering away free starch; AKD drop lets aggregate 43
CHAPTERIII
Figure 3.1: Photograph of vials with various quantities ofcPAM; Amounts are given as mg cPAM/g anionic AKD. 53
Figure 3.2: AKD deposition onto fibers, at 10 mg AKD/g fiber addition, and varying cPAM addition. Inset: [mg cPAMlg fibers] 54
Figure 3.3: AKD deposition to fiber surface 55
Figure 3.4: AKD deposition on fibers a) low cPAM dosages; b) high cPAM dosages 56
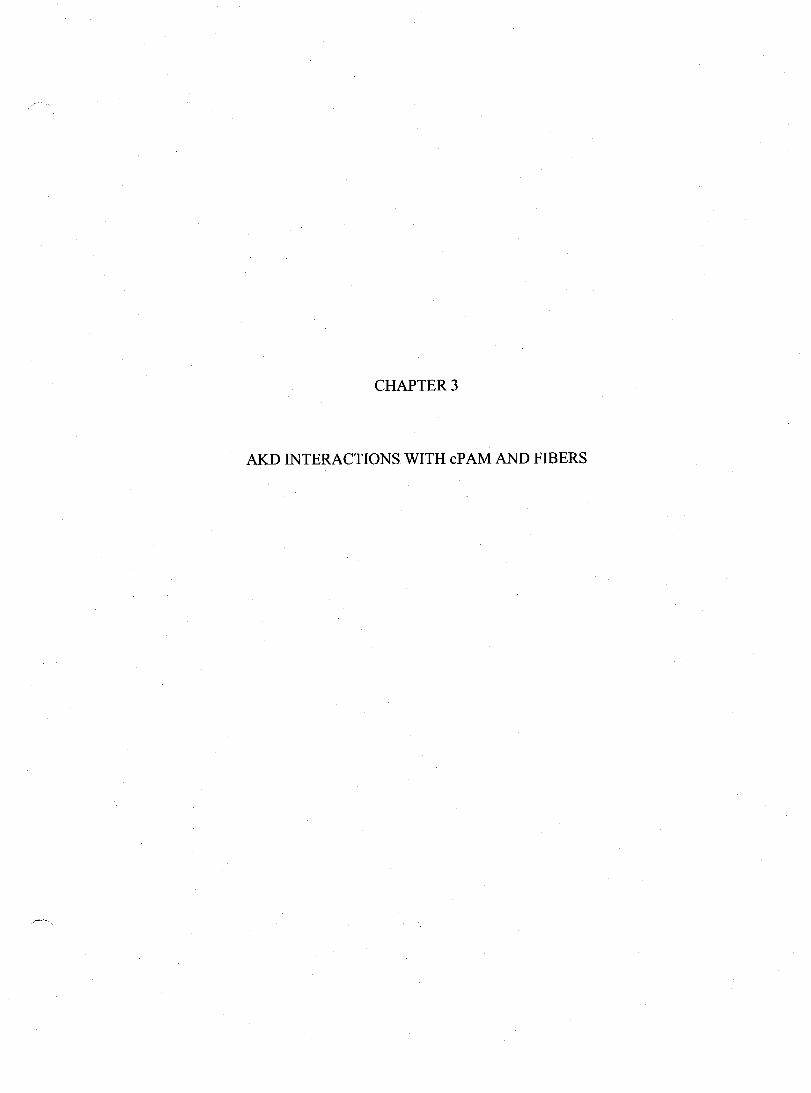
Figure 3.5: Asymmetric Polymer Bridging Mechanism 57
Figure 3.6: Increased Bond Strength by Starch Re-conformation a) Initial adsorption of starch to cP AM b) Spreading of starch 58
Figure 3.7: Adsorption Kinetics of Anionic AKD emulsion to fibers, in the presence of cP AM.. 61
CHAPTERIV
Figure 4.1: Laboratory Twin-Wire Sheet Former 68
Figure 4.2: Headbox Approach System of Twin-Wire Sheet Fomier 69
Figure 4.3: Drainage Section of Twin-Wire Sheet Former 69
Figure 4.4: Photograph ofTwin-Wire Sheet Former 71
Figure 4.5: Photograph of a paper sheet produced 71
x

Figure 4.6: Additive locations and residence times on the TWF 73
Figure 4.7: Water drainage along the TWF for three duplicate runs 76
Figure 4.8: Filler retention in the wet-web for three duplicate runs on the TWF 77
Figure 4.9: Influence of cP AM on PCC retenti on on the TWF 78
Figure 4.10: The effect of cP AM on AKD retenti on 80
Xl

LIST OF TABLES
Table 1.1: Typical Concentrations and Sizes of Papermaking Chemicals for the Production of Fine Papers 7
Table 2.1: Emulsion Characterization 21
Table 2.2: Electrophoretic Mobilities and Partic1e Diameters of AKD Emulsions 38
.~ ..
XlI

CHAPTER 1
INTRODUCTION

1.1 Background
Paper producers are continually searching for new and more effective ways to
utilize chemicals and reduce operating costs without compromising paper quality.
Since the operating speeds and manufacturing volumes of paper machines are
constantly increasing, the challenge to produce paper under such conditions is highly
reliant on additives. In the wet-end section of a paper machine, many chemicals are
needed to enhance the properties ofthe paper and to improve its quality. Among these
chemicals are sizing agents, which produce hydrophobicity in paper. To study the
behavior of alkyl ketene dimer (AKD), a common sizing agent, we examine its
chemical interactions in the forming section and short-circulation whitewater loop of
a paper machine. In this study, we focus on the processes and chemicals used to
manufacture fine office paper from kraft pulp fibers.
The papermaking chemicals studied here are added to the approach system of
the paper machine (Figure 1.1). The approach system consists of a fan-pump loop
where the di lute pulp suspension is metered, diluted, and additives are added. Flow
enters the machine chest and moves to the "stuff box", which regulates the feed by
ensuring a constant head. A valve before the fan pump controls the basis weight
entering the paper machine. Both the flow from the machine chest, and whitewater
retuming from the wire pit, enter the fan pump. The fan pump is the Iargest pump in
the paper machine system, and dictates much of the shear delivered onto the paper
machine. Next, the suspension is carried to the centrifugaI c1eaners and pressure
screens, before it flows into the pressurized headbox and onto the paper machine [1].
2

CENTRIFUGAL CLEANERS
MACHINE CHEST
PRESSURE SCREENS
STUFF BOX
WlRE HEAD BOX
WIREPIT
BASIS WEIGHT VALVE
Figure 1.1: Typical Approach System of a Paper Machine (adapted from Smook [1] )
Since paper mills are being urged to close their whitewater loops, more of the
dissolved and colloidal substances (DeS) or "anionic trash", such as fines and other
debris, are retuming to the headbox in the short-circulation whitewater loop. As a
result, the properties of the water being fed into the paper machine are altered due to
the elevated levels of electrolytes. This has a severe impact on the efficiency of other
chemicals added to enhance the quality and properties of the paper. Several studies
have shown that the behavior of additives is determined, in part, by the properties of
the water. Since much of this water input into the paper machine now cornes from the
whitewater, it is important to know how these extra substances affect the water
chemistry [2, 3].
3

Closure of the whitewater cycle releases less water effluent to the
environment, consequently reducing the costs associated with the treatment of such
effluent. However, reusing this water leads to problems within the paper machine,
such as corrosion of the machinery due to high salt concentrations [4]. Another reason
to close the whitewater system is to reduce the loss of fibers, which are valuable due
to the costs associated with processing them. The whitewater will always contain a
fraction of fibers, so the volume lost should be minimized. It has also been shown that
a build-up of electrolytes results in increased conductivity, anionic trash content,
sticky deposition, and cationic polymer demand, and has an adverse effect on paper
quality [5]. For example, a build-up of negatively charged DCS can degrade the
performance of cationic retention-aid systems [6].
The decrease in first-pass retenti on of sizing agents results in paper that is less
sized. This has led to an increased use of sizing agents and retention aids to offset the
effects of DCS. Though this may be a temporary remedy, the long-term solution
requires an understanding of how to increase the first-pass retention of these
chemicals to optimize their use. The addition sequence and residence times of
additives employed in paper mills have been selected from previous experience and
knowledge. However, comprehension of the chemical reactions remains crucial in a
complete understanding of optimization.
Single-pass retenti on may be one of the most important factors influencing
paper quality and paper machine operation [1]. Many chemicals become less effective
after recirculation in the whitewater cycle. In fact, it has been shown that in
subsequent passes through the paper machine, AKD contributes significantly less to
4

sizing than in the first pass. As mentioned later, the decrease in sizing is a direct result
of AKD reactions with water, which renders it non-reactive towards cellulose [7].
1.2 Objectives of the thesis
Since AKD has a low first-pass retention (~40%), a large portion of it enters
the whitewater cycle and has ample time to interact with many types of particles,
including dissolved and colloidal substances (DCS) and precipitated calcium
carbonate (PCC), a common filler. It is hypothesized that in the recirculation loop
AKD may reverse its charge by adsorbing anionic material. When passing through
the point of zero charge, AKD particles have the ability to aggregate with other AKD
particles. Other studies show that in the presence of water, AKD reacts to form a non
reactive ketone that does not contribute to sizing [8]. In addition, excessive usage of
AKD contaminates the whitewater system and may cause operating problems by
forming deposits in the machinery [9]. However, it has not been shown whether there
exist any significant interactions between AKD and PCC, nor has any of this work
been performed on a larger scale than in the laboratory. The experimental methods
employed by all previous researchers involved the dynamic drainage jar or other
small-scale methods.
Several theories exist to explain how AKD reacts with cellulose to form a
hydrophobie monolayer in the paper structure. Extensive literature exists examining if
a covalent bond with cellulose is necessary for sizing [8, 10-13]. However, few
outline the mechanism of AKD retention itself. This process occurs in the forming
section of papermaking and is critical to the subsequent AKD reaction with cellulose.
5

The objectives ofthis work are three-fold:
(1) To detennine the conditions and time-scale under which AKD and PCC will
heteroflocculate, and relate these findings to the behavior of AKD and PCC in
the whitewater cycle;
(2) To study the behavior of AKD under wet-end conditions; in particular, to
detennine the influence of PCC on non-retained AKD, and to understand the
mechanisms behind AKD's retention and its interactions with PCC and cationic
polyacrylamide (cP AM);
(3) To study retention of AKD on a laboratory twin'-wire sheet fonner to acquire a
more accurate interpretation of real interactions on a paper machine and to
detennine the differences in a first-pass versus second-pass retenti on value.
A discussion of these objectives comprises the contents of the three subsequent
chapters of this thesis. The remainder of this chapter presents a relevant literature
review. An overview of wet-end operations in a papennaking machine is discussed,
followed by a survey of AKD properties and interactions. In addition, PCC and
cP AM data are provided to help understand the wet-end system as a whole. Chapter 2
presents the interactions between AKD and PCC investigated on a small scale.
Chapter 3 covers the interactions of AKD with cationic polyacrylamide. Chapter 4
discusses the experiments perfonned on the laboratory twin-wire sheet fonner
machine. Finally, Chapter 5 concludes with a recapitulation of results and
recommendations for future work.
6

1.3 Literature Review
1.3.1 Major Chemical Components
In the wet-end section of a paper machine, many chemicals are added to
control properties and improve the quality of the paper. Table 1.1 provides a
summary of several chemicals used in the production of fine kraft paper, listed with
their typical concentrations and average sizes.
Table 1.1: Typical Concentrations and Sizes ofPapermaking Chemicals for the Production of Fine Pa ers
Component
Bleached Softwood Kraft (BSK) Pulp
starch
w/w% ofmass
0.5-1.0 **
0.03-1.00
Particle Diameter
30flm; (up to 3 mm length)
~80-100 nm '--'-'~'~'~"~'--'-"'--"~~~~~~-"~-"--~----I
5-10 <76flm
5-25 ~0.2-3 flm
0.05-0.2 ~0.2-2 flm
~0.03 ~100nm
* * wt. fibers/wt. water suspension
The aperture of the forming wire is typically 100 flm. Therefore, the material
that passes through this fabric and enters the whitewater loop is fillers, fines, AKD,
and retention aids. This is disadvantageous for the papermaking process, since by
entering the short circulation loop, the first-pass retention (FPR) of these materials
decreases. In the whitewater, they have time to interact with many substances that
may decrease their effectiveness. A discussion of the problems that may arise from
these reactions is found further in this chapter.
7

1.3.1.1 Alkyl ketene dimer (AKD)
AKD has been used as a sizing agent (to produce hydrophobicity in paper)
since the 1950's [14]. It is composed oftwo long carbohydrate chains, ranging from
14 to 18 carbon molecules each, and a lactone ring in the center. AKD binds to
cellulose fibers via a p-esterification reaction (Figure 1.2) [10]. This p-ester covalent
bond was found to be vital for effective sizing [8]. The two hydrophobic tails form a
hydrophobic layer on top of the sheet, retarding water penetration.
H 1
~-CH=H-Rz o-c
Il o
~ R -CH:z-c -CH-C-O
t Il Il o 0
Figure 1.2: AKD p-esterification with cellulose
AKD forms a stable colloidal emulsion in the presence of stabilizing
polymers, such as cationic starch. This gives the emulsion an overall positive charge,
enabling AKD particles to adsorb onto the negatively charged fibers. Often, another
polymer with the opposite charge is added to give the emulsion amphoteric
properties. AKD emulsions are stored with a dry solids content of 6-15%. AKD
particle sizes are in the range 0.2-2 microns, and addition levels are equivalent to
0.05-0.2% ofpure AKD based on fiber [14].
The emulsion is typically kept at low pH and cooler temperature (+3°C) to
prevent hydrolysis. Under these conditions, it can remain stable for several months.
As the pH increases, AKD begins to react with water (Figure 1.3). At a neutral pH,
AKD is hydrolyzed quickly (4%AKD/hr) and at a basic pH of 10.4, it is completely
8

hydrolyzed in less than a day [5]. AKD hydrolysis is affected by pH, as well as
temperature. Using NMR analysis, AKD was found to hydrolyze to its ketone form
(palmitone) in a short period. More importantly, it was found that this ketone does not
contribute to sizing, since its ketone bond makes it un-reactive [8]. This ketone has
also been found to cause deposition problems in paper machines [5].
Figure 1.3: Hydrolysis of AKD to palmitone
The acceleration in AKD hydrolysis can be attributed to CO{ and HC03-
ions. One the ory (not fully developed) states that PCC accelerates hydrolysis by
destabilizing the AKD. Other theories describe AKD spreading on the PCC surface,
or thirdly, sorne claim that the higher pH inside the PCC (due to Ca(OH)z ) catalyzes
the hydrolysis of AKD [5]. One study shows that AKD molecules adsorbed on
precipitated calcium carbonate (PCC) filler convert to palmitone [15]. According to a
second researcher, AKD adsorbs to filler due to its high surface area [9]. Another
states that it is the high affinity of AKD to filler responsible for AKD degradation [8].
Other tests indicate there is little or no interaction between the filler and AKD
particles at aIl [16]. With these contradictory results, it is difficult to draw any real
conclusions.
To counteract the negative effects, increasing the AKD/PCC ratio was found
to reduce the rate and extent of AKD hydrolysis. For this reason, it has become the
trend to increase the quantity of AKD in mill operations.
9

It is critical to maximize the first-pass retenti on of AKD in order to optimize
sizing. Intermediate reactions interfere with AKD depositing onto the fibers, in a
manner that reduces hydrophobicity. Solvent extraction tests indicate that sizing
occurs only when there is a covalent bond between the size molecule and cellulose
[8]. This link is necessary to ensure the proper alignment of the molecule so the
hydrophobic tails are exposed to the air interface [17]. Furthermore, it may be
possible that the bond serves as an anchor to prevent evaporation and detachment of
the molecule at higher temperatures. In general, AKD retention is a dynamic process
that involves attachment, detachment, and charge neutralization and reversaI [16].
1.3 .1.2 Precipitated Calcium Carbonate (PCC)
Precipitated calcium carbonate has become a popular filler since the change to
neutral or alkaline papermaking system was implemented. PCC is an example of a
mineraI filler that is added to the fumish to improve the optical and physical
properties of the sheet. The particles fill the spaces between the fibers, resulting in a
denser and smoother sheet. Since fillers are less expensive than fibers, they also
decrease the overall cost of paper manufacturing [1]. However, fillers weaken the
paper strength by interfering with fiber-fiber bonding and by transferring polymer
from fiber to filler surfaces [18]. Therefore, the amount of filler added to the sheet is
limited by the resulting reduction in strength and sizing quality. Most fine papers
contain anywhere between 5-25% wt filler/wt fibers.
Since PCC is soluble at lower pH, it can only be used in a neutral or alkaline
environment. CaC03 is partially soluble in water and the Ca2+ ions preferentially
10

adsorb to the crystal surface. In distilled water PCC carries a positive charge, but in
tap and mill water PCC has a negative charge due to the presence of impurities in the
water [19]. To improve retenti on by adsorption to the negatively charged fibers, a
cationic retenti on aid is added to promote PCC retention.
There are several explanations as to how PCC partic1es can be retained in the
sheet. First, PCC may deposit onto fibers by electrostatic attraction, or by charge
neutralization from polymer addition. Polymer bridging between PCC partic1es and
pulp fibers may also occur. Lastly, PCC partic1es may coagulate to form aggregates
that remain in the forming web via mechanical entrapment [20]. The maximum
amount adsorbed has been measured previously and is reported to be 250 mg PCC per
gram of fibers. This is the amount that produces a mono layer on the fiber surface,
based on a Im2 /g specific surface area offibers [21].
The surface charge of PCC is very dependent on PCC concentration, pH, and
impurities in the medium [19]. Upon addition of PCC to water (distilled or tap),
partic1es begin to aggregate, suggesting the system is unstable. These aggregates are
weak and can be broken up by shear, which under papermaking conditions, can reach
up to 104 S-1 [22]. The stability of PCC suspensions, as well as rates of flocculation,
can be measured by turbidity tests using the Photometric Dispersion Analyzer. More
on this testing procedure is presented in Chapter 2.
1.3.1.3 Retention Aids
The use of retention aids in a paper operation has many advantages. They act
to improve fines retenti on, increase drainage, improve filler retention, control
11

deposits and improve operations [6]. In the production of fine kraft paper using PCC,
cationic polyacrylamide (cP AM) is the most common retenti on aid. Cationic
polyacrylamide is an organic compound with a linear structure and a molecular
weight in the range of3-6xl06 Da.
Highly charged cationic polyelectrolytes promote deposition of PCC on fibers
by charge modification, while ones with a high molecular weight and low charge
density act by a bridging mechanism [23]. In this study, we use cPAM with a degree
of substitution of 20% and a high molecular weight, indicating a bridging polymer.
The addition of a retenti on aid has a dramatic effect on the retention of
precipitated calcium carbonate. Since both contaminated PCC 1 and fibers have a net
negative charge, they tend to repel each other. Cationic polyacrylamide imparts an
attraction (via bridging), thereby improving PCC retention. It is important to
determine the optimal quantity of cP AM to add since quantities that are too high
hinder sheet formation [6].
1.3.1.4 Fibers
Cellulose is negative1y charged. The negative charge originates from the
carboxyl groups that dissociate to various extents at different pHs. Under normal
papermaking conditions (~pH 7), the carboxyl and sulphonic acid groups are the
major contributors to the fiber charge [24].
A fraction (~1O-20%) of the fiber mass is comprised of fines. By definition,
these are the smaller segments of fibers whose diameters are less than 76 microns.
l "Contaminated" PCC refers to the particles in process or tap water whose charge has been influenced by impurities in the water.
12

Fines have a higher specific surface area (~10 m2jg) [25] than fibers (1 m2jg), which
gives them the capacity to adsorb much more material per unit surface area. Because
they are smaller than the fabric aperture, fines commonly drain through without being
retained in the sheet, taking sorne of the additives with them.
1.3.2 Retention Mechanisms
AKD retenti on can be improved by either physical or chemical methods. For
example, Mattsson [26] suggests that AKD retention can be improved physically by
adding a chemical to induce AKD molecules to aggregate prior to addition into the
approach system. This method of "preflocculation" produces aggregates that can
grow to a size up to 30 microns in diameter. In such a way, the AKD flocs are
retained in the sheet since they are less likely to pass through the wire. Tests
demonstrated that on a laboratory scale (employing the Britt Dynamic Drainage Jar),
AKD molecules that formed aggregates had a significant improvement in single-pass
retention. However, the question arose whether these aggregates would not cause an
uneven distribution in sizing on the paper sheet [26].
Instead, we consider the chemical interactions that occur between the
additives and fibers that allow us to optimize the retention. By understandingthe
interactions that occur, we can predict the effects of changing the parameters. The
intent of this study is to find the fundamental mechanisms responsible for the
interactions.
13
1.4 References
[1] Smook, G.A., "Handbook for Pulp & Paper Technologists", Angus Wilde Publications, Vancouver, 2nd Ed., (1992).
[2] Donat, V., van de Ven, T.G.M. and Paris, J., "Distribution of dissolved and colloidal substances in the forming and press sections of a paper machine", Journal of Pulp and Paper Science, 29(9) 294-298 (2003).
[3] Huber, P., Carre, B., Mauret, E. and Roux, J.-C., "The influence of fine elements build-up in the short-circulation on fibre flocculation." Preprints -International Paper and Coating Chemistry Symposium, 5th, Montreal, QC, Canada, (2003).
[4] Gavelin, G., "Paper Machine Design and Operation", Angus Wilde Publications, Vancouver, (1998).
[5] Jiang, H. and Deng, Y., "The effects ofinorganic salts and precipitated calcium carbonate filler on the hydrolysis kinetics of alkyl ketene dimer", Journal ofPulp and Paper Science, 26(6) 208-213 (2000).
[6] Allen, L.H., Polverari, M., Levesque, B. and Francis, W., "Effects of system c10sure on retention- and drainage-aid performance in TMP newsprint manufacture", Tappi Journal, 188-195 (1999).
[7] Mattsson, R., Sterte, J. and Odberg, L."Colloidal Stability of AKD dispersions." in The Science ofPapermaking: Transactions of the 12th Fundamental Research Symposium Ed.Baker.Oxford, UK, (2001). 393-415.
[8] Bottorff, K.J., "AKD sizing mechanism: A more definitive description", Tappi Journal, 77(4) 105-16 (1994).
[9] Esser, A. and Ettl, R."On the mechanism ofsizing with alkyl ketene dimer (AKD): physico-chemical aspects of AKD retenti on and sizing efficiency." in Fundamentals ofPapermaking Materials, Transactions of the 11th Fundamental Research Symposium Cambridge, UK, (1997). 997-1020.
[10] Bottorff, K.J. and Sullivan, M.J., "New insights into the alkylketene dimer (AKD) sizing mechanism", Nordic Pulp & Paper Research Journal, 8(1) 86-95 (1993).
[11] Isogai, A., "Effect of cationic polymer addition on retenti on of alkylketene dimer", Journal ofPulp and Paper Science, 23(6) 276-281 (1997).
[12] Isogai, A., "Stability of AKD-Cellulose B-Ketoester Bonds to Various Treatments", Journal of Pulp and Paper Science, 26(9) 330-334 (2000).
[13] Lindstrom, T. and Soderberg, G., "On the mechanism ofsizing with alkylketene dimers, part 1. Studies on the amount of alkyl-ketene dimer required forsizing different pulps", Nordic Pulp and Paper Research Journal, 1(1) 26-33 (1986).
[14] Roberts, J.C."Neutral and Alkaline Sizing" in Paper Chemistry Ed.Roberts, J.C. New York: Blackie Chapman & Hall, (1991).
[15] Scott, W.E., "Wet End Chemistry", Tappi Press, Atlanta, (1996). [16] Champ, S. and Ettl, R., "The dynamics of Alkyl Ketene Dimer (AKD)
retention." Preprints -5th International Paper and Coating Chemistry Symposium, Montreal, QC, Canada, 285-291 (2003).
14

[17] Yu, L. and Garnier, G., "The role ofvapour deposition during internaI sizing: a comparative study between ASA and AKD", Journal of Puip and Paper Science, 28(10) 327-331 (2002).
[18] Cho, B.-U., Garnier, G. and van de Ven, T.G.M., "Parameters affecting paper formation on a pilot fourdrinier using cP AMlbentonite retenti on aids", Preprints -5th International Paper and Coating Chemistry Symposium, Montreal, QC, Canada, 193-200 (2003).
[19] Vanerek, A., Alince, B. and Van De Ven, T.G.M., "Colloidal behavior of ground and precipitated calcium carbonate fillers: effects of cationic polyelectrolytes and water quality", Journal of Pulp and Paper Science, 26(4) 135-139 (2000).
[20] Mitsui, K., "Mechanism of Fines Retention and Drainage with a Polyacrilamide/Bentonite Retention Aid", thesis, Chemical Engineering, McGill University, (2000).
[21] Alince, B., "Time factor in pigment retention", Tappi Journal, 79(3) 291-294 (1996).
[22] Tarn Doo, P.A., Kerekes, R.J. and Pelton, R., "Estimates of Maximum Hydrodynamic Shear Stresses on Fibre Surfaces in Paper machine Wet End Flows and in Laboratory Drainage Testers", Journal of Pulp and Paper Science, 10(4) 80-88 (1984).
[23] Vanerek, A., Alince, B. and van De Ven, T.G.M., "Interaction of calcium carbonate fillers with pulp fibers: effect of surface charge and cationic polyelectrolytes", Journal of Puip and Paper Science, 26(9) 317-322 (2000).
[24] Lindstrom, T. "Electrokinetics of the Papermaking Industry" in Paper Chemistry Ed.Roberts, J.C.New York: Blackie Chapman & Hall, (1991).
[25] Porubska, J., "Microstructure and properties ofTMP papers", M.Eng. thesis, Chemical Engineering, Mc Gill University, (2000).
[26] Mattsson, R., Sterte, J. and Odberg, L., "Sizing with pre-flocculated alkyl ketene dimer (AKD) dispersions", Nordic Pulp & Paper Research Journal, 17(3) 240-245 (2002).
15

CHAPTER2
AKD AND PCC INTERACTIONS

2.1 Abstract
Experiments with AKD and PCC were performed on a laboratory scale using
the Photometrie Dispersion Analyzer (PDA). What was originally thought tobe
heteroflocculation between PCC and AKD was found to be PCC homoflocculation by
starch, the AKD stabilizer. SEM photographs show that PCC and AKD each
homoflocculate; little to no heteroflocculation occurs. With the results from PDA
tests, this suggests that PCC and AKD do not directly interact. Instead, starch removal
from the AKD particle surface aids the homoflocculation of PCC (via polymer
bridging). Moreover, this starch transfer results in AKD particle instability, causing
the AKD particles to aggregate since they have been depleted of their stabilizing
polymer. Therefore, it can also be concluded that cationic starch has a higher affinity
for PCC than for AKD.
More importantly, we find that AKD and PCC are not likely to interact in the
whitewater cycle. Since no heteroflocculation occurs, this dismisses the idea that PCC
wi1110wer AKD single-pass retention.
17

2.2 Introduction
Extensive work has been done to investigate AKD and PCC interactions in
wet-end papermaking, though there are few conclusive results. It is stated in several
papers that PCC causes AKD hydrolysis, leading to a great loss of sizing, and causing
size reversion after drying [1-3]. However, the mechanism for these interactions and
the conditions under which they occur is unknown. Furthermore, no research has been
done to determine whether PCC affects the first-pass/second-pass retenti on of AKD.
Recirculation of AKD in the whitewater cycle may be detrimental to its sizing
efficiency. In this chapter, we explore ifthis is a direct effect of PCC.
The chemical interactions that occur in the wet-end depend on the order in
which chemicals are added, as well as their residence time prior to the headbox.
Typically, PCC is added near the first mix box overflow, and AKD is added next in
the second mix box [4]. Thus, AKD is likely to interact with PCC and fibers. The
interactions depend on the state of flocculation and the state of the suspension; that is,
whether PCC has adsorbed to the fibers, or formed flocs with the polymeric retention
aid. Several theories suggest what will occur upon addition of AKD. Many articles
discuss the interactions between AKD and fibers, AKD and PCC or cP AM, or how
one affects the other, but none of this research has been done on a wet-end paper
machine environment or an industrial time scale [5-8]. In this chapter, we present
results from the small-scale trials conducted to investigate the behavior of PCC and
AKD in similar laboratory environments. In Chapter 4, trials with AKD and PCC are
performed on a larger-scale using the laboratory twin-wire sheet former.
18
2.3 Emulsification of AKD Stabilized with Cationic Starch
Most large-scale AKD emulsion preparations consist of additional
components, such as surfactants, polymers, stabilizers, alcohols, etc. However, details
of the commercial formulations are usually not disclosed. Therefore, the researcher
cannot know if interactions of an emulsion are due to AKD or other chemicals within
the emulsion. To solve this problem, we developed a method to create a simple but
stable AKD emulsion in our laboratory. The emulsion consisted of only AKD and a
stabilizer (cationic starch). To design our method for emulsification, we referenced
several other researchers who produced their own AKD emulsions and developed
methods to properly analyze its properties [9, 10].
As mentioned in the previous chapter, alkyl ketene dimer (AKD) is a waxy
ester with two fatty chains, typically ranging in length from 14 to 18 carbon
molecules joined by a lactone group. It is extremely hydrophobic and insoluble in
water. Upon addition to fibers, the AKD can react with cellulose to form a f3-ester
covalent bond. However, this is a slow reaction and sizing only begins in the drying
section of a paper machine, continuing throughout the drying and curing process for
about a week afterwards [11].
For AKD to remain in emulsion, a stabilizer must be added to prevent the
AKD drop lets from coalescing during emulsification. Since AKD has a melting point
of about 500 e (depending on chain length), the emulsification is done at a higher
temperature so that the AKD is in its molten phase. Immediately after emulsification,
the solution is quenched below room temperature for the AKD to revert to a more
stable solid.
19
2.3.1 Materials and Methods
Alkyl ketene dimer (from Raisio Roe Lee) was obtained in pellet form. A 10 g
sample was melted to 60°C in preparation for sonication. A cationic (quatemary
amine-substituted) starch CATO-237 was obtained from National Starch in a powder
form. According to the manufacturer, this chemical has a nitrogen content (%N) of
0.36-0.44. This value can be converted using the following formula (2.1), which
equates to a degree of substitution of 0.043-0.053%. The degree of substitution
indicates the percentage of amine groups on the starch with a positive charge. This
translates into the overall cationic charge.
%DS = 162x%N 1400 - (152x %N)
(2.1)
The starch was dispersed in de-ionized water to either 1%, 2% or 4% starch
concentration. It was cooked for 40 minutes in a 93 oC water bath, as suggested by the
manufacturer. This hot starch solution was added to a 100 mL beaker containing the
meltedAKD.
A sonicator from Vibracell (VCF-1500, Sonics & Materials, Inc) was used for
aIl emulsifications. This apparatus operates at a frequency of 20 kHz. The tip of the
sonicator, which is one inch in diameter, was inserted into the liquid. The sample was
sonicated for three cycles of three minutes each to ensure proper homogenization.
Following sonication, the solution was immediately quenched in a metal beaker
containing 100 mL of cold de-ionized water. Hydrochloric acid (lM) was added to
reduce the pH to approximately 4. Samples were kept refrigerated until further
testing. The composition of this emulsion is presented in Table 2.1, showing a
dispersion that has 53.4 mg AKD/mL solution.
20

Table 2.1 Emulsion Characterization
Com~onent Quantit~
AKD (g) 10
Starch solution (g) 1.5
Starch solution volume (ml) 75
De-ionized water (ml) 100
1M HCI (ml) 0.5
Total Volume (ml) 187.2
[AKD] (mg AKD/ml) 53.4
2.4 Emulsion Analysis
2.4.1 Particle Size Analysis
The Malvem Mastersizer2000 (Malvem Instruments, UK) was used to test the
AKD particle size as well as particle-size distribution. This technology relies on laser
diffraction, using the Mie theory to determine the particle-size distribution. Particles
are passed through a focused laser beam, which causes them to scatter light. The
intensity of this light is measured as a function of the scattering angle by multiple
photosensitive detectors. The refractive index of AKD was taken as 1.485 (a typical
value of a wax) in water with a refractive index of 1.33. Plots such as the one seen in
Figure 2.1 were obtained. The particle diameter ranges from approximately 0.2 /lm to
5 /lm. It is normal to expect a variation in particle sizes. For the precision required
here, the emulsion is relatively monodisperse. The calculated median value (by %
volume) ofthe samples was used as the average particle diameter.
21

12
,.-.. 10 ~ 0 ....... 8 al E
6 ::l '0 > 4
2
~.01 0.1 10 100 Partiele diameter (~m)
Figure 2.1: Particle-size distribution of AKD emulsion (Malvem Mastersizer)
Periodic testing revealed that the refrigerated emulsions were stable for at
least two weeks. After four weeks, the two phases (AKD and water) began to
separate. Since AKD has a lower density than water, it rises to the top, causing
creaming. This instability can be due to creaming by coalescence, aggregation, or
both 1 [9]. AKD stabilized with the highest DS% starch was found to be most stable.
The particle size was confirmed with the Acoustic & Electroacoustic
Spectrometer (Dispersion Technology, Inc., NY). This apparatus calculates the
particle size distribution by minimizing the deviation between the measured and
calculated acoustic attenuation spectra. This method also gave a slightly higher value
of 1.27±O.59 Ilm.
In addition to particle size analysis, photographs were taken by scannmg
electron microscopy (SEM). Samples were prepared by diluting the emulsion and
placing a drop on an SEM pin. When the drop let had dried, it was sputter coated with
1 Coalescence: fusion of individual particles into one greater particle Aggregation: coming together of individual particles to form a cluster, particles not evenly dispersed
22

a gold film. Pictures were taken at 5,OOOX and 1O,OOOX magnification. As seen in
Figure 2.2, these photographs reveal a homogeneous sampling of AKD drop lets that
are less than a micron in diameter. Although most partic1es are similar in size, several
outlying drops that have likely coalesced also appear. It is interesting to note that the
partic1es are not perfectly spherical. We can only presume that this is due to the SEM
coating process, when the sample is exposed to extreme vacuum conditions.
Figure 2.2: SEM image of AKD emulsion at 1O,OOOX magnification (scale = 1 J.lm)
2.4.2 Electrophoretic Mobility Analysis
Electrophoretic mobility (EM) is a measure of the partic1e charge. This
mobility value indicates the strength of electrostatic attractions (or repulsions) a
partic1e experiences with another charged partic1e in proximity. AlI tests were done in
both de-ionized (DI) and tap water. A di lute sample ofthe AKD emulsion was poured
into a flat cell equipped with an electrode at either end. A voltage was applied and the
velocity of partic1es at a specifie distance from the tube wall could be measured on a
magnified screen divided into grids. By knowing the time, t, for a partic1e to travel
23
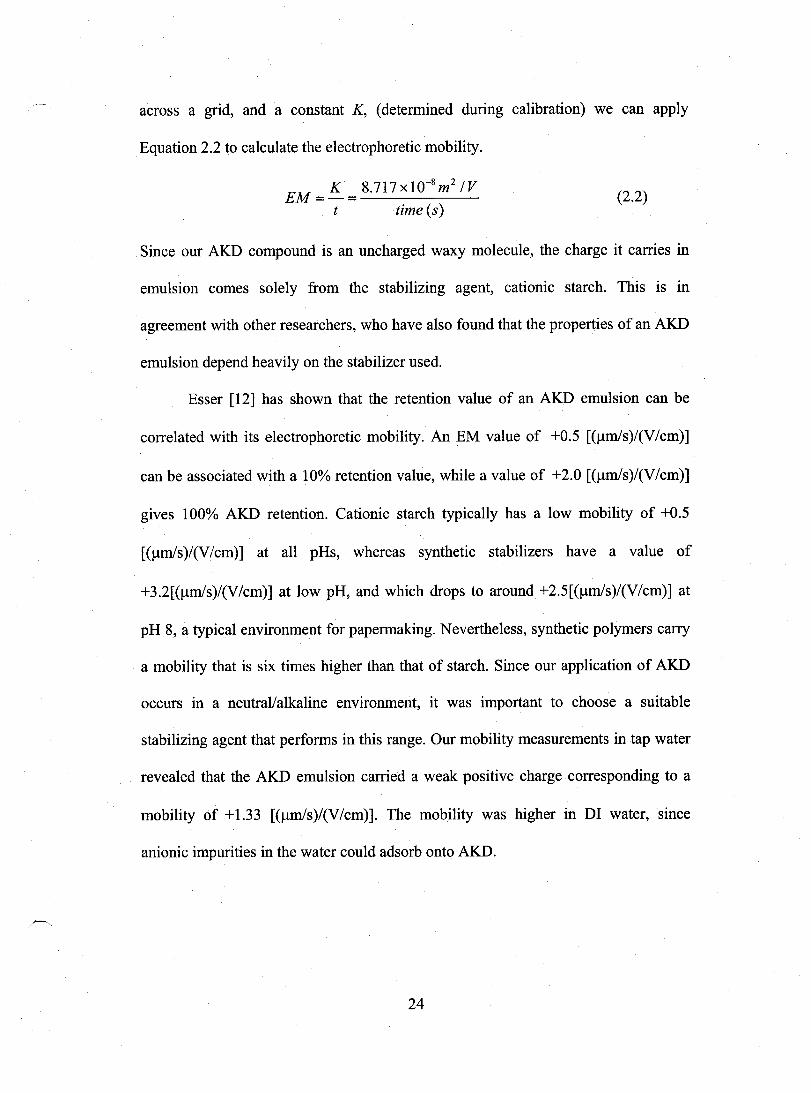
across a grid, and a constant K, (detennined during calibration) we can apply
Equation 2.2 to calculate the electrophoretic mobility.
EM = K = 8.717x10-Sm
2 IV
t time (s) (2.2)
Since our AKD compound is an uncharged waxy molecule, the charge it carries in
emulsion cornes solely from the stabilizing agent, cationic starch. This is in
agreement with other researchers, who have also found that the properties of an AKD
emulsion depend heavily on the stabilizer used.
Esser [12] has shown that the retention value of an AKD emulsion can be
correlated with its electrophoretic mobility. An EM value of +0.5 [(Jlm/s)/(V/cm)]
can be associated with a 10% retenti on value, while a value of +2.0 [(Jlm/s)/(V/cm)]
gives 100% AKD retention. Cationic starch typicaIly has a low mobility of +0.5
[(Jlm/s)/(V/cm)] at aIl pHs, whereas synthetic stabilizers have a value of
+3.2[(Jlm/s)/(V/cm)] at low pH, and which drops to around +2.5[(Jlm/s)/(V/cm)] at
pH 8, a typical environment for papennaking. Nevertheless, synthetic polymers carry
a mobility that is six times higher than that of starch. Since our application of AKD
occurs in a neutrallalkaline environment, it was important to choose a suitable
stabilizing agent that perfonns in this range. Our mobility measurements in tap water
revealed that the AKD emulsion carried a weak positive charge corresponding to a
mobility of +1.33 [(Jlm/s)/(V/cm)]. The mobility was higher in DI water, since
anionic impurities in the water could adsorb onto AKD.
24

2.4.3 Effect ofStarch Concentration and Ratio
Several variations of the emulsification procedure were tested. One variable
that was modified was the ratio between AKD and starch. From the literature, a
suggested range for this ratio is 0.1-0.3 (1 g AKD for each 0.1-0.3 g starch) [9].
Several trials were done with various ratios; it was found that 19 AKD: 0.15 g starch
consistently produced the same partic1e diameter, and therefore this ratio was used in
all subsequent emulsions.
Various starch concentrations were tried as well. Using starch cooked at a4%
concentration, the AKD particle sizes tend towards 2.3Jlm diameter. As the starch
concentration decreased, the partic1e size decreased as well. Using a 1% starch
solution, we obtained AKD droplets that were nearly identical to the theoretical
values (Figure 2.3).
4,------------------------------------,
•
•
• 0
• 4 % starch o 2 % starch .., 1 % starch
- Theoretical Value
•
oL-~==:===~~~~~--J - .., 0.05 0.10 0.15 0.20 0.25 0.30 0.35 0.40
C (Starch:AKO Ratio)
Figure 2.3: Theoretical and experimental values of AKD partic1e diameter
Theoretically, we can predict the smallest stable AKD partic1e size that can occur for
various ratios using the following formula, where C is the ratio, a is the radius of
25

AKD droplets, p is the density of AKD wax, and r max is the maximum surface
capacity of starch, which is taken from the literature as lOg/m2 [13].
(2.3)
Solving for a and converting to a diameter, we obtain the line shown in Figure 2.3. As
the starch concentration approaches 1 %, the experimental particle size approaches the
theoretical size.
It was determined that concentrated solutions of starch produced larger AKD
droplets. As the starch concentration was decreased, the AKD particles became
smaller after receiving the same sonication treatment. These size variations were
attributed to starch clustering. This topic has been covered in depth by several
researchers in the area of pulp and paper, including Shirazi [13, 14]. After sorne
experiments, we found that starch clustering is sensitive to sonication. At higher
starch concentrations, sonication is not able to disperse the starch completely;
however, it is much simpler with low concentration solutions. Thus, in the
emulsification with 4% starch solutions, the starch was not able to completely un-
cluster, so fewer starch clusters were available to coat the AKD droplets. To remain
stable, the AKD droplets remained larger to decrease their specific surface area. In
the 1 % starch solution, the starch was completely un-clustered, making each starch
molecule available for coating the AKD, thus producing smaller drop lets. A standard
radius of gyration for starch in literature is given as 108 nm [13]. With the di lute
solution, we come close to achieving this value (see Appendix B for a review of
starch clustering as a function of solution concentration and sonication). When our
26

results are represented graphically as in Figure 2.3, we can demonstrate that the AKD
drop lets are more dependent on the concentration of starch than the actual proportions
of AKD and starch.
In the end, we chose to use a 2% starch solution, and consistently obtained a
particle diameter of 0.8 microns. These emulsions were then further used for all
Photometrie Dispersion Analyzer experiments, adsorption kinetics, and experiments
on the laboratory twin-wire sheet former.
2.4.4 Camparisan ta Cammercial Emulsian
A sample of a commercial emulsion was also tested for particle size with the
Malvem Mastersizer. Under the same water and pH conditions, its average particle
size was 0.45 microns in diameter. However, its electrophoretic mobility was higher,
at +1.8 [Ü.un/s)/(V/cm)]. In comparison, our AKD emulsion had a slightly larger
diameter and a weaker charge, but the values were similar, and we concluded that the
emulsions were comparable.
2.5 Photometrie Dispersion Analyzer Experiments
To study AKD and PCC interactions in a wet-end environment, we began
observations at the laboratory scale, with experiments using the Photometrie
Dispersion Analyzer (PDA) (Rank Brothers Ltd., UK). In typical papermaking
operations, the proportions of PCC and AKD added are about 10-15% wt PCC/wt
fiber, and 0.15% wt AKD/wt fiber; thus the ratio of these two additives would be
approximately 10-15 mg AKD/ g PCC.
27

The Photometrie Dispersion Analyzer provides a sensitive (but qualitative)
indication of the changes in the state of aggregation of a suspension. A more in-depth
discussion of the princip les behind the PDA operation is given in Appendix B.
2.5.1 Methods and Materials
Precipitated calcium carbonate (PCC) Albacar HO (Specialty MineraIs Inc.)
was used in aIl experiments. This PCC has an average partic1e diameter of 1.3 ~m and
a high specifie surface area of ~12 m2/g, due to its scalenohedral structure. This
compound and its behavior with fibers and other chemicals has been fully
characterized elsewhere [15, 6, 16, 7, 8].
The AKD emulsion was created in our laboratory; its properties were outlined
at the beginning of this chapter. AIl experiments were performed in tap water with a
conductivity of280 ~S/cm, which resembles industrial waters [17, 18].
A 5g/100mL stock solution of precipitated calcium carbonate was prepared in
tap water. A portion was measured and added to a one-liter solution of tap water to
produce a 500ppm suspension of PCc. The concentration of PCC was held constant
between experiments, while the quantity of AKD varied. AKD was added 30 seconds
after the start of each experiment. Tubing of 3mm I.D. was used for aIl trials to
minimize the effect of shear and to allow a larger flowrate and floc size. Operating at
a higher shear rate may break up flocs and narrower tubing would give an incorrect
indication of flocculation rates. The suspension was circulated at 150 mL/min, and
stirred at 100 rpm in the beaker. Figure 2.4 shows a schematic ofthis setup.
28

Stirrer
Suspension
Figure 2.4: PDA arrangement with circulation and pump
Subtle differences exist for various flowrates and stirring speeds; the effects of
changing either of these settings are discussed further in this section. OveraU, aU
flocculation patterns were similar, so intermediate values were chosen for both the
stirring speed and the flowrate. Settings on the PDA apparatus were held constant at
RMS Gain: 0.0 and DC Gain: 6.80.
As the solution passes through the PDA light detector, the apparatus measures
several values, inc1uding the turbidity and distribution of partic1es in a 1 mm2 cross-
sectional area. Data was obtained as the RATIO of the RMS/DC signal over time. A
signal was recorded for 10 minutes.
RATIO = RMS De (2.4)
The RATIO signal is an indirect measure of the level of flocculation. The
root-mean-square of fluctuations is very low when there is no aggregation, and
increases with the size of the flocs (and decreases with the number of particles)
29

(Figure 2.5). Since the De signal also changes as aggregation occurs, the RATIO
value takes this into account.
Low RATIO
••• •• • • • • • • • • • ••• • • ••• Figure 2.5: RATIO for dispersed versus aggregated particles.
2.5.2 PDA Parameters
Prior to our flocculation experiments, we investigated the influence of stirring
speed and flowrate (in tubing) on PDA results. We explored the effect these
parameters had on the flocculation rate and final floc size. The stirring speed was
varied between 100, 150, 200 rpm, and the flowrate through the tubing was set to
150, 200, or 250 mL/min. Figure 2.6a shows the differences when varying the
flowrate, while Figure 2.6b presents flocculation with various stirring speeds. Since
all curves are for a value of 10 mg AKD/g PCC (at which we obtained optimal
flocculation), we are able to investigate the effect of shear alone. At an intermediate
flowrate of 150 mL/min, flocs form and remain stable. Above this value, flocs are
broken up by shear forces, as indicated by the decease in flocculation. Below this (not
shown), the floc rate is limited by the insufficient stirring and fewer collisions.
Likewise, at low stirring speeds, the rate of collisions and flocculation decreases, and
at high values, breakup occurs. In general, changing the stirring and flowrate
parameters shifts the dynamic equilibrium between flocculation and floc break-up.
30

We chose intennediate values for both; 100rpm and 150 mL/min flowrate.
This is equivalent to a relatively low shear rate of approximately 20 S-1 in the beaker.
Shear is greater in the tubing (650 S-I) due to the small tube diameter.
1.6 Flowrate: [mL/min]
1.4 150
1.2
....... ::::> 1.0
« -- 0.8 0
+=' co 0.6 ~
0.4
0.2
0.0 0 100 200 300 400 500 600 700
time (8)
Figure 2.6a: Effect ofvarying flowrate on the floc fonnation in PDA for a stirring rate of 150 rpm.
31

1.6
1.4
1.2
--::> 1.0
<C - 0.8 0 ;; CO 0.6 0::
100 rpm
0.4
0.2
0.0 0 100 200 300 400 500 600 700
time (8)
Figure 2.6b: Effect ofvarying stirring speed in beaker on the floc formation in PDA for a flowrate of 150 mL/min
2.5.3 Results & Discussion
2.5.3.1 PCC Homoflocculation
When the signal from PCC in the water was measured without AKD present, a
small increase in signal was detected. This accounts for the minimal flocculation that
occurs since positively-charged PCC acquires a negative charge in tap water.
Nevertheless, no significant flocculation occurs under these conditions. Figure 2.7
shows this trend as the curve labeled "0 mg".
2.5.3.2 PCC and AKD Flocculation
Tests performed with PCC and various additions of AKD emulsion showed
that there was a maximum in flocculation that occurred at 10 mg AKD/g PCC (Figure
2.7). (As stated earlier, this is in the range of typical addition levels in industrial
32

settings.) In all PDA figures, the left axis represents the RATIO of the root-mean
square/ DC signal, in arbitrary units (based on the gain settings of the PDA). This
value indicates the relative floc size. For larger flocs, there are less flocs for the same
number of particles initially, resulting in a larger RATIO value. Note that the
maximum ratio in these tests reaches 1.2. All additions of AKD are per gram of PCC.
Below 10 mg AKD/g PCC, flocculation was slower and reached a lower final
value. At higher AKD dosages, the initial slope was maximum, (the same as that for
10 mg/g PCC), but flocculation reaches a lower plateau. Tests were repeated to verify
that this behavior is reproducible.
Since PCC is white with a high refractive index, the PDA signal primarily
reflects the aggregation of PCC. That is, we have no real evidence that AKD and PCC
have heteroflocculated, but rather that PCC has been flocculated. This is particularly
interesting since we discovered later that the flocculation inferred by the PDA
consisted of only clusters of PCC and starch molecules. This was confirmed with
experiments testing the flocculation of PCC by cationic starch, and likewise, by AKD
free of starch.
The results shown below suggest that there exists an optimal AKD addition
dosage, at which half of the PCC is covered (by starch), allowing for maximum
flocculation. Beyond this, the PCC becomes over-coated, leading to a quick initial
flocculation, but the flocs cannot continue to grow since they are fully coated. Figure
2.7 shows this phenomenon with the 50 mg line. Although restabilization may be
expected in these conditions, van der Waals forces are able to form weak bonds
between fully-coated PCC particles, allowing them to homoflocculate.
33

-::> ~ 0
:;::: ca
c:::
1.4
1.2
1.0
0.8
0.6
0.4
0.2
....... ~ .... ~""'_~IW~ ........ ~ ......... ~ _ ....... __ .. ~ 0 mg
l..A"''-~
0.0 0 100 200 300 400 500 600 700
time (s)
Figure 2.7: PCC flocculation with AKD emulsion. Quantities indicated are AKD dosages [mg AKDI g PCC].
2.5.2.3 PCC and Starch Flocculation
Figures 2.8 and 2.9 demonstrate the PCC flocculation with the addition of
cationic starch. The starch was sonicated to un-c1uster starch molecules. At low
additions (less than lmg starchlg PCC), the flocculation is slow, and reaches a plateau
height relative to the amount of starch added. Above this optimum dosage, the initial
flocculation rate remains the same, but the flocs are not able to grow. This implies
that for PCC fully coated by starch, no energy barrier is present in the interaction
energy between two partic1es. Thus, cationic starch do es not cause steric or
electrostatic stability, and its adsorption does not eliminate aggregation of PCC, since
van der Waals forces are still present. However, the bond strength between fully-
coated PCC partic1es is weaker than that for partially coated partic1es, as indicated
schematically in Figure 2.10.
34

=> ~ o
:;:::; ct!
0:::
2.0 -r---------------------------,
1.5
1.0 0.25 mg
• ""Iane "'.e."" 0.5 r:cr 0.1 mg starch
0.0 U.lII~-_"T"'----,---.,__--_._--__,_---,__---;
o 100 200 300 400 500 600 700
time (s)
Figure 2.8: PCC flocculation with sonicated starch (low starch additions) Labels indicate [mg starch/g PCC].
2.0 -r---------------------------,
1.5
-::j <è -0
1.0 :;:::; ct!
0:::
0.5
30 mg, 50 mg
0.0 ..,'---_"T"'----,---.,__--_._--__,_---,__---; o 100 200 300 400 500 600 700
time (s)
Figure 2.9: PCC flocculation with sonicated starch (high starch additions) Labels indicate [mg starch/g PCC].
35

starch
a) Bridging by starch b) Aggregation by van der Waals forces
steric repulsion
Vint
distance
b) van der Waals attractions
a) van der Waals and electrostatic attractions
1
Fig. 2.10: Schematics of energy of interaction between two PCC partic1es: a) partially coated by starch- van der Waals and electrostatic attractions b) fully coated- van der Waals attractions and steric repulsions
2.5.2.4 Effects of Starch Filtration
Next, the AKD emulsion was filtered through a 0.45Jlm filter. AKD droplets,
approximately 0.8Jlm in diameter, were retained by the filter, then re-dispersed in the
same displaced volume of DI water, so the same concentrations remained. A mass
balance on the AKD and starch revealed that approximately half the starch was
adsorbed to the AKD drop lets whereas the remaining half was free in solution or
washed from the AKD partic1es during filtration. This filtration was repeated with the
36

filtered AKD solution "AKD1" to obtain "STARCH2" and "AKD2". A schematic of
the filtering is presented in Figure 2.11.
AKD
il l > 1
ni >~ o STARCH 2 ).!J LJ o STARCH 3 )
Figure 2.11: Successive filtration schematic of AKD droplets and starch stabilizer
PDA experiments were performed on both the filtrate and the AKD droplets. Results
with the filtered starch were identical to the ones obtained with sonicated starch in the
previous section. Experiments with the filtered AKD are described below.
Figure 2.12 shows that the AKD partic1es, now filtered and depleted of
cationic starch, hardly flocculate with PCC, even at high quantities such as 50 mg
AKD/g PCC. In other words, upon a second filtration of the AKD emulsion, only
minimal flocculation was observed, similar to the behavior of PCC alone.
The electrophoretic mobility of the filtered AKD was measured, and the value
was found to be lower than that of the original emulsion (Table 2.2). This is expected
since AKD itself carries no charge.
37

-::J ci
0.6.,...----------------------,
0.5 <D 0 ~ ?~~œt"OO
o ~~ 0 50 mg o~
oqr}) • ....
~W • • ~nl"IiIlaF."" 004
"-'" 0.3 o ~... . 20 mg cf) _~-8' 0.2 <D 0.,/
0.0 -f-l-''---,....---,----r-----,;------,----,.----I
o 100 200 300 400 500 600 700
time (s)
Figure 2.12: PCC flocculation with "AKD2" (AKD filtered twice to remove starch). Quantities indicate [mg AKD/g PCC].
It was conc1uded that the flocculation of PCC was due primarily to the free
starch in solution, and in part by starch transfer from AKD partic1es to PCC. A final
interesting point is that an optimum of 1 mg starch corresponds very c10sely with the
10 mg AKD emulsion optimum dosage we found earlier. Since the ratio of
AKD:starch is 1:0.15, these two values are similar. This suggests that it is truly the 1
mg of starch within a sample of 10 mg AKD that induces PCC flocculation.
Table 2.2 Electrophoretic Mobilities and Partic1e Diameters of AKD emulsions
AKDo AKD1 AKD2 AKD3
EM [(r.tm/s)/(V/cm)] +1.33 +1.21 +1.01 NIA
dAKD (/-lm) 0.826 0.834 0.838 0.849
38

..-..
It is concluded that the PCC flocculation occurs due to starch only, and that
AKD and PCC do not interact. Instead, the starch-coated AKD particles adsorb to the
PCC, and polymer transfer occurs, leading to flocculation. Starch transfer also
explains why flocculation by starch is on the same time-scale as that with AKD.
2.6 Scanning Electron Microscopy Analysis
To visualize the interactions between AKD and PCC, and to verify results
obtained by PDA, images were taken with the scanning electron microscope. AKD
and PCC were added in different amounts to determine their flocculation properties.
As before, samples were prepared by diluting the emulsion and depositing a drop onto
an SEM pin. When the droplet had dried, it was sputter coated with a gold film.
Photographs were taken at 5,OOOX and 10,OOOX magnification.
Figure 2.13 shows PCC particles as seen with the SEM. The photographs
clearly show the scalenohedral structure of the particles, as well as their relative size.
Figure 2.13: SEM image of PCC particles (scale = 1 micron)
39

Figure 2.14 below presents an AKD emulsion at 1O,000X magnification. We
can see the spherical AKD drop lets with diameters just under 1 micron. As mentioned
before, we must assume that the indentations and irregularities in their spherical
shape are due to the process of coating at an extremely low pressure.
Figure 2.14: SEM image of AKD emulsion (scale = 1 micron)
Next, we added AKD and PCC in various proportions on a pm. Using
standard additive quantities (lg PCC and 10mg AKD), AKD appears 100 times 1ess
frequently than PCC, and is not easily seen in the photographs. N everthe1ess, no
evidence of AKD-PCC heteroflocculation was observed at these addition levels
(optimal additions).
Figure 2.15 a,b and c show PCC and AKD at a 1:1 ratio. Although this is
higher than standard quantities for AKD, we do not see evidence of AKD-PCC
interactions. We observe homofloccu1ation of both AKD and PCC, though there were
no interactions between the two species.
40

a
b
c
Figure 2.15(a,b,c): PCC and AKD at a 1:1 ratio
41

Figure 2.16: SEM image of AKD emulsion after filtering out free starch; AKD drop lets aggregate.
In Figure 2.16, we show an AKD emulsion where the starch has been filtered away.
This photograph illustrates how the removal of starch results in the instability of the
individual AKD partic1es, causing them to aggregate.
2.7 Conclusions
In this chapter, we have outlined a procedure for creating an AKD emulsion
free from extraneous substances. Its properties were similar to those of a commercial
emulsion, and we proceeded to use it for further testing. U sing the Photometrie
Dispersion Analyzer, we found that the AKD emulsions flocculate with PCC at an
optimal dosage of 10mg AKD/g PCC. However, later we found that flocculation is
actually caused by the cationic starch acting as the AKD stabilizer.
No visual proof was found that AKD and PCC form flocs. The SEM
photographs show that PCC and AKD each homoflocculate; little to no
heteroflocculation occurs. This, in combination with the results obtained from the
42

PDA tests, suggests that PCC and AKD do not directly interact. Instead, starch
removal from the AKD particles aids the homoflocculation of PCC (via polymer
bridging). Starch transfer causes the AKD particles to aggregate since their stabilizing
polymer (starch) has been depleted. It can therefore be concluded that cationic starch
has a higher affinity for PCC than for AKD.
It is interesting to consider what these findings imply. Previously, it was
thought that PCC directly hydrolyzes AKD. Now, we see evidence that AKD and
PCC do not heteroflocculate, but that polymer transfer occurs from AKD to PCC,
followed by PCC homoflocculation. This indicates that the alkaline environment is
the most significant factor contributing to AKD hydrolysis. More importantly, we
find that AKD and PCC are not likely to interact in the whitewater cycle. This
dismisses the theory that PCC will lower AKD retention. PCC does decrease the
sizing of a sheet by increasing the specifie surface area and forming more pores.
However, this would not influence AKD single-pass retention.
2.8 Acknowledgements
Many thanks to Helen Campbell for assistance with the Scanning Electron
Microscope at McGill University and to Lou Cusmich for help with the electronic
data acquisition setup for the PDA. 1 would also like to thank Patrick Lim Soo for his
assistance with the Dynamic Light Scattering.
43

2.9 References
[1] Bottorff, K.J., "AKD sizing mechanism: A more definitive description", Tappi Journal, 77(4) 105-16 (1994).
[2] Bottorff, K.J. and Sullivan, M.J., "New insights into the alkylketene dimer (AKD) sizing mechanism", Nordic Pulp & Paper Research Journal, 8(1) 86-95 (1993).
[3] Scott, W.E., "Wet End Chemistry", Tappi Press, Atlanta, (1996). [4] Brungardt, C.L., "Studies indicate wet-end additive effects on AKD retention,
reaction efficiency", Pulp & Paper, 75(6) 47-49 (2001). [5] Isogai, A., "Effect of cationic polymer addition on retention of alkylketene
dimer", Journal ofPulp and Paper Science, 23(6) 276-281 (1997). [6] Kamiti, M. and Van de Ven, T.G.M., "Kinetics of deposition of calcium
carbonate particles onto pulp fibers", Journal ofPulp and Paper Science, 20(7) 199-205 (1994).
[7] Vanerek, A., Alince, B. and van De Ven, T.G.M., "Interaction of calcium carbonate fillers with pulp fibers: effect of surface charge and cationic polyelectrolytes", Journal of Pulp and Paper Science, 26(9) 317-322 (2000).
[8] Vanerek, A., Alince, B. and Van De Ven, T.G.M., "Colloidal behavior of ground and precipitated calcium carbonate fillers: effects of cationic polyelectrolytes and water quality", Journal of Pulp and Paper Science, 26(4) 135-139 (2000).
[9] Chew, Y.S., Peng, G., Roberts, J.C., Xiao, H., Nurmi, K. and Sundberg, K., "Characterization of the stability of cationic starch stabilised AKD emulsions", Preprints - 5th International Paper and Coating Chemistry Symposium, Montreal, QC, Canada, 331-337 (2003).
[10] Mohlin, K., Leijon, H. and Holmberg, K., "Spontaneous emulsification of alkyl ketene dimer", Journal of Dispersion Science and Technology, 22(6) 569-581 (2001).
[11] Roberts, J.C."Neutral and Alkaline Sizing" in Paper Chemistry Ed.Roberts, J.C. New York: Blackie Chapman & Hall, (1991).
[12] Esser, A. and Ettl, R."On the mechanism ofsizing with alkyl ketene dimer (AKD): physico-chemical aspects of AKD retenti on and sizing efficiency~" in Fundamentals of Papermaking Materials, Transactions of the Il th Fundamental Research Symposium Cambridge, UK, (1997). 997-1020.
[13] Shirazi, M., Van de Ven, T.G.M. and Garnier, G., "Adsorption of Modified Starches on Pulp Fibers", Langmuir, 19(26) 10835-10842 (2003).
[14] Shirazi, M., Van de Ven, T.G.M. and Garnier, G., "Adsorption of Modified Starches on Porous Glass", Langmuir, 19(26) 10829-10834 (2003).
[15] Cechova, M., Alince, B. and van de Ven, T .G.M., "Stability of ground and precipitated CaC03 suspensions in the presence of polyethylene oxide and kraft lignin", Colloids and Surfaces, A: Physicochemical and Engineering Aspects, 141(1) 153-160 (1998).
[16] Suty, S., Alince, B. and van de Ven, T.G.M., "Stability of Ground and Precipitated CaC03 Suspensions in the Presence of Polyethylenimine and Salt", Journal of Pulp and Paper Science, 22(9) 321-326 (1996).
44

[17] Donat, V., van de Ven, T.G.M. and Paris, J., "Distribution of dissolved and colloidal substances in the fonning and press sections of a paper machine", Journal of Pulp and Paper Science, 29(9) 294-298 (2003).
[18] Huber, P., Carre, B., Mauret, E. and Roux, J.-C., "The influence of fine elements build-up in the short-circulation on fibre flocculation." Preprints -International Paperand Coating Chemistry Symposium, 5th, Montreal, QC, Canada, (2003).
45
CHAPTER3
AKD INTERACTIONS WITH cP AM AND FIBERS

3.1 Abstract
Interactions of AKD with cP AM were examined using both anionic and
cationic AKD emulsions. PDA experiments showed that cationic polyacrylamide did
not induce flocculation of cationic AKD (stabilized by cationic starch). Conversely,
anionic AKD was found to flocculate by cP AM. Kinetic adsorption tests were
performed to determine the rate of AKD deposition onto fibers under shear
conditions.
We found that without addition of retention aid, 75% of cationic AKD
particles deposited onto fibers, with detachment beginning after a peak in deposition.
With the addition of cP AM, the retention increased to 100%. Although cP AM
molecules do not flocculate AKD on their own, cP AM adsorbed to fibers is capable
of adsorbing onto AKD by a mechanism known as asymmetric polymer bridging. We
propose that the AKD-cP AM -fiber bond is stronger than the one between starch
coated AKD and fibers, explaining the complete retenti on and absence of particle
detachment.
Anionic AKD emulsions have become common in industry. In testing the
adsorption kinetics with this emulsion, we found that the absence of a retenti on aid
resulted in very low AKD retention. Addition of cP AM rapidly increases the rate of
AKD deposition onto the fibers even at high dosages, where we would expect steric
repulsions to limit the deposition. This is likely a kinetic effect, since the AKD
deposition onto fibers is faster than the coating of AKD particles by cP AM.
47

3.2 Introduction
In further studying the retention mechanism of AKD, we investigated AKD
interactions with a cationic retenti on aid. It is not enough to consider only AKD and
fiber interactions, since in practice, retention aids also interact with these compounds.
In a paper mill, retention aids are added to improve fines retenti on, increase
drainage, control deposits, improve filler retention as well as to improve operations
[1]. To function properly, the retention polymer must adsorb onto the surfaces of the
fibers and the particles to be retained. The adsorption of cationic polymers onto
anionic surfaces, such as cellulose fibers and clay, occurs rapidly because there is no
barrier to adsorption. Polymers are usually added at a point close to the headbox to
minimize disruption of the flocs and to maximize retention. It is believed that upon
adsorption, the conformation of the adsorbed polymer facilitates the formation of
polymer bridges between surfaces, promoting the retention of fines [2]. Changes in
conformation of the polymer occur after adsorption, usually making bridging less
effective, although fuis mechanism is not well understood.
It is concluded by one researcher that the improvement of AKD retenti on is
not caused by direct adsorption of retenti on aids on AKD particles, but by AKD
adsorption on fines and fibers, leading to co-flocculation of fines, fibers and AKD
particles [3]. Another study states that retention is thought to be caused by
heterocoagulation of cationic AKD particles to negatively charged fiber surfaces,
where cationic polymers act as fixatives for AKD [3, 4]. Using cPAM, one study
showed that AKD deposition reached a maximum after 20 seconds, indicating that
AKD retention is a reversible process. This observation suggests that the subsequent
48

decrease in AKD deposition is due to particle detachment/charge reversaI, indicating
starch transfer. The results proved that AKD retention is optimized if the contact time
between AKD and fibres is short, and that of AKD-fibres and cationic polymers is
short as well [4]. The absence of re-attachment was explained by the deactivation of
the adsorbed polymer layer via re-conformation and/or degradation [5].
Although the surface charge of both AKD and cationic retention aids lS
positive, the retention aids have a significant influence on retenti on behavior [3].
Previous work conducted on the interactions between AKD and retention aids has
shown that the AKD surface charge has a profound effect on AKD retention on its
own, but as soon as a retenti on aid (cPAM) is added, it is a less significant factor [6].
Others agree that adding cationic polymer to AKD and fibers leads to a higher
retention, which increases sizing [7]. One suggestion to explain this behavior is that
the increase in AKD retenti on is due to an increase in fines retention, though this
point has not been fully explored. Another theory assumes that at a neutral pH, AKD
particles become amphoteric from the adsorption of anionic materiaI, and in this
manner a cationic retenti on aid is able to bridge the negatively charged areas [7].
Typically, AKD is stabilized by cationic starch, since the fibers are negatively
charged. This enables the AKD to deposit on the fibers by electrostatic attraction. On
the other hand, the use of cationic retenti on aids allows anionic AKD emulsions to be
used as well. In sorne paper mills, AKD is stabilized with anionic polymer, and
although the AKD and fibers naturally repel each other, the cationic retention aid
permits bridging between the two.
49

Anionic AKD emulsions are advantageous because they can be stored at a
50% solids content, whereas the cationic emulsions are not stable above 15 or 20%
solids content. This is most likely due to the selection of stabilizing chemicals in
either case. This drastically reduces the cost associated with transporting and storing
AKD at a mill. N evertheless, AKD and fibers are both negatively charged, so a
precise balance of polyelectrolytes/retention aids must be added to optimize
performance. Conversely, cationic AKD has good retention over a broader range of
retention-aid dosages. In this chapter, we discuss experiments performed with both
cationic and anionic emulsions.
Many researchers predict that cationic AKD emulsions will interact with
cP AM, owing to the amphoteric nature of stabilizing agents in the emulsion. In these
cases, cationic starch and lignosulfonic acid are commonly used as stabilizing
polymers [8]. However, the explanation of this mechanism is vague. Furthermore, it
would not apply in our case, since only cationic starch is used as a stabilizer.
3.3 Materials and Methods
3.3.1 Materials
F or trials with cationic AKD emulsions, we used the emulsions described in
Chapter 2. These AKD particles have a particle diameter of 0.8 f.lm, and an
electrophoretic mobility of + 1.33 [(f.lmls)/(V/cm)]. Anionic AKD emulsions were
produced using carboxymethylcellulose (CMC) as the anionic stabilizer. This
chemical (received from Aldrich Chemicals) has a molecular weight of 700,000 Da.
The same procedures were used for emulsification, using 0.15g CMC: 1 g AKD. The
50

anionic dispersions were monodisperse with an average diameter of 0.7 J.lm. AlI
emulsions were diluted to a 3g/L solution, to extract precise amounts for testing smalI
quantities. Tap water, with a pH of 6.4 and a conductivity of 280 J.lS/cm, was used in
all experiments.
We used Percol292 as the cationic polyacrylamide (CIBA, Inc.), which has a
degree of substitution of 20% and a molecular weight of 3xl06 Da. Several other
polyacrylamide polymers were tested, but since they all gave similar results, they are
not discussed here.
The fibers we used were bleached softwood kraft fibers (BSK) obtained from
Domtar. Fibers were dispersed and diluted to produce a 0.6% consistency pulp (the
same consistency used for the twin-wire sheet former).
3.3.2 Methods: Photometrie Dispersion Analyzer Tests (PDA)
PDA tests were carried out in a IL beaker with tap water, using the same
configuration as presented in Figure 2.4. One gram of AKD (in emulsion) was found
to produce enough turbidity such that accurate changes in flocculation could be
detected. The amount of cPAM added was between 0-10 g/g AKD. A typical amount
used in industry is 1 mg cPAM/g fiber (lg cPAM/g AKD). Stirring was constant at
100 rpm while the dispersion was circulated at a flow rate of 150 mL/min. Cationic
polyacrylamide was added 30 seconds after the start of each mn. Since the refractive
index of AKD is lower than that of PCC, the apparatus needed to be adjusted to make
it more sensitive. The RMS Gain was increased to 5.3 to c1early detect changes in the
state of flocculation. The RATIO output was monitored for ten minutes.
51

The PDA apparatus was used to investigate the behavior of AKD with cPAM.
Since both compounds are positively charged, we expected no interactions between
them, though it was necessary to verify. In addition, anionic AKD emulsions were
tested to compare how a negatively charged emulsion might behave.
3.3.3 Methods: Adsorption Kinetics
Additional experiments were performed to determine the kinetics of AKD
deposition on fibers in the presence of cPAM and under shear. A 0.6%wt fiber
suspension was added to 500 mL of tap water. This consistency was chosen because
it was the concentration used in the twin-wire sheet former experiments, and was held
constant since fiber concentration can have an effect on flocculation.
AKD was added to the fiber suspension being stirred. Fifteen seconds later, a
specified amount of cP AM was injected; this was designated as time zero. A 200-
mesh screen (74 !-lm openings) was used to extract a 2-mL sample free from fibers
and fines. Samples were obtained at 15s, 30s, Imin, 3 min, 5min, and every 5 minutes
thereafter. A UV-VIS Cary lE spectrophotometer (Varian, Inc.) was calibrated at
350nm; this wavelength was chosen for its good transmittance of AKD. A filtrate
from the fiber suspension prior to the addition of AKD was used in the reference cell.
After AKD addition to fiber suspension, we measured the absorbance of the filtrate,
from which we obtained the amount of AKD that was not retained, and then
calculated the amount of AKD that had deposited onto the fibers, as a function of
time and cP AM addition. A small experimental error occurred due to the slightly
negative readings obtained by the spectrophotometer at zero concentrations.
52

3.4 Results
3.4.1 AKD Flocculation
Since we expected an anionic AKD emulsion (a-AKD) to be flocculated by
cationic polyacrylamide, we tested this first. The flocculation that was detected with
the anionic emulsion was not detected with our original cationic emulsion and cP AM.
This confirmed our initial premise that cationic AKD and cP AM do not interact.
Figure 3.1 shows vials containing Ig anionic AKD and different quantities of
cP AM. With the addition of cPAM, it is not until the 50-mg/g-addition point that
destabilization occurs. At lower additions, such as those used in our experiments,
anionic-AKD and cP AM flocculate to a much lesser degree. Large flocs, as seen in
vial #7, only form at high quantities of cP AM.
Figure 3.1: Photograph of vials with Ig a-AKD and various quantities ofcPAM; Amounts (0-50) indicate [mg cPAMIg anionic AKD].
53

3.4.2 Cationic-AKD Deposition on Fibers
Kinetic adsorption tests were performed with the cationic AKD emulsion,
fibers, and retention aid. An chemicals were added in quantities that approximate
industrial papermaking conditions. AKD addition was held constant at 10 mg/g
fibers, while cPAM addition varied from 0-lOmg/g fibers. As shown in Figure 3.2
below, in the absence of cPAM, AKD retention reaches approximate1y 75%, and
begins to slowly decrease to about 60%. When cP AM is added, AKD retenti on
reaches 100% (lOmg AKD/g fibers).
10 .~;;"'-.'~-~~-:'::':::-~':J ~"'~.:.-. :-===~t== .... --.. .. ,/ ..................... /'/' .............•............•........
.... / /..-v /' 8 : /.' ./'
. -:l1li-../_. f -. J '-'III-.L. ~ /. -.-... -'-'l1li-.-E J/ : / '-.-tIII.-.- -111-.-.-
6 JJ. .1 / § If /' .r ~ Ï.~/ / ~ 4 J /. Cl Cl ~ «
2
[mg cPAM/g fiber5]
_. -l1li. _. control
-+- 0.05mglg ..... 0.1 mglg
- .... - 0.25 mglg -"-"1'-" 2 mglg --+- 4 mglg
- __ - 5mglg
O __ ----.-----.---~/~--~==~==~==~ o 200 400 600 900 1200 1500 1800
Time (5)
Figure 3.2: AKD deposition onto fibers, at 10 mg AKD/g fiber addition, and varying cP AM addition. Inset: [mg cP AMI g fibers]
At an concentrations of cP AM, the initial rate of flocculation is the same, as AKD
deposition reaches ~20% retention in the same time. At low cPAM concentrations
(below 0.25 mg/g) , the time to achieve maximum adsorption is short (about three
minutes), whereas at high cP AM concentrations, the time required for the AKD to
54

reach 100% is prolonged, by up to 10 minutes for dosages above 4 mg/go The four
main features of the figure above are described below.
1. Without cP AM, AKD deposition goes through a maximum
In the absence of a retention aid, cationic AKD partic1es are deposited on
negative fibers by heterocoagulation [8, 7]. The AKD partic1es, which are coated with
cationic starch, adsorb to fibers through a weak bond causing sorne AKD partic1es to
detach, leaving starch on the fibers (Figure 3.3).
( + )AKD coated with cationic starch adsarbs ta fibre surface
Balance between attachment and detachment
Figure 3.3: AKD deposition to fiber surface
After a maximum peak in AKD deposition, the AKD partic1es begin to detach.
The transfer of starch from AKD to fibers explains why the deposition decreases after
a certain time.
2. cP AM increases AKD deposition, despite the fact that cPAM does not adsorb on
AKD coated by cationic starch
In the presence of cP AM, starch-coated AKD partic1es can adsorb either to the
bare fiber or to the cP AM previously adsorbed to the fiber (Figure 3.4 a,b).
55

Ca) low [cPAM]
AKD( +) adsorbs to fibre surface
AKD detachment / AKD held more strongly by cPAM
Cb) high [cPAM]
cPAM adsorbs to fibre surface
AKD adsorbs to cPAM
Figure 3.4: AKD deposition on fibers a) at low cPAM dosages; b) at high cP AM dosages
It may seem contradictory that AKD deposits on a cP AM molecule adsorbed
to the fiber surface, especially since we found in the previous section that cationic
AKD particles and cP AM do not interact. However, this is possible by asymmetric
polymer bridging. The theory behind this phenomenon is presented below.
Heteroflocculation is not expected when a polymer is added to a mixture of
two types of particles and polymer adsorption occurs on only one type. A previous
study by van de Ven et al. proposed a mechanism of "asymmetric polymer bridging"
[9]. This theory states that heteroflocculation can occur even for systems in which the
polymer does not adsorb on one of the two flocculating species, provided that the
polymer upon adsorption on Particle 1 acquires the ability to adsorb on Particle 2
(Figure 3.5). We find that cPAM in free solution does not adsorb to AKD, but upon
adsorption to fibers, cPAM can adsorb onto AKD.
56
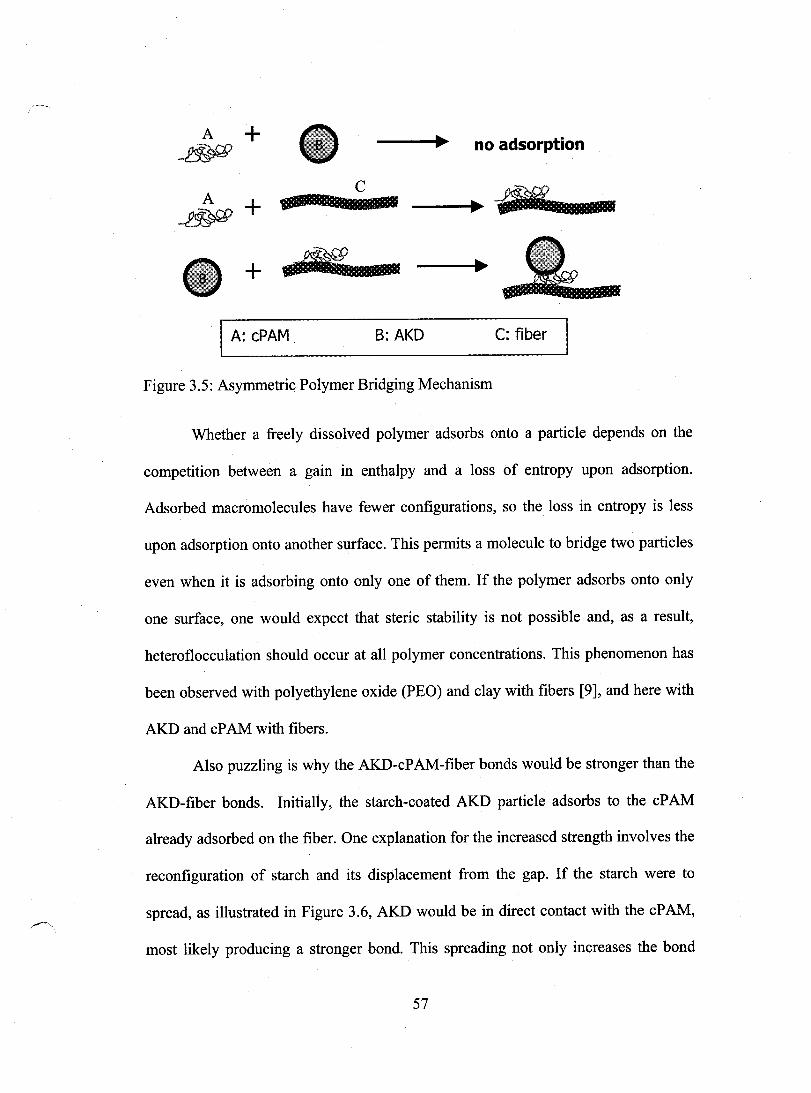
A + ~
c
no adsorption
A + ~
::-:-: ......... '.:-»;:::.:.: <. ~ :::::::.:. ---"'~~ __ sm
+
A: cPAM B:AKD C: fiber
Figure 3.5: Asymmetric Polymer Bridging Mechanism
Whether a freely dissolved polymer adsorbs onto a particle depends on the
competition between a gain in enthalpy and a loss of entropy upon adsorption.
Adsorbed macromolecules have fewer configurations, so the loss in entropy is less
upon adsorption onto another surface. This permits a mole cule to bridge two particles
even when it is adsorbing onto only one of them. If the polymer adsorbs onto only
one surface, one would expect that steric stability is not possible and, as a result,
heteroflocculation should occur at aH polymer concentrations. This phenomenon has
been observed with polyethylene oxide (PEO) and clay with fibers [9], and here with
AKD and cP AM with fibers.
Also puzzling is why the AKD-cPAM-fiber bonds would be stronger than the
AKD-fiber bonds. InitiaHy, the starch-coated AKD particle adsorbs to the cPAM
already adsorbed on the fiber. One explanation for the increased strength involves the
reconfiguration of starch and its displacement from the gap. If the starch were to
spread, as illustrated in Figure 3.6, AKD would be in direct contact with the cPAM,
most likely producing a stronger bond. This spreading not only increases the bond
57

strength, but secures the AKD partic1e so it is less likely to detach. In addition, AKD
is still able to quickly adsorb to fibers independently of cP AM. In solutions with low
cP AM concentrations, a combination of these weak and stronger bonds exists, as
shown in Figure 3.4a.
(a) (b)
+- starch
/ cPAM
fiber
Weak bond: cPAM has little Strong bond: cPAM is likely to have affinity for cationic starch stronger affinity for AKD than for starch
(Sorne starch rnay transfer to fiber)
Figure 3.6: Increased Bond Strength by Starch Re-conformation ( a) Initial adsorption of starch to cP AM (b) Spreading of starch allowing for direct AKD adsorption to cP AM
3. The initial kinetics (up to 20%) is nearly independent of cP AM dosage
AKD deposits on bare fibers and cP AM-coated fibers at the same rate,
suggesting that in both cases there is no (or a negligible) energy barrier in the AKD-
fiber interaction that might slow deposition. At first glance, this was surprising since
AKD does not adsorb on cP AM, but was explained by asymmetric polymer bridging
in the previous section.
Equation 3.1 describes the kinetics for regular homoflocculation. An optimum
in flocculation efficiency (a) is reached when the fractional surface area covered (8)
is K
58

a = 2B(I-B)
For heteroflocculation, the flocculation efficiency equals:
a = BI (1- B2 ) + B2 (1- BI )
(3.1)
(3.2)
In asymmetric polymer bridging, we find the following relationship [9]:
(3.3)
slllce 92 = O. When complete fiber coverage (B=I) is achieved, the maximum
adsorption efficiency (a) is reached, indicating the maximum rate of flocculation.
Any dosage corresponding to full coverage or more will yield the same rate a. We
would expect high concentrations of cP AM to produce identical responses for initial
flocculation, as seen in Figure 3.2. Since there is no energy barrier, the initial rate at
aIl cP AM dosages, as weIl as for AKD depositing on bare fiber patches is the same.
As more time elapses, the curves digress due to other processes, such as polymer
rearrangement, which is discussed below.
4. With ex cess cPAM, the reaching of maximum retenti on is delayed
When a high concentration of cP AM is added to the AKD-fiber suspension,
the fiber surface is coated exclusively by cPAM molecules (Figure 3.4b). The
sluggish process of attaining 100% AKD retenti on occurs due to re-conformation and
a slower, but stronger process of AKD adsorption to cP AM. One possible scenario is
that the expulsion of starch from the gap (Figure 3.6) is fast at low cPAM dosages,
but slow at high dosages. For low dosages, the starch can spread directly onto the
fiber, without competition from neighboring cP AM particles. This is consistent with
the explanation of starch transfer from AKD to the fiber.
59

Another scenario is that in aIl cases, starch is excluded from the gap, but the
bond strength increases when the polymer conformation becomes less expanded with
time. The re-conformation is fast at low polymer dosages, but slow at high dosages. It
was shown previously that rearrangement time is a strong function of fractional
coverage [10]. Polymers rearrange quickly on low surface concentrations, but slowly
on crowded surfaces, since neighboring molecules interfere with the rearrangement.
For extremely crowded surfaces, non-equilibrium results for a long time. High cPAM
dosages are not suitable for industrial conditions where the residence times are very
short.
3.4.3 Anionic-AKD Deposition on Fibers
Since AKD deposition on fibers without cP AM is not complete, we explored
what would happen with AKD stabilized with anionic polymer. The behavior we
observed for anionic AKD dispersions differed significantly from that of the cationic
dispersions. Results from a-AKD deposition experiments are presented in Figure 3.7.
If we divide this graph into its three types of curves based on retention aid
dosage, we see three distinct results. When no retenti on aid is added, AKD adsorption
is nearly zero since the negatively charged AKD particles do not interact with the
negatively charged fibers. Adsorption begins with the addition of cP AM. As the
cP AM dosage is increased, the a-AKD deposition on fibers increases. When
intermediate amounts of cPAM such as 0.2 and 0.3 mg/g are added, fibers are
partially coated, and AKD deposition increases with the addition of cP AM. The
60

maximum flocculation rate is reached above 0.3 mg cPAM/g when fibers are fully
coated. For full fiber coverage, 100% AKD deposition is reached within 5 minutes.
Furthermore, the period to reach 100% retenti on with high dosages is not
protracted as with cationic AKD. AKD particles adsorb to the fibres by cPAM
bridging and remain adsorbed due to a strong bond strength between AKD-cPAM-
fibers. In this situation standard heteroflocculation behavior is exhibited .
.-.. ~ ~ 10 1+= Cl
o ~ 8 « Cl E o
c o ~ o g. 4 o o ~ .2 2 c o ~
---=--:-:: :::::~, -' _. _. -II _.
t .·:.- "'V''' -::-:::'-"'-=." -17 :::;.:.~'::::='=-~:;.:......-=I=~:.:::-' .... '-V'_"
/: -~---# --~/ _-------T ---""----...,-J/ /,""'- e ............ e· ...................... .
~. t- ......................................... . 1.' /.
.1 ./
, [mg cPAM/g fiber]
• Control ........ e ........ 0.2 mg/g ---T--- 0.3 mg/g - .. -v._ .. - 1.7 mg/g ---- 5.0 mg/g -'-111-'- 6.6 mg/g
oe------.-----.----~~~--.-----.----.----~
o 200 400 600 900 1200 1500 1800
Time (5)
Figure 3.7: Adsorption kinetics ofanionic AKD emulsion to fibers, in the presence ofePAM. AKD addition: 10mg/g fiber; Inset: [mg cPAM/g fiber]
We have shown previously that anionic AKD and cP AM do heteroflocculate.
If there is an excess of cP AM and all fibers and AKD are fully coated, sterie
repulsions should occur. In other words, the excess cP AM in solution would coat the
AKD particles making them positively charged and unable to adsorb to the positive
fibers. Instead, this is likely a kinetic effect. Of the three processes taking place: i.e.
(i) polymer adsorption on fibers; (ii) AKD deposition on fibers; and (iii) polymer
61

adsorption on AKD, (i) is the fastest, followed by (ii) and (iii). Thus at high cP AM
dosages, AKD deposits on fibers before cP AM coats the AKD particles. This explains
how AKD can deposit on the fibers, even at high cP AM concentrations.
Altematively, if the AKD particles were coated completely by cP AM, van der
Waals forces exist which would bind the AKD to the fibers. However, the first
scenario is more likely.
3.5 Conclusions
We have drawn several interesting conclusions by performing experiments to
monitor the AKD deposition kinetics onto fibers. First, cationic AKD is not
flocculated by cP AM. This was expected since both molecules have a positive charge
and repel one another. Adsorption kinetic experiments revealed that cP AM increases
AKD retenti on by assisting AKD deposition on fibers. A mechanism was proposed
for this behavior. Asymmetrical polymer bridging explains both the increase in AKD
retenti on and the kinetics of AKD deposition by cP AM. Although the initial kinetics
(up to 20%) is nearly independent of cP AM dosage, excess cP AM de1ays the reaching
of the maximum possible retenti on due to starch and cP AM reconformation. Lastly,
we found that the addition of cP AM results in an increase in the bond strength
between AKD and fibers, thereby eliminating AKD detachment.
For adsorption kinetic tests performed with anionic emulsions, two types of
behavior were observed. When cP AM is added in quantities insufficient to coat the
full fiber surface, cP AM increases deposition of AKD onto fibers in relation to the
amount added. With fibers fully coated with cP AM, AKD deposition is fast and
62

remains at 100%, due to the increase in bond strength. Steric repulsions do not occur,
since the kinetics of AKD adsorption onto fibers is faster than cP AM adsorption onto
AKD molecules.
3.6 Acknowledgements
The author would like to thank Dr. T. van de Ven for valuable discussion, and A.
Vanerek for assistance with experiments.
63

3.7 References
[1] Allen, L.H., Polverari, M., Levesque, B. and Francis, W., "Effects of system closure on retention- and drainage-aid performance in TMP newsprint manufacture", Tappi Journal, 188-195 (1999).
[2] Tanaka, H., Swerin, A. and Odberg, L., "Transfer of cationic retention aid from fibers to fine particles and cleavage of polymer chains under wet-end papermaking conditions ", Tappi Journal, 76(5) 157-163 (1993).
[3] Esser, A. and Ettl, R. "On the mechanism of sizing with alkyl ketene dimer (AKD): physico-chemical aspects of AKD retenti on and sizing efficiency." in Fundamentals of Papermaking Materials, Transactions of the Il th Fundamental Research Symposium Cambridge, UK, (1997). 997-1020.
[4] Champ, S. and Ettl, R., "The dynamics of Alkyl Ketene Dimer (AKD) retention." Preprints -5th International Paper and Coating Chemistry Symposium, Montreal, QC, Canada, 285-291 (2003).
[5] Asselman, T. and Garnier, G., "Polymer Transfer During Fines Detachment Under Turbulent Flow: Mechanism and Implication", Journal ofPulp and Paper Science, 27(2) 60-65 (2001).
[6] Johansson,1. and Lindstrom, T., "A Study on AKD-size retention, reaction and sizing efficiency. Part 1: The effects ofpulp bleaching on AKD sizing", Nordic Pulp & Paper Research Journal, 19(3) 330-335 (2004).
[7] Isogai, A., "Effect of cationic polymer addition on retenti on of alkylketene dimer", Journal of Pulp and Paper Science, 23(6) 276-281 (1997).
[8] Johansson, J. and Lindstrom, T., "A Study on AKD-size retenti on, reaction and sizing efficiency. Part 2: The effects of electrolytes, retention aids, shear forces and mode of addition of AKD sizing", Nordic Pulp & Paper Research Journal, 19(3) 336-344 (2004).
[9] van de Ven, T.G.M. and Alince, B., "Heteroflocculation by Asymmetric Polymer Bridging", Journal of Colloid and Interface Science, 181 73-78 (1996).
[10] Polverari, M. and van de Ven, T.G.M., "Dynamic light scattering of suspensions ofPEO-coated latex particles", Colloids and Surfaces, A: Physicochemical and Engineering Aspects, 86 209-228 (1994).
64

CHAPTER4
INTERACTIONS OF AKD AND OTHER PAPERMAKING ADDITIVES
ON A LABORATORY TWIN-WIRE SHEET FORMER MACHINE

4.1 Abstract
Using the twin-wire sheet former, we tested AKD retenti on on a time scale
resembling industrial paper machines. The twin wire former enabled us to perform a
detailed mass balance on fibers and precipitated calcium carbonate. Furthermore, the
sheet produced was analyzed for AKD content, giving us the percentage of bound and
unbound AKD retained under various experimental conditions. AKD had a low
retention on the TWF, likely due to the choice of AKD stabilizer and its properties.
No distinguishable differences in AKD retenti on were found between the first-pass
and simulated second-pass conditions. These finding suggests that PCC does not
diminish the retention efficiency of AKD. We also found that cPAM increases the
retention of AKD. Since cationic polyacrylamide do es not adsorb onto starch-coated
AKD, it further supports the mechanism of asymmetric polymer bridging described in
Chapter 3.
The results from these initial tests provide valuable information about the
interactions of wet-end chemicals on larger scale, and validate the results obtained on
a smalliaboratory scale as discussed in Chapters 2 and 3.
66

4.2 Introduction
The laboratory twin-wire sheet former (TWF) is an invaluable tool for
studying particle retention under realistic papermaking conditions. The TWF is a
replica of a vertiformer and was completed at McGill University in 1998 [1]. Since
then, this instrument has been used for several projects. Mitsui has used the TWF to
determine the optimal retenti on of PCC, and for the study of fines retention in
combination with PEO and cPAM [2]. In addition, Pigeon determined fines retention
as a function of TWF parameters [3]. Several students from École Polytechnique de
Montréal have used the machine for experiments with PEO and fines retenti on [4, 5].
In these previous trials, the focus was determining the influence of additives
on the retenti on of fines, as well as characterizing machine drainage. Since the TWF
is equipped with three addition ports, it can accurately portray the real-time
interactions of fibers and fines with retenti on aids, fillers, and other additives. In this
research, we conduct the first such experiment with sizing agents.
4.3 Machine Description
The TWF is composed of three separate sections (headbox approach, drainage
and web collection sections) that work in series to during a complete experiment (see
Figure 4.1). The fabrics can attain a speed of5.3 mis, which is close to the same time
scale of an industrial paper machine.
67

Headbox Section
Drainage Section
Figure 4.1: Laboratory Twin-Wire Sheet Former (source: C. Hammock)
Web Collection
Section
The headbox approach loop is composed of a 400L holding tank and a pump
(Figure 4.2). The pulp suspension is stirred and circulated to ensure even mixing. A
mixer and baffles inside the holding tank ensure that the fibers do not settle to the
bottom of the tank. The centrifugaI pump controls the flowrate within the loop, as
weIl as the speed at which the pulp suspension is delivered onto the wire. At time
zero, the three-way valve is switched to divert the flow of pulp to the headbox,
denoting the start of a test mn.
The drainage section consists of the fast-rolling fabrics, foils and vacuum
boxes (see Figure 4.3). The water drains at various drainage points and is collected in
bins. The resulting paper sheet is blown off the wire into a collection bin and a
portion of this sample is bloWJ:l onto a roll to form a sheet that can then be dried and
68
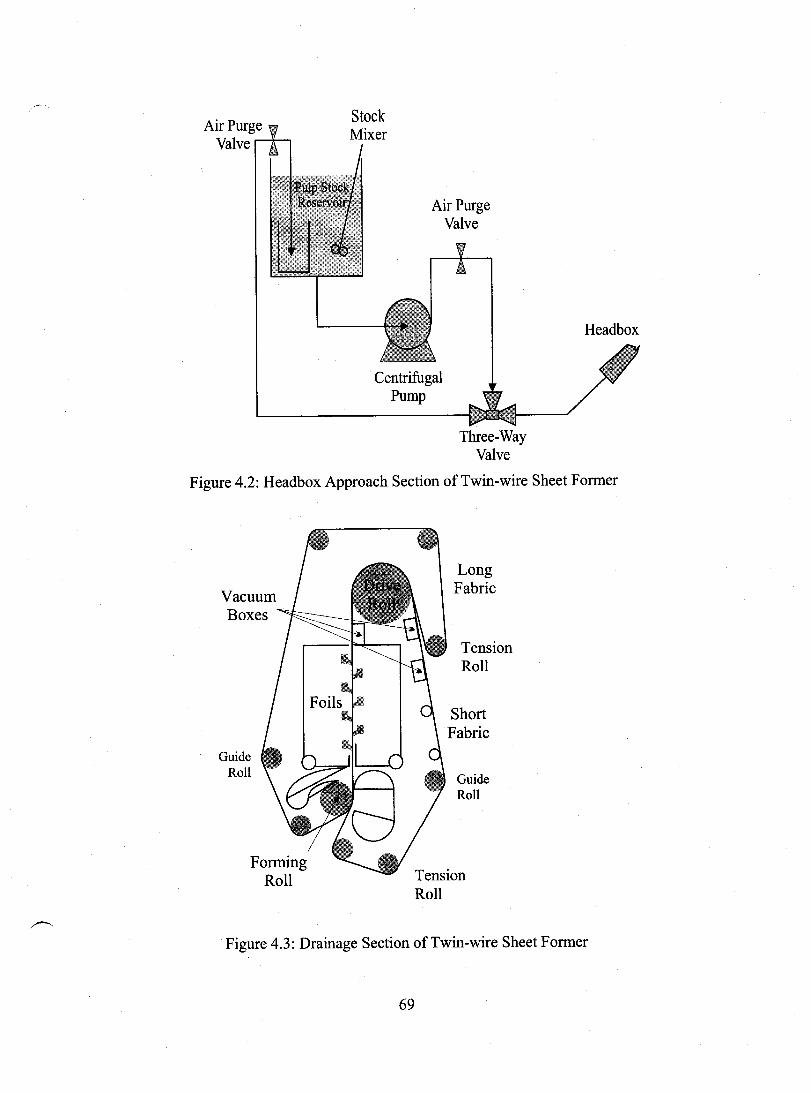
Air Purge Valve
Stock
Air Purge Valve
CentrifugaI Pump
Three-Way Valve
Headbox
Figure 4.2: Headbox Approach Section ofTwin-wire Sheet Former
Guide Roll
Long Fabric
Tension Roll
Short
Guide Roll
Tension Roll
Figure 4.3: Drainage Section of Twin-wire Sheet Former
69

tested. The water drains by pressure blades (foils) and vacuum suction. More on the
exact design can be found in the two theses by Hammock [1, 6]. At the end of each
run, an 8% consistency paper sheet is collected (Figure 4.5). A complete manual for
the operation of the TWF is included as Appendix C.
Many agree that the interactions that occur in the primary pass are more
important than combined consecutive passes in determining the paper characteristics,
so it is vital to find what occurs during this first pass [7]. Because the TWF has no
recirculation (whitewater) loop, it is an excellent tool for studying true first-pass
retention. Whitewater from each drainage point is collected in individual collection
bins, making it simple to calculate the first-pass retention of components. Since
papermakers are encouraged to close their whitewater loops, this true first pass
retenti on value is nearly impossible to obtain in an industrial setting. This is even
more important considering that the water entering a typical paper machine has
already been recirculated and contains the non-retained particles from the first-pass.
70

(
Figure 4.4: Photograph of the twin-wire sheet fonner machine
Figure 4.5: Photograph of a paper sheet produced: the sheet is very thin (38 g/m2) and
broken in many places, but adequate for testing AKD retention
71

4.4 Materials and Methods
A dried bleached softwood kraft pulp obtained as dried sheets from Domtar
was used in aIl the experiments. The pulp sheets were wetted and tom into small
pieces (15cm x 15 cm) and soaked ovemight in tap water. The pulp was then
disintegrated to produce a low consistency (1 %) suspension from which a portion was
transferred to the holding tank. For each experiment, the concentration in the holding
tank was adjusted to 0.6% ±0.03 consistency, without any further processing. In sorne
experiments, PCC was also added to the holding tank at a concentration of 15% wt/wt
offibers.
Cationic polyacrylamide (Percol 292) supplied by CIBA, Inc was used as the
retention aid. This compound has a degree of substitution of 20% and a molecular
weight of 3x 10⁶ Da. Solutions of 3.2 glL were prepared by wetting the cP AM with a
drop of ethanol and dissolving in de-ionized water. The solution was stirred for a
minimum of 2 hours.
Albacar HO, supplied by Specialty MineraIs, was used as the precipitated
calcium carbonate (PCC). This filler particle has an average particle diameter of 1.3
f..lm and a specifie surface area of 12 m2/g, as reported by the manufacturer. The PCC
stock was prepared by suspending the PCC in tap water and added to the holding tank
containing the pulp suspension. This mixture was stirred to ensure that the PCC and
pulp suspension were weIl dispersed.
AKD from our laboratory emulsions was used in aIl TWF experiments. These
AKD particles have a particle diameter of 0.8 f..lm and an electrophoretic mobility of
+1.33 [(f..lmls)/(V/cm)]. Typical additions of AKD in industry are 1mg/g fibres, which
72

is usually the concentration required to achieve appreciable sizing (600ppm AKD) on
the final paper sheet. These additions assume a 60% retenti on value, producing
sufficient AKD for adequate sheet sizing.
AKD is added to the first addition port when combined with cP AM, or in the
second addition port when tests were conducted without cPAM. Figure 4.6 shows the
arrangements used.
TI~ 60 ms
tx!D~ 210 ms
AKD cPAM 1 HEAD BOX
Figure 4.6: Additive locations and residence times on the TWF
Various tube lengths connecting the three-way valve to the headbox are
available for use with the TWF. Other researchers have used longer tubes to extend
the residence time of the additives [2]. In this study, we use only the shortest tube that
minimizes the distance between the three-way valve and the headbox. This length of
1.2m provides a residence time of 0.21 seconds from the second addition port to the
time flow reaches the headbox. Chemicals added to the first addition port (before the
three-way valve) have a residence time of 0.27 seconds. For colloidal particles, this
time scale is more than sufficient for chemical interactions to occur [8]. Mitsui has
found that residence times and tube lengths can be adjusted to optimize machine
operation [2]. These adjustments were not required in this study since we were
interested in obtaining results on a comparative basis.
73
A test fUll consisted of switching the three-way valve to redire ct the flow to
the drainage section. Simultaneously, the pumps for the additives were activated to
deliver the chemicals. The pulp suspension was pumped onto the drainage wire at a
flowrate of 4.8 kg/s for 22.5 seconds, the duration of each test run.
4.5 Analysis of Results
For each test run, seven drainage points and the wet web sheet were sampled
for filler content, fiber content, and AKD concentration. These values gave a
complete mass balance of each fUll.
PCC and fiber concentrations from the seven collection points and the wet
web were determined in a two-step process. By evaporating water from the sample,
we obtained the combined concentration of PCC and fibers. Next, the sample was
ashed 1 at 525°C to isolate the PCC alone. The concentration of fibers was calculated
from the difference of these two values.
Since AKD is not a pure material (the chain length varies), it is difficult to
analyze because it decomposes into various compounds [9]. Several methods to
analyze the AKD content have been employed, each with its advantages and
drawbacks. These methods incIude isotopic labeling [10], spectophotometric methods
lacing AKD with a fluorescent dye [11], capillary gas chromatography [12], as well
as extraction and ketone analysis, pyro1ysis gas chromatography, and visible/UV
spectroscopy [13].
1 According to Tappi Stand Method #413 om-93
74

In our analysis, a FID-GC2 method was used to determine the AKD retained
in the sheet [9]. A thin wet sheet was produced during one rotation of the metal drum
of the TWF. Sheets were taken off the drum, pressed and dried for 20 minutes at
105°C on a flat-bed drier and dried ovemight at standard conditions. Samples were
sent to Paprican, Point Claire, for AKD analysis using a solvent extraction Soxtec
apparatus. The sample was then analyzed using FID-GC to determine the quantity of
AKD in the sheet. Results were expressed as the bound, unbound, and total AKD
concentrations in ppm (mg AKD/ kg offibers).
Sizing efficiency was determined by performing contact angle measurements
on samples. The wet web was dried to remove water and mechanically pressed into
1.5cm-wide round discs with a Imm thickness. The discs were cured ovemight in a
sealed vessel to reduce AKD los ses by vaporization. The Contact Angle System OCA
instrument (Dataphysics, Germany) was used to record the rate of water penetration
into a dise. The contact angle was calculated as a function of time with software using
the Laplace-Young model.
4.6 Outline of Experiments
4.6.1 Reproducibility experiments
A set of experiments using PCC and fibers was performed initially to verify
the reproducibility of the twin-wire sheet former. Three runs were performed, which
were then analyzed for mass balance and filler retention. Figures 4.7 and 4.8 below
show the results from these trials. The three lines represent three experimental runs
2 Flame Ionization Detector- Gas Chromatography
75

under identical conditions. They produce the same machine drainage and consistency
for each run. Likewise, the fiUer retention of these three tests is similar for each.
These trials were run without the addition of a retention aid, explaining the low PCC
retention. Performing a statistical analysis, we find that our results were accurate to ±
0.5%, which is suitable for our purposes. In aU subsequent experiments, two runs
were performed under each condition; aU values presented are the average of these
two.
C 12.-----~----~----~----~------~----~----. o 'iii c 2i. 10 CI) ~ CI)
.:/ : .. / ..... ; ............... . /
/ ! 8 ......., ·············.,,;A', ........... . ~ 6 ................ L ............. _,~~<: .......... . ~ 4 ....... . ..... ; .. ,~/~~ ..... , ............. . (jj iii c o
Ü -Q) Q)
.s:::. CI)
./ :
2 ................ : .. .......... ;Jt7C.~ ...... : ................. ~ .............. ·T .. ······· ...... : ............... . : ,/: : : . : • :;.-0 : :: : . . . .
: : o~----,r-----r·-----+·----~------r-----T---~
Position in Drainage Section of TWF
Figure 4.7: Water Drainage along the TWF for three duplicate runs
76

10~--------------------------------.
8
2
Run#1 Run#2 Run#3
Figure 4.8: FiUer retenti on in the wet-web for three duplicate trials on the TWF
4.6.2 PCC Retention with Cationic Retention Aid
Previous trials by Mitsui showed that 0.8 mg cPAM/g fiber produces the
highest PCC retenti on, based on a 15% wt PCC/wt fiber addition [2]. In our
experiments, we use the same PCC amount and found that 0.8 mg/g results in a 55%
retention of PCc. Without the addition of retention aid, the PCC retenti on is minimal,
averaging 5%. Figure 4.9 demonstrates how the addition of cationic polyacrylamide
increases the PCC deposition onto fibers.
77

70.-------------------------------~
60 ---. ~ -- 50 C o ~ 40 C Q)
+-' Q) 30
0::: Ü 20 Ü a..
10
o mg/g 0.8 mg/g
cPAM addition [mg cPAM/g fiber]
Figure 4.9: Influence of cP AM on PCC retention on the TWF
4.6.3 First-Pass Retention vs. Second Pass Retention with AKD
Tests were performed adding PCC, AKD, and cPAM, varying the addition to
resemble either a first-pass or second-pass ron through a paper machine. The second-
pass conditions were simulated by combining the AKD emulsion together with
additional PCC at the first addition port. The AKD-PCC suspension was stirred for at
least 1 hour, to simulate how AKD and PCC would interact in whitewater conditions.
Results show that the AKD retention was extremely low, such that the second-pass
retention of AKD could not be distinguished from the first pass retention, possibly
due to the low AKD levels retained. Altematively, these results could indicate that
AKD and PCC do not interact, suggesting that PCC does not affect AKD retention.
78

4.6.4 AKD Retention at Various Additions
A set of tests was performed to determine the amount of AKD necessary to
achieve an adequate degree of sizing in the sheet. Tests were performed with only
fibers and AKD. It was found that at typical additions of 1 mgAKD/g fiber, the
retention was only 3.2% AKD. The same low retention percentage was observed at 5
mg/g and 10 mg/g additions. Typically, 600ppm AKD in the sheet is necessary to
impart sufficient sizing. Using 1 mg AKD/g fibers, we ob tain retenti on of 35 ppm;
using 5 mg/g, we obtain 150 ppm. This low retention necessitated the addition often
times the normal amount of AKD (10 mg/g) to achieve good sizing in the sheet. Even
then, we could not retain the necessary quantity of AKD without the use of retention
aids.
4.6.5 AKD Retention with cPAM
Tests were also conducted with fibers, AKD and cPAM. In contrast to results
in the tests described in section 4.6.4, we found that cPAM increased the AKD
retention in the sheet, from 3.2% without cPAM, to 9% with addition of 0.8 mg
cPAM/g fiber, as seen in Figure 4.1. This is consistent with results found in Chapter 3
regarding AKD and cP AM adsorption kinetics with fibers. The rate of water
penetration into a sample of the wet web was determined using the contact angle
instrument. For 5 mg AKD/g fiber water penetration was instantaneous. 10 mg
AKD/g fiber were required to produce a sufficient contact angle (>80° for more than
one minute). These findings with the twin wire former further support our theory of
79

asymmetric polymer bridging as a mechanism for AKD retention lU the paper
machine.
10.-------------------------------~
C 8 o
+=i C 2 6 Cl)
0::: Cl 4 :::s::: <C '$.2
o mg/g 0.8 mg/g
cPAM addition [mg cPAM/g fiber]
Figure 4.10: The effect of cP AM on AKD retenti on on the TWF
4.7 Conclusions
Using the twin-wire sheet former, we were able to conduct retention tests on a
time scale resembling industrial paper machines. The twin wire former enabled us to
perform a detailed mass balance on fibers and calcium carbonate. Furthermore, the
sheet produced was analyzed for AKD content, giving us the percentage of AKD
retained under various experimental conditions. The three main conclusions obtained
from these studies are as follows:
1. AKD has a very low retention on the TWF. We hypothesize that this is due to
the low electrophoretic mobility of the AKD particles.
80

2. No distinguishable differences in AKD retenti on were found between first
pass and simulated second-pass retention of AKD. These finding suggests that
PCC does not diminish the retention efficiency of AKD.
3. Cationic polyacrylamide increases the retention of AKD. Since cPAM does
not adsorb onto starch-coated AKD; this finding further supports the
mechanism of asymmetric polymer bridging described in Chapter 3.
The results suggest that the TWF has not yet been optimized for the study of AKD
retention. However, the results from these initial tests do provide extremely valuable
information about the interactions of wet-end chemicals on a larger scale, and
validate the results obtained on a small laboratory scale as discussed in Chapters 2
and 3.
4.8 Acknowledgements
We would like to thank B. Sitholé, J. Pimentel, and A. Gagné at Paprican, Pointe
Claire, for the AKD analysis. Thank you to Marcius De Oliveira, Loius Godbout, and
Alois Vanerek for help in running the twin-wire sheet former machine, and most of
aIl to Chris Hammock for training in machine operation.
81

4.9 References
[1] Hammock, C., "Development ofa laboratory-scale twin-wire sheet former", M.Eng. thesis, Chemical Engineering, McGill University, (1998).
[2] Mitsui, K., "Mechanism of Fines Retention and Drainage with a Polyacrilamide/Bentonite Retention Aid", thesis, Chemical Engineering, McGill University, (2000).
[3] Pigeon, C., "The effects of a PEO-cofactor-bentonite system in papermaking", M.Sc. thesis, Chemistry, Mc Gill University, (2001).
[4] Hermann, A., "Étude de l'enchevêtrement et de l'efficacité de l'oxyde de polyethylene utilizé comme agent de rétention sur des machines à papier", M.Sc. thesis, Chemical Engineering, École Polytechnique, (2004).
[5] Périn-Levasseur, Z., "Étude expérimentale d'un système de rétention des particules fines dans un formeur de laboratoire ", M.Eng. thesis, Chemical Engineering, Ecole Polytechnique, (2004).
[6] Hammock, C., "Mechanisms of drainage, retenti on and formation during web forming in papermaking", PhD thesis, Chemical Engineering, McGill University, (2005).
[7] Smook, G.A., "Handbook for Pulp & Paper Technologists", Angus Wilde Publications, Vancouver, 2nd Ed., (1992).
[8] Alince, B., "Time factor in pigment retention", Tappi Journal, 79(3) 291-294 (1996).
[9] Sithole, B.B., Nyarku, S. and Allen, L.H., "Chromatographie methods for the determination of alkylketene dimer in pulp and paper matrixes", Analyst (Cambridge, United Kingdom) , 120(4) 1163-9 (1995).
[10] Johansson, J. and Lindstrom, T., "A Study on AKD-size retention, reaction and sizing efficiency. Part 2: The effects of electro1ytes, retenti on aids, shear forces and mode of addition of AKD sizing", Nordic Pulp & Paper Research Journal, 19(3) 336-344 (2004).
[11] Esser, A. and Ettl, R."On the mechanism ofsizing with alkyl ketene dimer (AKD): physico-chemical aspects of AKD retention and sizing efficiency." in Fundamentals of Papermaking Materials, Transactions of the Il th Fundamental Research Symposium Cambridge, UK, (1997). 997-1020.
[12] Dart, P.J. and McCalley, D.V., "Determination of alkylketene dimer sizing agent products in paper by capillary gas chromatography", Analyst (Cambridge, United Kingdom), 115(1) 13-16 (1990).
[13] Jaycock, M.J. and Roberts, J.C., "A new procedure for the analysis of alkyl ketene dimers in paper", Paper Technology, 35(4) 38-42 (1994).
82

CHAPTER5
CONCLUSIONS

5.10verview
Since AKD has a low first-pass retention (~40%), a large portion enters the
whitewater cycle and has time to interact with many types of particles including PCC.
Although the mechanisms behind AKD sizing and reactions with cellulose have been
studied in-depth, mechanisms of AKD retention are poody understood. It is also
unknown how interactions in the whitewater affect subsequent passes of AKD.
The objectives ofthis research were three-fold. First, we attempted to characterize
the interactions between AKD and PCC by simulating wet-end conditions. Secondly, we
investigated the interactions between AKD and cPAM. Thirdly, we performed
experiments on a large-scale twin-wire sheet former to determine the chemical
interactions of AKD in real-time.
We prepared an AKD emulsion stabilized by cationic starch, free from extraneous
substances. After verifying that its properties were similar to those of a commercial
emulsion, we used our laboratory emulsions for further testing. Using the Photometric
Dispersion Analyzer, we found that the AKD emulsions flocculate PCC at an optimal
dosage of 10 mg AKD/g PCC. However, subsequently we found that flocculation is
caused by the cationic starch acting as the AKD stabilizer.
No visual proof was found that AKD and PCC form flocs. The SEM photographs
show that PCC and AKD each homoflocculate; however, little to no heteroflocculation
occurs. This, in combination with the results obtained from the PDA tests, suggests that
PCC and AKD do not directly interact. Instead, removal of starch from AKD aids PCC
homoflocculation (via polymer bridging). Starch transfer causes the AKD particles to
84

/" aggregate, since their stabilizing polymer (starch) has been depleted. It can therefore be
concluded that cationic starch has a higher affinity for PCC than for AKD.
More importantly, we can conclude that AKD and PCC are unlike1y to interact in
the whitewater circulation loop. This dismisses the idea that PCC will lower AKD
retention. Although PCC does decrease the sizing of a sheet by increasing the specific
surface area, this would not influence AKD single-pass retention.
The second part of our research dealt with the adsorption kinetics of AKD onto
fibers. First, we found that cPAM does not flocculate cationic AKD. This result was
expected since both additives have a positive charge and repel one another. Adsorption
kinetic experiments revealed that cP AM increases the retention of AKD by assisting its
adsorption to fibers. Asymmetrical polymer bridging is able to explain the increase in
AKD retention, as well as predict trends in the flocculation kinetics with cP AM. The
main conclusions drawn from this study are:
1. Without cP AM, AKD deposition goes through a maXImum, after which
detachment occurs.
2. Cationic polyacrylamide increases the AKD deposited on fibers by asymmetric
polymer bridging, and increases the bond strength between AKD and the fiber,
eliminating detachment of AKD mole cules under laboratory conditions.
3. The initial kinetics of AKD deposition (up to 20%) is nearly independent of
cP AM dosage.
4. With excess cPAM, attaining the maximum retention is delayed due to starch
and/or cPAM re-conformation.
85

For anionic emulsions, cP AM increases AKD deposition on fibers in relation to
the amount added, for less than full fiber coverage. With fibers fully coated with cP AM,
AKD deposition is fast and remains at 100% due to the increase in bond strength. Steric
repulsion does not occur, since the kinetics of AKD deposition onto fibers is faster than
cP AM adsorption onto AKD particles.
Our third focus was to measure the AKD interactions on a time scale relevant to
industrial paper machines, using the twin-wire sheet former (TWF). The TWF enabled us
to perform a detailed mass balance on fibers and calcium carbonate. The sheet produced
was analyzed for AKD content, giving the percentage of AKD retained under various
operating conditions. Unfortunately, AKD retention on the TWF is very low; this may be
because the AKD particles had a low electrophoretic mobility. Altematively, varying the
tube length in the headbox approach section may have improved retenti on by changing
the residence times of the additives. No distinguishable differences in AKD retenti on
were found between fresh AKD and that which had been mixed with PCC prior to the
test. These findings suggest that PCC does not diminish the retention efficiency of AKD.
Lastly, it was found that cPAM increases the retention of AKD and does so on a very fast
time scale. Because cPAM does not adsorb onto starch-coated AKD, this further supports
the asymmetrical polymer bridging mechanism.
It was found that PCC and AKD do not directly interact. Rather, AKD retention
~-', is increased by the addition of cP AM. The mechanism behind these interactions has been
86

shown to be due to asymmetric polymer bridging. Cationic polyacrylamide aids the AKD
retention by first adsorbing to fibers, after which it is able to adsorb onto AKD particles.
5.2 Recommendations for Future Work
Steps have been taken to make the twin-wire sheet former an effective tool in
measuring AKD retention on a larger scale, though much work remains to be done in this
respect. It is clear that AKD retention values were not optimized. Further experiments
should be conducted on the TWF with an AKD emulsion containing a different
stabilizing polymer. The use of a cationic starch with a higher degree of substitution
would increase AKD retention by increasing the electrophoretic mobility of the emulsion.
Altematively, amphoteric emulsions, containing both anionic and cationic stabilizing
polymers, could be used to stabilize the emulsion. Furthermore, trials may also be
performed using anionic AKD emulsions.
87

APPENDICES

Appendix A: Princip les ofFlocculation
Particles attract each other for a variety of reasons. In the presence of
polymers, particles may aggregate via polymer bridging or patch aggregation. With
other types of additives, charge neutralization or coagulation caused by a higher ionic
strength may occur.
The method of aggregation determines much of the properties of the flocs, so
it is important to know the mechanism of particle flocculation. It is known that in
papermaking, precipitated calcium carbonate (PCC) will deposit on to other filler
particles or fibres via polymer bridging (with cationic polyacrylamide as the
polymer). Thus, studying this flocculation behavior can improve our understanding of
AKD and filler retenti on in the paper web.
Precipitated calcium carbonate (PCC) is positively charged in de-ionized
water, but reverses its charge due to impurities in the whitewater. Thus, in a
papermaking environment, PCC assumes a negative charge. Since fibres are also
negatively charged, cationic retenti on aids are added to bridge the two. Several types
of flocs may be formed, depending on charge density and the properties of the
polymer, as weIl as the shear rate that the particles experience.
The main variable that dictates whether collisions will be dominated by ortho-
or peri-kinetic interactions is the Peclet (Pe) number. This dimensionless quantity is a
ratio of shear and diffusion forces:
[k: Boltzmann constant, T: temperature (K), G: shear rate, l1:viscosity, a: particle
radius] Thus, when Pe» 1, orthokinetic rates are dominant in determining the
89

collision frequency. The value ofPe dictates the type of collisions that will occur and
the kinetic model that can be used to predict particle behavior. In PDA experiments,
the Peclet number is well above a thousand, indicating that shear forces.
Photometrie Dispersion Analyzer (PDA) Operation
The photometrie dispersion analyzer was used to study PCC and AKD
flocculation. The PDA consists of a light emitting diode (LED) at 850nm and a
photo-detector (PIM) photodiode that continuously monitors the transmitted light.
The frequency of measurements ranges from 6-2000 Hz. A plastic block allows for
the precise fitting of tubing that lies in the light path. A suspension flowing through
the photosensitive cell is illuminated by a narrow beam of light perpendicular to the
flow. The volume illuminated by the light beam is of the order of Imm3. The PDA
works on the principle that in any emulsion or suspension, there exist small local
fluctuations in composition which follow the Poisson distribution, such that the
standard deviation about the mean is the square root of the average number of
particles in the sample volume (i.e. in the light beam).
The current from the photodiode is converted to a voltage signal, which has a
large DC component, with a smaIl fluctuations. The DC component is a measure of
the average transmitted light intensity and is dependent on the turbidity of the
suspension. The AC component arises from random variations in the number of
particles in the sample. The AC (fluctuating) component is separated from the DC
component and amplified by a factor of up to 500. Because the suspension flows
through the ceIl, the actual sample in the light beam is continuaIly renewed, and local
90
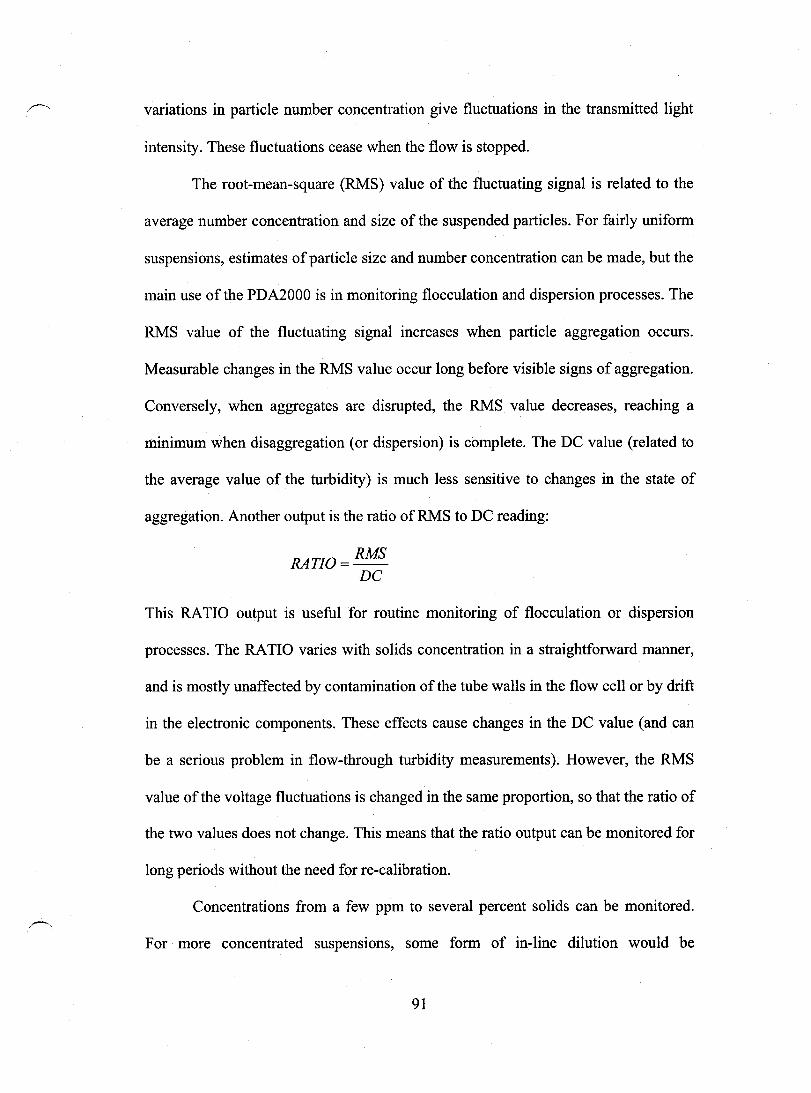
variations in particle number concentration give fluctuations in the transmitted light
intensity. These fluctuations cease when the flow is stopped.
The root-mean-square (RMS) value of the fluctuating signal is related to the
average number concentration and size of the suspended particles. For fairly uniform
suspensions, estimates of particle size and number concentration can be made, but the
main use of the PDA2000 is in monitoring flocculation and dispersion processes. The
RMS value of the fluctuating signal increases when particle aggregation occurs.
Measurable changes in the RMS value occur long before visible signs of aggregation.
Conversely, when aggregates are disrupted, the RMS value decreases, reaching a
minimum when disaggregation (or dispersion) is complete. The DC value (related to
the average value of the turbidity) is much less sensitive to changes in the state of
aggregation. Another output is the ratio ofRMS to DC reading:
RATIO = RMS De
This RATIO output is useful for routine monitoring of flocculation or dispersion
processes. The RATIO varies with solids concentration in a straightforward manner,
and is mostly unaffected by contamination of the tube walls in the flow cell or by drift
in the electronic components. These effects cause changes in the DC value (and can
be a serious problem in flow-through turbidity measurements). However, the RMS
value of the voltage fluctuations is changed in the same proportion, so that the ratio of
the two values do es not change. This means that the ratio output can be monitored for
long periods without the need for re-calibration.
Concentrations from a few ppm to several percent solids can be monitored.
For more concentrated suspensions, sorne form of in-line dilution would be
91
necessary. The limits of partic1e size are roughly 0.5 to 100J.1m. In non-uniform
suspensions, larger partic1es give the dominant contribution to the RMS and ratio
values. The concentration and partic1e size limits are inter-related to sorne extent.
Thus, for larger partic1es, lower concentrations can be detected.
92

Appendix B. Starch Clustering and E([ects ofShear and Sonication
The influence of sonication and stirring on starch particle was tested. Particle
size was measured using a Brookhaven Goniometer BI-200SM with particle size
software. This dynamic light scattering apparatus works by passing polarizable
partic1es through a beam of light. The electric field induces partic1es to radiate light in
all directions by a dynamic light scattering method.
Our studies found that starch size is a function of starch concentration and
sonication. Initially, starch c1usters were large (greater than 1 micron). Stirring
decreases the partic1e size, however, sonication is much more effective breaking up
c1usters. In fact, we find that sonication reduces the starch to single particles. The
results from the dynamic light scattering and software analysis can be seen in the
graphs below. The graphs show the partic1e size distribution on the right, while the
left column presents the calculated value for the mean partic1e diameter. Figure (A)
shows the starch size without any sonication. In contrast, Figure (B) demonstrates the
partic1e size after 3 minutes of sonication. Figure (C) shows a sample with the same
starch concentration, sonicated for 5 minutes.
Furthermore, dynamic light scattering was performed for vanous
concentrations of starch solutions. The results demonstrated that as the concentration
is decreased, the partic1e size decreases as weIl. These results confirm our premise
that a more di lute starch solution will result in smaller AKD partic1es, since more
starch is available to coat its surface.
93
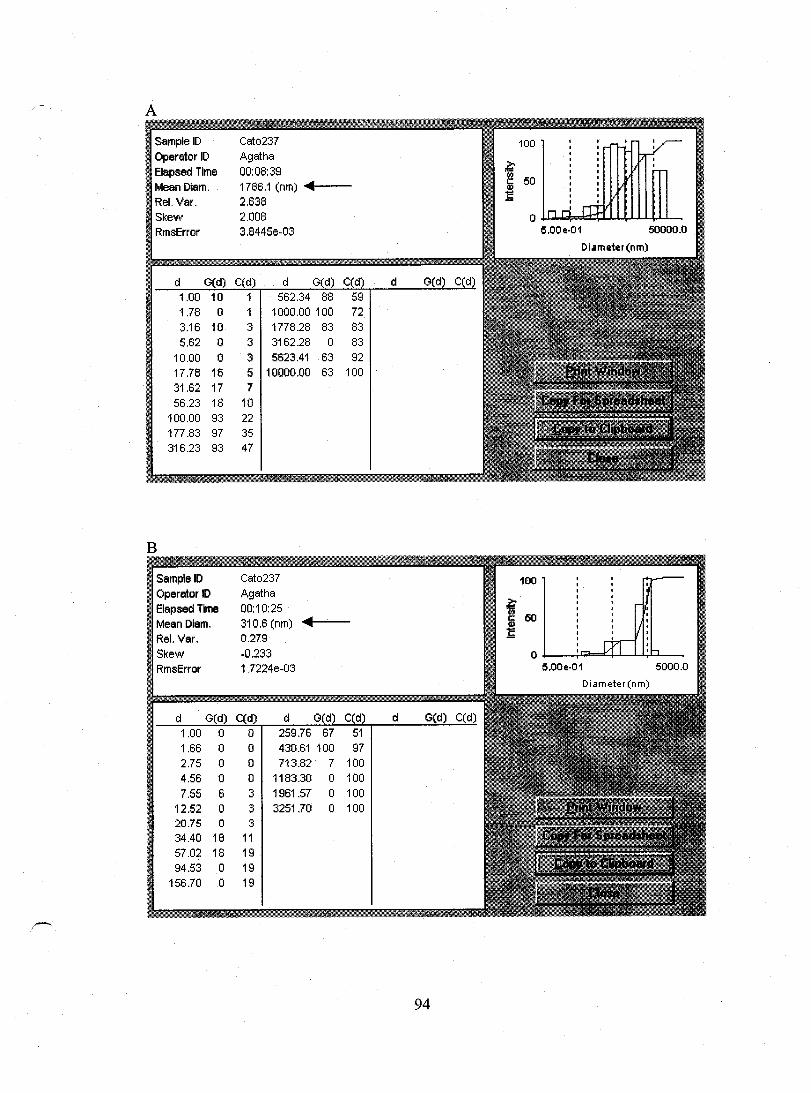
A
Sample ID Cato237 100 Operator ID Agatha Elapsed Time 00:08:39 Mean Diam. 1786.1 (nm) ... Rel. Var. 2.638 Skew 2.008 o .j.U~=*::It+L..u..4-U~.LL~ RmsError 3.8445e-03 5.00e-01 50000.0
Diameter (nm)
d G(d) C(d) d G(d) C(d) d G(d) C(d) 1.00 10 1 562.34 88 59 1.78 0 1000.00100 72 3.16 10 3 1778.28 83 83 5.62 0 3 3162.28 0 83
'10.00 0 3 5623.41 63 92 17.78 16 5 10000.00 63 100 31.62 17 7 56.23 18 10
100.00 93 22 177.83 97 35 316.23 93 47
B
Sample ID Cato237 Operator ID Agatha Elapsed Time 00:10:25 Mean Diam. 310.6 (nm) ... Rel. Var. 0.279 Skew -0.233 RmsError 1.7224e-03 5.00e-01 5000.0
Diameter (nm)
d G(d) C(d) d G(d) C(d) d G(d) C(d)
1.00 0 0 259.76 67 51 1.66 0 0 430.61 100 97 2.75 0 0 713.82 7 100 4.56 0 0 1183.30 0 100 7.55 6 3 1961.57 0 100
12.52 0 3 3251.70 0 100 20.75 0 3 34.40 18 11 57.02 18 19 94.53 0 19
156.70 a 19
,~
94

~', C
Sample ID Cato237 100 Operator ID Agatha
>-Elapsed lime 00:12:36 "" (1.1
Mean Diam. 292.7 (nm) ~ c: 50 ID
Rel. Var. 0.203 1;;
Skew -0.021 0 RmsError 3.1776e-03 5.0 5000.0
Diameter (nm)
d G(d) C(d) d G(d) C(d) d G(d) C(d)
1.00 0 0 214.94 55 41
1.63 0 0 350.22100 92
2.65 0 0 570.64 17 100
4.33 0 0 929.81 0 100
7.05 0 0 1515.03 0 100
11.49 0 0 2468.60 0 100 18.71 0 0 30.49 0 0 49.68 25 13
80.96 0 13 131.91 0 13
95

Al!pendix C. Twin-Wire Sheet Former Machine (TWF) Instructions
A detailed description for operating the twin-wire sheet former is given below:
DAYl • Tear one sheet ofpulp into small pieces for each circular drum (2 drums). • Fill each drum to ~ 100 L (preferably with hot water) and let soak overnight.
DAY 2 • Dilute pulp slurry to 160 L in each barrel. • Attach mixer to barrel. Ensure that it is angled into drum and off-centered to
create a circular flow pattern and let mix during the day. • At the end, fill up the barrels to the 180 L mark.
Note: Safety Precautions • Always wear ear protection and safety goggles when operating the twin-wire
former • Never wear loose clothing that can become stuck in the machine • Never work alone in the room when running the TWF
DAY 3 • Turn the mixers back on to re-agitate the pulp suspensions. • Switch up the main power source • Switch on PUMP and PRESS power source boxes
• Close yellow valve (headbox drainage pipe) under the holding tank • Open the green air valve (this controls the 3-way valve). • Check that 3-way (S) valve is ON (recirculation mode).
• Fill the holding tank with tap water from the hose until water begins pouring out the vent in the bottom portion of the tube. Plug this with the brass plug or an addition port. Wrap plug with teflon tape before inserting.
• Fill headbox to the 15 cm mark with water. • Turn on mixer (dial is on top of mixer) to gently agitate the solution. • Transfer pulp slurry into headbox bucket by buckets. Fill the tank with 4 expts
worth ofpulp (60L x 3 = 180 L); di lute with tap water up to ~55cm mark. • As pulp is being added, slowly turn on the pump. Then raise pump motor to
945 rpm. While recircu1ating the solution, the upper portion of the tube will begin to fill and start to suck air into the air vent. Once this is happening, close the air vent by turning it to a horizontal position.
• Connect the gray tube from 3-way valve to impingement box (headbox). • Use green hose to fill water level to the 59.5 cm mark. • Let the circulation loop fUll for about 5-10 minutes while the rest of the
equipment is being setup.
96

/-',
Equipment setup
1. Plug in the large scale and move the other scale to the center of the room. 2. Tare the large tank on the scale. Make sure none of the pipes are resting on the
large collection tank when taring. Also position the web collection container. This should be tilted against the machine, and inclined with a block of wood.
3. Attach the three pipes leading to the three smaller collection tanks 4. Set the three vacuums in place; (first attach the pipes, next the heads). 5. The next part of the equipment setup is the air supply. 6. In the back, tum on both air tanks. This should give a pressure of 220kPa for
the inner and 425kPa on the outer fabric, producing 2-3 kN/m on the fabric. 7. Open the valve for the web blowing. However, ensure that the ON valves are
only at a 45degs, and not completely ON. 8. Control Box: Switch on Press slowly. 9. While this is happening, with the spray nozzle, wash the forming fabric with
water, in an area so as to prevent any water from collecting in the tanks. This is best done at the beginning of the forming sections, just after the headbox impingement, and at the wire separation point prior to web collection.
Running a single experiment
1. Place the safety polycarbonate-glass shield into position. 2. Tum ON the PUMP control and ramp up to 945. (Note: the pump should be
running at this value for a few minutes prior to starting the experiment to create a well-distributed pulp suspension in the headbox.
3. Tum ON the PRESS control and ramp up to 1750 (a fabric speed of approx 5.3 mis.) Go quickly through 1000-1300, as the machine vibrates in this range.
4. Flip the "fibre collection" switch up. 5. Next flip the "vacuum" switch up. This will activate the first two vacuums
immediately. After a few seconds, the third, final vacuum will be activated. At this point, the experiment can be started.
6. Simultaneously flip the s-valve switch to OFF and press stopwatch. 7. After 22.5 seconds, tum ON the s-valve and stop the time. Record the time
duration of experiment.
Shutdown procedure ..... After each run
1. 2.
3.
4. 5. 6. 7.
Stop rolls by ramping down the PRESS dial, and then switching to OFF. Keep the pump motor running, but ramp the dial so that it slows to a minimum. Disconnect aIl the pipes leading to the collection tanks and vacuums. Shake aIl remaining water out of the pipes. Next, weigh aIl collection tanks, and take fluid samples from each. Also sample the solution from the storage tank at this point. Empty the contents of the collection tanks into the sink For the web collection: place in a plastic container and seal air-tight.
97
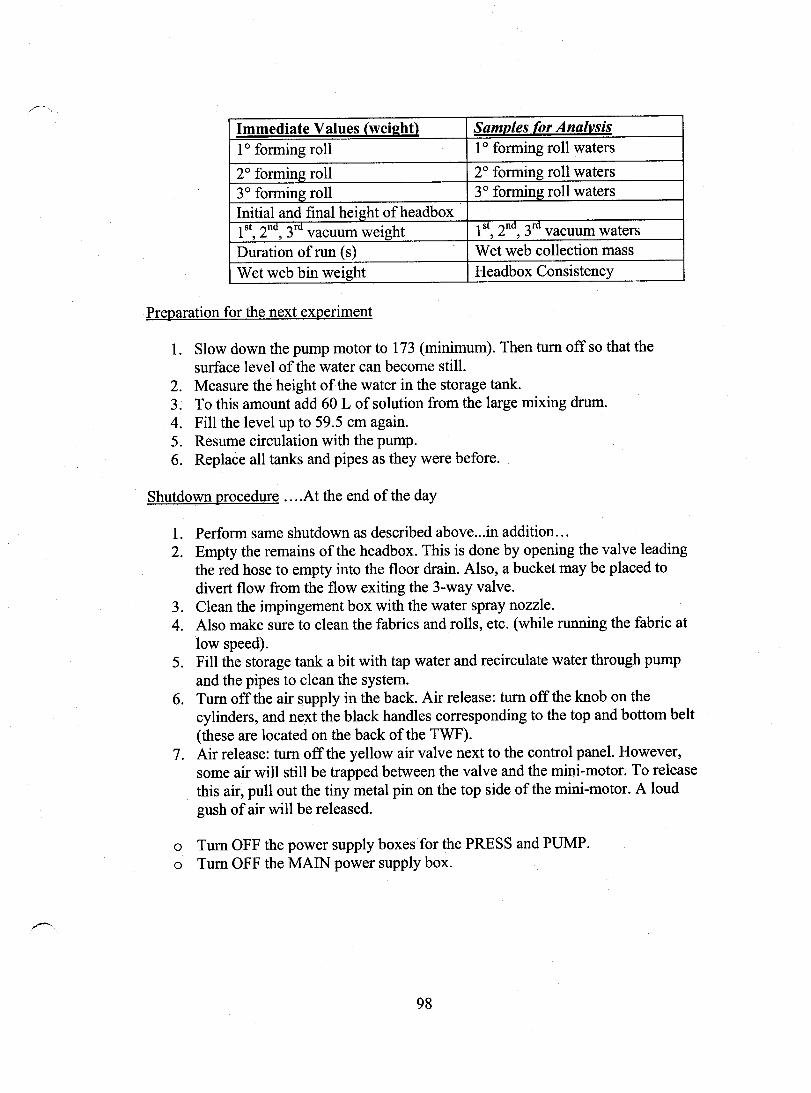
Immediate Values (wei2;ht} Samll.Ies fJ!r Anall!.,sis 1 ° fonning roll 1 ° fonning roll waters
2° fonning roll 2° fonning roll waters 3° fonning roll 3° fonning roll waters Initial and final height of headbox 1 st 2nd 3rd vacuum weight , , 1 st 2nd 3rd vacuum waters , , Duration of run (s) Wet web collection mass Wet web bin weight Headbox Consistency
Preparation for the next experiment
1. Slow down the pump motor to 173 (minimum). Then turn off so that the surface level of the water can become still.
2. Measure the height of the water in the storage tank. 3. To this amount add 60 L of solution from the large mixing drum. 4. Fill the level up to 59.5 cm again. 5. Resume circulation with the pump. 6. Replace aIl tanks and pipes as they were before.
Shutdown procedure .... At the end of the day
1. Perfonn same shutdown as described above .. .in addition ... 2. Empty the remains of the headbox. This is done by opening the valve leading
the red hose to empty into the floor drain. AIso, a bucket may be placed to divert flow from the flow exiting the 3-way valve.
3. Clean the impingement box with the water spray nozzle. 4. Also make sure to clean the fabrics and rolls, etc. (while running the fabric at
low speed). 5. Fill the storage tank a bit with tap water and recirculate water through pump
and the pipes to clean the system. 6. Turn off the air supply in the back. Air release: tum off the knob on the
cylinders, and next the black handles corresponding to the top and bottom belt (these are located on the back of the TWF).
7. Air release: turn off the yellow air valve next to the control panel. However, sorne air will still be trapped between the valve and the mini-motor. To release this air, pull out the tiny metal pin on the top side of the mini-motor. A loud gush of air will be released.
o Tum OFF the power supply boxes for the PRESS and PUMP. o Turn OFF the MAIN power supply box.
98

Storage Procedures
o Store collection tanks and vacuums upside down.
Variations with the pipe length
o A short pipe connecting the 3-way valve to the impingement box is the basic setup for the machine. Depending on various addition sequences, longer pipes may be used. This will extend the residence time of the solution, and also provide several ports along the pipe at which it is possible to add different additives to the pulp slurry.
DAY 4
o Pulp consistency measurements o weight filter paper o Pour contents of plastic bottle into a funnel and drain through. o Place the filter paper in an ovemight. o Weigh the filter paper the next day twice, to ensure accurate readings.
o Web consistency measurements o Weigh 4 aluminum dishes oPIace 1 sample in each dish o Leave in the oyen ovemight o Measure oyen-dry weight in the moming
o Fines measurements o Take solution from headbox and pour thru the 76J.l1l1 filter screen. o Weigh a piece of filter paper o Take the residual fibers that remain on the mesh and pour them onto a
filter paper in a funnel. o Place the filter paper in an ovemight. o Weigh the filter paper the next day twice, to ensure accurate readings.
o Ash content measurements o Weigh 4 crucibles oPiace 1 sample (either process water or wet web) in each dish o Leave in the muffle fumace ovemight at 525°C o Measure oyen-dry weight in the moming.
99