alignment between business environment characteristics
TRANSCRIPT

Alignment between business environment characteristics, competitive priorities, supply
chain structures, and firm business performance
By: Ting Chi, Peter P. D. Kilduff, and Vidyaranya B. Hargeya.
Chi, T., Kilduff, P. D., and Gargeya, V. B. (2009). Alignment between business environment
characteristics, competitive priorities, supply chain structures, and firm business
performance. International Journal of Productivity and Performance Management,
58(7): 645-669.
Made available courtesy of Emerald Group Publishing Limited:
http://dx.doi.org/10.1108/17410400910989467
***© Emerald Group Publishing Limited. Reprinted with permission. No further
reproduction is authorized without written permission from Emerald Group Publishing
Limited. This version of the document is not the version of record. Figures and/or pictures
may be missing from this format of the document. ***
This article is (c) Emerald Group Publishing and permission has been granted for this
version to appear here (https://libres.uncg.edu/ir/uncg/). Emerald does not grant
permission for this article to be further copied/distributed or hosted elsewhere without the
express permission from Emerald Group Publishing Limited.
Abstract:
Purpose
– This paper aims to analyze the relationships between four constructs – business environment
characteristics, competitive priorities, supply chain structures, and firm business performance.
Design/methodology/approach
– By establishing a conceptual model and conducting structural equation modeling analysis using
collected industrial survey data, the study provides a systemic understanding of the relationships
between the individual business environment characteristics, the individual competitive priorities
and supply chain structures, and the impact of alignment between these elements on firm
business performance.
Findings
– Results of the study reveal that the differences in both strategic and supply chain responses to
business environment between high‐ and low‐performing firms in the US textile manufacturing
industry are striking. The findings provide evidence to corroborate the impact of the alignment
between business environment characteristics, competitive priorities, and supply chain structures
on firm business performance.
Originality/value
– A conceptual model linking business environment characteristics, competitive priorities,
supply chain structures, and firm business performance is first proposed and empirically
investigated. The appropriate strategic responses and supply chain structures designed to the

specific business environment characteristics are quantitatively identified. The nature of these
relationships and the effect of alignment are revealed.
Keywords: Strategic alignment | Competitive strategy | Supply chain management | Performance
management
Article:
Introduction
Since the 1980s, accelerated advances in production, communication, information, and
transportation technologies, combined with established free‐market ideology, have made
business environment progressively more turbulent, through more rapid and unpredictable
change, greater diversity, increased complexity, and intensified competitive pressures. Today,
firms are confronting unprecedented radical changes to which they must adapt to survive and
prosper (Dicken, 2007). Given the increasing challenges in the competitive environment, it is
evident that successful firms not only have to perform better than their competitors, but they also
have to constantly adapt to changing conditions (Handfield and Nichols, 1999). These changes
have been widely felt across many sectors of industry and commerce. There is a broadly
accepted view that the success or failure of a firm is ultimately determined by the
competitiveness of its supply chain structure (SCS) (Chopra and Meindl, 2007; Fisher, 1997).
In recent years, there is an increasing effort devoted to the study of alignment (a.k.a. congruency,
consensus, or fit) between SCS and other key factors using conceptual or empirical methods. The
literature embraces that an important corollary of achieving alignment is presumed to be
enhanced business performance of a firm, just as misalignment is expected to undermine its
performance (Chopra and Meindl, 2007). Among the published research on alignment issues,
business environment characteristics (BEC) and firm competitive priorities are two most‐considered factors (e.g. Fine, 1998; Randall et al., 2003; Ward et al., 1996). The theoretical
support for a model linking BEC, competitive priorities, SCS, and firm business performance has
been well established. However, the formal development of a conceptual model and
simultaneous empirical investigation of relationships between all these aspects has been lacking
in the literature. This study aims to fill this gap.
Based on a structured survey instrument, four constructs – BEC, competitive priorities, SCS, and
firm business performance were quantitatively measured by managerial perceptions in the US
textile manufacturing firms. The statistical analyses using structural equation modeling (SEM)
were conducted to examine the proposed conceptual model and test the relationships
(Hypotheses) between these constructs. Overall, this study provides recent evidence of the links
between these four constructs from a sample of US textile manufacturers and identifies the
nature of these relationships and the effect of alignment.
The remainder of this article is organized as follows. The next section reviews the related
literature to provide theoretical foundation for this study, and proposes the hypotheses to be
tested and a conceptual model. Then, in the methodology section, the survey subjects, data sets,
assessment criteria, and analytical methods used to test the hypotheses are described in detail.
Thereafter, the testing results are presented and discussed. The following section presents the
conclusions from the findings and the implications for both academia researchers and industrial
practitioners. Finally, we address the limitations of this study and offer extensions for future
research.
Literature review, hypotheses, and conceptual model
Business environment characteristics
The business environment has long been identified as an important contingency in conceptual
and empirical studies of both competitive strategy and supply chain management (Ward and
Duray, 2000). Ward et al. (1995) suggested that consideration of environmental factors should be
built into virtually all research designs in strategic and operations management. In general terms,
the business environment consists of the myriad of forces that are beyond the control of
management in the short run, and thus pose threats as well as opportunities to firms.
The literature identifies four dimensions that collectively shape the business environment: their
degree of dynamism, complexity, diversity, and munificence (Dess and Beard, 1984; Harris,
2004; Mintzberg, 1979; Ward et al., 1995). These are held to be the most critical dimensions of
the business environment with respect to strategic decision‐making (Lawless and Finch, 1989).
Dynamism refers to the speed and predictability of change in the environment, stemming from
sources such as technological change, demand shifts, and competitive moves. Complexity refers
to the extent that organizations are required to have a great deal of sophisticated knowledge
about products, customers, or any others. Diversity refers to the degree to which an organization
is faced with homogenous or diffuse conditions. Munificence is the degree to which an
environment supports the growth of organizations within it, which relates to the level of
competitive pressures in the environment as exemplified by the intensity of competition and the
bargaining leverage applied on companies by buyers and suppliers. (Harris, 2004; Mintzberg,
1979) Munificence is often measured in a reverse scale as environmental hostility (Ward et al.,
1995). The measurement variables and corresponding scales for BEC are developed based on
previous work and summarized in Table I.
Competitive priorities
Over the last two decades, the acceptance and use of strategic approaches to manage
manufacturing organizations has enjoyed a constant growth. The term “competitive priorities”
has been widely used to describe firms' choice of their competitive capabilities (Hayes and
Wheelwright, 1984). There is a broad agreement that competitive priorities can be generally
expressed in terms of low cost, quality, delivery performance (speed and reliability), and
flexibility (Sarmiento et al., 2008). These items are closely related to the idea of generic
strategies from the business strategy literature (Porter, 1980).
With regard to low cost, although today's firms are increasingly concerned with cost, most do not
compete solely on this basis. Companies that emphasize cost as a competitive priority focus on
lowering production costs, improving productivity, maximizing capacity utilization, and
reducing inventories (Ward et al., 1995). Design, production, distribution, marketing, and service

functions have often been used to measure the quality possessing a firm. Delivery reliability is
the ability to deliver according to a promised schedule. For some types of customers, delivery
speed is also imperative to win the order. Although these two dimensions are separable to some
extent, long run success requires that promises of speedy delivery be kept with a high degree of
reliability (Ward and Duray, 2000). Flexibility in manufacturing firms has traditionally been
achieved at a high cost by using general purpose machinery instead of more efficient special
purpose‐built machinery and by deploying more highly skilled workers than would otherwise be
needed (Ward et al., 1998). In recent years, the implementation of advanced manufacturing
technologies has effectively reduced the cost of achieving flexibility.
The measurement variables selected were originally developed for use in the Boston University
Manufacturing Futures Survey (Miller and Vollmann, 1984). These measures have been
successfully employed in the following studies (e.g. Vickery et al., 1994;Ward et al., 1996) and
have exhibited good reliability. The measurement variables and corresponding scales for
competitive priories are summarized in Table II.
The literature reveals that competitive priorities have close and strong relationships with the
business environment. Traditional contingency literature suggests that the business environment
influences firms' decisions on competitive strategy (Burns and Stalker, 1961; Hambrick,
1983). Ward et al. (1998) indicated that the notion of competitive priorities has long served as a
foundation for strategy research. Therefore, in order to statistically identify how BEC affects
firm competitive priorities the first hypothesis is advanced to test the relationship between BEC
and firm competitive priorities.
H1. There is a significant causal relationship between BEC and firm competitive priorities.

Supply chain structures
A supply chain will exist whether a firm actively manages it or not (Mentzer et al., 2001). In
general, the SCS of a firm influences the nature of supply chain activities, the efficiency and
effectiveness of the supply chain, and relationships with other members within the entire supply
chain. Based on the review of literature, research in SCS issues has been largely independent of
research in organizational structure and design. Previous research primarily focused on the
management improvement, such as logistics and inventory cost minimization (e.g. Stock et al.,
2000). There is little published research on the design of organizational arrangements in SCS,
although Porter (1985) has indicated the importance of appropriate organizational structure for
the value chain and for the firm's overall competitive position.
This study defines and justifies three types of SCS: lean, agile, and hybrid, and identifies the
organizational components associated with each individual structure. Organizational theory
suggests that firms organized to deal with a mature and stable business environment will not be
as effective in a complex, rapidly changing, and unpredictable environment (Gordon and
Narayanan, 1984). This classification characterizes the overall state of SCS and is also consistent
with the mainstream studies on supply chain typology and characteristics (e.g. Fisher,
1997; Huang et al., 2002; Naylor et al., 1999).
A lean SCS is organized to maximize operational efficiency and minimize overall cost. An agile
SCS is organized to achieve flexibility and speed in responding to dynamic market conditions
and customer needs. A firm need not choose to be exclusively lean or exclusively agile in its
SCS. A hybrid SCS combines features of the previous two. Typically, lean organizational
arrangements in a supply chain are used for higher volume product lines that have stable demand
and standardized technologies, while agile arrangements are used for the lower volume product
lines subject to more uncertain demand and innovative technologies (Fine, 1998; Fisher,
1997; Naylor et al., 1999). The measurement variables and corresponding scales for SCS in this

study were developed based on previous studies of supply chain characteristics and
organizational structure and design, which are summarized in Table III.
Compared with the recent intense discussion of the factors that determine what kind of SCS a
firm should implement, Skinner (1974)had conceptualized the need for “strategic consensus” or
“alignment” of competitive priorities throughout an organization. Fine (1998) advocated that the
concurrent selection of the SCS and competitive priorities should be based on specific business
environment conditions. He addressed that when business environment changed firm SCS and
competitive priorities have to be adjusted accordingly. Randall et al. (2003) empirically proved
that the fit between business environment and firms' supply chain selection affects overall
performance. Chopra and Meindl (2007) used the term “strategic fit”, which they say exists only
when both competitive priorities and supply chain have the same goal. Doz and Kosonen
(2008) indicated that in order to maintain continued growth firms need to make efficient and
effective adjustment on organizational strategies and structure to changing business condition.
This study proposes that certain SCS are more appropriate, given the particular characteristics of
the business environment, and that the SCS implemented should be aligned with competitive
priorities on which the firm is focused. In order to statistically determine how BEC and firm
competitive priorities affect firm SCS respectively, H2 and H3 are proposed to test the
relationships between BEC and firm competitive priorities, respectively, with SCS.
H2. There is a significant causal relationship between BEC and SCS.
H3. There is a significant causal relationship between firm competitive priorities and SCS.
Business performance

Typically, firm business performance is measured using financial metrics. Venkatraman
(1990) advocated measures of business performance by return on assets (ROA), operating
income, cost per sales, and sales per number of employees. Jahera and Lloyd (1992) proposed
that return on investment (ROI) is a valid performance measure for midsize firms. Morash et
al. (1996) measured firm performance relative to competitors using ROA, ROI, return on sales
(ROS), ROI growth, ROS growth, and sales growth. Tan et al. (1999) linked certain SCM
practices with firm performance. Performance in their study was measured by senior
management's perceptions of a firm's performance in comparison to that of a major competitor's.
In summary, various key measures of business performance have been used in the literature to
assess the impact of business environment, strategic decisions, and supply chain practices on
firm performance. Based on prior research, in this study, business performance is measured using
the respondent's perception of performance in relation to competitors. The measurement
variables are comprised of market share, sales growth, profit margin, ROI and ROA, which are
summarized in Table IV.
It has been broadly embraced that an important effect of achieving alignment is presumed to
enhance the business performance of a firm, just as misalignment is expected to undermine its
performance (e.g. Tarigan, 2005). Therefore, in order to statistically determine how the
alignment affects firm business performance, H4 is proposed to test the effect of alignment
between BEC, competitive priorities, and SCS on firm business performance.
H4. The alignment between BEC, competitive priorities, and SCS has a significant effect on firm
business performance.
Conceptual model
Based on the review of literature, it is proposed that there is an underlying theme or alignment
between BEC, competitive priorities, and SCS, and this alignment influences firm business
performance. This study focuses on a single time period in which competitive priorities can be
viewed as an antecedent of SCS and BEC are the antecedent to both. The superior business
performance is derived from the achievement of the alignment between these constructs.
A conceptual model is presented for illustrative purposes in Figure 1. It represents the proposed
relationships (hypotheses) between latent constructs: BEC, competitive priorities and SCS of a
firm and, ultimately, the firm business performance. BEC are captured by four first‐order latent
constructs: diversity, complexity, dynamism, and hostility. Firm competitive priorities are also
represented by four first‐order latent constructs: low cost, quality, delivery performance, and
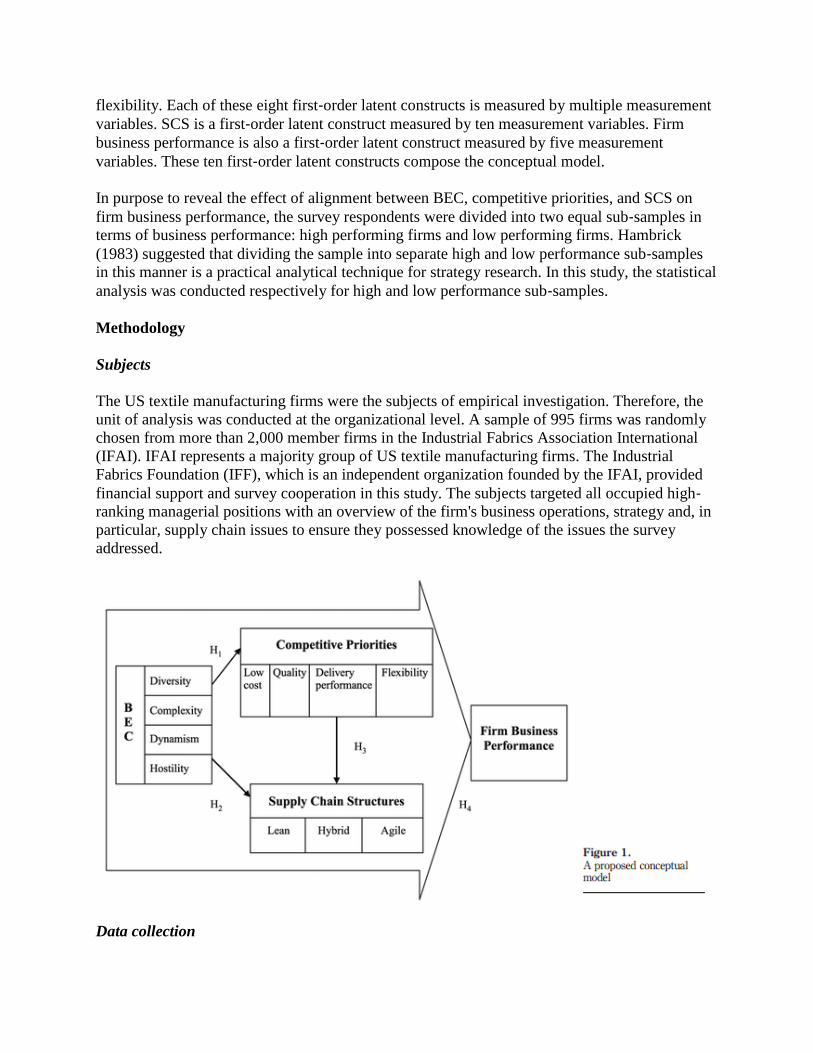
flexibility. Each of these eight first‐order latent constructs is measured by multiple measurement
variables. SCS is a first‐order latent construct measured by ten measurement variables. Firm
business performance is also a first‐order latent construct measured by five measurement
variables. These ten first‐order latent constructs compose the conceptual model.
In purpose to reveal the effect of alignment between BEC, competitive priorities, and SCS on
firm business performance, the survey respondents were divided into two equal sub‐samples in
terms of business performance: high performing firms and low performing firms. Hambrick
(1983) suggested that dividing the sample into separate high and low performance sub‐samples
in this manner is a practical analytical technique for strategy research. In this study, the statistical
analysis was conducted respectively for high and low performance sub‐samples.
Methodology
Subjects
The US textile manufacturing firms were the subjects of empirical investigation. Therefore, the
unit of analysis was conducted at the organizational level. A sample of 995 firms was randomly
chosen from more than 2,000 member firms in the Industrial Fabrics Association International
(IFAI). IFAI represents a majority group of US textile manufacturing firms. The Industrial
Fabrics Foundation (IFF), which is an independent organization founded by the IFAI, provided
financial support and survey cooperation in this study. The subjects targeted all occupied high‐ranking managerial positions with an overview of the firm's business operations, strategy and, in
particular, supply chain issues to ensure they possessed knowledge of the issues the survey
addressed.
Data collection
The survey was conducted in Spring 2006. Among 995 mailed surveys, six were returned due to
incorrect contact information. The adjusted survey sample size was therefore 989. A total of 207
responses were received at the completion of the survey. Some 202 out of 207 returns were
eligible and complete responses. The adjusted response rate was 20.4 per cent (202/989).
Compared to the response rate in the previous industry studies (e.g. Tan et al., 2002; Tracey and
Tan, 2001), this response rate was very satisfactory, particularly in the current dynamic US
textile industry.
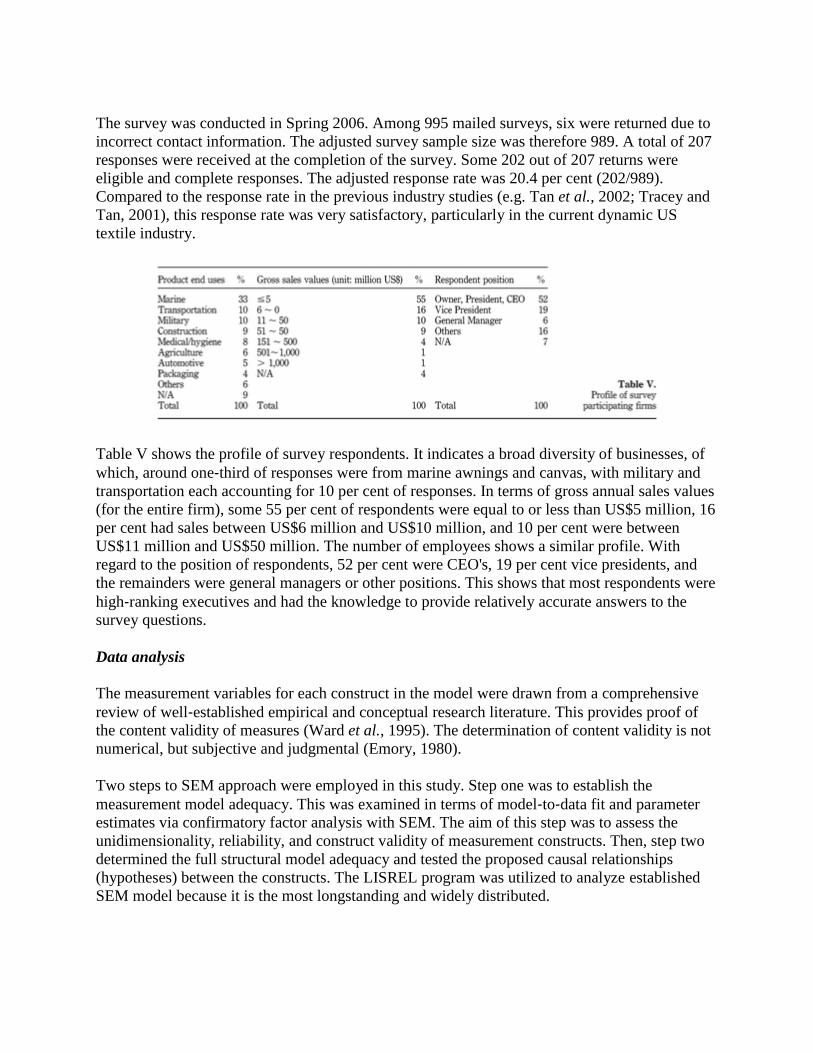
Table V shows the profile of survey respondents. It indicates a broad diversity of businesses, of
which, around one‐third of responses were from marine awnings and canvas, with military and
transportation each accounting for 10 per cent of responses. In terms of gross annual sales values
(for the entire firm), some 55 per cent of respondents were equal to or less than US$5 million, 16
per cent had sales between US$6 million and US$10 million, and 10 per cent were between
US$11 million and US$50 million. The number of employees shows a similar profile. With
regard to the position of respondents, 52 per cent were CEO's, 19 per cent vice presidents, and
the remainders were general managers or other positions. This shows that most respondents were
high‐ranking executives and had the knowledge to provide relatively accurate answers to the
survey questions.
Data analysis
The measurement variables for each construct in the model were drawn from a comprehensive
review of well‐established empirical and conceptual research literature. This provides proof of
the content validity of measures (Ward et al., 1995). The determination of content validity is not
numerical, but subjective and judgmental (Emory, 1980).
Two steps to SEM approach were employed in this study. Step one was to establish the
measurement model adequacy. This was examined in terms of model‐to‐data fit and parameter
estimates via confirmatory factor analysis with SEM. The aim of this step was to assess the
unidimensionality, reliability, and construct validity of measurement constructs. Then, step two
determined the full structural model adequacy and tested the proposed causal relationships
(hypotheses) between the constructs. The LISREL program was utilized to analyze established
SEM model because it is the most longstanding and widely distributed.

Non‐response bias testing. Non‐response bias was evaluated by t‐tests on demographic variables.
As a convention, the responses of early and late groups of returned surveys were compared to
provide support of non‐response bias (Lambert and Harrington, 1990). Results show there are no
significant differences between early and late groups of returned surveys.
High performer sub‐sample and low performer sub‐sample. When measurement variables in the
latent constructs are unidimensional, a single set of composite scores of measurement variables
can be used to represent the latent construct (Ward and Duray, 2000). In this study, the business
performance construct showed unidimensional. The 202 respondents were sorted in descending
order in terms of their mean scores calculated using the five business performance indicators.
The first half of the respondents were designated as relatively high performing firms and the
second half were designated as relatively low performing firms. Each sub‐sample consists of 101
firms.
Factor analysis. Factor analysis using varimax rotation method was utilized to reduce a larger
number of variables to a smaller number of factors. SPSS program was used for factor analysis.
The varimax rotation method is an orthogonal rotation technique and has been widely used in
previous empirical research (e.g. Ward et al., 1998). The extraction criterion was set as
eigenvalue above one. Measurement variables with low factor loadings (less than 0.50) (Comrey,
1973), high cross‐loadings (greater than 0.4), and item‐to‐total correlations (less than 0.3)
(Janda et al., 2002) were excluded from the factor matrices. The deduction of certain
measurement variables required the re‐computation of factor loadings, coefficient alpha, and
item‐to‐total correlations, and also a re‐examination of factor structure using the reduced number
of measurement variables. This iterative procedure was repeated for both the high performer sub‐sample and the low performer sub‐sample until all requirements were met. The final 31 variables
measuring nine latent constructs for both sub‐samples are summarized in Table VI.
Structural equation modeling. Full structural model adequacy is evaluated via hypothesis testing,
model‐to‐data fit, and parameter estimates using path analysis with SEM (Byrne, 1998). The
purpose behind assessing full structural model adequacy is twofold. The first aim is to assess
how well the theoretical model fits the data overall. The other aim is to estimate the structural
relationships among the latent constructs via path analysis (Jöreskog and Sörbom, 1998).
Unidimensionality is a prerequisite to meaningfully interpret reliability (Levine, 2005). In order
to prove unidimensionality, the following criteria should be met:
the first indicator should explain a large proportion of the variance in the constructs (i.e.
> 40 per cent);
subsequent indicators should explain fairly equal proportions of the remaining variance,
except for a gradual decrease;
all or most of the constructs should have sizeable loadings on the first indicator (i.e. >
0.3); and
all or most of the constructs should have higher loadings on the first indicator than on the
subsequent indicators (Carmines and Zeller, 1979).

After all measures showed unidimensionality, the reliabilities were also tested. Cronbach's
coefficient alpha and the construct reliability for each latent construct were calculated
respectively to compare to criterion value. A Cronbach's coefficient alpha of 0.60 and above
suggested adequate reliability (Nunnally, 1978). Construct reliability values of greater than 0.50
indicated adequate reliability (Fornell and Larcker, 1981).
Construct validity consists of convergent validity and discriminant validity. All of the
measurement loadings were significantly high and all of the goodness of fit indices met
recommended values to suggest convergent validity. An additional indication of convergent
validity was the average variance extracted (AVE), which is the percentage of the total variance
of a measure represented or extracted by the variance due to the construct, as opposed to being
due to error (Fornell and Larcker, 1981). The desired threshold for the AVE is 0.5. Discriminant
validity is shown by the confidence interval of two standard errors around the correlation
between each respective pair of factors in the model. If the confidence interval does not include
1.0, then discriminant validity is demonstrated (Anderson and Gerbing, 1988).
Goodness‐of‐fit indices were used to assess the model‐to‐data fit, which is the extent to which
the data matches the proposed model. There are numerous goodness‐of‐fit indices and no single
test best describes the model‐to‐data fit. The most often used measures: normed Chi‐square, the
room mean square error of approximation (RMSEA), the goodness‐of‐fit index (GFI), the
normed fit index (NFI), the non‐normed fit index (NNFI), and the comparative fit index (CFI)
were employed in this study.
Results and discussion
Measurement model testing results
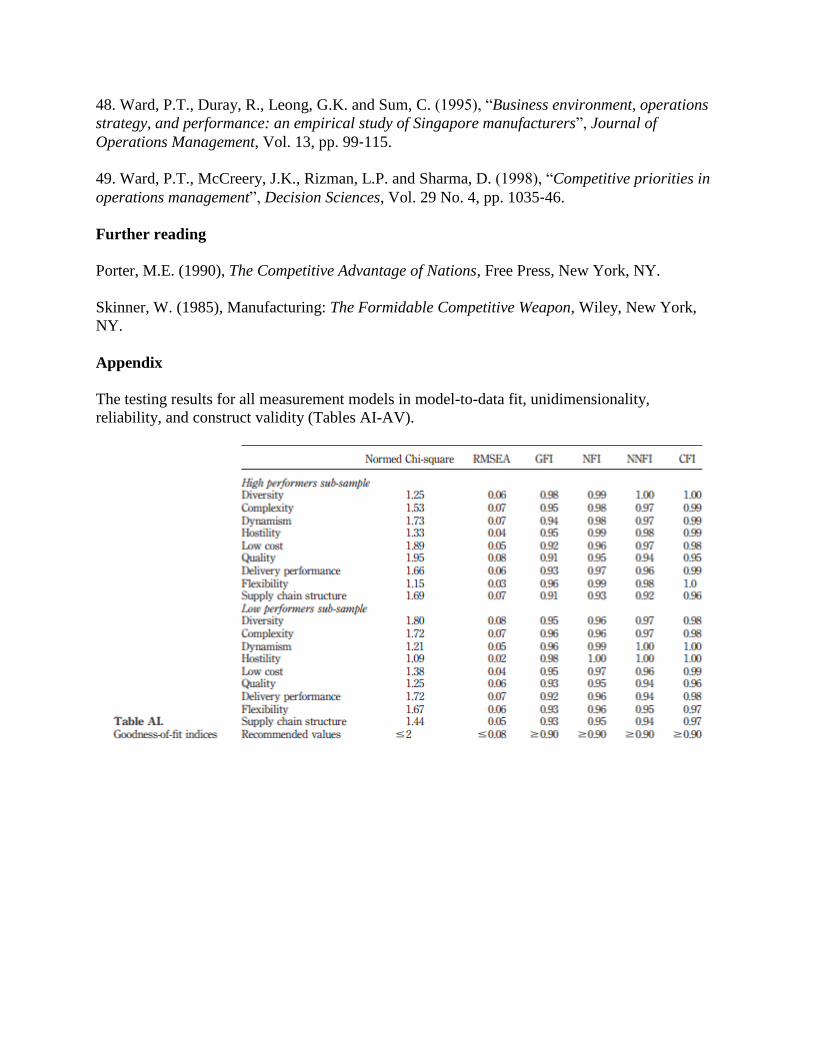
The Appendix (Tables AI‐AV) summarizes the testing results for all measurement models in
model‐to‐data fit, unidimensionality, reliability, and construct validity. The results showed all
measurement models met the model‐to‐data fit requirements for both high and low performer
sub‐samples. The standardized loadings comparisons for each latent construct individually
modeled and that construct in the context of the structural model showed little or no difference in
value, which established the evidences of unidimensionality for both high and low performer
sub‐samples. For both sub‐samples, all latent constructs showed that Cronbach's coefficient
alphas were above 0.60 and construct reliability scores were above 0.70. The evidence of
reliability was established. All of the measurement loadings were significantly high (loadings >
0.50 and t‐values > 1.96) and all of the goodness of fit indices met recommended values,
suggesting convergent validity. Also, the AVE scores for all latent constructs in the both sub‐samples were above the desired threshold of 0.5. None of the confidence intervals (of two
standard errors around the correlation between each respective pair of factors in the model)
capture 1.0. Therefore, the criteria of discriminant validity were met for both sub‐samples.
Structural model testing results
Once unidimensionality, reliability, and construct validity for the measurement models were
demonstrated for both high and low performer sub‐samples, the overall structural model fits for
both high and low performer sub‐samples were tested. Table VIIsummarizes the structural model
goodness of fit indices for both sub‐samples. The results showed that the adequate fit was
achieved.
Then, the full SEM model was run separately for high performers and for low performers data
sets that estimates path coefficients through an iterative process. This process provides the
necessary evaluation criteria to test the significance of the coefficients simultaneously between
all paired latent constructs to confirm the existence of the relationships, and also to establish the
differences in the emphasized strategies and implemented supply chain structure by high and low
performers in the similar environment. Figures 2 and 3 represent the statistically significant
relationships (at p<0.05 level) in the SEM model for high and low performer sub‐samples
respectively.
Discussion
Relationships between BEC and firm competitive priorities
As shown in Figures 2 and 3, in the high performer sub‐sample, the path from environmental
complexity to delivery performance is positive and statistically significant at p<0.05 (path
coefficient=0.32, t‐value=2.16); the path from environmental dynamism to flexibility is positive
and statistically significant at p<0.05 (path coefficient=0.34, t‐value=2.19); and the paths from
environmental hostility to quality, delivery performance, and flexibility, respectively, are

positive and statistically significant at p<0.05 (path coefficient=0.70, t‐value=4.51; path
coefficient=0.46, t‐value=3.65; path coefficient=0.31, t‐value=2.49). The results are consistent
with previous studies (e.g. Porter, 1980; Ward et al., 1995), that differentiation (quality, delivery
performance, and flexibility) is an appropriate strategy in an increasingly complex, dynamic and
hostile environment.
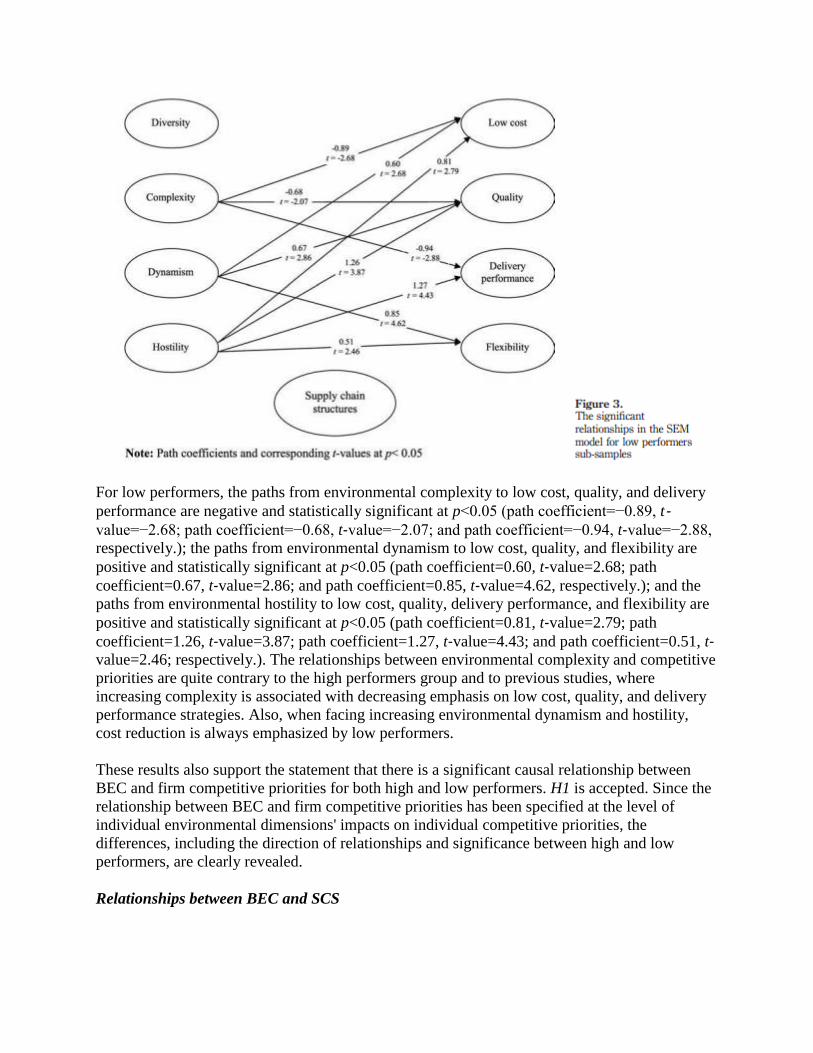
For low performers, the paths from environmental complexity to low cost, quality, and delivery
performance are negative and statistically significant at p<0.05 (path coefficient=−0.89, t‐value=−2.68; path coefficient=−0.68, t‐value=−2.07; and path coefficient=−0.94, t‐value=−2.88,
respectively.); the paths from environmental dynamism to low cost, quality, and flexibility are
positive and statistically significant at p<0.05 (path coefficient=0.60, t‐value=2.68; path
coefficient=0.67, t‐value=2.86; and path coefficient=0.85, t‐value=4.62, respectively.); and the
paths from environmental hostility to low cost, quality, delivery performance, and flexibility are
positive and statistically significant at p<0.05 (path coefficient=0.81, t‐value=2.79; path
coefficient=1.26, t‐value=3.87; path coefficient=1.27, t‐value=4.43; and path coefficient=0.51, t‐value=2.46; respectively.). The relationships between environmental complexity and competitive
priorities are quite contrary to the high performers group and to previous studies, where
increasing complexity is associated with decreasing emphasis on low cost, quality, and delivery
performance strategies. Also, when facing increasing environmental dynamism and hostility,
cost reduction is always emphasized by low performers.
These results also support the statement that there is a significant causal relationship between
BEC and firm competitive priorities for both high and low performers. H1 is accepted. Since the
relationship between BEC and firm competitive priorities has been specified at the level of
individual environmental dimensions' impacts on individual competitive priorities, the
differences, including the direction of relationships and significance between high and low
performers, are clearly revealed.
Relationships between BEC and SCS

As shown in Figures 2 and 3, in the high performer sub‐sample, the path from environmental
dynamism to SCS is positive and statistically significant at p<0.05 (path coefficient=0.28, t‐value=1.99). Among the four environmental dimensions, dynamism has the most significant
impact on SCS. Increasing environmental dynamism prompts firms to implement more agile
SCS that is focused on responsiveness. For low performers, there is no significant evidence in
the data that demonstrates environmental characteristics influence the SCS firms implemented.
In other words, there is a disconnection between BEC and SCS.
The results suggest that the statement that there is a significant causal relationship between BEC
and SCS can be accepted for high performers but rejected for low performers. It indicates
that H2 should be only valid for high performers and the positively causal relationship is from
environmental dynamism to SCS.
Relationships between firm competitive priorities and SCS
As shown in Figures 2 and 3, in the high performers sub‐sample, the path from low cost to SCS
is negative and statistically significant at p<0.05 (path coefficient=−0.43, t‐value=−3.84); and the
path from flexibility to SCS is positive and statistically significant at p<0.05 (path
coefficient=0.44, t‐value=4.00). Among the four competitive priorities, low cost and flexibility
have the most significant impacts on SCS. A low cost emphasis is associated with a leaner SCS,
while a flexibility emphasis is associated with a more agile SCS. The results are consistent with
previous studies (e.g. Fine, 1998), which indicated that a lean SCS is appropriate for a cost
reduction strategy, while an agile supply chain structure is appropriate for a differentiation‐based
strategy. For low performers, there is no significant evidence that demonstrates competitive
priorities influence the SCS that firms implemented. In other words, the SCS implemented in low
performers are not closely related to the strategies they emphasized.
The results suggest that the statement that there is a significant causal relationship between firm
competitive priorities and SCS is only accepted by high performers but denied by low
performers. It indicates that H3 should be only valid for high performers. The positive causal
relationship is from flexibility to SCS, while from low cost to SCS there is a negative causal
relationship.
Relationships between alignment and firm business performance
As one of the most important advantages of SEM, all possible causal relationships between latent
constructs are tested simultaneously. The significant paths between paired constructs in the
model imply the simultaneous existence of relationships and a corresponding set of responses in
strategy and SCS to managerial perceived BEC. The differences based on the results of SEM
analysis between the high and low performers are clearly revealed as seen in the Figure 4.
When the alignment between BEC, firm competitive priorities and SCS is achieved, the firms
exhibit relatively high business performance; otherwise, relatively low performance follows. In
addition, the variance of SCS (R2) for high performers sub‐sample is 0.70, which means 70 per
cent of the variance of SCS can be accounted for by BEC and firm competitive priorities. In
contrast, the variance of SCS (R2) for low performers is only 0.20, which indicates that the SCS
implemented in the low performing firms is significantly influenced by factors other than BEC
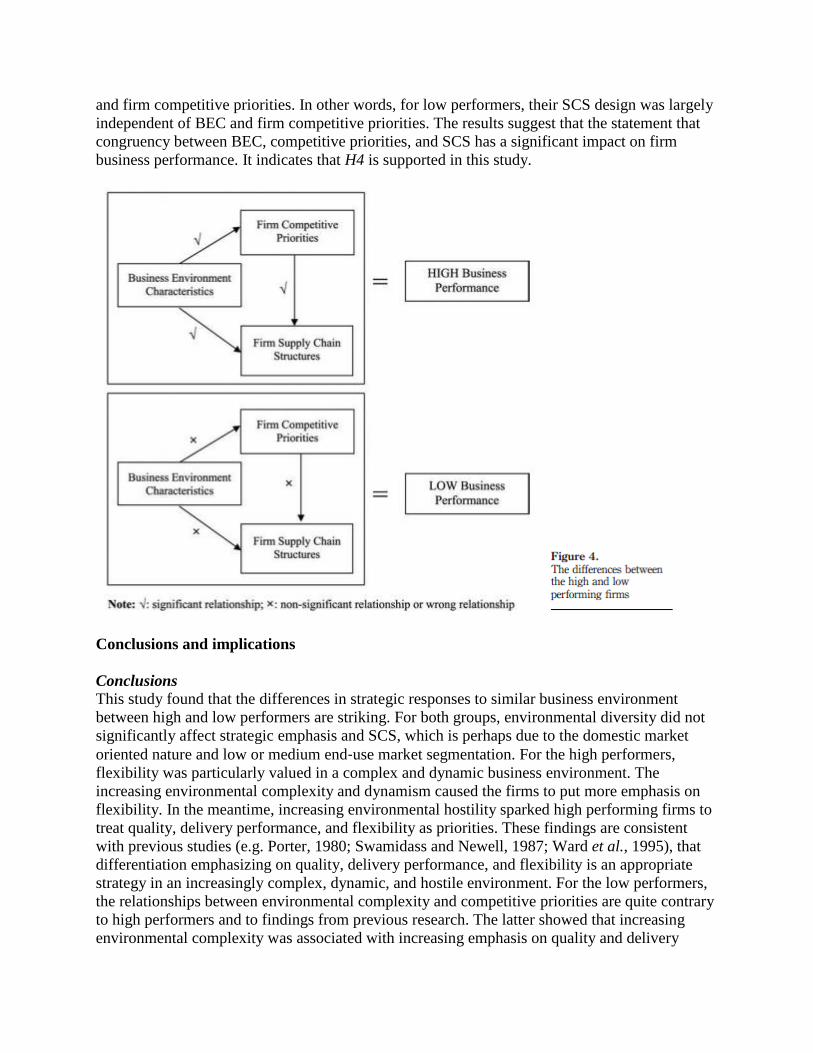
and firm competitive priorities. In other words, for low performers, their SCS design was largely
independent of BEC and firm competitive priorities. The results suggest that the statement that
congruency between BEC, competitive priorities, and SCS has a significant impact on firm
business performance. It indicates that H4 is supported in this study.
Conclusions and implications
Conclusions This study found that the differences in strategic responses to similar business environment
between high and low performers are striking. For both groups, environmental diversity did not
significantly affect strategic emphasis and SCS, which is perhaps due to the domestic market
oriented nature and low or medium end‐use market segmentation. For the high performers,
flexibility was particularly valued in a complex and dynamic business environment. The
increasing environmental complexity and dynamism caused the firms to put more emphasis on
flexibility. In the meantime, increasing environmental hostility sparked high performing firms to
treat quality, delivery performance, and flexibility as priorities. These findings are consistent
with previous studies (e.g. Porter, 1980; Swamidass and Newell, 1987; Ward et al., 1995), that
differentiation emphasizing on quality, delivery performance, and flexibility is an appropriate
strategy in an increasingly complex, dynamic, and hostile environment. For the low performers,
the relationships between environmental complexity and competitive priorities are quite contrary
to high performers and to findings from previous research. The latter showed that increasing
environmental complexity was associated with increasing emphasis on quality and delivery

performance. However, for low performers, it was found that, as well as low cost, quality and
delivery performance priorities were also highly valued in a less complex environment. What is
more, when facing increasing environmental dynamism and hostility, low performing firms
showed an approximately equal emphasis among all four strategies. In contrast, high performers
responded with a differentiation focus. Porter (1985) pointed out that simultaneous emphasis on
both cost and differentiation is dangerous and causes poor performance.
The SCS responses to similar business environment from high and low performers were also
significantly different. For the high performers, all four environmental dimensions had some
influence on firm SCS, but only dynamism had a statistically significant impact. Increasing
environmental dynamism prompted firms to implement agile SCS. The result meshes with the
statement of previous research (e.g. Fisher, 1997), that agile SCS is appropriate in a more
dynamic environment and allows firms to react more effectively to uncertainties and marketplace
changes. For the low performers, there were no significant linkages between all four
environmental dimensions and the SCS that firms implemented. This disconnection between
business environment and selection of SCS could be one reason for the lower business
performance of these firms.
With regard to the relationships between competitive priorities and SCS, the findings for high
and low performers were again significantly different. For the high performers, the competitive
priorities of low cost and flexibility had the most significant impact on the firm SCS. A low cost
emphasis was associated with a SCS emphasizing leanness, while a flexibility emphasis was
associated with a SCS oriented towards agility. These results are consistent with previous studies
(e.g. Fisher, 1997), which found that a lean SCS is appropriate for a cost reduction strategy while
an agile SCS is appropriate for a flexibility strategy. For low performers, there was no significant
evidence that demonstrated firm competitive priorities influenced their SCS. This disconnection
between firm competitive priorities and SCS could be another possible explanation for the lower
business performance of these companies.
The linkages between BEC, firm competitive priorities, and SCS in high performers were close
and statistically significant. The most of the variance in SCS could be accounted for by BEC and
firm competitive priorities. This indicates that high performing firms designed their supply chain
structures with close consideration of BEC and competitive priorities. In contrast, the SCS of low
performing firms were designed independently of BEC they faced and competitive priorities they
emphasized. The most of the variance in SCS was not determined by BEC and competitive
priorities. The findings of this study provide solid evidence to corroborate the impact of the
alignment among these three elements on business performance. Thus, it is advanced that, from
the long‐term perspective, competitive benefits of supply chain investments are not only derived
from investments in state‐of art technology alone but also may be realized only if alignment
exists among SCS, competitive priorities and BEC; otherwise, a dissonance among these
constituent elements could only result in conflicting capabilities and wasted resources,
consequently, firms will not realize the complete benefits offered by supply chain investments.
Overall, this study was built on previous theoretical and empirical research. It contributes to the
existing body of literature in four ways. First, despite theoretical support for a model linking
business environment, competitive priorities, SCS, and business performance, a simultaneous
empirical investigation of all of these aspects has been lacking. The study addressed this
deficiency in the literature and developed a model linking all of these constructs. Second, it
developed a reliable and valid survey instrument for measuring all these constructs. A
measurement model for capturing BEC in four dimensions, namely diversity, complexity,
dynamism, and hostility, was first proposed and validated in this study. Third, the lean, hybrid
and agile SCS classification was proposed. The organizational components of these structures
were developed and tested. The results showed the measurement was effective. Lean, hybrid, and
agile SCS can be empirically investigated to further the development of supply chain design and
management theory. Much of the literature to date is mainly conceptual with little empirical
support. Fourth, by establishing conceptual model and developing SEM analysis, the study
provides a systemic understanding of the relationships between the individual environmental
dimensions, the individual competitive priorities and SCS, and the alignment impacts on firm
business performance. The appropriate strategic responses and SCS design to the specific BEC
were identified. The sequence of misalignment between these elements was quantified revealed.
It is expected that this study will provide the springboard for further research related to these
critical issues. Furthermore, the transition happening in the US textile manufacturing sector is an
epitome of the entire US manufacturing industry, the findings from this study could codified and
made transparent and the methodology may, therefore, be transferred to studies targeting other
firms and market sectors.
Implications
As the US textile market continues to experience increasing international competition, dynamic
market needs and continuous technological change, the business environment facing US textile
manufacturers is likely to become increasingly dynamic, complex, diverse and hostile. Under
such turbulent conditions, the configuration and deployment of effective strategies and
appropriate SCS is imperative to achieve superior business performance, and perhaps, even to
survive. This work suggests that it is necessary for firms to understand the characteristics of the
environment in which they operate and the appropriate configuration of strategies and SCS that
will make them most effective in responding to this environment. Further, they should be
constantly monitoring the environment for shifts to achieve timely adjustment of this
configuration.
The differentiation strategies emphasizing quality, delivery, and flexibility are particularly
valued in the increasingly diverse, complex, dynamic, and hostile environments, and
corresponding supply chain structure should be agile or mostly agile focused. The simultaneous
emphasis on both cost and differentiation is dangerous and could only cause lower performance.
A dissonance among these constituent elements could result in conflicting capabilities and
wasted resources and fail to maximize the profitability from supply chain investments.
Overall, the study provides a basis for modeling alternative business environment‐competitive
priorities‐supply chain structure configurations to optimize firm business performance. This
knowledge can assist firms in enhancing their competitiveness through improvements in their
choice of competitive priorities and the design of supply chain structures.
Limitations and future research

This study overcame some limitations exhibited in the previous research by using a well‐developed survey instrument, an effective industrial survey strategy and the application of SEM
techniques for data analysis; however, there are still several limitations that need to be addressed.
First of all, one of most obvious limitations is that the data analyzed in this study is based on
managers' self‐perceptive answers. Although most respondents were senior executives and the
questions were articulately designed, bias, arising from respondent subjectivity and
misunderstanding could not be completely avoided. In future studies, more objective measures
based on secondary evidence may be included as complementary information. Second, this study
presents an analysis of relationships at a single point in time. Since the business environment is
constantly changing, longitudinal follow‐up studies should be designed to identify these changes
and re‐examine whether and how these relationships are changing. Third, although the sub‐sample analysis is within the acceptable range for SEM (the model is still over‐identified for
both high and low performers groups), the sample size is relatively small. This is moderated to
some extent by the approximately normal distributions of most measurement variables. While
the results derived from SEM analysis are promising and exciting, the inferences should be
viewed with some caution until further empirical studies confirm these findings. Finally, since a
firm has less control over its suppliers' and customers' supply chains, compared to its own supply
chain, this study addressed the issues of a firm's intra SCS, competitive priorities and
performance, rather than its extended SCS, which also includes the firm's suppliers' and
customers' SCSs. It is true that the overall alignment across a firm's extended supply chain would
be very desirable and help researchers and practitioners understand the full picture. This
extension will pose significant difficulties for statistical analysis but case study could be a
possible method.
References
1. Anderson, J.C. and Gerbing, D.W. (1988), “Structural equation modeling in practice: a
review and recommended two‐step approach”, Psychological Bulletin, Vol. 103 No. 2, pp. 411‐23.
2. Burns, T. and Stalker, G.M. (1961), The Management of Innovation, Tavistock
Publications, London.
3. Byrne, B. (1998), Structural Equation Modeling with LISREL, PRELIS, & SIMPLIS: Basic
Concepts, Applications, & Programming, Lawrence Erlbaum Associates, Mahwah, NJ.
4. Carmines, E.G. and Zeller, R.A. (1979), Reliability and Validity Assessment, Sage, Beverly
Hills, CA.
5. Cherrington, D.J., Bischoff, S.J., Dyer, W.G., Stephan, E.G. and Stewart,
G.L. (2001), Organizational Effectiveness, Brigham Young University Press, Provo, UT.
6. Chopra, S. and Meindl, P. (2007), Supply Chain Management: Strategy, Planning, &
Operation, 3rd ed.,Prentice‐Hall, Englewood Cliffs, NJ.

7. Comrey, A.L. (1973), A First Course in Factor Analysis, Academic Press, New York, NY.
8. Dess, G.G. and Beard, D.W. (1984), “Dimensions of organizational task
environments”, Administrative Science Quarterly, Vol. 29 No. 1, pp. 52‐73.
9. Dicken, P. (2007), Global Shift, 5th ed., The Guilford Press, New York, NY.
10. Doz, Y. and Kosonen, M. (2008), Fast Strategy, Wharton School Publishing/Pearson
Education, Harlow.
11. Emory, C.W. (1980), Business Research Methods, Richard D. Irwin, Homewood, IL.
12. Fine, C.H. (1998), Clock Speed‐winning Industry Control in the Age of Temporary
Advantage, Perseus Books, Reading, MA.
13. Fisher, M.L. (1997), “What is the right supply chain for your product?”, Harvard Business
Review, Vol. 75 No. 2, pp. 105‐16.
14. Fornell, C. and Larcker, D.F. (1981), “Evaluating structural equation models with
unobservable variables and measurement error”, Journal of Marketing Research, Vol. 18,
pp. 39‐50.
15. Gordon, L. and Narayanan, V.K. (1984), “Management accounting systems, perceived
environmental uncertainty and organizational structure: an empirical
investigation”, Accounting, Organizations and Society, Vol. 9, pp. 33‐47.
16. Hambrick, D.C. (1983), “Some tests of the effectiveness and functional attributes of Miles
and Snow's strategic types”, Academy of Management Journal, Vol. 26 No. 1, pp. 5‐26.
17. Handfield, R.B. and Nichols, E.L. Jr (1999), Introduction to Supply Chain
Management, Prentice‐Hall,Upper Saddle River, NJ.
18. Harris, R.D. (2004), “Organizational task environments: an evaluation of convergent and
discriminant validity”, Journal of Management Studies, Vol. 41 No. 5, pp. 857‐82.
19. Hayes, R.H. and Wheelwright, S.C. (1984), Restoring Our Competitive Edge: Competing
through Manufacturing, Wiley, New York, NY.
20. Huang, S.H., Uppal, M. and Shi, J. (2002), “A product driven approach to manufacturing
supply chain selection”, Supply Chain Management, Vol. 7 No. 4, pp. 189‐99.
21. Jahera, J.S. and Lloyd, W.P. (1992), “Additional evidence on the validity of ROI as a
measure of business performance”, The Mid‐Atlantic Journal of Business, Vol. 28 No. 1,
pp. 105‐20.
22. Janda, S., Trocchia, P.J. and Gwinner, K.P. (2002), “Consumer perceptions of internet retail
service quality”, International Journal of Service Industry Management, Vol. 13 No. 5, pp. 412‐31.
23. Jöreskog, K.G. and Sörbom, D. (1998), LISREL 8: Structural Equation Modeling with the
SIMPLIS Command Language, Scientific Software International, Chicago, IL.
24. Lambert, D.M. and Harrington, T.C. (1990), “Measuring non‐response bias in customer
service mail surveys”, Journal of Business Logistics, Vol. 11 No. 2, pp. 5‐25.
25. Lawless, M.W. and Finch, L.K. (1989), “Choice and determinism: a test of Hrebiniak and
Joyce's framework on strategy‐environment fit”, Strategic Management Journal, Vol. 10 No. 4,
pp. 351‐65.
26. Levine, T.R. (2005), “Confirmatory factor analysis and scale validation in communication
research”,Communication Research Reports, Vol. 22 No. 4, pp. 335‐8.
27. Mentzer, J.T., DeWitt, W., Keebler, J., Min, S., Nix, N., Smith, C. and Zacharia, Z. (2001),
“Defining supply chain management”, Journal of Business Logistics, Vol. 22 No. 2, pp. 1‐25.
28. Miller, J.G. and Vollmann, T.E. (1984), North American Manufacturers Survey: Summary of
Survey Responses, Boston University Manufacturing Roundtable Report Series, Boston, MA.
29. Mintzberg, H. (1979), The Structuring of Organizations, Prentice‐Hall, Englewood Cliffs,
NJ.
30. Morash, E.A., Dröge, C.L.M. and Vickery, S.K. (1996), “Strategic logistics capabilities for
competitive advantage and firm success”, Journal of Business Logistics, Vol. 17, pp. 1‐22.
31. Naylor, J.B., Naim, M.M. and Berry, D. (1999), “Leagility: integrating the lean and agile
manufacturing paradigms in the total supply chain”, International Journal of Production
Economics, Vol. 62 No. 1, pp.107‐18.
32. Nunnally, J.C. (1978), Psychometric Theory, 2nd ed., McGraw‐Hill, New York, NY.
33. Porter, M.E. (1980), Competitive Strategy, Free Press, New York, NY.
34. Porter, M.E. (1985), Competitive Advantage: Creating and Sustaining Superior
Performance, Free Press,New York, NY.
35. Randall, T., Morgan, R.M. and Morton, A.R. (2003), “Efficient versus responsive supply
chain choice: an empirical examination of influential factors”, Journal of Product Innovation
Management, Vol. 20, pp.430‐43.

36. Sarmiento, R., Knowles, G. and Byrne, M. (2008), “Strategic consensus on manufacturing
competitive priorities: a new methodology and proposals for research”, Journal of
Manufacturing Technology Management, Vol. 19 No. 7, pp. 830‐43.
37. Skinner, W. (1974), “The focused factory”, Harvard Business Review, Vol. 52 No. 3,
pp. 113‐21.
38. Stock, G.N., Greis, N.P. and Kasarda, J.D. (2000), “Enterprise logistics and supply chain
structure: the role of fit”, Journal of Operations Management, Vol. 18, pp. 531‐47.
39. Swamidass, P.M. and Newell, W.T. (1987), “Manufacturing strategy, environmental
uncertainty and performance: a path analytic model”, Management Science, Vol. 33 No. 4,
pp. 509‐24.
40. Tan, K.C., Lyman, S.B. and Wisner, J.D. (2002), “Supply chain management: a strategic
perspective”,International Journal of Operations & Production Management, Vol. 22 No. 6,
pp. 614‐31.
41. Tan, K.C., Kannan, V.R., Handfield, R.B. and Ghosh, S. (1999), “Supply chain management:
an empirical study of its impact on performance”, International Journal of Operations &
Production Management, Vol. 19 No. 10, pp. 1034‐52.
42. Tarigan, R. (2005), “An evaluation of the relationship between alignment of strategic
priorities and manufacturing performance”, International Journal of Management, Vol. 22 No.
4, pp. 586‐97.
43. Tracey, M. and Tan, C.L. (2001), “Empirical analysis of supplier selection and involvement,
customer satisfaction and firm performance”, Supply Chain Management: An International
Journal, Vol. 6 No. 4, pp. 174‐88.
44. Venkatraman, N. (1990), “Performance implications of strategic coalignment: a
methodological perspective”, Journal of Management Studies, Vol. 27, pp. 19‐41.
45. Vickery, S.K., Dröge, C. and Markland, R.E. (1994), “Strategic production competence:
convergent, discriminant, and predictive validity”, Production and Operations Management,
Vol. 3 No. 4, pp. 308‐18.
46. Ward, P.T. and Duray, R. (2000), “Manufacturing strategy in context: environment,
competitive strategy and manufacturing strategy”, Journal of Operations Management, Vol. 18
No. 2, pp. 123‐38.
47. Ward, P.T., Bickford, D.J. and Leong, G.K. (1996), “Configurations of manufacturing
strategy, business strategy, environment and structure”, Journal of Management, Vol. 22 No. 4,
pp. 597‐627.
48. Ward, P.T., Duray, R., Leong, G.K. and Sum, C. (1995), “Business environment, operations
strategy, and performance: an empirical study of Singapore manufacturers”, Journal of
Operations Management, Vol. 13, pp. 99‐115.
49. Ward, P.T., McCreery, J.K., Rizman, L.P. and Sharma, D. (1998), “Competitive priorities in
operations management”, Decision Sciences, Vol. 29 No. 4, pp. 1035‐46.
Further reading
Porter, M.E. (1990), The Competitive Advantage of Nations, Free Press, New York, NY.
Skinner, W. (1985), Manufacturing: The Formidable Competitive Weapon, Wiley, New York,
NY.
Appendix
The testing results for all measurement models in model-to-data fit, unidimensionality,
reliability, and construct validity (Tables AI-AV).


About the authors
Ting Chi is an Assistant Professor at Washington State University. His research area is
operations and supply chain management in the textile and apparel industries. He is the
corresponding author and can be contacted at: [email protected]
Peter P.D. Kilduff is a Professor at California State Polytechnic University at Pomona. He
specializes in the analysis of relationships between environment, strategy, structure and business
performance in the fiber, textiles and apparel fields.
Vidyaranya Gargeya is a Professor at The University of North Carolina at Greensboro. His
research interests include operations strategy, planning and control, total quality management
and continuous improvement systems, just‐in‐time manufacturing, and information systems for
operations management.