aligning a large system around studer group · pdf file 3 © 2009 studer group 663,328...
TRANSCRIPT

1 © 2009 Studer Groupwww.studergroup.com
CME Disclosure
• Accreditation Statement– Studer Group is accredited by the Accreditation Council for
Continuing Medical Education (ACCME) to provide continuing medical d i f h i i education for physicians.
• Designation of Credit– Studer Group designates this educational event for a maximum of 12
AMA PRA Category 1 Credits™. Physicians should only claim credit commensurate with the extent of their participation in the educational event.
• Disclosure Policy• Disclosure Policy– Debra S. Landers has disclosed that she does not have any relevant
financial relationships with any commercial interests related to the content of this educational event.
Aligning a Large System around Studer Group Principles
Debra S. LandersVP and Chief Marketing Officer,
Community Health SystemsCommunity Health SystemsNashville, TN
2 © 2009 Studer Groupwww.studergroup.com
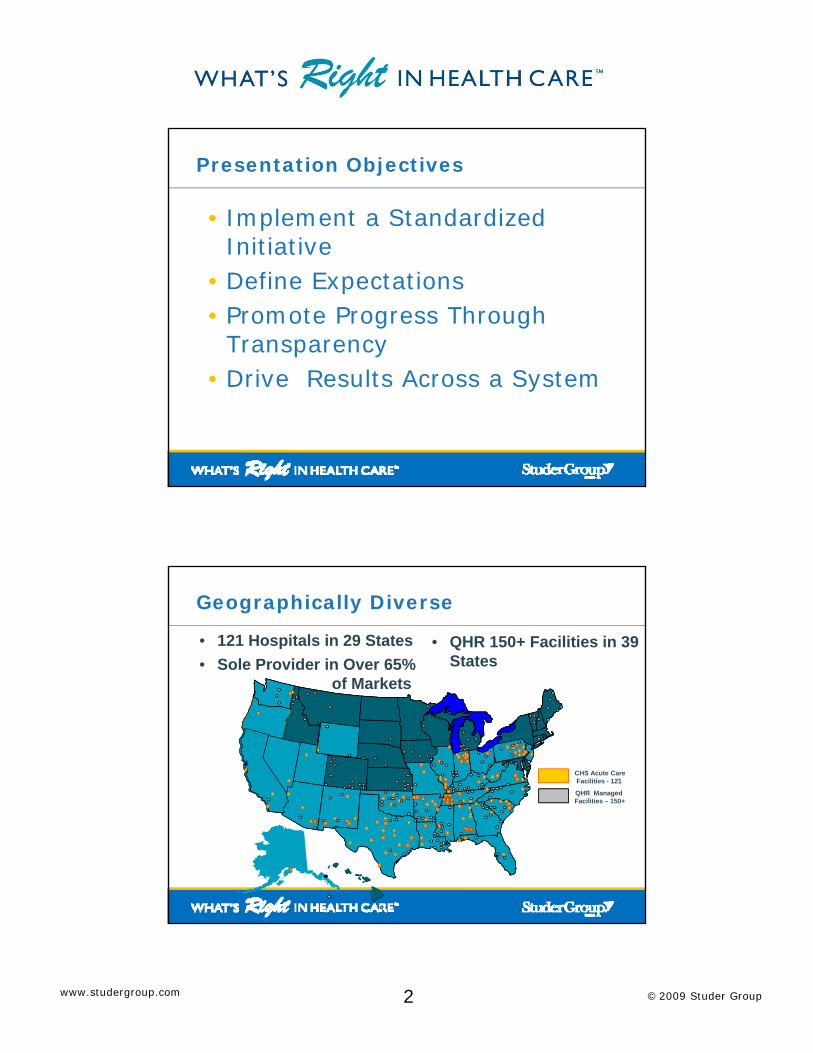
Presentation Objectives
• Implement a Standardized InitiativeInitiative
• Define Expectations• Promote Progress Through
Transparency• Drive Results Across a System
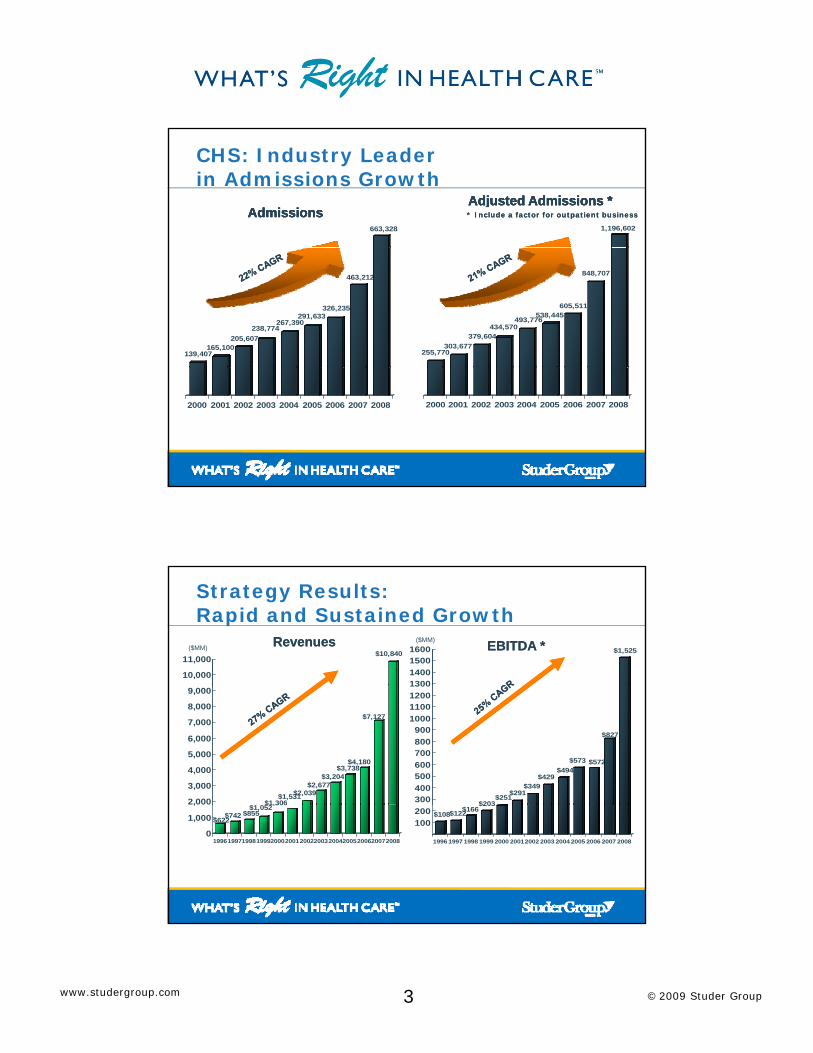
• 121 Hospitals in 29 States• Sole Provider in Over 65%
of Markets
• QHR 150+ Facilities in 39 States
Geographically Diverse
QHR Managed Facilities – 150+
CHS Acute CareFacilities - 121
of Markets
3 © 2009 Studer Groupwww.studergroup.com
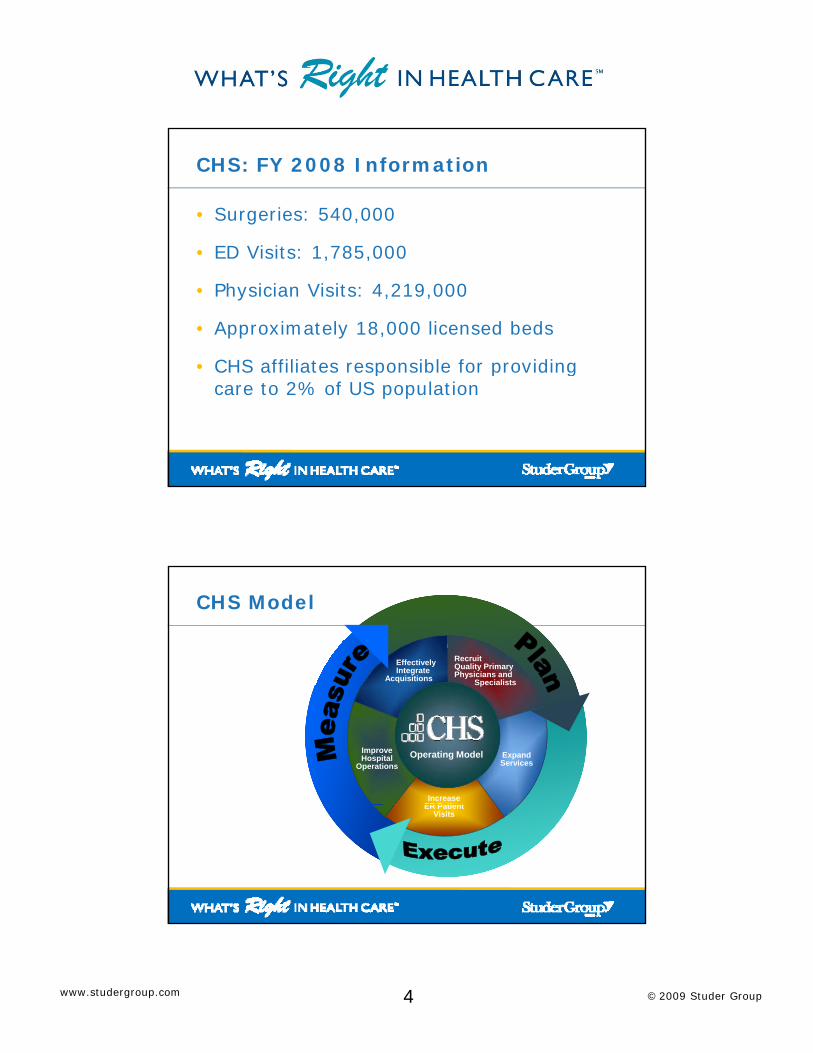
1,196,602663,328
AdmissionsAdmissionsAdmissionsAdmissionsAdjustedAdjusted Admissions *Admissions *AdjustedAdjusted Admissions *Admissions ** Include a factor for outpatient business* Include a factor for outpatient business
CHS: Industry Leader in Admissions Growth
255,770303,677
379,604434,570
493,776538,445
605,511
848,707
139,407165,100
205,607238,774
267,390291,633
326,235
463,212
2000 2001 2002 2003 2004 2005 2006 2007 20082000 2001 2002 2003 2004 2005 2006 2007 2008
$1,525
1300140015001600($MM)
$10,840
10,000
11,000
RevenuesRevenues EBITDA *EBITDA *($MM)
Strategy Results: Rapid and Sustained Growth
$203$251$291
$349$429
$494$573 $572
$827
300400500600700800900
1000110012001300
$ $1,306$1,531$2,039
$2,677$3,204
$3,738$4,180
$7,127
2,000
3,000
4,000
5,000
6,000
7,000
8,000
9,000
$108$122$166$203
100200
1996 1997 1998 1999 2000 20012002 2003 2004 2005 2006 2007 2008
$622$742 $855$1,052$1,306
0
1,000
,
1996199719981999200020012002200320042005200620072008
4 © 2009 Studer Groupwww.studergroup.com
CHS: FY 2008 Information
• Surgeries: 540,000
ED Vi it 1 785 000• ED Visits: 1,785,000
• Physician Visits: 4,219,000
• Approximately 18,000 licensed beds
• CHS affiliates responsible for providing • CHS affiliates responsible for providing care to 2% of US population
CHS Model
Recruit Quality PrimaryPhysicians and
Specialists
EffectivelyIntegrate
Acquisitions Spec a sts
Improve Hospital
Operations
IncreaseER Patient
ExpandServices
Operating Model
ER PatientVisits
5 © 2009 Studer Groupwww.studergroup.com
All Aboard
Community Cares…
A culture that is creating great places for employees to work places for employees to work,
physicians to practice and patients to receive care.

6 © 2009 Studer Groupwww.studergroup.com
Systemwide Approach
• Drive results across the scorecard for each CHS hospital
• Adopt best practices and standardize approaches so we all get better
• Infuse proven Studer Group tactics and tools into the Community Cares culture
• Reduce turnover• Improve employee, physician and patient
satisfaction• Grow volumes
Company Dashboard
7 © 2009 Studer Groupwww.studergroup.com
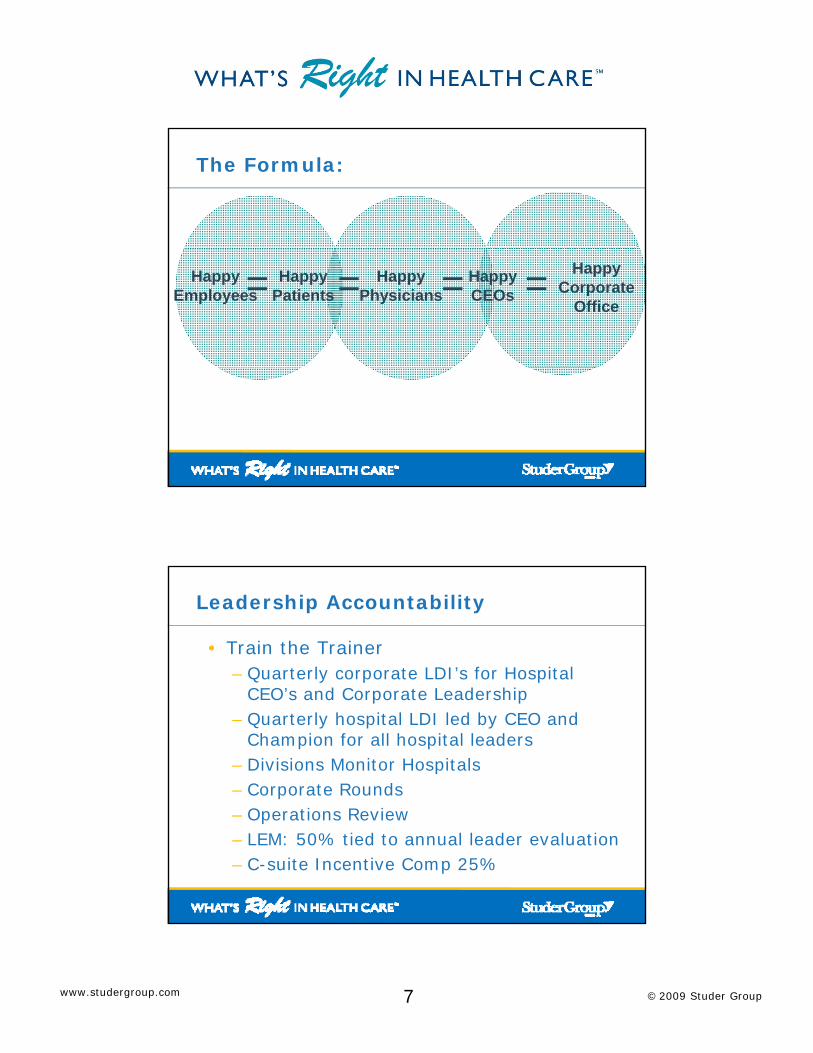
The Formula:
Happy Employees == Happy
PatientsHappy
Physicians= =Happy CEOs
Happy Corporate
Office
Leadership Accountability
• Train the Trainer– Quarterly corporate LDI’s for Hospital
CEO’s and Corporate Leadership – Quarterly hospital LDI led by CEO and
Champion for all hospital leaders– Divisions Monitor Hospitals– Corporate Rounds– Operations Review– LEM: 50% tied to annual leader evaluation– C-suite Incentive Comp 25%
8 © 2009 Studer Groupwww.studergroup.com
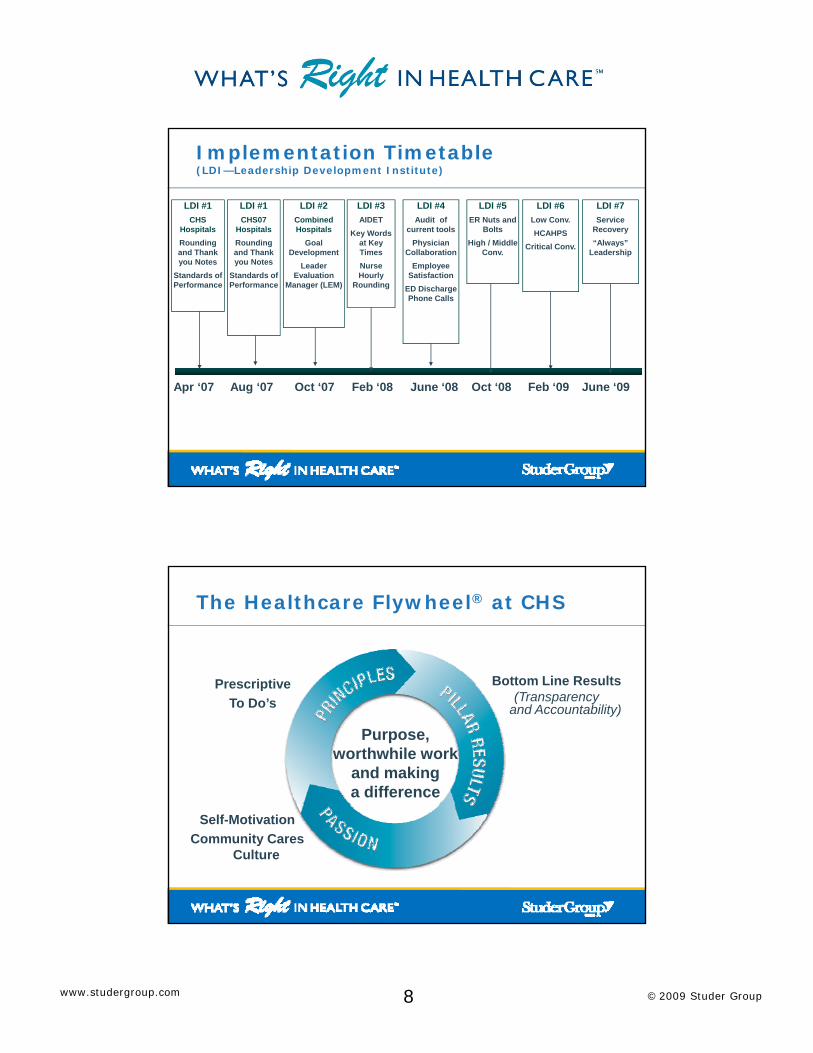
Implementation Timetable(LDI—Leadership Development Institute)
LDI #1CHS
HospitalsRounding
LDI #1CHS07
HospitalsRounding
LDI #2Combined Hospitals
Goal
LDI #3AIDET
Key Words at Key
LDI #4Audit of
current toolsPhysician
LDI #5ER Nuts and
BoltsHigh / Middle
LDI #6Low Conv.HCAHPS
Critical Conv
LDI #7Service
Recovery“Always”
and Thank you Notes
Standards of Performance
and Thank you Notes
Standards of Performance
DevelopmentLeader
Evaluation Manager (LEM)
TimesNurse Hourly
Rounding
CollaborationEmployee
SatisfactionED Discharge Phone Calls
Conv.Critical Conv.
Leadership
Apr ‘07 Aug ‘07 Oct ‘07 Feb ‘08 June ‘08 Oct ‘08 Feb ‘09 June ‘09
The Healthcare Flywheel® at CHS
Bottom Line ResultsPrescriptive
Purpose, worthwhile work
and makinga difference
Bottom Line Results(Transparency
and Accountability)
PrescriptiveTo Do’s
Self-MotivationCommunity Cares
Culture

9 © 2009 Studer Groupwww.studergroup.com
Bottom Line Results for CHS
PeopleCustomer
ServiceClinical Quality
Financial Successful Growth
Patient Satisfaction:
Percentile Ranking vs.
National Database
Core Measures
Falls
Decubiti
Joint Commission
Financial Performance Compared to
Budget
Admissions Growth
Physician Recruitment
Employee Satisfaction:
Physician Satisfaction
Percentile Ranking of Employee
Satisfaction
Employee Turnover
Community Cares any“Always” culture
10 © 2009 Studer Groupwww.studergroup.com
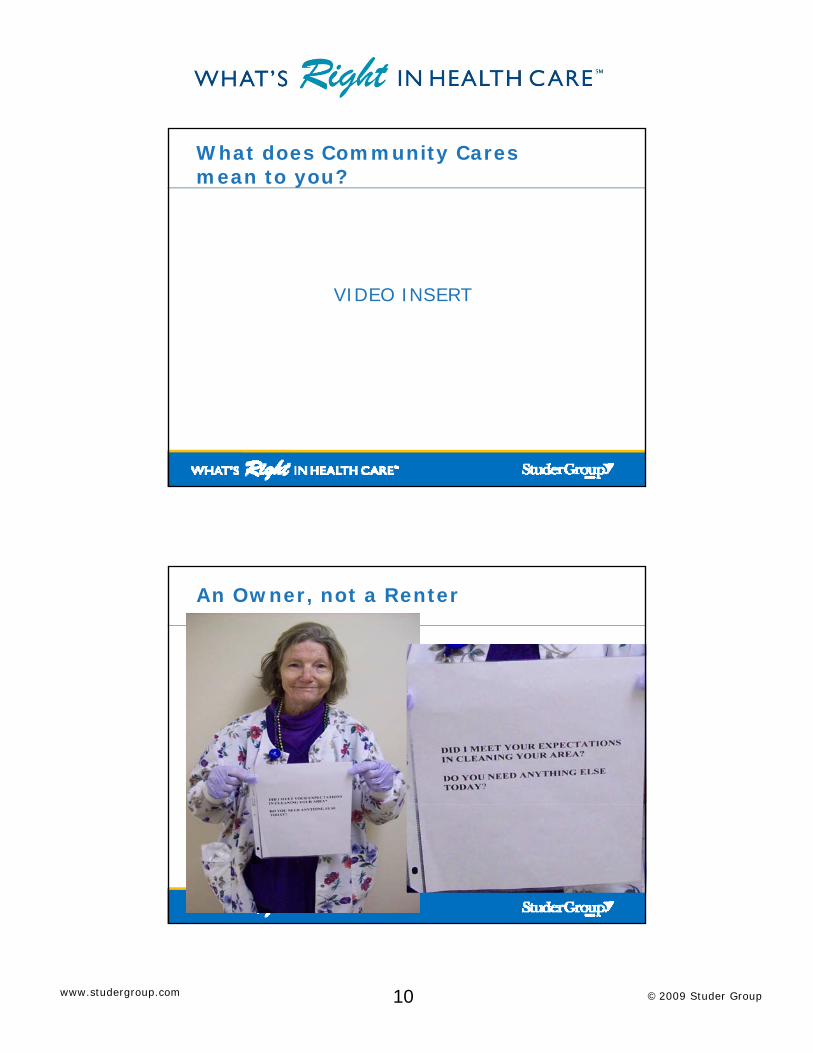
What does Community Cares mean to you?
VIDEO INSERT
An Owner, not a Renter
11 © 2009 Studer Groupwww.studergroup.com
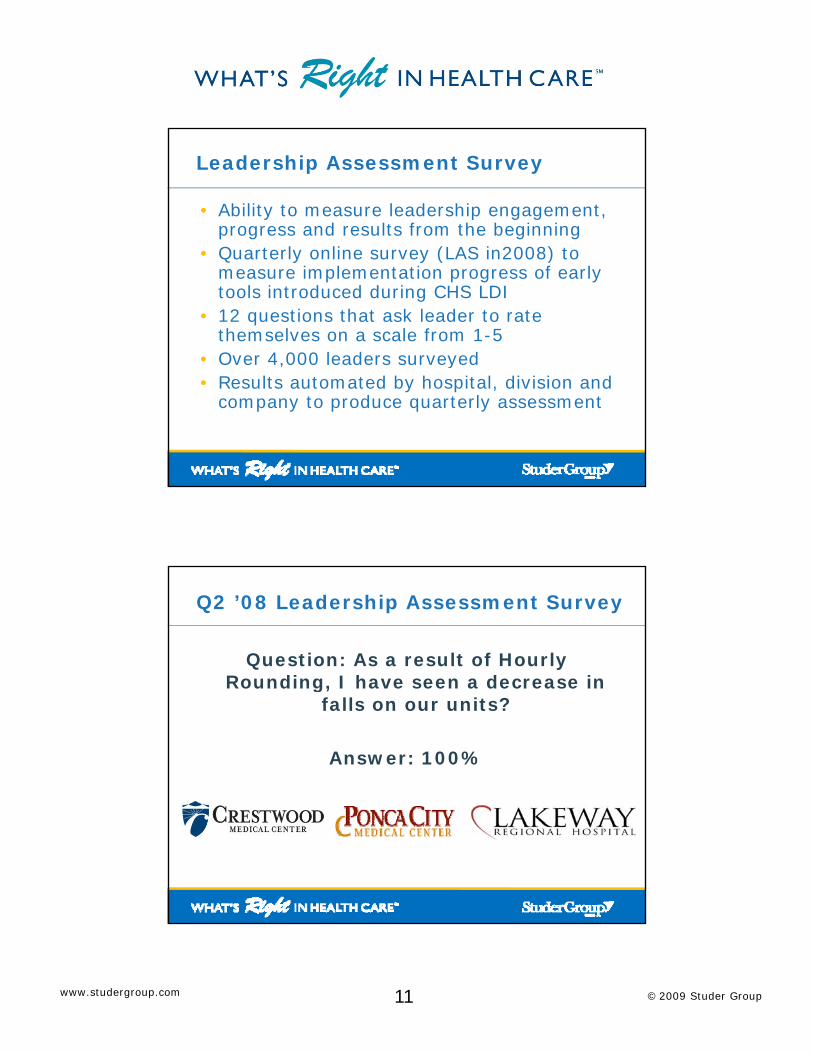
• Ability to measure leadership engagement, progress and results from the beginning Q t l li (LAS i 2008) t
Leadership Assessment Survey
• Quarterly online survey (LAS in2008) to measure implementation progress of early tools introduced during CHS LDI
• 12 questions that ask leader to rate themselves on a scale from 1-5
• Over 4,000 leaders surveyed , y• Results automated by hospital, division and
company to produce quarterly assessment
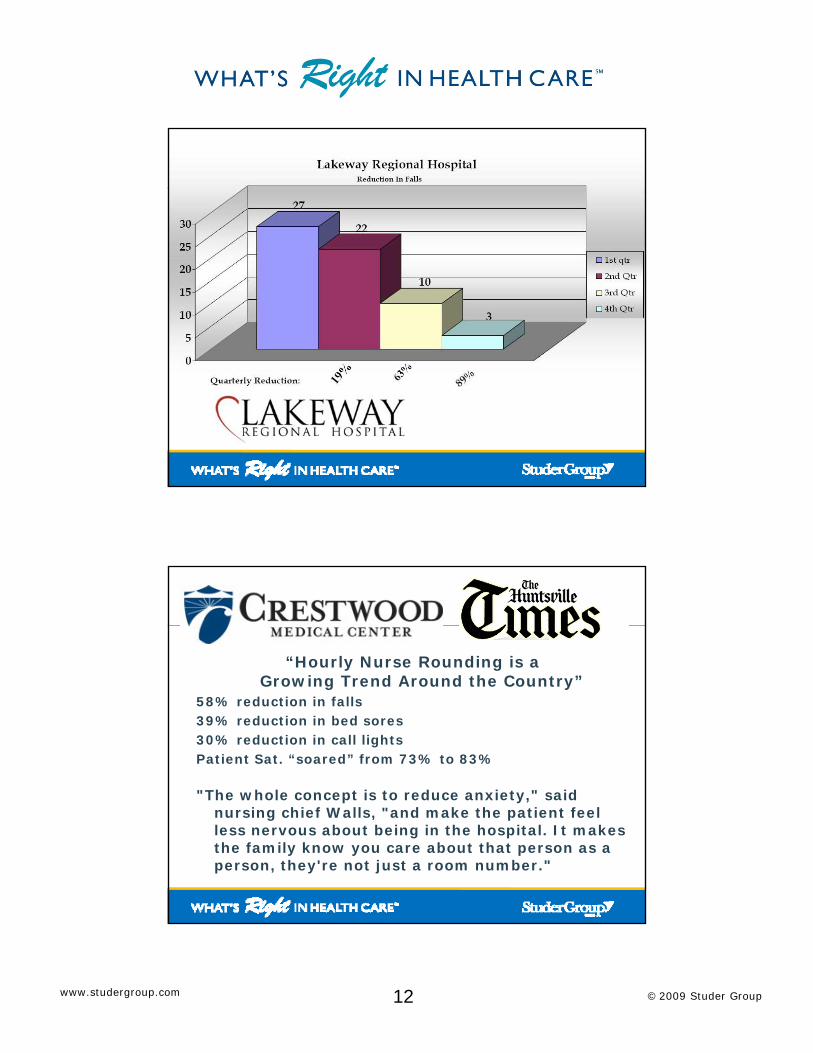
Question: As a result of Hourly Rounding, I have seen a decrease in
Q2 ’08 Leadership Assessment Survey
Rounding, I have seen a decrease in falls on our units?
Answer: 100%
12 © 2009 Studer Groupwww.studergroup.com
“Hourly Nurse Rounding is a Growing Trend Around the Country”Growing Trend Around the Country
58% reduction in falls39% reduction in bed sores30% reduction in call lightsPatient Sat. “soared” from 73% to 83%
"The whole concept is to reduce anxiety," said nursing chief Walls, "and make the patient feel less nervous about being in the hospital. It makes the family know you care about that person as a person, they're not just a room number."
13 © 2009 Studer Groupwww.studergroup.com
1492
12391400
16002007 Actual Agency N C $621 28
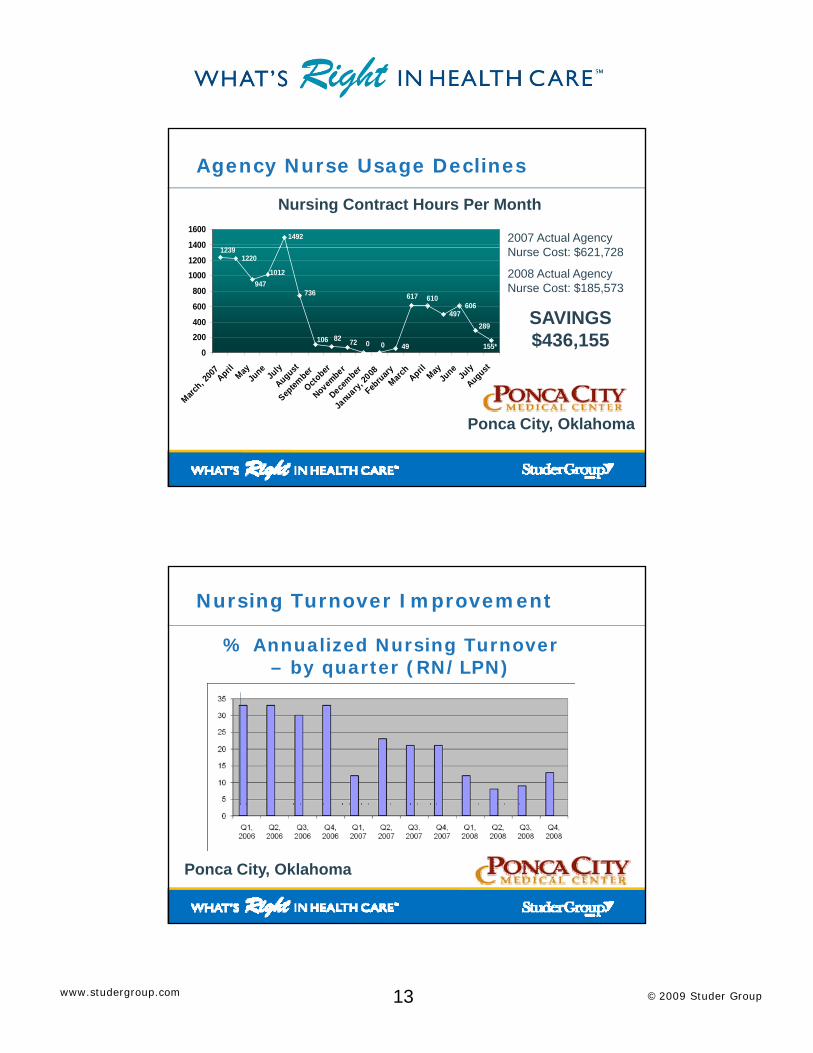
Nursing Contract Hours Per Month
Agency Nurse Usage Declines
1220
497606
155*
289
610617
49007282106
1012947
736
1239
0
200400
600
800
10001200
1400
7 il y e ly st r r r r 8 y h il y e ly st
Nurse Cost: $621,728
2008 Actual Agency Nurse Cost: $185,573
SAVINGS $436,155
March, 2
007
April MayJu
neJu
ly
August
Septem
ber
October
November
December
Janu
ary, 20
08
February
March
April MayJu
neJu
ly
August
Ponca City, Oklahoma
% Annualized Nursing Turnover – by quarter (RN/LPN)
Nursing Turnover Improvement
4
24
10
26
11
22 22
10
15
20
25
30
0807
0
5
1st Quarter 2nd Quarter 3rd Quarter 4th Quarter
Ponca City, Oklahoma

14 © 2009 Studer Groupwww.studergroup.com
Q3 ‘08 Leadership Assessment Survey
Question: I round consistently on all my direct reports and/or support staff?
Answer: 98%
South Baldwin Reg. Medical Center
15 © 2009 Studer Groupwww.studergroup.com
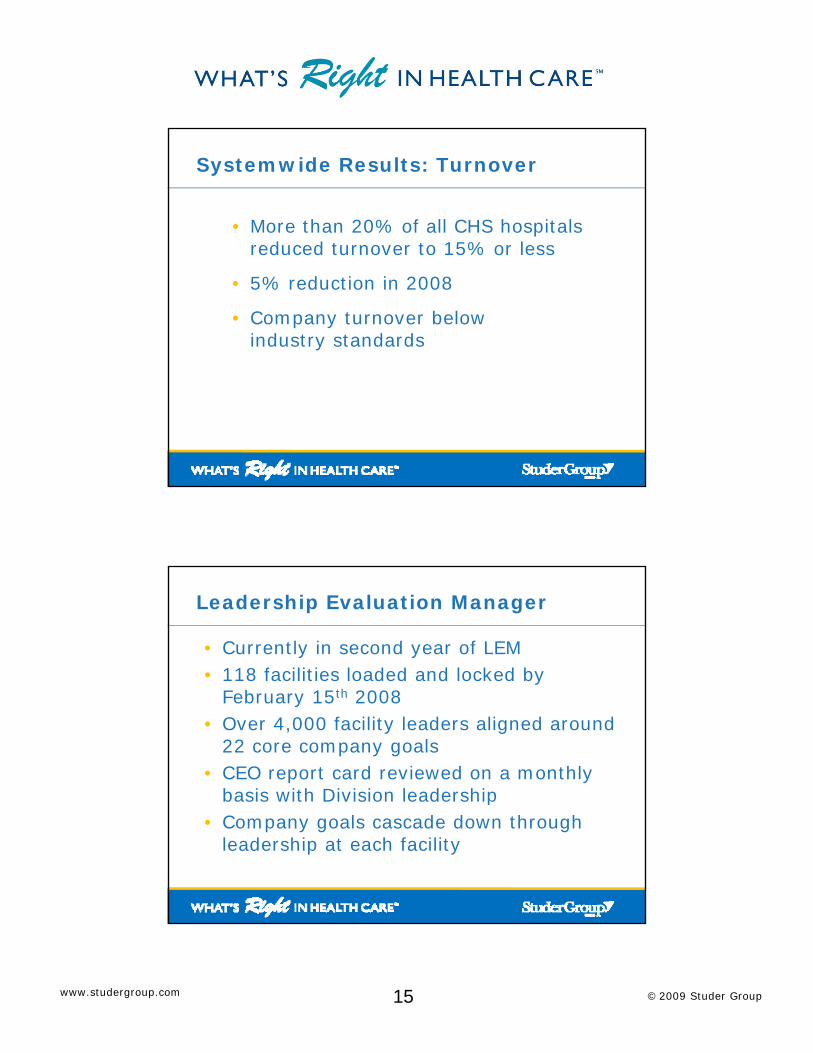
Systemwide Results: Turnover
• More than 20% of all CHS hospitals reduced turnover to 15% or lessreduced turnover to 15% or less
• 5% reduction in 2008
• Company turnover below industry standards
Leadership Evaluation Manager
• Currently in second year of LEM • 118 facilities loaded and locked by
February 15th 2008 • Over 4,000 facility leaders aligned around
22 core company goals• CEO report card reviewed on a monthly
basis with Division leadershipp• Company goals cascade down through
leadership at each facility
16 © 2009 Studer Groupwww.studergroup.com
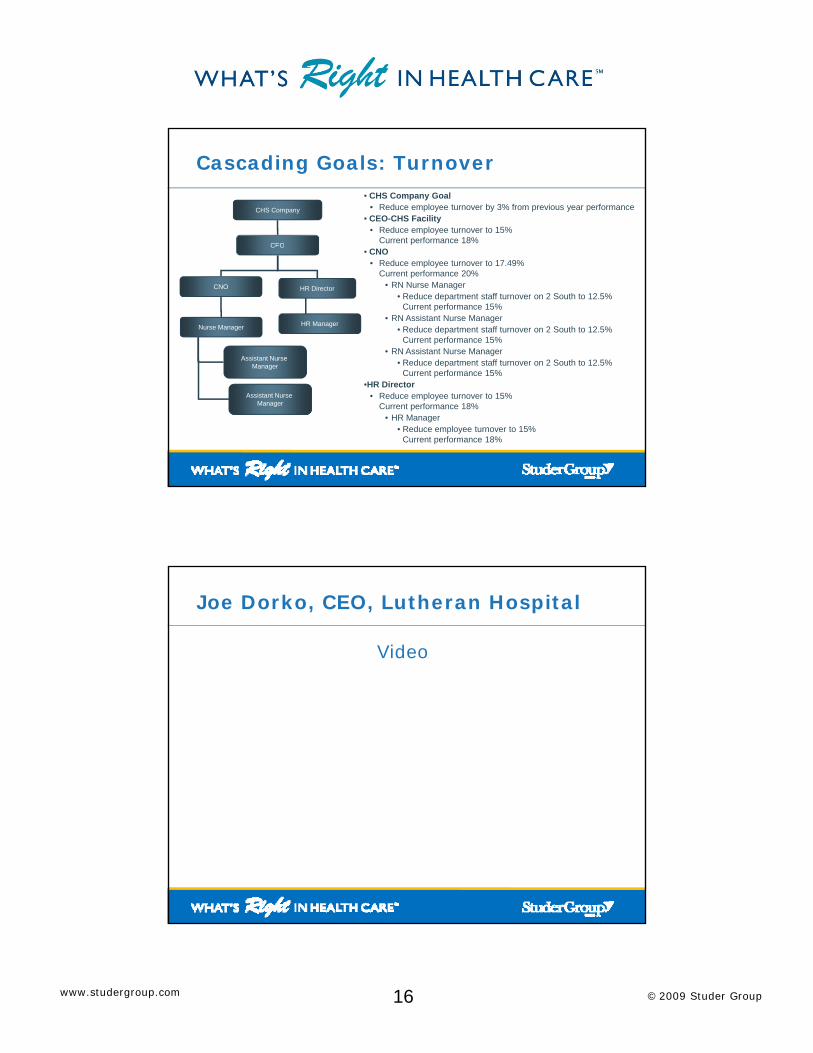
Cascading Goals: Turnover
CHS Company
CEO
• CHS Company Goal• Reduce employee turnover by 3% from previous year performance
• CEO-CHS Facility• Reduce employee turnover to 15%
Current performance 18%C O
CNO HR Director
HR ManagerNurse Manager
Assistant Nurse Manager
• CNO• Reduce employee turnover to 17.49%
Current performance 20%• RN Nurse Manager
• Reduce department staff turnover on 2 South to 12.5% Current performance 15%
• RN Assistant Nurse Manager• Reduce department staff turnover on 2 South to 12.5%
Current performance 15%• RN Assistant Nurse Manager
• Reduce department staff turnover on 2 South to 12.5% Manager
Assistant Nurse Manager
Current performance 15%•HR Director
• Reduce employee turnover to 15% Current performance 18%
• HR Manager • Reduce employee turnover to 15%
Current performance 18%
Joe Dorko, CEO, Lutheran Hospital
Video

17 © 2009 Studer Groupwww.studergroup.com
Corporate Leadership Site Visit Meeting Model
• Company Community Cares Dashboard• LEM Resultsesu ts• Linkage Grid from Current LDI• Rounding Logs• Thank You notes• People Trends and Issues
2008 Learning Opportunities
• Accountability starts at the top• Trust but Verifyust but e y• Division leadership selects top priority
goals for facility CEO• CEO cascades priority goals down to
Senior Leadership• Facility leaders adopt three global goals • Facility leaders adopt three global goals
with weight specific to leader impact • Permit what you Promote

18 © 2009 Studer Groupwww.studergroup.com
Emergency Department Culture
• AIDET in the ED• Implement use of “my work life was challenging today
because” forms• Reinforce “pull to full” (triage as a process not a location)• Reinforce hourly rounding (Q 30mins)• Change signs from waiting room to reception room• Implement the “no delay in nursing report” concept• Remove/reduce “NO” signs• Complete discharge phone calls by nurses
and physiciansand physicians• Reinforce physician communication and closure
(at end of visit)• Design a company-wide dashboard for ED excellence
ED Post-Visit Calls
Who do we call?
ED discharged home patientsLWOTAMA

19 © 2009 Studer Groupwww.studergroup.com
Discharge Call Administrator (DCA) Results
2009 Q1 DCA Summary
• Over 120,000 completed calls over Q1 2009Q1 2009
• 96% would recommend your hospital• 53% recognized someone for
outstanding service• Transparency--Rank each Division p y
and Facility• Improve ED quality and service
20 © 2009 Studer Groupwww.studergroup.com
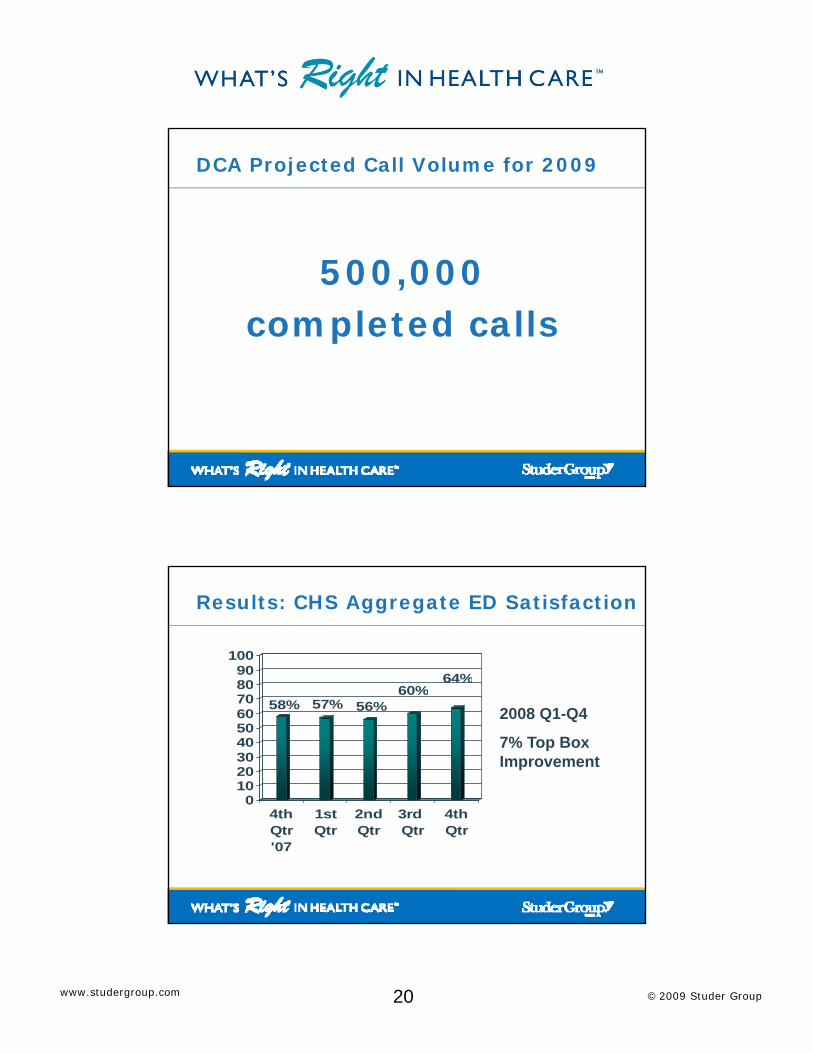
DCA Projected Call Volume for 2009
500,000completed calls
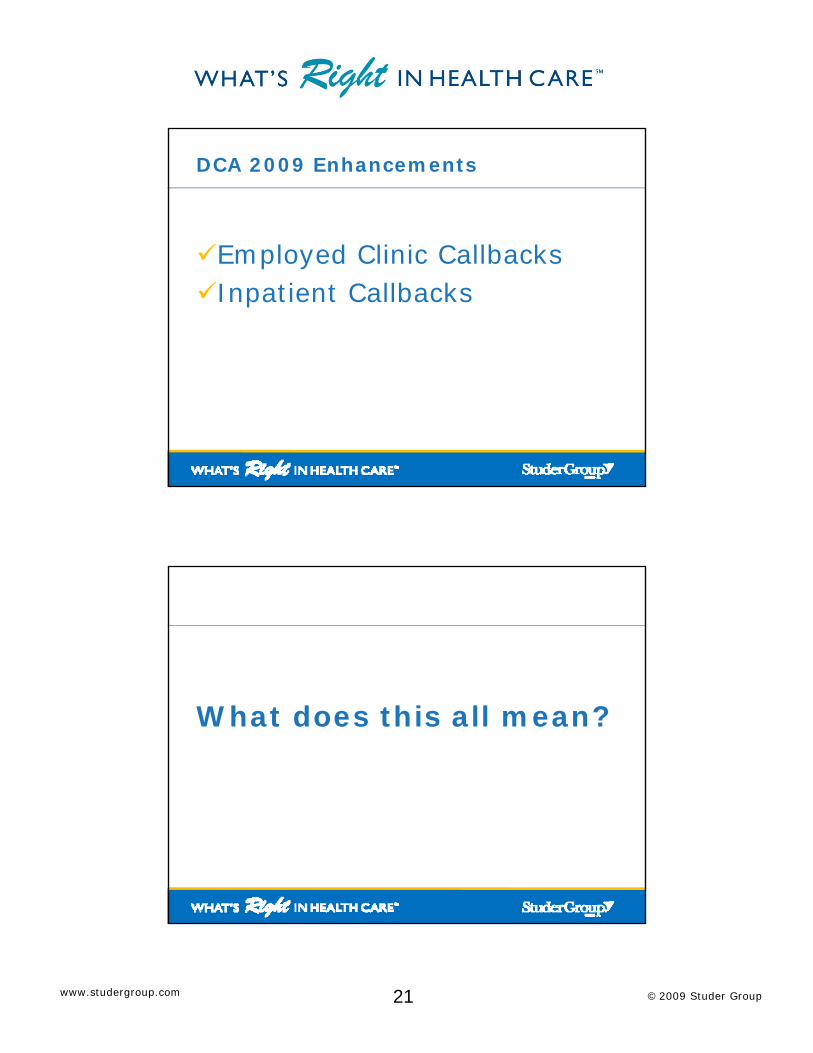
Results: CHS Aggregate ED Satisfaction
64%8090
100
58% 57% 56%60%
01020304050607080
2008 Q1-Q4
7% Top Box Improvement
4thQtr'07
1stQtr
2ndQtr
3rd Qtr
4thQtr
21 © 2009 Studer Groupwww.studergroup.com
DCA 2009 Enhancements
E l d Cli i C llb kEmployed Clinic CallbacksInpatient Callbacks
What does this all mean?
22 © 2009 Studer Groupwww.studergroup.com
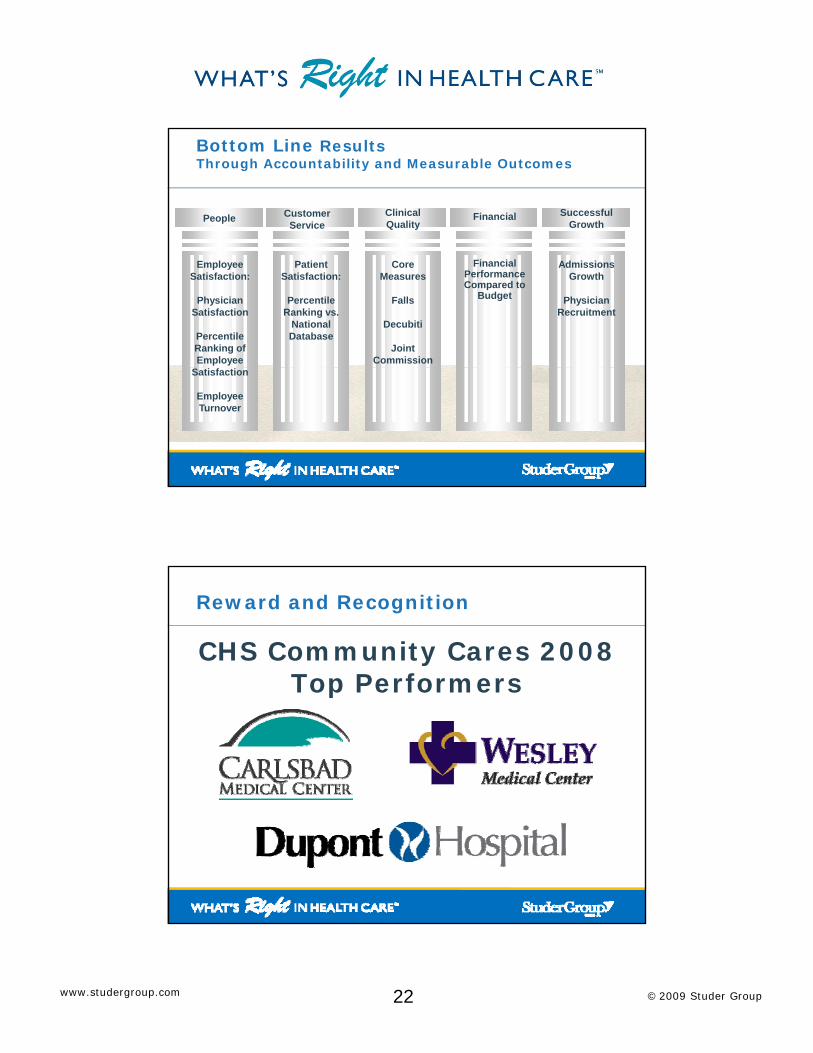
Bottom Line ResultsThrough Accountability and Measurable Outcomes
People Customer Service
Clinical Quality
Financial Successful Growth
Patient Satisfaction:
Percentile Ranking vs.
National Database
Core Measures
Falls
Decubiti
Joint Commission
Financial Performance Compared to
Budget
Admissions Growth
Physician Recruitment
Employee Satisfaction:
Physician Satisfaction
Percentile Ranking of Employee
Satisfaction
Employee Turnover
Reward and Recognition
CHS Community Cares 2008 Top PerformersTop Performers
23 © 2009 Studer Groupwww.studergroup.com
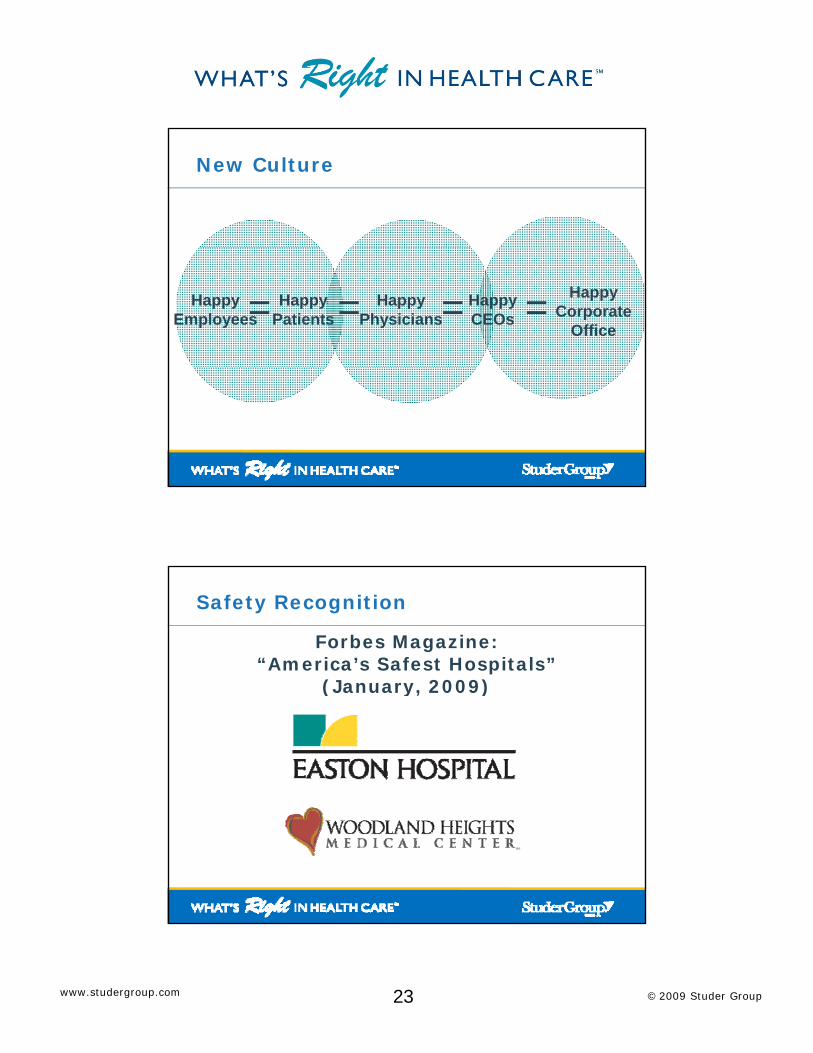
New Culture
Happy Employees == Happy
PatientsHappy
Physicians= =Happy CEOs
Happy Corporate
Office
Safety Recognition
Forbes Magazine: “America’s Safest Hospitals”
(January 2009)(January, 2009)

24 © 2009 Studer Groupwww.studergroup.com
#1 in the nation for quality as rated by the federal Centers for Medicare by the federal Centers for Medicare
and Medicaid Services (CMS)
Creating great placesfor people to work,
physicians to practice medicineand patients to receive care.

25 © 2009 Studer Groupwww.studergroup.com
Thank You!
Debra S. LandersVP and Chief Marketing Officer, Community Health Systems
Nashville TNNashville, TN