algebra 4-2 study guide: using intercepts (pp 237-239) 4-2 study guide: using intercepts (pp...
TRANSCRIPT

Algebra 4-2 Study Guide: Using Intercepts (pp 237-239) Page ! of !1 13
Attendance Problems. Solve each equation. 1. 5x + 0 = -10 2. 33 = 0 + 3y 3. !
4. 2x + 14 = -3x + 4 5. -5y - 1 = 7y + 5
• I can find x- and y-intercepts and interpret their meanings in real-world situations.
• I can use x- and y-intercepts to graph lines.
Common Core CC.9-12.A.CED.2 Create equations in two or more variables to represent relationships between quantities; graph equations on coordinate axes with labels and scales.* CC.9-12.F.IF.7 Graph functions expressed symbolically and show key features of the graph, by hand in simple cases and using technology for more complicated cases.*
a. Graph linear and quadratic functions and show intercepts, maxima, and minima. b. Graph square root, cube root, and piecewise-defined functions, including step functions and absolute value functions. c. Graph polynomial functions, identifying zeros when suitable factorizations are available, and showing end behavior. d. (+) Graph rational functions, identifying zeros and asymptotes when suitable factorizations are available, and showing end behavior. e. Graph exponential and logarithmic functions, showing intercepts and end behavior, and trigonometric functions, showing period, midline, and amplitude.
45x +
110
=910
Vocabulary
y-intercept x-intercept

Algebra 4-2 Study Guide: Using Intercepts (pp 237-239) Page ! of !2 13
! Teacher: Where’s the graph of your function? Student: It was intercepted on the way to school.
I came home the other night and tried to open the door with my car keys...and the building started up. So I took it out for a drive. A cop pulled me over for speeding. He asked me where I live... "Right here". -- Steven Wright
The y-intercept is the y-coordinate of the point where the graph intersects the y-axis. The x-coordinate of this point is always 0.
The x-intercept is the x-coordinate of the point where the graph intersects the x-axis. The y-coordinate of this point is always 0.

Algebra 4-2 Study Guide: Using Intercepts (pp 237-239) Page ! of !3 13
Video Example 1. Find the x- and y-intercepts. A. B. 2x - 5y = 20
!

Algebra 4-2 Study Guide: Using Intercepts (pp 237-239) Page ! of !4 13
!
Using Intercepts
A diver explored the ocean floor 120 feet below the surface and then ascended at a rate of 30 feet per minute. The graph shows the diver’s elevation below sea level during the ascent.
The y-intercept is the y-coordinate of the point where the graph intersects the y-axis. The x-coordinate of this point is always 0.
The x-intercept is the x-coordinate of the point where the graph intersects the x-axis. The y-coordinate of this point is always 0.
1E X A M P L E Finding Intercepts
Find the x- and y-intercepts.
A The graph intersects the x-axis at (-4, 0).
The x-intercept is -4.
The graph intersects the y-axis at (0, -3). The y-intercept is -3.
B 3x - 2y = 12To find the x-intercept, To find the y-intercept, replace xreplace y with 0 and solve for x. with 0 and solve for y. 3x - 2y = 12 3x - 2y = 123x - 2 (0) = 12 3 (0) - 2y = 12 3x - 0 = 12 0 - 2y = 12 3x = 12 -2y = 12
3x _ 3
= 12 _ 3
-2y
_ -2
= 12 _ -2
x = 4 y = -6The x-intercept is 4. The y-intercept is -6.
Find the x- and y-intercepts. 1a. 1b. -3x + 5y = 30
1c. 4x + 2y = 16
ObjectivesFind x- and y-intercepts and interpret their meanings in real-world situations.
Use x- and y-intercepts to graph lines.
Vocabularyy-interceptx-intercept
Who uses this?Divers can use intercepts to determine the time a safe ascent will take.
4-2 Using Intercepts 237
4-2CC.9-12.F.IF.7 Graph functions expressed symbolically and show key features of the graph, by hand in simple cases. …* a. Graph linear … functions and show intercepts, . … Also CC.9-12.A.CED.2*, CC.9-12.A.CED.3*, CC.9-12.F.IF.2, CC.9-12.F.IF.4*, CC.9-12.F.IF.5*
CC13_A1_MESE647036_C04L02.indd 237CC13_A1_MESE647036_C04L02.indd 237 4027011 12:18:15 PM4027011 12:18:15 PM

Algebra 4-2 Study Guide: Using Intercepts (pp 237-239) Page ! of !5 13
Example 1. Find the x- and y-intercepts. A. B. 5x – 2y = 10
!
Guided Practice. 7. Find the x- and y-intercepts.
8. Find the x- and y-intercepts: –3x + 5y = 30
9. Find the x- and y-intercepts: 4x + 2y = 16

Algebra 4-2 Study Guide: Using Intercepts (pp 237-239) Page ! of !6 13
Video Example 2. A runner is participating in a 7000 meter race and her average speed is is 1000 meters per minute. The function f(x) = 7,000 - 100x gives the runner’s distance in meters from the finish line after x minutes. Graph this function and find the intercepts. What does each intercept represent?
!

Algebra 4-2 Study Guide: Using Intercepts (pp 237-239) Page ! of !7 13
!
2E X A M P L E Travel Application
The Sandia Peak Tramway in Albuquerque, New Mexico, travels a distance of about 4500 meters to the top of Sandia Peak. Its speed is 300 meters per minute. The function f (x) = 4500 - 300x gives the tram’s distance in meters from the top of the peak after x minutes. Graph this function and find the intercepts. What does each intercept represent?
Neither time nor distance can be negative, so choose several nonnegative values for x. Use the function to generate ordered pairs.
x 0 2 5 10 15
f (x) = 4500 - 300x 4500 3900 3000 1500 0
Graph the ordered pairs. Connect the points with a line.
• y-intercept: 4500. This is the starting distance from the top (time = 0).
• x-intercept: 15. This the time when the tram reaches the peak (distance = 0).
2. The school store sells pens for $2.00 and notebooks for $3.00. The equation 2x + 3y = 60 describes the number of pens x and notebooks y that you can buy for $60.
a. Graph the function and find its intercepts.
b. What does each intercept represent?
The graph is not the path of the tram. Even though the line is descending, the graph describes the distance from the peak as the tram goes up the mountain.
I use the “cover-up” method to find intercepts. To use this method, make sure the equation is in standard form first.
Finding Intercepts
Madison StewartJefferson High School
If I have 4x - 3y = 12:
First, I cover 4x with my finger and solve the equation I can still see.
- 3y = 12 y = -4
The y-intercept is -4.
Then I cover -3y with my finger and do the same thing.
4x = 12 x = 3
The x-intercept is 3.
(tl),©
LWA
-Dan
n Ta
rdif/
CO
RB
IS; (
cr),©
Bud
dy M
ays/
CO
RB
IS(tl
),©LW
A-D
ann
Tard
if/C
OR
BIS
; (cr
),© B
uddy
May
s/C
OR
BIS
238 Chapter 4 Linear Functions
CS10_A1_MESE612225_C04L02.indd 238CS10_A1_MESE612225_C04L02.indd 238 2/5/11 5:05:20 PM2/5/11 5:05:20 PM

Algebra 4-2 Study Guide: Using Intercepts (pp 237-239) Page ! of !8 13
Example 2. Trish can run the 200 m dash in 25 s. The function f(x) = 200 – 8x gives the distance remaining to be run after x seconds. Graph this function and find the intercepts. What does each intercept represent?
!

Algebra 4-2 Study Guide: Using Intercepts (pp 237-239) Page ! of !9 13
10. Guided Practice. The school sells pens for $2.00 and notebooks for $3.00. The equation 2x + 3y = 60 describes the number of pens x and notebooks y that you can buy for $60. Graph the function and find its intercepts.
!
Remember, to graph a linear function, you need to plot only two ordered pairs. It is often simplest to find the ordered pairs that contain the intercepts.
!
Helpful Hint
You can use a third point to check your line. Either choose a point from your graph and check it in the equation, or use the equation to generate a point and check that it is on your graph.

Algebra 4-2 Study Guide: Using Intercepts (pp 237-239) Page ! of !10 13
Video Example 3. Graph each equation.
A. x - 3y = 6
B. (3/4)y = 3 - (1/2)x
Algebra 4-2 Study Guide: Using Intercepts (pp 237-239) Page ! of !11 13
!
Remember, to graph a linear function, you need to plot only two ordered pairs. It is often simplest to find the ordered pairs that contain the intercepts.
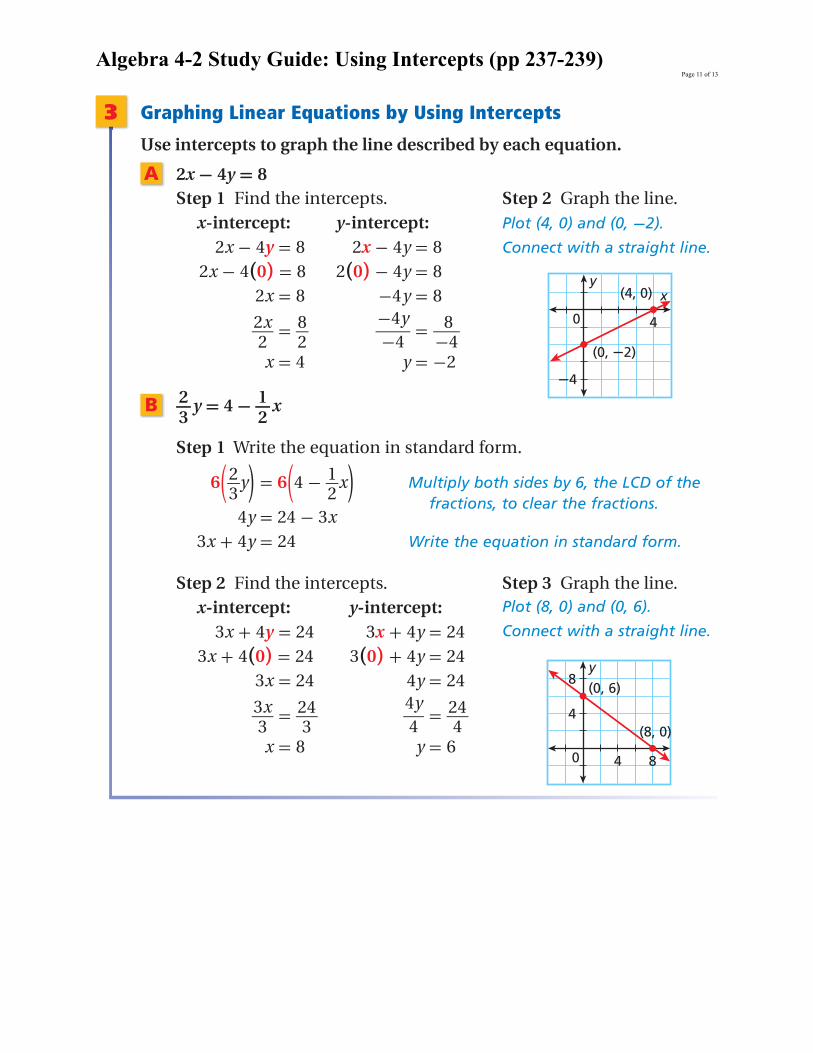
3E X A M P L E Graphing Linear Equations by Using Intercepts
Use intercepts to graph the line described by each equation.
A 2x - 4y = 8Step 1 Find the intercepts.
x-intercept: y-intercept: 2x - 4y = 8 2x - 4y = 8
2x - 4 (0) = 8 2 (0) - 4y = 8 2x = 8 -4 y = 8
2x _ 2
= 8 _ 2
-4y
_ -4
= 8 _ -4
x = 4 y = -2
Step 2 Graph the line.Plot (4, 0) and (0, -2).
Connect with a straight line.
B 2 _ 3
y = 4 - 1 _ 2
x
Step 1 Write the equation in standard form.
6 ( 2 _ 3
y) = 6 (4 - 1 _ 2
x) Multiply both sides by 6, the LCD of the fractions, to clear the fractions.
Write the equation in standard form. 4y = 24 - 3x
3x + 4y = 24
Step 2 Find the intercepts. Step 3 Graph the line.x-intercept: y-intercept: Plot (8, 0) and (0, 6).
Connect with a straight line. 3x + 4y = 24 3x + 4y = 24 3x + 4 (0) = 24 3 (0) + 4y = 24
3x = 24 4y = 24
3x _ 3
= 24 _ 3
4y
_ 4
= 24 _ 4
x = 8 y = 6
Use intercepts to graph the line described by each equation.
3a. -3x + 4y = -12 3b. y = 1 _ 3
x - 2
THINK AND DISCUSS 1. A function has x-intercept 4 and y-intercept 2. Name two points on the
graph of this function.
2. What is the y-intercept of 2.304x + y = 4.318? What is the x-intercept of x - 92.4920y = -21.5489?
3. GET ORGANIZED Copy and complete the graphic organizer.
You can use a third point to check your line. Either choose a point from your graph and check it in the equation, or use the equation to generate a point and check that it is on your graph.
4-2 Using Intercepts 239
CC13_A1_MESE647036_C04L02.indd 239CC13_A1_MESE647036_C04L02.indd 239 4027011 12:18:39 PM4027011 12:18:39 PM

Algebra 4-2 Study Guide: Using Intercepts (pp 237-239) Page ! of !12 13
Example 3. Graph each equation.
A. 3x – 7y = 21
B. y = –x + 4

Algebra 4-2 Study Guide: Using Intercepts (pp 237-239) Page ! of !13 13
Guided Practice. Graph each equation. 11. -3x + 4y = -12
12. !
4-2 Using Intercepts • Desmos activity: Lines and intercepts: ymwf • (p 240) 22, 23, 30, 33-38, 41. Upload graphs to classroom.google.com
y =13x − 2