anritsu corporation · 218 218 218 219 219 219 220 224 226 226 226 226 227 228 229 229 229 230 230...
TRANSCRIPT

MT1000AMT1000ANetwork Master ProNetwork Master Pro
OTDR ModulesOTDR ModulesOperation ManualOperation Manual
Ninth EditionNinth Edition
For safety and warning information, please read thisFor safety and warning information, please read thismanual manual before attempting to use the equipment. before attempting to use the equipment. Keep this manual with the equipment.Keep this manual with the equipment.
ANRITSU CORPORATIONANRITSU CORPORATION
Document No. M-W3810AE-9.0

MT1000A Network Master ProOTDR ModulesOperation Manual
25 November 2015 (First Edition)23 June 2017 (Ninth Edition)
© Copyright 2015-2017, ANRITSU CORPORATION.All rights reserved. No part of this manual may be reproduced without the priorwritten permission of the publisher.The contents of this manual may be changed without prior notice.Printed in Japan
22

About This ManualAbout This Manual
The documentation for MT1000A Network Master Pro applies to the instrumentwith the MU100020A, MU100021A, or MU100022A OTDR Module installed. Thisoperation manual describes both the basic operation of the instrument as well asthe operations available via interface options and predefined applications/tests.
MT1000A Network Master Pro OTDR Modules Operation Manual (this manual)MT1000A Network Master Pro OTDR Modules Operation Manual (this manual)Operations for the MT1000A Network Master Pro mainframe with OTDRmodule (MU100020A, MU100021A, and MU100022A) are described.
MT1000A Network Master Pro OTDR Modules Quick Reference GuideMT1000A Network Master Pro OTDR Modules Quick Reference GuideA printed quick user's guide that introduces the basic operation of theinstrument.
MT1000A Network Master Pro OTDR Modules Remote Scripting Operation ManualMT1000A Network Master Pro OTDR Modules Remote Scripting Operation ManualOperations of the command-based Remote Control function are described.
Manual structureManual structureThe contents of the manual is structured in the following way:
Chapter 1 - IntroductionChapter 1 - IntroductionChapter 2 - ConfigurationChapter 2 - ConfigurationChapter 3 - Human-Machine-InterfaceChapter 3 - Human-Machine-InterfaceChapter 4 - Graphical User InterfaceChapter 4 - Graphical User InterfaceChapter 5 - Optical Fibre Test ApplicationsChapter 5 - Optical Fibre Test ApplicationsChapter 6 - Utility ApplicationsChapter 6 - Utility ApplicationsChapter 7 - Performance Test and CalibrationChapter 7 - Performance Test and CalibrationChapter 8 - SpecificationsChapter 8 - SpecificationsChapter 9 - SupportChapter 9 - Support
Chapter 4 consists of a general introduction to the GUI. Chapters 5 containsdescriptions of each screen, sub-screen and major dialog box. The descriptions areprovided in the following order:
Setup and result screens for each application. The applications are describedin the same order as they appear on the application selector screen.Measurement condition setup screens
This operation manual is intended for those who have the basic knowledge of thefollowing:
Basic knowledge of optical fiber communication, handling optical parts andoptical fibers
33

44
991010111111111111121212121213131414141416171818181819202022
23232424242425252526262627272729293030303034343535353537
39394040414141434344444445454848
Table of ContentsTable of Contents
00 Table of ContentsTable of Contents
11 IntroductionIntroduction1.11.1 MainframeMainframe1.21.2 OTDR Module 1310/1550nm SMF (MU100020A)OTDR Module 1310/1550nm SMF (MU100020A)1.31.3 OTDR Module 1310/1550/850/1300nm SMF/MMF (MU100021A)OTDR Module 1310/1550/850/1300nm SMF/MMF (MU100021A)1.41.4 OTDR Module 1310/1550/1625nm SMF (MU100022A)OTDR Module 1310/1550/1625nm SMF (MU100022A)1.51.5 Symbols and ConventionsSymbols and Conventions
1.5.1 Symbols Used in Manual1.5.2 Safety Symbols Used on Equipment1.5.3 Notes1.5.4 Hints1.5.5 Option
1.61.6 For SafetyFor Safety1.6.1 Dangers1.6.2 Warnings1.6.3 Cautions1.6.4 Cautions against Computer Virus Infection
1.71.7 PrecautionsPrecautions1.7.1 Installation1.7.2 Ventilation1.7.3 ESD (Electrostatic Discharge)1.7.4 Optical Connectors1.7.5 Cautions on Handling Optical Fiber Cables1.7.6 Countries and Regions Permitting WLAN Use
22 ConfigurationConfiguration2.12.1 Delivered AccessoriesDelivered Accessories
2.1.1 Standard Accessories2.1.2 Optional Accessories
2.22.2 Mains Power AdapterMains Power Adapter2.2.1 Connecting Mains Power Adapter
2.32.3 Rechargeable BatteryRechargeable Battery2.3.1 Installing or Replacing Battery2.3.2 Charging Battery in Fast Mode2.3.3 Charging Battery in Normal Mode2.3.4 Battery Status Information
2.42.4 Optical FibersOptical Fibers2.52.5 Support Stand and Carrying StrapSupport Stand and Carrying Strap
2.5.1 Support Stand2.5.2 Carrying Strap and Handle
2.62.6 Modules ConfigurationModules Configuration2.72.7 Attaching the ModulesAttaching the Modules
2.7.1 Replacing the MU100010A 10G Multirate modules2.7.2 Attaching OTDR module with 10G Multirate module2.7.3 Attaching OTDR module without 10G Multirate module
33 Human-Machine-InterfaceHuman-Machine-Interface3.13.1 Touch Screen DisplayTouch Screen Display3.23.2 Key OperationKey Operation
3.2.1 Power Button3.33.3 Head SetHead Set3.43.4 Connector PanelConnector Panel
3.4.1 Test Interfaces3.4.2 Service Interfaces3.4.3 Optical Connector/Optical Adapter Cleaning
3.53.5 Command-Based Remote ControlCommand-Based Remote Control
Table of ContentsTable of Contents
44

48484949494951515151
53535454545556636464647681818181818282
83838484849397
109118118118118119122122122123136137143143145147
149149150150150152154154154154157157158158158159159162164164
165165
3.63.6 File Access via USB InterfaceFile Access via USB Interface3.73.7 File Access via Ethernet InterfaceFile Access via Ethernet Interface
3.7.1 Accessing files in Network Master from the PC3.7.2 Mounting the Shared Folder of Networked PC to the Network Master
3.83.8 GPS ReceiverGPS Receiver3.8.1 G0325A GPS Receiver3.8.2 Operating GPS Receiver
44 Graphical User InterfaceGraphical User Interface4.14.1 General Handling of the GUIGeneral Handling of the GUI
4.1.1 GUI Concept4.1.2 Navigating in the GUI4.1.3 Layout of the GUI Screens4.1.4 Keypads for Entering Text in Fields
4.24.2 ToolbarsToolbars4.2.1 Instrument Toolbar4.2.2 Application Toolbar
4.34.3 Startup and Switch-off SequencesStartup and Switch-off Sequences4.3.1 Instrument Startup4.3.2 Application Startup4.3.3 Accessing Previous Tests and Test Results4.3.4 Closing an Application4.3.5 Switching Off the Instrument
55 Optical Fiber Testing ApplicationsOptical Fiber Testing Applications5.15.1 Standard OTDRStandard OTDR
5.1.1 Measurement Condition Setup5.1.2 Test Setup5.1.3 Test Results5.1.4 Measurements
5.25.2 FTTAFTTA5.2.1 Measurement Condition Setup5.2.2 Test Setup5.2.3 Test Result
5.35.3 ConstructionConstruction5.3.1 Application Toolbar5.3.2 Measurement Condition Setup5.3.3 Test Setup5.3.4 Test Result
5.45.4 OLTSOLTS5.4.1 Loss Test Setup5.4.2 Loss Table
66 Utility ApplicationsUtility Applications6.16.1 ScenarioScenario
6.1.1 Scenario Manager6.1.2 Running the Scenario
6.26.2 GPSGPS6.2.1 Test Setup6.2.2 Test Results
6.36.3 PDF ViewerPDF Viewer6.46.4 VIPVIP
6.4.1 Application Toolbar6.4.2 Connecting the probe6.4.3 Test Setup6.4.4 Test Results
6.56.5 WiresharkWireshark
77 Performance Test and CalibrationPerformance Test and Calibration
55

166166166168169170171173175178179180181181181182183183
191191192192192193193194194195195195195197198198199199200200200200202203203204204205205205205207207208208209
211211212212212212213213214214215215216216216216217217
7.17.1 Performance TestPerformance Test7.1.1 Required instruments for performance test7.1.2 Wavelength7.1.3 Pulse Width7.1.4 Dynamic Range7.1.5 Distance Measurement Accuracy7.1.6 Linearity7.1.7 Dead Zone7.1.8 Optical Power Level and Wavelength of VFL7.1.9 Optical Power Level and Wavelength of Light Source7.1.10 Optical Power Meter Measurement Accuracy
7.27.2 CalibrationCalibration7.2.1 Backscatter coefficient level calibration7.2.2 Measurement accuracy calibration of optical power meter
7.37.3 Performance Test Result SheetPerformance Test Result Sheet
88 SpecificationsSpecifications8.18.1 MT1000AMT1000A
8.1.1 Configuration8.1.2 External Interfaces8.1.3 Other Interfaces8.1.4 Environment Performance8.1.5 Mechanical Performance
8.28.2 MU100020A OTDR Module 1310/1550nm SMFMU100020A OTDR Module 1310/1550nm SMF8.2.1 Configuration8.2.2 OTDR8.2.3 Optical Power Meter8.2.4 Light Source8.2.5 VFL (Option 002)8.2.6 Environment Performance8.2.7 Mechanical Performance
8.38.3 MU100021A OTDR Module 1310/1550/850/1300nm SMF/MMFMU100021A OTDR Module 1310/1550/850/1300nm SMF/MMF8.3.1 Configuration8.3.2 OTDR8.3.3 Optical Power Meter8.3.4 Light Source8.3.5 VFL (Option 002)8.3.6 Environment Performance8.3.7 Mechanical Performance
8.48.4 MU100022A OTDR Module 1310/1550/1625nm SMFMU100022A OTDR Module 1310/1550/1625nm SMF8.4.1 Configuration8.4.2 OTDR8.4.3 Optical Power Meter8.4.4 Light Source8.4.5 VFL (Option 002)8.4.6 Environment Performance8.4.7 Mechanical Performance
99 SupportSupport9.19.1 Maintenance and CleaningMaintenance and Cleaning
9.1.1 Maintenance9.1.2 Cleaning
9.29.2 Notes On StorageNotes On Storage9.39.3 Formatting the data area in the Network MasterFormatting the data area in the Network Master9.49.4 Upgrading the SoftwareUpgrading the Software9.59.5 Support and Service AssistanceSupport and Service Assistance
9.5.1 Before you obtain assistance9.5.2 Obtaining Support or Service Assistance
9.69.6 Transporting and DisposalTransporting and Disposal
Table of ContentsTable of Contents
66

217217217217217218218218218219219219220220224224226226226226226227228229229229229230230230233233237237237237238238239239239240240240240240241241241241241242
9.69.6 Transporting and DisposalTransporting and Disposal9.6.1 Repackaging9.6.2 Transporting9.6.3 Disposal
9.79.7 Special InformationSpecial Information9.7.1 Equipment Certificate9.7.2 Anritsu Warranty9.7.3 Anritsu Corporation Contact9.7.4 Licensing Information9.7.5 Availability of Source Code
9.89.8 Software License DocumentSoftware License Document9.99.9 EULA License DocumentEULA License Document9.109.10 CE Conformity MarkingCE Conformity Marking
9.10.1 Product Model9.10.2 Applied Directive9.10.3 Applied Standards9.10.4 Authorized Representative9.10.5 CE Declaration
9.119.11 RCM Conformity MarkingRCM Conformity Marking9.11.1 Product Model9.11.2 Applied Standards
9.129.12 Laser SafetyLaser Safety9.12.1 Laser Safety Classifications9.12.2 Indication Labels on Product9.12.3 Laser Radiation Markings
9.139.13 Wireless CertificationWireless Certification9.13.1 Japan MIC9.13.2 North America (USA FCC and Canada IC)9.13.3 Europe CE9.13.4 Brazil ANATEL9.13.5 China SRRC9.13.6 Indonesia SDPPI9.13.7 Israel MoC9.13.8 Mexico IFETEL9.13.9 Philippines NTC9.13.10 Russia CU Scheme and Minsvyaz9.13.11 Singapore IMDA9.13.12 Thailand NTC
9.149.14 DeclarationsDeclarations9.14.1 Notes on Export Management9.14.2 Information for EU and EFTA Customers Only9.14.3 Information for U.S. Customers Only9.14.4 Information for the Chinese Market Only
77

Table of ContentsTable of Contents
88

11 IntroductionIntroductionThis chapter provides a general introduction to the MT1000A Network MasterPro, and explains the symbols and conventions used in this manual.
99

11..11 MainframeMainframe
The MT1000A Network Master Pro (hereafter called the Network Master andsometimes the instrument) is a battery-powered multipurposetelecommunications test instrument for field use. It is a tool for a wide range ofapplications from fast first-aid troubleshooting to comprehensive, in-depthanalysis of transmission problems. The installed options enable the NetworkMaster to be used both as a full-featured transmission line quality tester and asan advanced signaling analyzer.
The Network Master features a wide TFT LCD display with touch screeninterface, where results are easily read and color coding and graphical symbolsaid the users in system setup and results analysis. The Network Master alsoallows users to store applications settings to reduce time for futureconfigurations. For fast and efficient data transfer and external communication,
the Network Master houses LAN interface, Bluetooth® and three USB ports.
Fault location is greatly facilitated by the high degree of portability of therobust Network Master, allowing measurements to be taken at any suitablemeasuring point. Accordingly, the Network Master can be powered either by arechargeable and replaceable intelligent high-capacity Li-Ion battery, or viamains adapter for long-term measurements.
Altogether, these features guarantee the supreme functionality of the NetworkMaster, allowing both convenience and optimal user-friendly operation.
For latest information, refer to the homepage below. http://www.anritsu.com/en-us/test-measurement/products/mt1000a
IntroductionIntroduction
1010

11..22 OTDR Module 1310/1550nm SMF (MU100020A)OTDR Module 1310/1550nm SMF (MU100020A)
MU100020A OTDR module is the model dedicated for single mode fibertesting. For the communication through a single mode fiber, 1310 nm or 1550nm wavelength optical signal is used. The MU100020A is able to output theseoptical signals for OTDR test or the light source. MU100020A equips theoptical power meter which is convenient for checking the optical power level.By combining with the light source and the optical power meter , the opticalloss can measure the optical loss of an optical device. This application is theoptical loss test set (OLTS).
Visual Fault Locator (VFL) OptionVisual Fault Locator (VFL) OptionIt is a visible (red) light source. Since the light is visible, it is useful for locating faults
in the dead zone by visually checking for diffuse escaping light.
11..33 OTDR Module 1310/1550/850/1300nm SMF/MMFOTDR Module 1310/1550/850/1300nm SMF/MMF(MU100021A)(MU100021A)
MU100021A OTDR module is the model available to test both of single modefiber and multi mode fiber. Optical wavelength used for the communicationthrough a multi mode fiber is 850 nm or 1300 nm.
11..44 OTDR Module 1310/1550/1625nm SMF (MU100022A)OTDR Module 1310/1550/1625nm SMF (MU100022A)
MU100022A OTDR module has the 1625 nm wavelength light source inaddition to 1310 nm and 1550 nm wavelength light source. Using the signal of1625 nm wavelength allows the OTDR test which does not have an effect onthe communication.
OTDR Module 1310/1550nm SMF (MU100020A)OTDR Module 1310/1550nm SMF (MU100020A)
1111

11..55 Symbols and ConventionsSymbols and Conventions
11..55..11 Symbols Used in ManualSymbols Used in Manual
To prevent the risk of personal injury or loss related to equipment malfunction,Anritsu Corporation uses the following safety symbols to indicate safety-relatedinformation. Ensure that you clearly understand the meanings of the symbolsBEFORE using the equipment. Some or all of the following symbols may beused on all Anritsu equipment. In addition, there may be other labels attachedto products that are not shown in the diagrams in this manual.
DANGERDANGER This indicates a very dangerous procedure that could result in serious injury ordeath if not performed properly.
WARNINGWARNING This indicates a hazardous procedure that could result in serious injury or deathif not performed properly.
CAUTIONCAUTIONThis indicates a hazardous procedure or danger that could result in light-to-severe injury, or loss related to equipment malfunction, if proper precautions arenot taken.
11..55..22 Safety Symbols Used on EquipmentSafety Symbols Used on Equipment
The following safety symbols are used on Anritsu equipment near operationlocations to provide information about safety items and operation precautions.Ensure that you clearly understand the meanings of the symbols and take thenecessary precautions BEFORE using the equipment.
This indicates a prohibited operation. The prohibited operation is indicated symbolicallyin or near the barred circle.
This indicates an obligatory safety precaution. The obligatory operation is indicatedsymbolically in or near the circle.
This indicates a warning or caution. The contents are indicated symbolically in or nearthe triangle.
This indicates a note. The contents are described in the box.
These indicate that the marked part should be recycled.
A number of typographical conventions are used for easy spotting ofinformation. Examples below are shown in grey boxes in this section only toindicate that they are 'examples'.
11..55..33 NotesNotes
The Note symbol indicates information, procedures or recommendations that need to befollowed to make correct measurements etc. Note text is written in italics to separate theinformation from the other text elements on a page.
IntroductionIntroduction
1212

11..55..44 HintsHints
The Hint symbol indicates information that should be treated as hints, suggestions,recommendations etc. Hint text is written in italics to separate the information from theother text elements on a page.
11..55..55 OptionOption
The Option symbol indicates that the information described covers an option (hardwareand software) and that this option must be installed before use. Text is written in italicsto separate the information from the other text elements on a page.
Symbols and ConventionsSymbols and Conventions
1313

11..66 For SafetyFor Safety
This section contains warnings which should be followed to avoid personalinjury, product damage, as well as damage to the environment.
11..66..11 DangersDangers
DANGERDANGER
Replacing BatteryReplacing Battery When replacing the battery, use the specified battery and insert it with the
correct polarity. If the wrong battery is used, or if the battery is inserted with
reversed polarity, there is a risk of explosion causing severe injury or death.
FOR CALIFORNIA USA ONLYFOR CALIFORNIA USA ONLY
This product contains a CR Coin Lithium Battery which contains Perchlorate Material
- special handling may apply, see www.dtsc.ca.gov/hazardouswaste/perchlorate.
Battery DisposalBattery Disposal DO NOT expose batteries to heat or fire. This is dangerous and can result in
explosions or fire. Heating batteries may cause them to leak or explode.
11..66..22 WarningsWarnings
WARNINGWARNING
ALWAYS refer to the operation manual when working near locations at which
the alert mark shown on the left is attached. If the advice in the operation
manual is not followed, there is a risk of personal injury or reduced equipment
performance. The alert mark shown on the left may also be used with other
marks and descriptions to indicate other dangers.
Overvoltage Category
This equipment complies with overvoltage category II defined in IEC 61010.
DO NOT connect this equipment to the power supply of overvoltage category
III or IV.
Laser radiation warning
NEVER look directly into the cable connector on the equipment nor into the
end of a cable connected to the equipment. There is a risk of injury if laser
radiation enters the eye.
The Laser Safety label is attached to the equipment for safety use as indicated
in "Laser Safety".
RepairRepair Only qualified service personnel with a knowledge of electrical fire and shock
hazards should service this equipment. This equipment cannot be repaired by
the operator. DO NOT attempt to remove the equipment covers or unit covers
or to disassemble internal components. In addition, there is a risk of damage
to precision components.
IntroductionIntroduction
1414

CalibrationCalibration The performance-guarantee seal verifies the integrity of the equipment. To
ensure the continued integrity of the equipment, only Anritsu service
personnel, or service personnel of an Anritsu sales representative, should
break this seal to repair or calibrate the equipment. Be careful not to break the
seal by opening the equipment or unit covers. If the performance-guarantee
seal is broken by you or a third party, the performance of the equipment
cannot be guaranteed.
Battery FluidBattery Fluid DO NOT short the battery terminals and never attempt to disassemble the
battery or dispose of it in a fire. If the battery is damaged by any of these
actions, the battery fluid may leak. This fluid is poisonous. DO NOT touch the
battery fluid, ingest it, or get in your eyes. If it is accidentally ingested, spit it
out immediately, rinse your mouth with water and seek medical help. If it
enters your eyes accidentally, do not rub your eyes, rinse them with clean
running water and seek medical help. If the liquid gets on your skin or clothes,
wash it off carefully and thoroughly with clean water.
LCDLCD This equipment uses a Liquid Crystal Display (LCD). DO NOT subject the
equipment to excessive force or drop it. If the LCD is subjected to strong
mechanical shock, it may break and liquid may leak. This liquid is very caustic
and poisonous. DO NOT touch it, ingest it, or get in your eyes. If it is ingested
accidentally, spit it out immediately, rinse your mouth with water and seek
medical help. If it enters your eyes accidentally, do not rub your eyes, rinse
them with clean running water and seek medical help. If the liquid gets on
your skin or clothes, wash it off carefully and thoroughly with soap and water.
For SafetyFor Safety
1515

11..66..33 CautionsCautions
CAUTIONCAUTION
Replacing MemoryReplacing MemoryBack-up BatteryBack-up Battery
This equipment uses a Poly-carbomonofluoride lithium battery to back up the
memory. This battery must be replaced by service personnel when it has reached the
end of its useful life; contact the Anritsu sales section or your nearest representative.
Note: The battery used in this equipment has a maximum useful life of 8 years. It shouldbe replaced before this period has elapsed.The life of the battery will vary depending on the length of equipment usage and the
operating environment.
The following conditions may be observed if the battery has expired:
When power to the equipment is supplied, the time display may no longer
match the actual time.
Parameter and data settings may not be retained when the power to the
equipment is cut.
External StorageExternal Storage This equipment uses a USB memory as external storage media for storing data and
programs.
If this media is mishandled or becomes faulty, important data may be lost. It is
recommended to periodically back up all important data and programs to protect
them from being lost accidentally.
Anritsu will not be held responsible for lost data.Pay careful attention to the following points:
Never remove the USB memory from the equipment while it is being accessed.
The USB memory may be damaged by static electric charges.
Anritsu has thoroughly tested all external storage media shipped with this
equipment. Users should note that external storage media not shipped with
this equipment may not have been tested by Anritsu, thus Anritsu cannot
guarantee the performance or suitability of such media.
Lifetime of PartsLifetime of Parts The life span of certain parts used in this equipment is determined by the operating
time or the power-on time. Due consideration should be given to the life spans of
these parts when performing continuous operation over an extended period. The
safety of the equipment cannot be guaranteed if component parts are used beyond
their life spans. These parts must be replaced at the customer's expense even if
within the guaranteed period described in Warranty at the end of this manual.
For details on life-span, refer to the corresponding section in this manual.
LCD: Brightness at 50% after 40,000hrs
Battery pack Capacity: 70% after 300 charge/discharge cycles
Use in ResidentialUse in ResidentialEnvironmentEnvironment
This equipment is designed for an industrial environment. In a residential
environment, this equipment may cause radio interference in which case the user
may be required to take adequate measures.
Use in CorrosiveUse in CorrosiveAtmospheresAtmospheres
Exposure to corrosive gases such as hydrogen sulfide, sulfurous acid, and hydrogen
chloride will cause faults and failures.
Note that some organic solvents release corrosive gases.
IntroductionIntroduction
1616

11..66..44 Cautions against Computer Virus InfectionCautions against Computer Virus Infection
Copying files and dataCopying files and data
Only files that have been provided directly from Anritsu or generated usingAnritsu equipment should be copied to the instrument.
All other required files should be transferred by means of USB media afterundergoing a thorough virus check.
Adding softwareAdding software
Do not download or install software that has not been specificallyrecommended or licensed by Anritsu.
Network connectionsNetwork connections
Ensure that the network has sufficient anti-virus security protection in place.
For SafetyFor Safety
1717

11..77 PrecautionsPrecautions
This section contains some precautions which should be followed to avoiddamage or malfunction due to incorrect use, handling and transportation of theNetwork Master.
11..77..11 InstallationInstallation
Install MT1000A horizontally in a stable place.
CAUTIONCAUTION
If the MT1000A is not installed in a "good" direction as above, a small shockmay turn it over and harm the user.
MT1000A equips the support stand on the rear panel. When using MT1000Aon a desk, open the support stand on the rear the panel
11..77..22 VentilationVentilation
The instrument has built-in fans, to prevent the temperature to rise inside theinstrument.
CAUTIONCAUTION
Be sure not to block the ventilation holes.Be sure not to block the ventilation holes.
IntroductionIntroduction
1818

In this instrument, cooling air is taken in through the side panel, and hot air isexhausted through the bottom panel. When using MT1000A on a desk, openthe support stand on the rear the panel
11..77..33 ESD (Electrostatic Discharge)ESD (Electrostatic Discharge)
Modules and options for the Network Master contain electronic devices that are
sensitive to ESD (Electro Static Discharge). Therefore, all ESD sensitive items are
delivered from Anritsu in antistatic shielding packages.
Electrostatic discharge during installation can result in destruction ordegradation of these devices. The damage may lead to equipment failure later.When you install or remove modules, it is your responsibility to control ESD.To control ESD, take the issues described below into consideration.
CAUTIONCAUTION
Avoid build-up of electrostatic chargeAvoid build-up of electrostatic charge
Keep your workplace clear of any item that can generate electrostatic charges,
e.g. all items that are not made of antistatic materials.
Minimize the exposure to ESDMinimize the exposure to ESD
Keep ESD sensitive items in antistatic shielding packaging as long as
possible.
Do not remove ESD sensitive items from equipment or the antistatic shielding
packaging unless you are connected to the equipment with a grounding wrist
strap (as described later).
Return ESD sensitive items to antistatic shielding packaging.
Keep equipment, the ESD sensitive items and yourself at the same staticKeep equipment, the ESD sensitive items and yourself at the same staticpotentialpotential
If your workplace is already prepared for handling ESD sensitive items, then
follow your usual procedure. If not, you should follow the procedure below
using a ground wrist strap.
1. Attach the wrist end of the wrist strap firmly around your wrist and the other
end to the equipment chassis or ground plug.
2. Keep the wrist strap on while you install or remove ESD sensitive items. Do
not remove the wrist strap until the ESD sensitive parts are either installed or
returned to the antistatic shielding package.
PrecautionsPrecautions
1919

11..77..44 Optical ConnectorsOptical Connectors
The optical connectors are very sensitive to contamination. Be aware thatcontamination of the optical connectors may result in severe loss of signal.
CAUTIONCAUTION
To prevent contamination of the optical connectors, mount protective caps toTo prevent contamination of the optical connectors, mount protective caps toseal the seal the optical connectors when no fiber optic cables are connected.optical connectors when no fiber optic cables are connected.
11..77..55 Cautions on Handling Optical Fiber CablesCautions on Handling Optical Fiber Cables
Optical fiber cables may degrade in performance or be damaged if handledimproperly. Note the following points when handling them.
WARNINGWARNING
Do not touch the end of a broken optical fiber cable.Do not touch the end of a broken optical fiber cable.
The broken optical fiber may pierce the skin, causing injury.
CAUTIONCAUTION
Do not pull the cable when removing the connector.Do not pull the cable when removing the connector.
Doing so may break the optical fiber inside the cable, or remove the cablesheath from the optical connector.
CAUTIONCAUTION
Do not excessively bend, fold, or pinch an optical fiber cable.Do not excessively bend, fold, or pinch an optical fiber cable.
Doing so may break the optical fiber inside the cable.
Keep the bend radius of an optical fiber cable at 30 mm or more. If the radiusis less, optical fiber cable loss will increase.
IntroductionIntroduction
2020

CAUTIONCAUTION
Do not excessively pull on or twist an optical fiber cable.Do not excessively pull on or twist an optical fiber cable.
Also, do not hang anything by using a cable. Doing so may break the opticalfiber inside the cable.
CAUTIONCAUTION
Be careful not to hit the end of an optical connector against anything hardBe careful not to hit the end of an optical connector against anything hardsuch as the floor or a desk by dropping the optical fiber cable.such as the floor or a desk by dropping the optical fiber cable.
Doing so may damage the connector end and increase connection loss.
CAUTIONCAUTION
Do not disassemble optical connectors.Do not disassemble optical connectors.
Doing so may cause part to break or the performance to degrade.
PrecautionsPrecautions
2121

11..77..66 Countries and Regions Permitting WLAN UseCountries and Regions Permitting WLAN Use
Use of WLAN is restricted in some countries and regions, and illegal use maybe punishable under national or local regulations. To avoid violating WLANregulations, visit the Anritsu website to check where use is allowed.
http://www.anritsu.com/ja-JP/test-measurement/support/downloads/brochures-datasheets-and-catalogs/dwl16689
Note that Anritsu cannot be held liable for any problem arising from WLAN usein other countries and regions.
IntroductionIntroduction
2222

22 ConfigurationConfigurationThis chapter contains information about the included accessories as well asguidelines for connecting the mains adapter, for charging the battery, forattaching the carrying strap, and how to replace the modules.
2323

22..11 Delivered AccessoriesDelivered Accessories
The instrument is delivered in a shipment container together with variousaccessories depending on the order. When unpacking the first time, it isrecommended to check these accessories against the list(s) below.
22..11..11 Standard AccessoriesStandard Accessories
The following standard accessories are delivered with the instrument:
MT1000AMT1000A
J0980 A-2 Power Cord *1
J0981 B4 Power Cord *1
J0982 C7 Power Cord *1
J0983 S3 Power Cord *1
J1027 P4 Power Cord *1
G0310A LiION Battery
G0385A High Power AC Adapter
B0690A Softbag
B0728A Rear Panel Kit
Z1746A Stylus
Z1747A Carrying Strap
Z1748A Handle
Z1817A Utilities ROM
W3935AE MT1000A Transport Modules Quick Reference Guide
MU100010AMU100010A
B0692A ESD box *2
*1: One of these power cord come with according to your country.
*2: Up to four SFP+/SFPs can be stored.
MU100090AMU100090A
J1705A AUX Conversion Adaptor
J1706A GPS Antenna
J1710A BNC Cable (20cm)
22..11..22 Optional AccessoriesOptional Accessories
One or more of the following optional accessories may be delivered with theinstrument (if included in the order):
ConfigurationConfiguration
2424

B0691A Hard case
B0691B Hard case
B0720A Rear Cover
B0729A Screw 1U
B0730A Screw 2U
B0731A Screw 3U
B0732A Screw Kit
B0733A Hard Case
G0306B Video Inspection Probe
G0324A Battery Charger
G0325A GPS receiver
G0382A Autofocus Video Inspection Probe
J1569A Car 12 Vdc adapter
J1667A GPIB-USB Converter
W3933AE MT1000A Transport Modules Operation Manual
W3736AEMT1000A Network Master Pro/ MT1100A Network Master Flex
Remote Scripting Operation Manual
22..22 Mains Power AdapterMains Power Adapter
The Network Master can be powered from the supplied AC mains adapter.
CAUTIONCAUTION
Always use AC mains adapter delivered from Anritsu.Always use AC mains adapter delivered from Anritsu.
22..22..11 Connecting Mains Power AdapterConnecting Mains Power Adapter
To connect the mains power adapter to the Network Master, follow theprocedure below:
1. Insert the mains adapter's DC power plug into the socket connector marked
'18V DC'. The DC input connector is located on the right-hand side of Network
Master's connector panel.
When option 006 is installed, the area around DC input connector is
marked in yellow. Connect G0385A High power DC adaptor.
When option 006 is not installed, connect G0309A DC adaptor.
2. Connect the AC plug of the mains adapter to the mains and switch on the
mains wall outlet. The power button will flash fast on orange during booting.
Then flashes slowly on orange when charging.
Mains Power AdapterMains Power Adapter
2525

Initial chargingInitial charging
TemperatureTemperature
22..33 Rechargeable BatteryRechargeable Battery
The Network Master is delivered with a 10.8 V Intelligent Li-Ion rechargeableand replaceable battery. The typical operation capacity (with a fully chargedbattery) will be approximately 4 hours.
CAUTIONCAUTION
Use only original batteries delivered from Anritsu, to prevent the risk ofUse only original batteries delivered from Anritsu, to prevent the risk ofinstrument damage or personal injury.instrument damage or personal injury.
Battery should only be charged at room temperature.Battery should only be charged at room temperature.
The battery will normally be partially or fully discharged on delivery. It isrecommended to charge the battery immediately after delivery and unpacking.In Stand By Mode, the ON/OFFON/OFF indicator will stop flashing when the battery isfully charged.
If the battery will not to be used for a long period of time, it is recommended that itcontains at least 20% capacity. Charge the battery before storage, if necessary.
When charging is in process, the temperature of the battery will increase. Theintelligence of the battery will ensure that the charging takes place at thecorrect temperature.
If the battery temperature reaches 60°C or over while Network Master is in batteryoperation, Network Master shuts down automatically. In this case, leave the NetworkMaster for approximately one hour to cool itself at room temperature (around 25°C)before using Network Master again.
22..33..11 Installing or Replacing BatteryInstalling or Replacing Battery
To install or replace the battery in the Network Master, follow the procedurebelow:
1. Disconnect the mains power adapter if it is connected.
2. Switch the Network Master OFFOFF.
3. Place the instrument on its back on a plain surface and turn the lock screw of
the battery compartment to match the unlock mark.
4. Remove the lid of the battery compartment.
5. Pull out the battery from the compartment.
ConfigurationConfiguration
2626

Indication duringIndication duringchargingcharging
6. When installing the battery, note the direction of the battery terminals. With
the instrument placed on its back - and the battery compartment in front of
you - the terminals should be in the upper left corner.
7. Re-install the battery compartment door and tighten the lock screw.
22..33..22 Charging Battery in Fast ModeCharging Battery in Fast Mode
Power is supplied from the external AC mains adapter - and the NetworkMaster is switched OFFOFF during the charging (Stand By Mode).
To charge the Network Master battery using the fast charge mode, follow theprocedure below:
1. Switch the Network Master OFFOFF.
2. Connect the mains adapter, as described in the "Connecting Mains Power
Adapter" section.
When the mains adapter has connected, the Power button will flash afterapprox. 30 seconds, indicating that charging is in progress. When the flashingstops, the charging is complete. If the battery is defective - the Power buttonwill also light. Therefore, the best way to check the battery status is to switch onthe Network Master and observe the battery information as described in theInstrument toolbar section.
22..33..33 Charging Battery in Normal ModeCharging Battery in Normal Mode
Power is supplied from the external AC mains adapter - and the NetworkMaster is switched ONON during the charging.
A normal charging of the battery is taking place every time the instrument is inuse and connected to the mains adapter.
The battery status can be checked in the instrument toolbar (expandable icontoolbar) on the right-hand side of the screen, or in the status line if the batteryindicator is displayed there. See the "Battery Status Information" section below.
22..33..44 Battery Status InformationBattery Status Information
The battery icon is displayed in the status line at the bottom of the screen.
The following icons are used to indicate the current battery status:
Rechargeable BatteryRechargeable Battery
2727

The battery is fully charged. The Network Master is using the AC adapter as power
source.
There is no battery in the Network Master (or the battery is malfunctioning). The
Network Master is using the AC adapter as power source.
The Network Master is using the battery as power source. The AC adapter is not
connected.
Battery charging is not doing because it is out of rechargeable temperature range.
The Network Master is using the AC adapter as power source.
There is a delay of several seconds before the battery status is updated.
A more detailed battery status information is launched when touching thebattery icon. The example in the figure below shows the status screen of abattery during charging.
ConfigurationConfiguration
2828

22..44 Optical FibersOptical Fibers
Open the protective cover of the measurement port, then connect the opticalfiber under the test.
CAUTIONCAUTION
Never force the connector ferrule or insert it at an angle Never force the connector ferrule or insert it at an angle into the adapter.into the adapter.Optical fibers are susceptible to loss from Optical fibers are susceptible to loss from microbends or other stress.microbends or other stress.
Connect the optical fiber cable to the port displayed on the Connect the optical fiber cable to the port displayed on the screen. If thescreen. If theoptical fiber cable is connected to a wrong port, optical fiber cable is connected to a wrong port, you cannot obtain accurateyou cannot obtain accuratemeasurement values.measurement values.
1. Open the protective cover on the Measurement Port.
2. Clean the surfaces of the connector and fiber before connecting the fiber.
Refer to Optical Connector/Optical Adapter Cleaning for details.
3. Connect the fiber under test directly to the measurement port.
Commonly Used Optical ConnectorsCommonly Used Optical Connectors
Connectors of OPM and VFL ports are Universal type. Be careful not loosen theconnector during measurement.
Optical FibersOptical Fibers
2929

22..55 Support Stand and Carrying StrapSupport Stand and Carrying Strap
22..55..11 Support StandSupport Stand
The Network Master is equipped with a support stand keeping the instrument ata convenient angle during the operation. To extract the stand: pull out themetal bar on rear of the instrument - it automatically stays in the correctposition.
Be sure to open a support stand fully. Otherwise, the Network Master will bemore likely to tip over. Moreover, the air flow on bottom panel will beinsufficient.
22..55..22 Carrying Strap and HandleCarrying Strap and Handle
The included carrying strap and handle can easily be mounted for yourconvenience when transporting and/or using the Network Master.
The carrying strap is equipped with hooks for easy installation.
WARNING WARNING
Use the Carrying Strap around your shoulder. Do not wrap the strap aroundyour neck.
ConfigurationConfiguration
3030

How to attach carrying strap and handleHow to attach carrying strap and handle
To attach carrying strap (Z1747A) and handle (Z1748A) to MT1000A NetworkMaster Pro, follow instructions below. The procedure is same for OTDR modules.
1. Use screw driver and remove the battery lid from MT1000A.
2. Remove the battery pack.
3. Loosen four screws at each corner of MU100010A.
4. Separate MT1000A and MU100010A.
5. Attach the handle on either right or left side.
Support Stand and Carrying StrapSupport Stand and Carrying Strap
3131

6. Detailed photos for upper and lower corner.
7. Remove the buckle cap from the handle and the carrying strap.
8. Mount the carrying strap on both upper corners.
ConfigurationConfiguration
3232

9. Attach MT1000A and MU100010A , insert the battery pack and mount the
battery lid with the reverse sequence at the beginning.
Support Stand and Carrying StrapSupport Stand and Carrying Strap
3333

22..66 Modules ConfigurationModules Configuration
Following modules are available for MT1000A.
Transport Modules
MU100010A 10G Multirate Module
MU100011A 100G Multirate Module
OTDR Modules
MU100020A OTDR Module 1310/1550nm SMF
MU100021A OTDR Module 1310/1550/850/1300nm SMF/MMF
MU100022A OTDR Module 1310/1550/1625nm SMF
CPRI RF Module
MU100040A CPRI RF Module
GPS Module
MU100090A High Performance GPS Disciplined Oscillator
MT1000A is able to mount up to three modules. Available modulecombinations are eleven kinds and shown in the table below. Only one OTDR module can be mounted to the MT1000A.
One module configurationOne module configuration
Transport OTDR* CPRI RF*
MT1000A MT1000A MT1000A
Two modules configurationTwo modules configuration
Transport Transport Transport OTDR* CPRI RF*
OTDR GPS CPRI RF CPRI RF OTDR
MT1000A MT1000A MT1000A MT1000A MT1000A
Three modules configurationThree modules configurationTransport Transport Transport
OTDR OTDR CPRI RF
GPS CPRI RF OTDR
MT1000A MT1000A MT1000A
*: When OTDR module or CPRI RF module is mounted last on the back, installthe rear panel. B0728A Rear Panel Kit comes with different length screws.
Model Name
B0731A Screw 3U
B0730A Screw 2U
B0729A Screw 1U
The modules configuration that uses an MU100011A 100G Multirate Module,MT1000A-006 high power supply is required for MT1000A even whenmeasurement function of MU100011A is not used.
ConfigurationConfiguration
3434

22..77 Attaching the ModulesAttaching the Modules
An OTDR module is attached to MT1000A by combinating with one offollowing.
Rear panel
MU100010A 10G Multirate module
MU100011A 100G Multirate module
CAUTIONCAUTION
Replacing modules operation should be done on the table where antistaticmeasures are taken.
This section describes removing and to attaching MU100010A.
22..77..11 Replacing the MU100010A 10G Multirate modulesReplacing the MU100010A 10G Multirate modules
1. Switch the Network Master OFFOFF.
2. Before the detaching operation, disconnect the AC adapter and remove the
battery pack.
3. Place the instrument on its front on a plain surface.
4. Loosen the screws (shown by the yellow circle) on rear side of the MU100010A
10G Multirate module.
5. After loosing the four screws, lift up the 10G Multirate Module with holding
both sides. If you cannot lift up, loosen the four screws again. You can see the
panel as below.
To detach the OTDR module, do the same operation as detaching the PowerSupply Module.
22..77..22 Attaching OTDR module with 10G Multirate moduleAttaching OTDR module with 10G Multirate module
Attaching the ModulesAttaching the Modules
3535

1. Place the instrument on its front on a plain surface.
2. Attach OTDR module to MT1000A. Place OTDR module on MT1000A as to
connect following pairs: 1 - 4, 2 - 5, 3 - 6.
Be careful not to bump the guide pins (2, 3, 5 and 6) to the connectors (1 and
4).
3. Remove four screws of 10G Multirate module and replace to screws 2U in
B0728A Rear Panel Kit.
4. Attach 10G Multirate module to OTDR module. Place 10G Multirate module on
the OTDR modules as to connect following pairs: 7 - 10, 8 - 11, 9 - 12.
Be careful not to bump the guide pins (8, 9, 11 and 12) to the connectors (7 and
10).
ConfigurationConfiguration
3636

5. Tighten the four screws.
After the module attachment has finished, the external appearance will be as
below.
6. After attaching the modules, connect the AC cable or install the battery packs.
22..77..33 Attaching OTDR module without 10G Multirate moduleAttaching OTDR module without 10G Multirate module
1. Place the instrument on its front on a plain surface.
2. Attach OTDR module to MT1000A. Place OTDR module on MT1000A as to
connect following pairs: 1 - 4, 2 - 5, 3 - 6.
Be careful not to bump the guide pins (2, 3, 5 and 6) to the connectors (1 and
4).
3. Insert screws 1U in B0728A Rear Panel Kit to four corners of the rear panel.
Attaching the ModulesAttaching the Modules
3737

4. Place the rear panel on the OTDR module.
5. Tighten the four screws.
After the module attachment has finished, the external appearance will be as
below.
6. After attaching the modules, connect the AC cable or install the battery packs.
ConfigurationConfiguration
3838

33 Human-Machine-InterfaceHuman-Machine-InterfaceHuman-Machine-Interface (HMI) covers the relation between the user and theinstrument - in other words: the information you get from the instrumentcombined with the action you add to the instrument.
The informative part is the TFT display, and the part susceptible to influence isthe touch-active layer of the screen. Connections made to the input and outputconnectors are included in the HMI as well.
3939
33..11 Touch Screen DisplayTouch Screen Display
The 9 inch active TFT display with WVGA resolution (800x480 pixels) is usedfor setups and for presentation of results (that is, for all interaction with theinstrument). As the display includes touch screen functionality, it is possible tonavigate and operate directly from it.
The touch screen display is constructed to be operated by the tip of your fingeror by the included Stylus (Anritsu part No. Z1746A). The touch screen surfaceis made of delicate material and is easily scratched or damaged if handledincorrectly.
CAUTIONCAUTION
Never expose the touch screen to excessive pressure as this may damage itsNever expose the touch screen to excessive pressure as this may damage itsfunctionality.functionality.
Never use sharp objects (e.g. pens, paper clips etc.) to operate Never use sharp objects (e.g. pens, paper clips etc.) to operate the touchthe touchscreen, as this may damage the surface.screen, as this may damage the surface.
If the touch screen breaks and liquid leaks out, DO NOT touch or If the touch screen breaks and liquid leaks out, DO NOT touch or ingest theingest theliquid and avoid getting it in your eyes. The liquid may be liquid and avoid getting it in your eyes. The liquid may be poisonous.poisonous.
Only use a soft cloth moisturized with a mild detergent to clean the surface ofthe touch screen. Be sure to power off and disconnect main power adapter.
Human-Machine-InterfaceHuman-Machine-Interface
4040

33..22 Key OperationKey Operation
The only physical operator key (the Power button) is described in this section.
33..22..11 Power ButtonPower Button
The Power button on the front panel of the instrument is used to switch power ON
and OFF. In addition, the menu used for power-off also contains a few extra options
(e.g. to lock the screen).
Gray: Power off
Orange flashing (fast): Booting in case of AC operation
Green flashing: Booting in case of the battery operation
Orange flashing (slow): Charging
Orange: Stand by
Green: Operating
Switching power ONSwitching power ON
AC OperationAC Operation
Connect the mains power adapter to the Network Master. The Network Masterflashes the power button in orange during booting. The power button lights inorange after booting. To start your test, press the power button. The power button lights in green.After a model name is displayed, the Network Master enters Operating statusand shows the Application Selector.
Battery OperationBattery Operation
Press the power button. The Network Master shows a model name and flashesthe power button in green during booting. Then, the Network Master enters Operating status and shows the ApplicationSelector.
Switching power OFFSwitching power OFF
When you press the Power button, a pop-up menu containing Shut DownShut Down willappear.
Touch Shut DownShut Down and then confirm by touching YesYes in a dialog box.
Key OperationKey Operation
4141

AC OperationAC Operation
After you shut the Network Master down, the Network Master goes back toStand by or Charging state. The Network Master stays Stand by or Charging state until you disconnect themains power adapter.
Battery OperationBattery Operation
After you shut the Network Master down, the power goes off.
Forcing power OFFForcing power OFF
If it is not possible to power down the Network Master using the power buttonmenu, the following procedure can be used to make an emergency powerdown.
1. Disconnect AC adapter if it is connected.
2. Hold the Power button depressed for a couple of seconds.
It is not recommended to force a power-off except in emergencies.
Additional options in power button menuAdditional options in power button menu
Apps SwitcherApps Switcher
Shows all currently activated applications and allows you to switch amongthem.
Capture ScreenCapture Screen
Saves a screen shot image in .PNG format. The image file will be saved in'Internal/screens' folder or an attached USB memory stick.
Lock ScreenLock Screen
Locks or unlocks the screen.
Human-Machine-InterfaceHuman-Machine-Interface
4242

33..33 Head SetHead Set
You can use the commercially available head set (3.5 φ CTIA).
OTDR module do not have applications which use the head set.
The volume is controlled from the General setup in 'Instrument Toolbar'.
The head set is connected to the socket marked with a head set symbol on theconnector panel of the Network Master.
Head SetHead Set
4343

33..44 Connector PanelConnector Panel
All connections (both for test interfaces and for service interfaces) are placedon the connector panel of the Network Master.
The figure below shows the connector panel of the mainframe andMU100021A.
33..44..11 Test InterfacesTest Interfaces
The connector panel contains the following port connectors to be used for thetests:
VFL Optical output of Visible Fault Locator (Optional)
OPM
Optical power meter input
1.25 mmø or 2.5 mmø ferrule can be connected by using Universal
connectors provided as standard accessory.
Universal connectors are screw type. To remove it, turn
counterclockwise.
OTDR/OLS
(0.85/1.31 μm)
Connector used for testing multi-mode fiber. Outputs the optical
pulse of 850 nm or 1300 nm wavelength.
Only MU100021A has this connector.
UPC connector is used to this connector even if Option 011 is
installed.
OTDR/OLS
(1.31/1.55 μm)*
Connector used for testing single mode fiber. Outputs the optical
pulse of 1310 nm or 1550 nm wavelength.
For MU100022A, outputs the optical pulse of 1310 nm, 1550 nm or
1625 nm wavelength.
The connector polish depends on the option:
Option 010: UPC Connector
Option 011: APC Connector
*: For MU100022A, (1.31/1.55/1.625 μm)
Human-Machine-InterfaceHuman-Machine-Interface
4444

33..44..22 Service InterfacesService Interfaces
All connections concerning the service interfaces are also located on theconnector panel:
AudioThe audio connector is used for connecting to an optional head
set.
AUX The AUX connector is used for optional G0325A GPS Receiver.
Ext Clock Input The Ext Clock Input connector is used for reference clock input.
USB B The three USB connectors (two connectors type A and one
connector type B mini) can, for example, be used for
connection with USB memory stick. This is convenient for the
exchanging of information to other instrument.USB A
Ethernet service
interface
The Ethernet connector is used for connecting the Network
Master to a Local Area Network, e.g. to remotely operate the
instrument from a Personal Computer (hereafter, "PC").
DC input (18 VDC)The DC power connector is used for connection of 18 V DC
power delivered from the AC Adapter.
33..44..33 Optical Connector/Optical Adapter CleaningOptical Connector/Optical Adapter Cleaning
WARNINGWARNING
Check that no light is being emitted when cleaning and checking the ferruleend surface.
CAUTIONCAUTION
The Network Master may not satisfy performance when used with dirt or dustadhering to the ferrule end surface. In addition, the connected fiber and/or theNetwork Master ferrule end surface may be burned if high output light isemitted in this state. Fully clean the fiber to be connected and the NetworkMaster ferrule end surface before measurement.
Connector PanelConnector Panel
4545

Cleaning the Network Master Connector Ferrule End SurfaceCleaning the Network Master Connector Ferrule End Surface
Use an approved adapter cleaner to clean the ferrule inside of the NetworkMaster measurement port(s). The ferrule should be cleaned periodically.Although the following procedures use the FC connector and adapter as anexample, use the same methods when cleaning other connector and adaptertypes.
1. Remove the currently connected adapter by raising the adapter lever (you will
hear a "click" when the latch disengages) and then gently pull the adapter
straight towards you.
2. Saturate an adapter cleaner with isopropyl alcohol and then use it to clean the
end surface and sides of the ferrule.
3. Press the tip of a new (dry) adapter cleaner into the ferrule end surface and
then wipe in one direction 2 or 3 times to dry the surface.
4. Clean the connector adapter before reattaching it. See the following
procedure "To clean an Optical Adapter:" for details.
5. Attach the adapter in the reverse order described in step 1. Be careful not to
scratch the ferrule end surface.
Cleaning the Optical AdapterCleaning the Optical Adapter
Use an approved adapter cleaner to clean the optical fiber cable opticaladapter.
Human-Machine-InterfaceHuman-Machine-Interface
4646

1. Remove the Optical adapter.
2. Saturate an adapter cleaner with isopropyl alcohol and then insert it into the
split sleeve of the adapter. Rotate the adapter cleaner in one direction while
moving it back and forth.
Check the ferrule diameter and use a cleaner only for the φ1.25 mm or φ2.5 mmadapter.
Cleaning the Optical Fiber Cable Ferrule End SurfaceCleaning the Optical Fiber Cable Ferrule End Surface
It is advised that you clean the ferrule end surface of the fiber to be tested withan approved ferrule cleaner prior to making any connections.
1. Pull the ferrule cleaner lever to expose the cleaning surface.
2. Hold the lever in the opened position, press the optical connector ferrule end
into the cleaning surface, and then rub in one direction as shown in the
following figure.
General Notes on CleaningGeneral Notes on Cleaning
Do not clean with a used ferrule cleaner.
Do not finish cleaning with a swab as the swab fibers may adhere.
Cap the cleaned connector.
Connector PanelConnector Panel
4747

33..55 Command-Based Remote ControlCommand-Based Remote Control
For OTDR modules, the remote control is available in software version 6.00 orlater.
The Network Master remote control communication functions support the
built-in Ethernet service interface.
Software specifications are in conformity with the IEEE488.2 standard and
SCPI version 1999 (Standard Commands for Programmable Instruments).
All commands are described in a separate document:
MT1000A Network Master Pro OTDR Modules Remote Scripting Operation
Manual (M-W3859AE).
This icon on Status bar indicates whether the Network Master is controlled by
the command-based scripts or not. If touching this icon, buttons appear.
Touching the Turn OffTurn Off button will disconnect the SCPI connection. Use this
button if disconnecting the Ethernet cable.
Touching the Enable Local ControlEnable Local Control button will allow the panel operation with
keeping SCPI connection. This function is useful for debugging the control
software.
33..66 File Access via USB InterfaceFile Access via USB Interface
You can access the mass storage of the Network Master by connecting the USBcable.
This function is useful to copy the files to PC, or confirm the test results.
1. Close all applications by touching CloseClose icon on the Application Tool Bar.
2. Connect the USB cable between PC and USB type B connector of the Service
Interface.
3. If PC has detected the Network Master, copy files or folders to PC using PC
software (Explorer of Windows etc.).
If applications are running on the Network Master, you cannot access the mass storage.
Human-Machine-InterfaceHuman-Machine-Interface
4848

33..77 File Access via Ethernet InterfaceFile Access via Ethernet Interface
33..77..11 Accessing files in Network Master from the PCAccessing files in Network Master from the PC
The mass storage of the Network Master can be shared with your PC viaEthernet interface.
1. Connect an Ethernet network cable to the LAN connector on your Network
Master and link this to a Local Area Network.
2. Assign an IP address to the Network Master. This is done in the Ethernetavailable in the Network screen as described in the Graphical User Interfacechapter.
3. Select Share File SystemShare File System in the File Sharing settings.
4. Start Explorer on your PC.
5. Enter the IP address of Network Master into the address bar.
For example, enter like \\192.168.10.4\. The shared folder appears.
If applications are running on the Network Master, you cannot access the mass storage.
The folders and files in the mass storage are set to read-only.
33..77..22 Mounting the Shared Folder of Networked PC to the Network MasterMounting the Shared Folder of Networked PC to the Network Master
Network Master can mount the shared folder of the networked PC.
1. Create the folder in the PC.
2. Right-click on the folder and click Property.
3. Click Sharing tab, and click ShareShare button to set shared.
File Access via Ethernet InterfaceFile Access via Ethernet Interface
4949

4. Connect an Ethernet network cable to the LAN connector on your Network
Master and link this to a Local Area Network.
5. Assign an IP address to the Network Master. This is done in the Ethernetavailable in the Network screen as described in the Graphical User Interfacechapter.
6. Select Mount Remote FolderMount Remote Folder in the File Sharing settings.
7. Enter the IP address of networked PC, User name, Folder name etc.
Note that enter User name of User Account of the PC.
8. Touch ApplyApply. If the remote folder has mounted, "CONNECTED" will be shown.
Then close dialog box.
9. Touch File Manager icon in Instruments Toolbar. The PC shared folder will be
mounted to the instrument Internal\remote folder.
Human-Machine-InterfaceHuman-Machine-Interface
5050

33..88 GPS ReceiverGPS Receiver
33..88..11 G0325A GPS ReceiverG0325A GPS Receiver
G0325A GPS Receiver contains GPS antenna and GPS receiver and is used byconnecting to AUX connector of MT1000A. The synchronization accuracyagainst UTC is ±1 μs or less.
OTDR modules do not have applications which use a GPS Receiver.
Connect The 15 pin D-sub connector to the AUX connector on the connectorpanel.
Activating the GPS receiverActivating the GPS receiver
The GPS receiver is activated automatically if it has connected to NetworkMaster.
33..88..22 Operating GPS ReceiverOperating GPS Receiver
GPS IconGPS Icon
An icon in the status bar will indicate the current GPS status. One of thefollowing icons will be shown:
The GPS is receiving signal from a sufficient number of
satellites.
GPS receiver is not connected.
Touching the icon will display an information pop-up dialog box.
The pop-up dialog box shows the current GPS status, and, for purelyinformational purposes, the number of satellites used for position fix, and thecurrent geolocation of the GPS receiver, in degrees and decimal minutesformat.
When MU100090A is attached, buttons appear in the pop-up dialog box. ForMU100090A, refer to W3682AE MT1000A/MU100010A Network Master ProOperation Manual.
GPS ReceiverGPS Receiver
5151

Human-Machine-InterfaceHuman-Machine-Interface
5252

44 Graphical User InterfaceGraphical User InterfaceThis chapter provides a general introduction to the graphical user interface(GUI). The descriptions of the screens, sub-screens and major dialog boxesrelated to specific technologies and applications are placed in separatechapters.
5353

44..11 General Handling of the GUIGeneral Handling of the GUI
The Network Master is equipped with a touch screen display, except for the keyto switch the instrument on/off. The operating principle of the graphical userinterface (GUI) presented on the touch screen display is that it guides youthrough all setup steps required for running a specific test and then finallypresents you with the test results. You can also navigate back and forthbetween setup steps and result presentation to re-run a test with new parametersettings if required.
44..11..11 GUI ConceptGUI Concept
The GUI can be split up into two functional spaces or levels: the desktop andthe workspace.
The desktop is the entry level which appears after the booting. It consists of
the application selector, which allows you to start a new application, and the
result file browser, which allows you to access previously created and stored
test results.
The workspace is where you work with a specific application (i.e. set up and
run a test and inspect the test results). Your selection on the desktop creates
the workspace and loads relevant data into it.
Application selectorApplication selector
The application selector loads a new application into the workspace. A newapplication can be either one of the standard applications provided with theinstrument or a previously saved application with partial or full configurationof interface/test setup parameters.
Result file browserResult file browser
The result file browser loads the results and configuration of a previous testinto the workspace. This allows you to generate reports from the results and/orto rerun the test (either using the original configuration or with variousconfiguration modifications).
A specific set of resources (i.e. ports) are assigned to a workspace when it is created.More than one workspace can therefore exist at the same time, each assigned todifferent resources.
Graphical User InterfaceGraphical User Interface
5454

44..11..22 Navigating in the GUINavigating in the GUI
As shown in the previous figure, you can navigate from the application selectorto a specific application in the workspace vertically. You can navigate betweenthe application selector and the result file browser in the desktop horizontally.In this way, you can switch screens in both horizontal and vertical navigation.
Horizontal navigation at desktop levelHorizontal navigation at desktop level
You can switch between the application selector and the result file browser bytouching the tab displayed in the bottom right-hand corner and the bottom left-hand corner.
Horizontal navigation within a workspaceHorizontal navigation within a workspace
In the workspace you can step through the setup by touching the navigationtabs displayed in the bottom corners of the screen. The right-hand tab bringsyou to the next step in the setup, while the left-hand tab allows you to take astep backwards.
Alternatively, you can use the screen indicator at the bottom of the screen toswitch between measurement setup, test setup and test result.
It is also possible to loop back directly to the setup from the test result screen ifyou need to rerun the test with different settings.
To get from the Test Setup to the Test Result screen during a new test, you must run the
test. This is done by touching the or in the Application toolbar, which is theexpandable toolbar shown on the right-hand side of the screen. Please refer to theseparate Toolbars section for information about the toolbars.
Vertical navigation between Vertical navigation between desktop and workspacedesktop and workspace
When an application is currently running, the application selector screen willcontain a tab at the bottom which allows you to go directly to the screen lastdisplayed in the application's workspace. Similarly, the result file browserscreen will contain a tab at the bottom which brings you to the test resultscreen of the running application.
General Handling of the GUIGeneral Handling of the GUI
5555

Startup Splash ScreenStartup Splash Screen
Status iconsStatus icons
From a setup screen you can return to the application selector using the tab atthe top of the screen. Test result screens contain a tab at the top which returnsyou to the result file browser.
44..11..33 Layout of the GUI ScreensLayout of the GUI Screens
The Network Master starts up with a splash screen that shows the GUI conceptof desktop/workspace and the various screen types. It indicates bothapplication selector and result file browser as entry points.
There are status icons of the battery and the network connections at bottom ofthe screen. This blue area at bottom of screen is the "status bar".
When the network connection is unusable, the red cross ( ) appears on theicon.
Graphical User InterfaceGraphical User Interface
5656

Application SelectorApplication Selector
Battery status
Refer to "Battery Status Information".
Link status of Ethernet service interface
WLAN (when the option is installed.)
Bluetooth (when the option is installed.)
VNC (Virtual Network Computing)
Controlled by the remote command
Connection status of GPS receiver
External PC status
Speaker On/Off status
Warning light blinking when the optical output switch is turned on.
44..11..33..11 Starting the ApplicationStarting the Application
The Application SelectorApplication Selector screen is the main entry point after startup of theNetwork Master. From here you can choose which application/test to run:either one of the standard applications or a previously saved pre-configuredapplication.
ApplicationsApplications
Aside from the application buttons, the application selector screen alsocontains a tab for showing/hiding the Instrument toolbar and a navigation tabto the Result File Browser screen.
FavoritesFavorites
A Favorite application is basically an application with an associated set of portresources and specific settings. When launching a Favorite application, theassociated port resources are automatically allocated and the associatedsettings are subsequently loaded.
General Handling of the GUIGeneral Handling of the GUI
5757

Favorites require a specific number of resources to run corresponding to thenumber of resources used when the Favorite was first created. If the resourcesof the Favorite are not available, user is prompted to select alternative port(s).
Touching FavoritesFavorites button displays the screen below.
Creating favoritesCreating favorites
1. Go to the workspace of the application you want to save as favorite.
Touch the ApplicationsApplications button.
Touch Standard OTDR icon, FTTA icon, or Construction icon. OLTS
application cannot be registered to Favorites.
2. Touch the Application toolbar tab.
3. Touch the SaveSave icon.
4. Touch the File nameFile name field.
5. Enter the file name using the dialog box.
6. Select Add to FavoritesAdd to Favorites in the Save dialog box.
7. Touch the Save settingsSave settings button.
On the Favorites screen a new favorite is now created containing the currentapplication resources and settings.
Deleting favoritesDeleting favorites
1. Touch and hold an icon in Favorites screen until a pop-up menu appears.
2. Touch Delete FavoriteDelete Favorite.
3. Touch DeleteDelete if the confirmation dialog box appears.
Renaming favoritesRenaming favorites
1. Touch and hold an icon in Favorites screen until a pop-up menu appears.
2. Touch Rename FavoriteRename Favorite.
3. Input a new name on the opening dialog box.
Graphical User InterfaceGraphical User Interface
5858

Result File BrowserResult File Browser
Importing favoritesImporting favorites
Settings files (.cfg) can be registered to Favorites by using the File Manager.
1. Open File Manager from the Instrument Tool bar.
2. Select to the .cfg file to import as favorite.
3. Touch the "Add to Favorites" button ( ).
Favorites cannot have the same name. If conflicts occur, rename the .cfg file or theexisting favorite before copying.
UtilitiesUtilities
Applications to view test results or a fiber edge surface are provided in Utilitiesapplication.
Touching UtilitiesUtilities button displays the screen below.
ScenarioScenario
Scenario Mgr.Scenario Mgr.: - manages the scenario file which runs applications
automatically. Parameters in the file can be edited.
If the scenario files are loaded, the icons will appear in Scenario row.
UtilityUtility
GPSGPS: - logs data from GPS receiver and shows the position of the satellites.
PDF ViewerPDF Viewer: - to view PDF files created by Report.
VIPVIP: - to view a fiber edge surface with the Video Inspection Probe.
WiresharkWireshark: - to view capture files (pcap) saved by Frame CaptureFrame Capture from
Ethernet applications.
The Result File BrowserResult File Browser screen is the other entry point after startup of theNetwork Master. From here you can access the results of previous tests to viewthe statistics directly, to generate PDF reports or to do both. Refer to "AccessingPrevious Tests and Test Results".
General Handling of the GUIGeneral Handling of the GUI
5959

Applications SwitcherApplications Switcher
Browses the folder.
Sets the filter of files.
Loads the result and starts the application with view mode.
Loads the result.
Creating the report from the result.
Selects single file.
Selects multiple files.
Deletes the selected file(s).
In addition to the buttons for accessing and handling test results, the result filebrowser also contains a tab for showing/hiding the Instrument toolbar and anavigation tab to the Application Selector screen.
44..11..33..22 Switching the ApplicationsSwitching the Applications
If running other applications in View mode, you can switch the applicationdisplay by Application Switcher. There are three ways to display ApplicationSwitcher:
In the desktop level, if two or more applications are running, touch and hold
the workspace navigation button in the bottom center of the screen.
In the workspace, touch the application in the left side of status bar.
From the Power Button menu.
Graphical User InterfaceGraphical User Interface
6060
Setup screenSetup screen
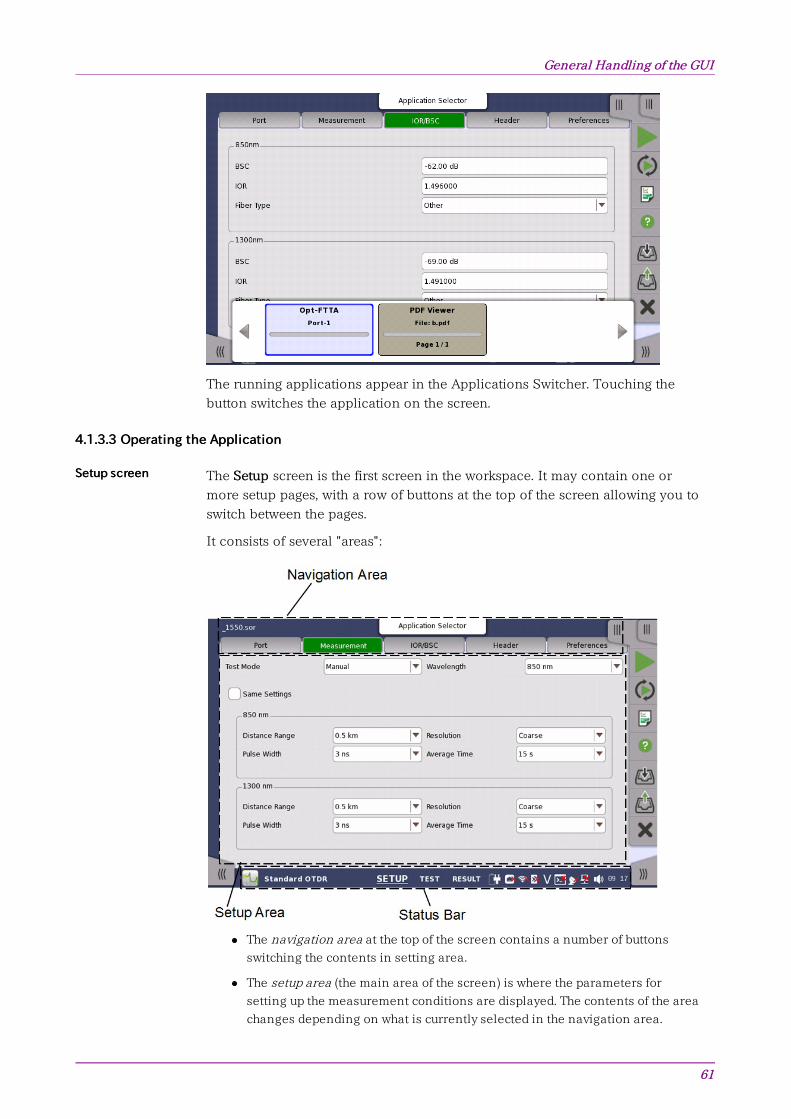
The running applications appear in the Applications Switcher. Touching thebutton switches the application on the screen.
44..11..33..33 Operating the ApplicationOperating the Application
The SetupSetup screen is the first screen in the workspace. It may contain one ormore setup pages, with a row of buttons at the top of the screen allowing you toswitch between the pages.
It consists of several "areas":
The navigation area at the top of the screen contains a number of buttons
switching the contents in setting area.
The setup area (the main area of the screen) is where the parameters for
setting up the measurement conditions are displayed. The contents of the area
changes depending on what is currently selected in the navigation area.
General Handling of the GUIGeneral Handling of the GUI
6161

Test screenTest screen
Test Results screenTest Results screen
The SetupSetup screen also contains the Application toolbar and the navigation tabsfor horizontal and vertical navigation.
The Test SetupTest Setup screen is the second screen in the workspace. It may containone or more setup pages, with a row of navigation buttons at the top of thescreen allowing you to switch between the pages (when relevant).
In addition to the various parameters, the TestTest screen also contains theApplication toolbar and the navigation tabs for horizontal and verticalnavigation.
The Test ResultsTest Results screen is the last screen in the workspace. It generallycontains several pages, reflecting the test results. Navigation buttons at the topof the screen will allow you to switch between the pages (when relevant).
In addition to the results, whose presentation varies from application toapplication, the Test resultsTest results screen also contains soft keys in right-hand. To
save results to a file, touch on the Application toolbar.
Graphical User InterfaceGraphical User Interface
6262

44..11..44 Keypads for Entering Text in FieldsKeypads for Entering Text in Fields
Alphanumerical or purely numerical keypads are used to enter text in fields. Bytouching the field you launch the related keypad. The layout (i.e. type) of aspecific keypad will depend on which type of text is required/valid for the field.
In general, a keypad consists of the character/number keys, a display fieldshowing the current text/number entry, various editing-related keys. Fornumber entries, the minimum and maximum values allowed are also shown.When you launch a keypad from a field, the current field value is shown in thekeypad's display field.
Touch OkOk to accept the new entry and close the keypad.
To close the keypad without accepting the change, touch CancelCancel or touch the"X" symbol in the upper right-hand corner of the keypad.
General Handling of the GUIGeneral Handling of the GUI
6363

44..22 ToolbarsToolbars
Two toolbars are available on the right-hand side of the screen: the desktoptoolbar (called the Instrument toolbar) and the expandable workspace toolbar(called the Application toolbar).
The Instrument toolbar contains general system functions and information
(e.g. Instrument configuration, Battery time etc.). It is available directly on the
screens related to the desktop, but can also be accessed on the workspace-
related screens as a "sub-toolbar" inside the application toolbar.
The Application toolbar contains application-related functions and
information (e.g. Start/Stop test, File operation etc.). It is available on the
screens related to a specific application (i.e. all workspace-related screens),
with the Instrument toolbar as a sub-toolbar.
44..22..11 Instrument ToolbarInstrument Toolbar
The Instrument toolbar is shown in the figure below. When the toolbar ishidden, it is represented by its icon tab in the top right-hand corner of thescreen.
The Instrument toolbar contains the following functions/status:
Instrument information
Configuration(General, Network)
File Manager
Help
Resource monitoring
Instrument informationInstrument information
The Information icon launches the System InformationSystem Information screen. Touch the UpdateUpdate
About InfoAbout Info button to generate the instrument information.
Graphical User InterfaceGraphical User Interface
6464

The following information is presented on the screen:
System Information
Controller Information
Module(s) Information
Software Information
Battery Information
Self Test Results
To save the instrument information in an HTML file, touch the Save To FileSave To Filebutton. This launches another dialog box, where you can specify file name andlocation. For the icons, refer to "File Manager".
When there are "NG"s in the self test results, try to reboot Network Master. If "NG"sremain in the self test results, contact an Anritsu Service and Sales office.
ConfigurationConfiguration
The Configuration icon launches the Global Configuration screen. From this screen,
it is possible to configure both the general instrument settings (such as date/time,
password etc.) and various network settings.
ToolbarsToolbars
6565

GeneralGeneral The GeneralGeneral screen contains the following configuration options:
LCD BrightnessLCD Brightness
Allows you to change the screen brightness by using the slide bar.
PowerPower
Allows you to specify auto backlight duration and auto power-off time.
These settings are applied for the battery operation only. When Wireshark application is running, Auto Backlight OffAuto Backlight Off does not work.
Touch Screen CalibrationTouch Screen Calibration
Allows you to calibrate the touch screen. Touch OKOK in the dialog box to startthe calibration.
Save the measurement results or settings before the touch screen calibration. NetworkMaster reboots after the touch screen calibration. The measurement data which is notsaved will be lost.When operating with the battery, Network Master does not reboot.
LanguageLanguage
Allows you to select language for the screens, and the keypad layout.
SoundSound
Allows you to specify speaker and headphones on/off. Change the volume byusing the slide bar.
Graphical User InterfaceGraphical User Interface
6666

This icon indicates that the speaker is On.
This icon indicates that the speaker is Off.
Auto SaveAuto Save
Allows you to specify saving method of the measurement results.
PromptPrompt: Confirms saving results or not after a test.
OnOn: Saves results to the file automatically without notification every time a test
ends.
NoneNone: Does not save results. The results data are discarded if you do not save
the data manually.
System PasswordSystem Password
Allows you to enable/disable password protection and to specify a newpassword. When the password protection is enabled, starting applications andediting applications are protected.
To change/set the password, select the one or more check boxes and thentouch the OKOK button. A numeric keypad is displayed.
To see the numbers as you type them on the keypad, select the DisplayDisplayPasswordPassword check box.
The password is set to 0614 as factory default.
ToolbarsToolbars
6767

Date/TimeDate/Time
Allows you to change the system date and time. Select a part in New TimeNew Time orNew DateNew Date field and touch the up/down button.
If touching OKOK, the dialog box confirming the reboot appears. Touch YesYes.
At the battery operation, Network Master does not reboot. Date and Time will bechanged when Network Master has booted by pressing the power button.
MiscellaneousMiscellaneous
Logging LevelLogging Level allows you to specify the logging level. Select OffOff always. Otheroptions are used for the service use.
Show ConfirmationsShow Confirmations allows you to specify whether showing the prompts toconfirm dependencies. This setting is applied for MU100010A 10G MultirateModule.
Show Test SummaryShow Test Summary allows you to specify whether to show the summarizedTest Status in the Status Bar. This setting is applied for MU100010A 10GMultirate Module.
CSV DelimiterCSV Delimiter allows you to specify the delimiter character to be used whengenerating output of Comma Separated Values.
Performance Verification PeriodPerformance Verification Period is used to calculate the performance validationdue dates. Due dates are note calculated if the period is set to zero.
Enable Auto Power UpEnable Auto Power Up controls whether the Network Master startsautomatically when the external power is applied.
Restore Applications DefaultsRestore Applications Defaults
Touching Restore Applications DefaultsRestore Applications Defaults restores each application settings todefaults.
Graphical User InterfaceGraphical User Interface
6868

NetworkNetwork
Execute Self TestExecute Self Test
Touching Execute Self TestExecute Self Test starts the self test.
Save the measurement results or settings of the running applications before executingthe self test. Otherwise, the unsaved measurement data will be lost when NetworkMaster reboots.When operating with the battery, Network Master does not reboot.
Erase Writable PartitionsErase Writable Partitions
Touching Erase Writable PartitionsErase Writable Partitions erase writable partitions.
The NetworkNetwork screen contains the following configuration options for the instrument's
network connection:
EthernetEthernet
Allows the instrument to be connected to the Ethernet either via dynamicaddressing (DHCP) or via manual specification of IP address, subnet mask anddefault gateway. These settings are applied for the Ethernet service interface.
This icon on Status bar indicates the link status of the Ethernet service interface.
WLANWLAN
Allows the instrument to connect to a network via Wireless Local Area Network(WLAN). Note that if WLAN is enabled, the instrument cannot connect to theEthernet via the Ethernet setting mentioned above.
ToolbarsToolbars
6969

This feature requires an option (MT1000A-003).
1. Touch the WLANWLAN button. WLAN Setup dialog box appears.
2. Touch the ScanScan button. Scan results are displayed.
3. Select the network from scan results and touch the ViewView button.
4. Touch the Add NetworkAdd Network button. Specify relevant items of network, touch the
AddAdd button.
5. Confirm that Status in WLAN Setup dialog box changes to ConnectedConnected.
When the option is installed, this icon on Status bar indicates the connection
status of the WLAN.
To edit the settings of the current network, touch the Edit NetworkEdit Network button.
The Event HistoryEvent History button is available to diagnose the WLAN connection.
BluetoothBluetooth
Allows the instrument to use a Bluetooth connection.
This feature requires an option (MT1000A-003).
Graphical User InterfaceGraphical User Interface
7070

Enable BluetoothEnable Bluetooth: Enables using the Bluetooth.
Make visibleMake visible: Allows to discover Network Master from other Bluetooth devices.
Share files using FTPShare files using FTP: Allows to share files stored in Network Master via
Bluetooth. Login account and password are not required for the FTP
connection. Shared folder in Network Master is "/property/mnt/internal".
When the option is installed, this icon on Status bar indicates whether the
Bluetooth is enabled or disabled.
Remote ControlRemote Control
Allows you to specify a TCP port for the command-based remote control of theinstrument.
SCPI control TCP portSCPI control TCP port: Touch the field to set port number.
GPIB AddressGPIB Address: Touch the field to set General Purpose Interface Bus (GPIB)
address.
Enable Remote ResetEnable Remote Reset: Selecting the check box allows users to reset the
Network Master from remote PC.
Allow remote PC connectionsAllow remote PC connections: If selecting check box, remote PC control via
Ethernet is available.
In-band control TCP portIn-band control TCP port: Touch the field to set port number used for remote
control via a test interface of MU100010A. Be sure to set different number
from SCPI control TCP portSCPI control TCP port.
NicknameNickname: Network Master name which will be recognized in Discovery
application of MU100010A.
AdvancedAdvanced tab settings are not used in OTDR module applications.
This icon on Status bar indicates whether the remote PC control is connected or
not.
VNCVNC
Allows remote control of the instrument via Virtual Network Computing (VNC).
ToolbarsToolbars
7171

This icon on Status bar indicates whether the VNC is enabled or disabled.
Touching this icon enables or disables the VNC alternately.
File SharingFile Sharing
Select Share File SystemShare File System to allows to share the data folder on networked PC. Selecting Mount Remote FolderMount Remote Folder enables the parameter fields for mounting thefolder of networked PC.
IP AddressIP Address: The IP address of the networked PC
DomainDomain: The domain name of the networked PC
UserUser: The username (account) of the networked PC
PasswordPassword: The password for account
Folder NameFolder Name: The name of the shared folder on the networked PC
After entering parameters, touch ApplyApply. If mounting remote folder succeeded,"CONNECTED" will be shown in Mount StatusMount Status field.
Only enter the name of the shared folder, not the entire path shown in Windows displays.
Procedure of creating the shared folder on the networked PC:
1. Create the folder in the PC.
2. Right-click on the folder and click Property.
3. Click Sharing tab, and click ShareShare button to set shared.
The PC shared folder will be mounted to the instrument Internal\remote folder.
Graphical User InterfaceGraphical User Interface
7272

File ManagerFile Manager
The File Manager icon launches the file manager screen. From this screen it is
possible to configure the instrument's internal file storage facility as well as to
perform all kinds of file transactions, both internally and from/to any external file
storage source (USB memory stick etc.).
Appears on the remote control application screen only.
Displays the local folder of the control PC.
Appears on the remote control application screen only.
Displays the folder of the Network Master.
Sets the current folder to the home folder.
Moves to the home folder.
Creates a new folder.
Edits the file name or the folder name.
Deletes the selected file(s) or folder(s).
Copies the selected file(s) or folder(s).
Pastes the file(s) or folder(s).
Selects a file or a folder.
Selects multiple files or folders.
Switches the GUI layout.
Adds the selected files (.cfg) to "Favorites".
Shows contents of a text file.
HelpHelp
ToolbarsToolbars
7373

The Help icon launches the help screen with context-related help. You can search for
specific words or phrases in the help and also step through previously displayed help
topics.
Moves to the Help list topic.
Back
Forward
Shows/hides the search box and buttons at bottom.
Searches backward.
Searches forward.
When Case SensitiveCase Sensitive is selected, searches distinguishing the upper case and thelower case.
Resource monitoringResource monitoring
The Resource monitoringResource monitoring icon launches a screen showing which applications are
currently activated and which ports on the connector panel are assigned to each of
the applications.
Graphical User InterfaceGraphical User Interface
7474

ToolbarsToolbars
7575

44..22..22 Application ToolbarApplication Toolbar
The Application toolbar consists of two columns plus the Instrument toolbar.You can expand/collapse the toolbar as shown in the figure below. The left-most column, which is always displayed, contains the commonly usedfunctions.
Left-most columnLeft-most column
The left-most column contains the following functions and status indicators:
Start AveragingStart Averaging
Touch the StartStart icon to start the averaging test. The icon changes to the StopStop icon
shown below, which can then be used to stop the test.
StopStop
Touch the StopStop icon to stop the currently running application/test. When the test has
stopped, the icon changes to the Start AveragingStart Averaging icon shown above.
Start RealtimeStart Realtime
Touch this icon to start the realtime test.
ReportReport
Touch this icon to create a report containing the current application results and
settings.
1. Touch the Select ReportSelect Report field to select the format of the report file.
Graphical User InterfaceGraphical User Interface
7676

2. Select the file format of Report file using check boxes of Select FormatSelect Format.
3. To print a logo in the report, select the Include LogoInclude Logo check box. Touching ......
button launches the dialog box selecting a file.
4. Touch NextNext button.
5. Select check boxes of items outputting to the report.
6. When selecting VIP1VIP1 or VIP2VIP2, touch BrowseBrowse button to set VPIP file name.
7. Touching GenerateGenerate button starts the report generation.
Adobe® Reader® is recommended as a PDF viewer to open or print out the report.
Creating reports from the Result File Browser will not take up port resources on thesystem. From the Result File Browser, select the result file for which you want to create areport and touch the Report icon ( ).
HelpHelp
Touch this icon to access the online help for the currently displayed screen or dialog
box. You can search for specific words or phrases in the help and also step through
previously displayed help topics.
ToolbarsToolbars
7777

Moves to the topic when touching the help icon.
Back
Forward
Shows/hides the search box and buttons at bottom.
Searches backward.
Searches forward.
If Case SensitiveCase Sensitive is selected, searches distinguishing the upper case and thelower case.
SaveSave
Touch this icon to open Save dialog box. You can save Setup file or Result file.
Touch File nameFile name field to enter the file name.
Touch Save SetupSave Setup to save the test setup parameters.
Touch Save ResultsSave Results to save test results and the test setup parameters.
There are following types for saved files:
Result files (*.sor) The file which has the test results of a single trace and
the test setup parameters.
However, parameters in following screens are not
saved.
PreferencesPreferences in the SetupSetup screen
Result files (*.zip) The file which has the test results of dual traces and the
test setup parameters. Two result files (*.sor) are zipped
into this file.
Setup files (*.cfg) The file which has all parameters of the SetupSetup screen
and the TestTest screen.
Analysis results files
(*.csv)The file which has Bi-directional analysis results.
Graphical User InterfaceGraphical User Interface
7878

LoadLoad
Touch this icon to open Load dialog box. You can load Setup file or Result file.
If touching a file on the list, the file name appears in the File nameFile name field.
Selecting Files of typeFiles of type filters files on the list.
Load SetupLoad Setup Loads a setup file (*.cfg).
Load Result PrimaryLoad Result Primary Loads a test result file (*.sop or *.zip).
If loading a result file (*.sop), the primary trace is
overwritten.
Load Result PrimaryLoad Result Primary
W/ SetupW/ Setup
Loads a test result file (*.sop or *.zip).
If loading a result file (*.sop), the primary trace is
overwritten and the application test setup will change
according to parameters in the loaded file.
However, the parameters in the following screen are
not overwritten.
PreferencesPreferences in the SetupSetup screen
Load Result OverlayLoad Result Overlay Loads a test result file (*.sop or *.zip).
If loading a result file (*.sop), the overlay trace will be
appended. Overlay trace can be appended up to 12.
Load Result OverlayLoad Result Overlay
W/ SetupW/ Setup
Loads a test result file (*.sop or *.zip).
If loading a result file (*.sop), the overlay trace will be
appended. And the application test setup will change
according to parameters in the loaded file.
However, the parameters in the following screen are
not overwritten.
PreferencesPreferences in the SetupSetup screen
When FTTA application is running, only Load Result PrimaryLoad Result Primary button appears.
When loading setup files, the output port setting (Single Mode or Multi Mode) enclosedin the file has to match that of the current application.
When loading compressed result file (*.zip), the current traces are cleared andoverwritten with loaded results.
Loading result files into a viewer will not take up port resources on the system. This ispractical if you only want to review previous results and don't need to run test again.From the Result File Browser, select the result file you want to view and touch the Viewicon ( ) at right hand top of the screen.
CloseClose
Touch this icon to close the application.
Expanded Application toolbarExpanded Application toolbar
The Application toolbar is expanded/collapsed by touching the tab placed
above the left-most column. The column displayed in the expanded toolbarcontains the power meter function. Select check box to display the measuredpower.
Touch the WavelengthWavelength field to select the wavelength of input light. When LightSource Mode is Wave CodeWave Code, the wavelength value is set automatically.
ToolbarsToolbars
7979

To calibrate zero level of the power meter, touch Set ZeroSet Zero. Disconnect the optical fiber from the connector and close protective cover,then touch OKOK.
Graphical User InterfaceGraphical User Interface
8080

44..33 Startup and Switch-off SequencesStartup and Switch-off Sequences
This section describes what takes place when you switch the Network Masteron and off as well as when you start up and close down an application.
44..33..11 Instrument StartupInstrument Startup
When you switch on the instrument, the first screen displayed is a splashscreen - introducing you to the GUI concept of the desktop/workspace and thevarious screen types (see the figure in the GUI Concept section). Then theApplication Selector screen is displayed.
44..33..22 Application StartupApplication Startup
When you touch an icon on the Application Selector screen to start anapplication, a workspace is created for that application and the relevant data isloaded into it. When the loading is complete, the Setup screen is displayed,with the interface type(s) relevant for the selected application.
You can also start an application by selecting the result file on the Report FileBrowser screen. Refer to the next section.
44..33..33 Accessing Previous Tests and Test ResultsAccessing Previous Tests and Test Results
When you select test result files on the Report File Browser screen, you canchoose to create either a report from the results or a workspace containing thetest setup data and its results.
Creating a workspace for a previous test allows you to view the test results inthe GUI. You are brought directly to the Test Results screen when you touchthe View/Load FileView/Load File button, but can navigate to the other screens in theworkspace from there.
When you touch the VIEW FILEVIEW FILE button, an application starts in Viewer mode. In this
mode, you cannot start measurement. This mode is used to view the test result.
If selecting *.sor or *.zip file, touch a button for specifying the application.
Startup and Switch-off SequencesStartup and Switch-off Sequences
8181

When you touch the LOAD FILELOAD FILE button, an application starts using the setting in the
file. If selecting *.sor or *.zip file, touch a button for specifying the application.
If other application is using ports, the following message appears. In this case, you
can start the application in Viewer mode.
When you touch the CREATE REPORTCREATE REPORT button, the Report Generator dialog box is
displayed, allowing you to name and save the report (in PDF format).
Select the report type by using Select ReportSelect Report. The report is created by using Pass/Fail
thresholds of the selected application.
44..33..44 Closing an ApplicationClosing an Application
When you touch the CloseClose icon in the application toolbar, you are prompted toconfirm that you really want to close the current application. If you touch"Yes", the workspace is closed and you are returned to the desktop (i.e. theApplication Selector screen). The resources previously allocated to theapplication are freed to be used by another application if required.
44..33..55 Switching Off the InstrumentSwitching Off the Instrument
When you press the Power button on the instrument, the power-off menu isdisplayed. The menu contains the menu item Shut DownShut Down, and when you selectthat, you are prompted to confirm that you really want to switch off theinstrument completely.
If you touch "Yes", the shutdown is announced, and then after a few momentsthe power is turned off.
If you have any applications still active when you switch off the instrument, theseapplications will be closed automatically without any configuration data and/or testresults being saved.
Graphical User InterfaceGraphical User Interface
8282
55 Optical Fiber TestingOptical Fiber TestingApplicationsApplications
This chapter describes the graphical user interface (i.e. screens, subscreens andmajor dialog boxes) related to Optical Fibre Testing applications. Subscreensand dialog boxes are described under the main screen from which they areactivated/launched.
The following applications are available:
Standard OTDR
FTTA
Construction
OLTS
8383

55..11 Standard OTDRStandard OTDR
Standard OTDR (Optical Time Domain Reflectrometer) application allows users to
locate fault of an optical fiber. The test result is displayed on Fiber Visualizer screen
or Trace screen.
55..11..11 Measurement Condition SetupMeasurement Condition Setup
The first step in running an application is to set up the measurementconditions. This is done on the SetupSetup screen, which also provides port statusinformation.
55..11..11..11 PortPort
Touching the PortPort button in the navigation area will launch the followingscreen.
Output PortOutput Port
Touch the field to select the port used for the test.
MU100020A, MU100022A: Fixed to Single ModeSingle Mode.
MU100021A: Single ModeSingle Mode, Multi ModeMulti Mode
The connector of the selected port will be marked on the image.
Selecting Single ModeSingle Mode allows users to test the optical fiber compliant ITU-TG.652 "Characteristics of a single-mode optical fibre and cable".
Selecting Multi ModeMulti Mode allows users to test the Grated Index (GI) fiber ofdiameter 50 μm or 62.5 μm.
Optical Fiber Testing ApplicationsOptical Fiber Testing Applications
8484

55..11..11..22 MeasurementMeasurement
Touching the MeasurementMeasurement button in the navigation area will launch thefollowing screen.
Test ModeTest Mode
Touch the field to select the test mode. If selecting AutoAuto, the parameters will be set automatically. Selecting ManualManual allows user to set parameters.
WavelengthWavelength
Touch the field to select the wavelength used for the test. Selecting ALLALL will test in all wavelength which the OTDR module supports.
Output PortOutput Port Available wavelengthAvailable wavelength
Single Mode 1310 nm, 1550 nm, 1625 nm, ALL
Multi Mode 850 nm, 1300 nm, ALL
Available wavelength depends on the model.
Same SettingsSame Settings
Select the check box if applying the same settings for all wavelengths.
Following items can be set to each wavelength.
Distance RangeDistance Range
Select the upper limit of distance to locate faults.
Pulse WidthPulse Width
Select the pulse width of optical signal. As the time unit, "us" is used in place of"μs".
ResolutionResolution
Select the resolution in horizontal.
Average TimeAverage Time
Standard OTDRStandard OTDR
8585

Select the averaging time of measured traces applied for Start AveragingStart Averaging.
55..11..11..33 IOR/BSCIOR/BSC
Touching the IOR/BSCIOR/BSC button in the navigation area will launch the followingscreen.
The following items can be set to each wavelength.
BSCBSC
Touch the field to enter BSC.
BSC (Backscatter Coefficient) is the optical power reflection ratio per meter.BSC is used for calculating the optical loss.
IORIOR
Touch the field to enter IOR.
IOR (Index of Refraction) is used for calculating the distance from time delayof reflected pulse.
Fiber TypeFiber Type
Select the fiber.
The values set in this screen are applied to the trace measured next time and later. Tochange IOR and BSC of the following trace, use IORIOR of the Trace screen.
Current traceLoaded trace from a file
55..11..11..44 HeaderHeader
Touching the HeaderHeader button in the navigation area will launch the followingscreen.
Optical Fiber Testing ApplicationsOptical Fiber Testing Applications
8686

In this screen, the contents of File header which will be stored in the result file(*.sor) can be set.
Next items are printed in Report.
Cable ID, Fiber ID, Location A, Location B, Operator
Data FlagData Flag
Selects the data flag of the measured traces
BC(built)BC(built): The trace which was measured when the cable was built.
RC(repair)RC(repair): The trace which was measured when the cable was repaired.
OT(other)OT(other): The trace which was measured in other case.
Cable IDCable ID
Sets the ID of the measured cable.
Fiber IDFiber ID
Sets the ID of the measured fiber.
Cable CodeCable Code
Sets the cable code of the measured cable.
Location ALocation A
Sets the location name at measurement start.
Location BLocation B
Sets the location name at measurement end.
DirectionDirection
Selects a direction to be measured. A -> B: Location A to Location B B -> A: Location B to Location A
OperatorOperator
Sets the the measured person's name.
CommentComment
Sets the comment concerned to the measured trace.
Standard OTDRStandard OTDR
8787

Sequence NumberSequence Number
Sets the starting number of the sequence number included in the header.
55..11..11..55 PreferencesPreferences
Touching the PreferencesPreferences button in the navigation area will display four tabs.
MeasurementMeasurement
Touching the MeasurementMeasurement tab displays the following screen.
Connection CheckConnection Check
The Connection Check function confirms whether or not the fiber is connectedcorrectly to the OTDR measurement port.
Active Fiber CheckActive Fiber Check
The Active Fiber Check performs a "live fiber" check on the currently attachedfiber under test to detect whether the fiber is carrying traffic before firing anyOTDR laser sources.
If no traffic is detected, the test proceeds normally.
If traffic is detected, a warning message appears on the screen and the test is
aborted.
The Active Fiber Check feature does not apply to the 850/1300 nm multimode fiber.
Auto Test ModeAuto Test Mode
Select the type of Auto Test.
AdvancedAdvanced: Tests using multiple pulse widths to detect the events precisely.
However, this test mode takes a long time to measure, because of repeating
tests by varying pulse width.
StandardStandard: Tests using a fixed pulse width.
Optical Fiber Testing ApplicationsOptical Fiber Testing Applications
8888

This setting appears when Multi ModeMulti Mode is selected on Port screen. Select thecore diameter of the multimode fiber under test. "um" is used in place of "μm".
RealtimeRealtime
Set how to process a Realtime Measurement ( ).
AveragesAverages
Select whether to perform averaging in Realtime Measurement.
LowLow: Does not perform averaging.
HighHigh: Performs averaging. Set this to suppress the OTDR noise when the
distance range to measure is long.
Measurement ModeMeasurement Mode
NormalNormal: Set this when measuring the back scatter light from the optical fiber.
High Reflection MeasurementHigh Reflection Measurement: Set this when measuring the trace that large
level differences are included such as Fresnel reflections. This mode takes
longer measurement time than the NormalNormal mode.
AnalysisAnalysis
Touching the AnalysisAnalysis tab displays the following screen.
Reflectance CalculationReflectance Calculation
Select the reflectance calculation method.
OffOff: Reflectance will not be calculated.
AutoAuto: The reflectance of any event is reported based on the position of cursor
A. The Auto setting is most useful for reflective events that are not close
together or close-in to the OTDR.
ManualManual: When set to Manual, the reported reflectance is based on the
positions of both cursors (A and B). The Manual setting is most useful for
reflective events that are close together or close-in to the OTDR.
For details, refer to Reflectance.
ORL CalculationORL Calculation
Select the starting point for ORL (Optical Return Loss) measurements.
Standard OTDRStandard OTDR
8989

Cursor ACursor A: The ORL measurement is calculated from the cursor A to the cursor
B, but the Incident Power is attained from the A cursor position.
OriginOrigin: The ORL measurement is calculated from the cursor A to the cursor B,
but the Incident Power is attained from the origin (e.g.: 0 km, or Bulkhead
connector).
Full TraceFull Trace: The ORL measurement is calculated from the Origin to the last
data point, and the Incident Power is attained from the origin (e.g.: 0 km, or
Bulkhead connector).
Event Table Span CalculationEvent Table Span Calculation
This item appears for OTDR application. Selects whether to display the spanlength or transmission loss (dB/km) on event table. This setting functionapplies only to Event Table in the Trace screen.
End Event For ORL CalculationEnd Event For ORL Calculation
Set whether to include reflection in Far-End events or not when calculating theORL. This setting function applies to the following.
Fiber Visualizer
ORL Calculation in Trace screen when Full TraceFull Trace is selected for ORL
Calculation
Bi-Directional CorrelationBi-Directional Correlation
Enter the value to define the range for detecting the same event on Overlaytrace in reversed direction which is displayed by Bi-Directional on the Tracescreen.
The range is defined as Far End event distance of Primary trace multiplied byBi-Direction Correlation/100.
Example:
Fiber End event distance of Primary trace: 50 km
Bi-Direction Correlation: 4%
Distance of the event on Primary trace: 12.5 km
The distance range detecting the event on Overlay trace: 11.5 to 13.5 km
DisplayDisplay
Touching the DisplayDisplay tab displays the following screen.
Optical Fiber Testing ApplicationsOptical Fiber Testing Applications
9090

Distance Display UnitsDistance Display Units
Select the unit of measurement used to display distance on the horizontal axisof the Trace graph. This affects Range and Resolution readings and analysisevents incorporating distance.
Trace OverviewTrace Overview
When the check box is selected, a small overview of the trace is displayed inthe lower left portion of the Trace graph.
Auto ScaleAuto Scale
When the check box is selected, Horizontal scale which is automatically set Sothat Far End event is displayed in the Trace screen.
Auto ZoomAuto Zoom
Selecting the check box will automatically zoom in on the event selected in theResult screen.
Display Mode After AnalysisDisplay Mode After Analysis
The Display Mode After Analysis setting is used to set the post-analysis displaymode.
End/BreakEnd/Break: Displays the range up to the Far end event or the broken point.
Full TraceFull Trace: Displays full range of distance.
CurrentCurrent: Displays the trace with the current scale settings.
Show Internal Launch FiberShow Internal Launch Fiber
Selecting the check box will display the internal launch fiber of Network Masteronto the Trace screen.
Show LatencyShow Latency
Selecting the check box will display the latency to the fiber end in the FiberVisualizer screen. Latency is the time which optical pulse takes to reach the farend from origin.
File & OthersFile & Others
Touching the File & OthersFile & Others tab will launch the following screen.
Standard OTDRStandard OTDR
9191

Auto FilenameAuto Filename
Select the check box to automatically generate a filename when a save isperformed.
When Auto Save in General screen is set to OnOn or PromptPrompt, the check box is alwaysselected.
Start NumberStart Number
Touch this field to set the starting file number of Auto Filename.
Base FilenameBase Filename
The Base Filename field provides a template for use when generating an auto-filename. You can enter a base filename of up to 70 characters with a threecharacter file extension.
Calibration PeriodCalibration Period
Touch the field to set the calibration period in months.
Calibration expiration date is printed in the Report.
Enter the string or variables by the following way:
Optical Fiber Testing ApplicationsOptical Fiber Testing Applications
9292

Patch-cord SetupPatch-cord Setup
Touch the white field to append strings using Keypad dialog box.
Touch the button in User DefinedUser Defined which string is displayed.
To enter variables such as time, touch a MacroMacro button.
The entered string or variable appears as a button. When removing or editingthe button, touch the button.
User DefinedUser Defined
Touching the blank button will launch the Keypad dialog box to edit the string. Touching the labeled button will insert that to a filename.
To edit the string on the button, keep touching the button. Keypad dialog boxwill launch.
MacroMacro
Touching the button will insert the following variables in the filename.
*Number*
Auto numbering. Start Number can be set in the Preference 1/2.
*Wavelength*
The wavelength in nanometer unit used for the test.
*yy-mm-dd*
The tested date shown as year-month-day. Example: 2015-12-31
*hh-mm-ss*
The tested time shown as hour-minute-second. Example: 23-59-00
*Location*
Location A and Location B set to the Header. Example: osaka_tokyo
55..11..22 Test SetupTest Setup
55..11..22..11 FiberFiber
Touching the FiberFiber button in the navigation area will launch the followingscreen.
Patch-cord is the optical fiber connecting to the fiber under test.
Standard OTDRStandard OTDR
9393

Splitter SetupSplitter Setup
Launch FiberLaunch Fiber
Launch Fiber is Network Master side patch cord. Select the connection pointbetween Launch Fiber and the fiber under test.
NoneNone: Does not set the Launch Fiber point.
Event1Event1 to Event3Event3: Sets the distance of a specified event as the patch-cord
length.
DistanceDistance: Specify distance in Launch LengthLaunch Length field as the patch-cord length.
Launch LengthLaunch Length
Set the length of the patch-cord connected to the fiber under test at LaunchFiber when Launch FiberLaunch Fiber is set to DistanceDistance.
Receive FiberReceive Fiber
Receive Fiber is the Far End side patch cord. Select the connection pointbetween Receive Fiber and the fiber under test.
NoneNone: Does not set the Receive Fiber point.
Event1Event1 to Event3Event3: Sets the distance of a specified event to the starting point of
the Receive Fiber.
DistanceDistance: Sets the number in Receive LengthReceive Length field to the patch-cord length.
Receive LengthReceive Length
Set the patch-cord length from Far End when Receive FiberReceive Fiber is set to DistanceDistance.
These settings appear when Output Port is set to Single ModeSingle Mode at StandardOTDR application.
If the splitter information on the fiber is known, set the number of splitters andthe number of splits.
Number of SplittersNumber of Splitters
NoneNone: Does not set Splitters on the fiber.
11 to 33: Sets splitters of the specified number.
DetectDetect: Detects the number of splitters automatically.
Select the number of splits by touching the field under the splitter icon.Selecting 1×??1×?? detects the splits automatically.
55..11..22..22 Auto DetectAuto Detect
Optical Fiber Testing ApplicationsOptical Fiber Testing Applications
9494

SplitterSplitter
Touching the Auto DetectAuto Detect button in the navigation area will launch thefollowing screen.
Set thresholds to detect events automatically in Auto Detect screen. Events thatexceed the Auto Detect parameter settings are reported in the Event Analysistable.
Event LossEvent Loss
Determines the minimum loss.
ReflectanceReflectance
Determines the lowest reflectance value that will be reported by analysis. Anyevent with a reflectance is equal to or greater than the value in this parameterwill be reported in Event analysis.
Fiber EndFiber End
Determines the minimum loss for the Fiber End.
Macro BendMacro Bend
This settings appear when Output Port is set to Single ModeSingle Mode at Standard OTDRapplication.
Select check box when analyzing Macro Bend (slight bending of the fiber).
Determines the threshold for detection as Macro Bend.
These settings appear when Output Port is set to Single ModeSingle Mode at StandardOTDR application.
Determines the minimum loss for detection as Splitter event in the Eventsanalysis.
55..11..22..33 Pass/FailPass/Fail
Touching the Pass/FailPass/Fail button in the navigation area will launch the followingscreen.
Standard OTDRStandard OTDR
9595

This screen allows users to set thresholds to Pass/Fail tests.
Non-Reflective Event Loss (fusion)Non-Reflective Event Loss (fusion)
This parameter highlights non-reflective event losses, such as fusion splices, inthe Events Analysis table.
Reflective Event Loss (connector, mechanical)Reflective Event Loss (connector, mechanical)
This parameter highlights reflective event losses, such as connectors andmechanical splices, in the Events Analysis table.
ReflectanceReflectance
This parameter highlights events in the Event Analysis table that exceed the setReflectance value.
Fiber Loss (dB/km)Fiber Loss (dB/km)
This parameter highlights events in red in the Event Analysis table when thedB/km loss exceeds the value set.
Total LossTotal Loss
When the Total loss (Cum.Loss (dB)) exceeds the value set:
Total loss (Cum.Loss (dB) in Fiber End row) is highlighted in red.
Total Loss value in the Fiber Visualizer screen will be displayed in red.
ORLORL
ORL value in the Fiber Visualizer screen will be displayed in red when the ORL(Optical Return Loss) is lower than the value set.
Splitter LossSplitter Loss
This setting appears when Output Port is set to Single ModeSingle Mode at Standard OTDRapplication.
This Parameter highlights events in red in the Event Analysis table when thesplitter loss exceeds the Auto Detect threshold plus value set.
Splitter in the Auto Detect screen
Splitter Loss in this setting
Optical Fiber Testing ApplicationsOptical Fiber Testing Applications
9696

For example, if the 1×2 splitter is set to 4.1 dB in the Auto Detect screen andSplitter loss is set to 1.0 dB, the 1×2 splitter event loss for exceeding 5.1 dB isjudged as Fail.
55..11..33 Test ResultsTest Results
55..11..33..11 Connection CheckConnection Check
If selecting Connection CheckConnection Check on Measurement tab in Preferences screen,Connection Check Level will appear after starting a measurement.
Bar ColorBar Color Connection LossConnection Loss**
Green <1 dB
Yellow 1 to 2 dB
Red >2 dB
*: Values for reference purposes. The value may not be
measured correctly depending on reflection from the optical
connector or the fiber.
1.5 dB is added to each value when using a 50μm multi-
mode fiber.
Good connectionGood connection
The gauge is green when connection is good. The closer the bar in theconnection gauge extends to "HIGH" end, the better the connection is.
Bad connectionBad connection
The gauge is red when connection is bad. And it is yellow when connection isnot good. If the bar color is yellow, touch ContinueContinue soft key to perform the test.
If the gauge is yellow or red, the fiber needs cleaning.
If the connection state is not improved even if the fiber is cleaned, the fiberneeds to be replaced.
Fibers shorter than approximately 48 meters (160 ft.) will generally result in a lowconnection level.
Standard OTDRStandard OTDR
9797

55..11..33..22 Fiber VisualizerFiber Visualizer
Touching the Fiber VisualizerFiber Visualizer button in the navigation area will launch thefollowing screen.
In Fiber Visualizer screen, the detected events are shown by the icon. For eventdescription, refer to Event type. Icons on red are the Fail events by Pass/Failjudgement.
Fiber schematic
Shows event positions or event icon positions on display. The events that
exceed the PASS/FAIL thresholds are displayed in red.
Event icon display area
Fiber connection points, fusion points, and splitters are displayed in icons.
The events that exceed the PASS/FAIL thresholds are displayed in red.
Touching an event icon allow users to set a marker or edit the icon type.
Optical Fiber Testing ApplicationsOptical Fiber Testing Applications
9898

When Bi-Directional on Trace screen is set to ONON, this icon appears at
left of the screen.
Displayed under an event icon if Marker A is set to the event.
Displayed under an event icon if Marker B is set to the event.
A. Event distance
B. Event number
C. Distance from previous event
D. Event icon
E. Connection loss at event point
F. Fiber loss
G. Reflection at event point
"S" appears if the reflection level is saturated.
H. Trace image of the event
Meassage Area
One of following is displayed.
When touching "Fail" icon, why it was judged as "Fail" and a hint of the
solution are displayed.
When both Marker A and Marker B are set, the distance and the loss
between markers are displayed.
When Total Loss or ORL result is displayed in red, its information is
displayed.
Switching Message
When both Marker A and Marker B are set, touching an icon ( ) switches
information displayed at Meassage Area.
Total Results
Loss and ORL of the total fiber are displayed.
When measured by more than two wavelength, arrow appears at the side of the
wavelength value.
When Total Loss or ORL result is displayed in red, touching the value displays
information at Message Area.
Pass/Fail Results
If all the PASS/FAIL thresholds are cleared, "PASS" is displayed. Even if only
one event fails to clear the threshold, "FAIL" is displayed.
Event Icon ListEvent Icon List
For event description, refer to Event type. Icons on red are the Fail events byPass/Fail judgement.
Standard OTDRStandard OTDR
9999

Start of the fiber Splitter Event
Reflective Event End of the fiber
Non-Reflective Event Questionable Event
Grouped Event Patch cord (Launch)
Macro Bend Event Patch cord (Receive)
Event EditEvent Edit
Touch the Event icon on the Fiber Visualizer, and touching Event EditEvent Edit willlaunch the following screen. Available icons depend on the selected icon.
Touching the icon changes the Event icon. Touching CancelCancel button does not change the Event icon.
Start icon and End icon cannot be edited.
Soft keysSoft keys
Test ModeTest Mode
Touching this button switches the Test Mode between AutoAuto and ManualManual. Whensetting to ManualManual, the measurement parameters can be set.
WavelengthWavelength
Touching this button switches the wavelength applied for the test.
ParametersParameters
Touching this button launches the Test Parameter dialog box which allows toset Distance RangeDistance Range, Pulse WidthPulse Width, ResolutionResolution, and Average TimeAverage Time. This button isenabled when Test Mode is set to ManualManual.
OverlayOverlay
Swap OverlaySwap Overlay: Opens the dialog box selecting the trace to swap.
VFLVFL
Optical Fiber Testing ApplicationsOptical Fiber Testing Applications
100100

Allows users to switch visible light output. When selecting OnOn or BlinkBlink, the redicon will blink at the bottom left of the screen.
VFL appears if Option 002 is installed.
55..11..33..33 TraceTrace
Touching the TraceTrace button in the navigation area will launch the followingscreen.
In the Trace screen, the fiber loss versus distance is shown in graphical. Thefollowing icons appear on the traces.
Appears at an event position with Event type icon.
This icon appears on the left hand axis, at the level of the active
cursor.
Appears at the position of an LSA (Least Squares Approximation)
cursor.
Appears if Launch fiber in Fiber screen is set to other than NoneNone.
This position is the start point of the fiber under test.
Appears if Receive fiber in Fiber screen is set to other than NoneNone.
This position is the end point of the fiber under test.
Icons on the left hand control the screen display.
Standard OTDRStandard OTDR
101101

When this icon is green, dragging an area on the trace window
allows users to zoom the trace.
When this icon is green, touching a point on the trace window allows
users to zoom out the trace.
Touching this icon shows the trace in full range.
When this icon is green, touching the trace window allows users to
drag the trace.
Touching this icon displays the buttons moving a cursor and AA, BB,
UtilityUtility buttons under the trace window.
LSA1LSA1 to LSA4LSA4 buttons appear when selecting Splice LossSplice Loss, 2-pt LSA2-pt LSA,
or dB/km LSAdB/km LSA.
To select a cursor, touch a button of the cursor or touch Cursor A or
Cursor B on the screen.
To move a cursor:
Touch or .
Touch a point on the trace which is the destination of the
cursor.
Touching this icon displays the event table.
The following items appear under the trace window.
Cursor
A: Distance of Cursor A
B: Distance of Cursor B
A-B: Distance between Cursor A and Cursor B
Loss Mode
Selects a loss mode by touching the field.
When the loss mode is set to ORLORL, CalcCalc button appears.
For details of loss mode, refer to Loss Modes section.
Measurement Setup
WL: Wavelength, SM (Single mode fiber) or MM (Multi mode fiber)
DR: Distance range
PW: Pulse width
IOR: Index of reflection
RES: Resolution
AVG: Average times
UtilityUtility
Provides the cursor behavior setting and functions using a cursor.
Default LSADefault LSA: Moves LSA cursors to default positions. Enabled when LSA
cursors are displayed.
CursorsCursors:
Selecting LockedLocked will lock the distance between cursor A and cursor B.
Selecting UnlockedUnlocked allows setting distance of cursor A and cursor B
separately.
Adjust IOR by Cursor AAdjust IOR by Cursor A: Adjusts IOR by setting the actual distance of cursor A.
1. Move cursor A to the event which the distance is known.
2. Touch UtilityUtility.
3. Touch the Adjust IOR by Cursor AAdjust IOR by Cursor A field.
Optical Fiber Testing ApplicationsOptical Fiber Testing Applications
102102

Event TableEvent Table
4. Set the actual distance of cursor A by using a keypad.
5. Touch OKOK, then IOR will be adjusted so that actual distance of cursor A
is displayed.
When the touching the button in the Trace screen, Event Table appears inthe Trace screen.
Detected events on the trace are displayed in the table.
NoNo: The event number.
DistDist: Distance of the event.
TypeType: Event type shown by an icon.
Loss(dB)Loss(dB): Loss of the event.
Reflect(dB)Reflect(dB): Reflectance at the event.
dB/kmdB/km: Fiber loss from the previous event.
SpanSpan: Distance from the previous event. For the first event, the distance from
Launch fiber.
Cum.Loss(dB)Cum.Loss(dB): The cumulative loss which is the difference from the level at the
origin.
dB/kmdB/km or Span (km)Span (km) appears depending on Event Table Span CalculationEvent Table Span Calculationsetting in Analysis tab of Preferences screen.
Standard OTDRStandard OTDR
103103

Add EventAdd Event
Event TypesEvent Types
Reflective Event
Reflection from a splice point, such as a Fresnel reflection
caused by a mechanical splice or connector.
Non-Reflective Event
Non-reflective events include such low loss events as fusion
splices and Macro Bends.
Grouped Event
Events spaced too close to each other for Analysis to
distinguish them as separate events are reported as
Grouped events.
Far End Event
Any event with a loss equal to or greater than the Fiber End
threshold in Auto Detect screen is reported as the Far End
event.
Questionable Event
The last event is set to Questionable Event in the following
case:
When the fiber length is longer than Distance Range
When Far End event is not found
Splitter Event
All events other than far end events with losses greater than
the far end threshold are displayed as Splitter events.
Launch Event
Launch Event appears at Launch fiber position. Does not
appear if Launch Fiber is set to NoneNone on Fiber screen.
Receive Event
Receive Event appears at Launch fiber position. Does not
appear if Receive Fiber is set to NoneNone on Fiber screen.
Before adding the new event, set Cursor A as the active (red) cursor andposition it at the location for the new event.
1. Touch the Loss Mode field and select Splice LossSplice Loss.
2. Touch the EventEvent soft key.
3. Touching the Add EventAdd Event will open the following dialog box.
Optical Fiber Testing ApplicationsOptical Fiber Testing Applications
104104

Edit EventEdit Event
StartStart
Touch the Start field and then use the Numeric keypad to enter the desiredstarting point for the new event.
EndEnd
Touch the End field and then use the Numeric keypad to enter the desired endpoint for the new event.
LossLoss
Touch the Loss (dB) field and then use the Numeric keypad to enter thedesired loss for the new event.
ReflectReflect
Touch Reflect field and then use the Numeric keypad to enter the desiredreflectance value for the new event.
SaturatedSaturated
If selecting the check box, the new event will be flagged with an "S" after itsReflectance value in the Event table to denote it as a saturated event.
An event which has been added to a trace is flagged with an "*" before its event numberin the Event table to signify that it was manually added.
The original trace and event table can be retrieved as long as you have not saved theedited trace. Touch EventEvent soft key and touch AnalyzeAnalyze to re-run the analysis. The traceand its Event table are returned to their original status.
TypeType
Touch the Type field and then select the desired event type: Non-ReflectiveNon-Reflective, ReflectiveReflective or GroupGroup.
If selecting Non-Reflective event, ReflectReflect and SaturatedSaturated are disabled.
SplitterSplitter
Touch Splitter field and then select the desired number of splits of the newevent.
MacroBendMacroBend
Select the check box if add as a MacroBend event.
Before editing the new event, set Cursor A as the active (red) cursor andposition it at the location for the new event.
1. Touch the Measurement Mode field and select Splice LossSplice Loss.
2. Touch the EventEvent soft key.
3. Touching the Edit EventEdit Event will open the following dialog box.
Standard OTDRStandard OTDR
105105

If selecting Non-Reflective event, ReflectReflect and SaturatedSaturated are disabled.
If selecting Far End event or Questionable event, SplitterSplitter and MacroBendMacroBend aredisabled.
StartStart
Touch the Start field and then use the Numeric keypad to enter the new startingpoint for the selected event.
EndEnd
Touch the End field and then use the Numeric keypad to enter the new endpoint for the selected event.
LossLoss
Touch the Loss (dB) field and then use the Numeric keypad to enter the newevent loss for the selected event.
ReflectReflect
Touch Reflect field and then use the Numeric keypad to enter the newreflection value for the selected event.
SaturatedSaturated
If selecting the check box, the selected event will be flagged with an "S" after itsReflectance value in the Event table to denote it as a saturated event.
An event that has been moved is flagged with an "*" before its event number in the Eventtable.
The original trace and event table can be retrieved as long as you have not saved theedited trace. Touch EventEvent soft key and touch AnalyzeAnalyze to re-run the analysis. The traceand its Event table are returned to their original status.
TypeType
Touch the Type field and then select the new event type:
Event typeEvent type Available typesAvailable types
Non-Reflective,
Reflective, GroupNon-ReflectiveNon-Reflective, ReflectiveReflective, GroupGroup
Far End, Questionable Far EndFar End
Editing Questionable event will change type to Far End.
SplitterSplitter
Optical Fiber Testing ApplicationsOptical Fiber Testing Applications
106106

Touch Splitter field and then select the new number of splits of the selectedevent. If selecting other than NoneNone, the event type will be set to Splitter in spiteof TypeType setting.
MacroBendMacroBend
Select an event check box for new MacroBend.
Soft keysSoft keys
Test ModeTest Mode
Touching this button switches the Test Mode between AutoAuto and ManualManual.
WavelengthWavelength
Touching this button selects the wavelength applied for the test.
ParametersParameters
Touching this button launches the Test Parameter dialog box which allows toset Distance RangeDistance Range, Pulse WidthPulse Width, ResolutionResolution, and Average TimeAverage Time. This button isenabled when Test Mode is set to ManualManual.
OverlayOverlay
This key is available if overlay traces are loaded.
Drop OverlayDrop Overlay: Launches the dialog box selecting the trace to drop.
Swap OverlaySwap Overlay: Launches the dialog box selecting the trace to swap.
Align OverlayAlign Overlay: Selects how to align overlay traces.
OFFOFF: Does not align Overlay traces.
1dB Offset1dB Offset: Aligns Overlay traces with 1 dB spacing.
ONON: Forces all Overlay traces to align at the intersection of the
currently active cursor and the Primary trace.
Show OverlayShow Overlay: Turns the overlay trace display on or off.
EventEvent
AnalyzeAnalyze: Starts the event analysis.
Add EventAdd Event: Launches Add Event dialog box.
Edit EventEdit Event: Launches Edit Event dialog box.
Delete EventDelete Event: Deletes the event.
Bi-DirectionalBi-Directional
This key is available when the overlay trace is loaded. If setting to OnOn, theselected overlay trace is displayed in reversed direction.
The Bi-directional analysis is available when the following two traces are displayed.Overlay trace measured from the opposite end of the fiberPrimary trace measuring the same fiber.
When Bi-Directional is set to ONON, the following analysis values are calculatedfrom both traces and the event analysis results will be updated.
Total Loss
Loss (dB)
dB/km
Cum.Loss (dB)
Standard OTDRStandard OTDR
107107

To define the range to detect the same event on the Overlay trace as the eventon the Primary trace, specify Bi-Directional CorrelationBi-Directional Correlation value on Analysis tab ofthe Preferences screen.
Patch CordPatch Cord
Active Cursor to LaunchActive Cursor to Launch: Sets the active cursor position to Launch Length of
Patch-cord Setup.
Active Cursor to ReceiveActive Cursor to Receive: Sets the active cursor position to Receive Length of
Patch-cord Setup.
VFLVFL
Allows users to switch visible light output. When selecting OnOn or BlinkBlink, the redicon will blink at the bottom left of the screen.
VFL appears if Option 002 is installed.
55..11..33..44 Power MeterPower Meter
To measure the optical power, touch the tab at right-top to expand ApplicationToolbar.
1. Select the check box.
2. Select a wavelength.
3. When inputting the light to the OPM connector, the measured power value
appears.
Zero OffsetZero Offset
Zero offset performs the 0-level calibration of the power meter. Performing zerooffset will reduce measurement errors when the input power level is low.
1. Disconnect the fiber (if connected) and close the OPM port cover.
2. Touch Set ZeroSet Zero.
3. The confirmation message appears. Touch OKOK.
The message disappears when the zero offset process is completed
Optical Fiber Testing ApplicationsOptical Fiber Testing Applications
108108

55..11..44 MeasurementsMeasurements
55..11..44..11 Distance MeasurementDistance Measurement
When a primary trace is displayed, the fiber distance is automatically measuredfrom the origin of the trace to each of the two cursors (A, B) and between thecursors (A-B). The values are displayed at left-hand bottom of the Trace screen.Proper cursor placement is crucial for accurate measurements.
Improper distance readings may be reported if the Index of Refraction (IOR) is setinaccurately.
Two of the most common distance measurements are:
Fiber Length (the total distance of a fiber)
Distance to a Break (the distance from a known point to a break in the fiber)
Fiber Length MeasurementFiber Length Measurement
1. Touch .
2. Touch .
3. Touch AA.
4. Place Cursor A at the end of the test fiber box (pulse suppressor), if one is
used, or at 0.0000 km, as shown in the following figure.
5. Touch to expand the screen horizontally and vertically around Cursor A for
more accurate cursor placement.
6. Place Cursor A on linear backscatter just prior (to the left side) of the
reflective or non-reflective event, as shown in the following figure.
7. Touch BB.
8. Place Cursor B at the end of the fiber (see figure in step 4).
Standard OTDRStandard OTDR
109109

9. Expand the screen horizontally and vertically around Cursor B for more
accurate cursor placement.
10. Place Cursor B on linear backscatter just prior (to the left side) of the
reflective or non-reflective event (see figure in step 6).
11. Read the fiber length as the A-B distance in the Cursor Distance information
area.
Distance to a Break MeasurementDistance to a Break Measurement
The following procedure demonstrates a method of locating a break relative toa known point on the fiber.
1. Touch .
2. Touch .
3. Touch BB.
4. Place Cursor B at the break in the fiber, as shown in the following figure.
5. Touch to expand the screen horizontally and vertically around Cursor B for
more accurate cursor placement.
6. Place Cursor B on linear backscatter just prior (to the left side) of the
reflective or non-reflective event, as shown in the following figure.
7. Touch AA.
8. Place Cursor A at a known point on the fiber (see figure in step 4).
9. Expand the screen horizontally and vertically around Cursor A for more
accurate cursor placement.
10. Place Cursor A on linear backscatter just prior (to the left side) of the
reflective or non-reflective event (see figure in step 6).
11. Read the distance from the known point to the break as the A-B distance in the
Cursor Distance information area.
Optical Fiber Testing ApplicationsOptical Fiber Testing Applications
110110

55..11..44..22 Loss MeasurementsLoss Measurements
Loss ModesLoss Modes
When a primary trace is displayed, there are several different types ofmeasurements available through the Loss Mode field:
Splice Loss
2-Pt Loss
2-Pt LSA
dB/km Loss
dB/km LSA
2-Pt & dB/km Loss
ORL (Optical Return Loss)
Event ExamplesEvent Examples
The following figure shows examples of events on a fiber that are referred to inthe various Loss Mode procedures that follow this section. Use the figure as anaid to understand some to the terminology used to describe measurementprocedures.
1 OTDR input 8 Reflective splice connector
2 Fusion splice 9 Fresnel reflection
3 Mechanical splice connector 10 Rayleigh backscatter
4 Fusion splice 11 Non-reflective gainer
5 End of cable 12 Reflective end
6 Diffusion tail 13 Noise floor
7 Non-reflective loser
2-Point Loss2-Point Loss
The 2-Point Loss Measurement uses a data point at Cursor A and a data pointat Cursor B to calculate the change in dB between the two points. Normally theCursor A (Y-Axis) data is greater than the Cursor B (Y-Axis) data and a positiveloss measurement is displayed. Otherwise, the loss value is reported as anegative quantity called a "gainer".
Standard OTDRStandard OTDR
111111
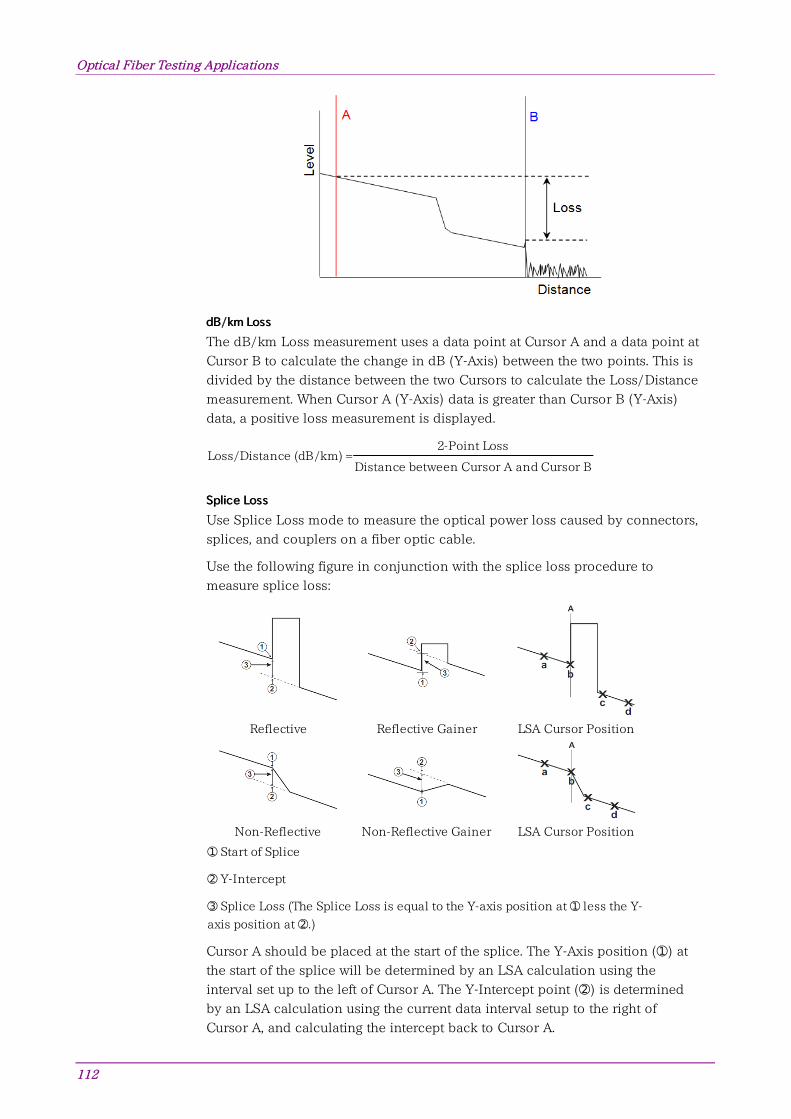
dB/km LossdB/km Loss
The dB/km Loss measurement uses a data point at Cursor A and a data point atCursor B to calculate the change in dB (Y-Axis) between the two points. This isdivided by the distance between the two Cursors to calculate the Loss/Distancemeasurement. When Cursor A (Y-Axis) data is greater than Cursor B (Y-Axis)data, a positive loss measurement is displayed.
Loss/Distance (dB/km) =2-Point Loss
Distance between Cursor A and Cursor B
Splice LossSplice Loss
Use Splice Loss mode to measure the optical power loss caused by connectors,splices, and couplers on a fiber optic cable.
Use the following figure in conjunction with the splice loss procedure tomeasure splice loss:
Reflective Reflective Gainer LSA Cursor Position
Non-Reflective Non-Reflective Gainer LSA Cursor Position
➀ Start of Splice
➁ Y-Intercept
➂ Splice Loss (The Splice Loss is equal to the Y-axis position at ➀ less the Y-
axis position at ➁.)
Cursor A should be placed at the start of the splice. The Y-Axis position (➀) atthe start of the splice will be determined by an LSA calculation using theinterval set up to the left of Cursor A. The Y-Intercept point (➁) is determinedby an LSA calculation using the current data interval setup to the right ofCursor A, and calculating the intercept back to Cursor A.
Optical Fiber Testing ApplicationsOptical Fiber Testing Applications
112112

Adjusting the LSA Intervals for Splice Loss ModeAdjusting the LSA Intervals for Splice Loss Mode
On some events you may need to adjust the LSA intervals (fuzzy cursors) toobtain a better estimate of an event splice loss, especially if either of theintervals fall within the actual loss interval or "knee" (see the following figure).
The intervals fall within
the actual loss interval
The intervals fall within
the kneeThe appropriate interval
2-Point LSA2-Point LSA
The Least Squares Approximation (LSA) 2-Point Loss measurement uses anLSA technique to calculate the best Y-intercept values based on the currentcursor positions. Intervals directly to the right of Cursor A and left of Cursor Bwill be used to calculate the intercept values. The length of the LSA intervals isuser selectable. The default value is approximately 400 meters. The ends of theintervals are displayed as "×" marks, as shown in the following figure.
The LSA 2-Point Loss is the change in dB (Y-Axis) calculated between the twopoints. When the Cursor A, Y-Axis position is greater than the Cursor B, Y-Axisposition, a positive loss measurement is displayed.
LSA technique is useful when the trace is excessively noisy.
The left interval is associated with Cursor A and the right interval with Cursor B.The default location for the left interval is immediately to the right of Cursor A.The default location for the right interval is immediately to the left of the BCursor.
Standard OTDRStandard OTDR
113113

Adjusting the Left and Right LSA IntervalsAdjusting the Left and Right LSA Intervals
In some cases, such as a very noisy trace or a trace with closely spaced event,you may need to adjust the LSA intervals (fuzzy cursors) to obtain moreaccurate 2-Point LSA and dB/km LSA loss measurements. Refer to Adjustingthe LSA Intervals for Splice Loss Mode.
dB/km LSAdB/km LSA
The dB/km LSA Loss measurement finds the LSA 2-Point Loss (refer to 2-PointLSA for details) and divides it by the distance between the two cursors.
Loss/Distance (dB/km) =LSA 2-Point Loss
Distance between Cursor A and Cursor B
ORL (Optical Return Loss)ORL (Optical Return Loss)
The Network Master provides the ability to calculate Optical Return Loss(ORL), the ratio of reflected energy to input energy for a fiber optic link.
ORL can be calculated for a section of the fiber optic link or for the entire link.
2-point & dB/km Loss2-point & dB/km Loss
The combined 2-Point & dB/km loss mode displays both loss values at thesame time. The loss values, separated by a "," are displayed in the Loss Mode,Measurement, and Reflectance area.
Refer to 2-Point Loss and dB/km Loss for details on the individual loss modes.
55..11..44..33 ReflectanceReflectance
OverviewOverview
Reflectance is the ratio of reflected power to incident power displayed in dB. Areflectance measurement is affected by the Pulse width and the BackscatterCoefficient.
Optical Fiber Testing ApplicationsOptical Fiber Testing Applications
114114

A reflectance value for reflective events is displayed in the lower section of theLoss Mode, Measurement, and Reflectance area when either Auto or Manual isselected by the Reflectance Calculation on Analysis tab in Preferences screen.The reflectance reading may also contain an "S" indicator. The reflectancemeasurement is made relative to Cursor A when set to Auto and relative toCursors A and B when set to Manual.
Auto Reflectance ModeAuto Reflectance Mode
Auto Reflectance mode requires placement of Cursor A only and automaticallymakes the measurement based upon the cursor placement. There arerestrictions on the placement of Cursor A detailed in the following procedure.
When the reflectance value is saturated, the value will be preceded by an "S".
To perform auto reflectance measurements:
1. Touch SETUPSETUP at the bottom of the screen.
2. Touch PreferencePreference in the navigation area and touch AnalysisAnalysis
3. Touch Reflectance CalculationReflectance Calculation field and select AutoAuto.
4. Touch MeasurementMeasurement in the navigation area.
5. Touch Test ModeTest Mode field and select ManualManual.
Set the Distance RangeDistance Range, selecting the shortest possible range,
following the fiber length plus 25% rule.
Set the Pulse widthPulse width. 1 μs is a good typical setting. This setting
generally provides a combination of good range and good resolution.
Set the ResolutionResolution to FineFine.
Set the Average TimeAverage Time to 1min1min, to provide good data acquisition.
6. Touch Start AveragingStart Averaging icon in application toolbar to test the fiber.
After the test is completed, the reflectance reading is displayed in the lower
section of the Loss Mode, Measurement, and Reflectance area. Moving Cursor
A will change the reflectance value.
7. Place Cursor A on backscatter just prior (to the left side) of the reflective event
in order to achieve an accurate reflectance measurement.
Standard OTDRStandard OTDR
115115

8. Zoom in on the trace to place Cursor A as close as possible to the rising edge
of the reflection. Cursor A must be placed on a linear section of the waveform
backscatter and NOT the rising edge of the reflection. (See the figure in step 7
which uses a 1 μs pulse width and yields a 200 meter minimum distance
between origin and Cursor A placement.)
Cursor A may be placed to within two pulse widths from the origin or start of
the OTDR trace (OTDR bulkhead).
Manual Reflectance ModeManual Reflectance Mode
Both Cursors (A and B) are used for this measurement.
To perform auto reflectance measurements:
1. Touch SETUPSETUP at the bottom of the screen.
2. Touch PreferencePreference in the navigation area and touch AnalysisAnalysis.
3. Touch Reflectance CalculationReflectance Calculation field and select ManualManual.
4. Touch MeasurementMeasurement in the navigation area.
5. Touch Test ModeTest Mode field and select ManualManual.
Set the Distance RangeDistance Range, selecting the shortest possible range,
following the fiber length plus 25% rule.
Set the Pulse widthPulse width. 1 μs is a good typical setting. This setting
generally provides a combination of good range and good resolution.
Set the ResolutionResolution to FineFine.
Set the Average TimeAverage Time to 1min1min, to provide good data acquisition.
6. Touch Start AveragingStart Averaging icon in application toolbar to test the fiber.
After the test is completed, the reflectance reading is displayed in the lower
section of the Loss Mode, Measurement, and Reflectance area. Moving Cursor
A will change the reflectance value.
7. Place Cursor A on backscatter just prior (to the left side) of the reflective event
in order to achieve an accurate reflectance measurement.
8. Zoom in on the trace to place Cursor A as close as possible to the rising edge
of the reflection. Cursor A must be placed on a linear section of the waveform
backscatter and NOT the rising edge of the reflection (See the figure in step 7).
9. Place Cursor B on the center of the reflectance pulse (see the figure in step 7).
Optical Fiber Testing ApplicationsOptical Fiber Testing Applications
116116

Occasionally a small, narrow peak may be present (as shown in the figure above). Do notplace Cursor B on top of the first narrow peak, if a narrow peak is present, as this willresult in an inaccurate reflectance measurement.
55..11..44..44 Real Time TestingReal Time Testing
Real Time test mode provides a quick 'real-time' view of the initial traceinformation. In this mode, trace data is not continually averaged, but is stoppedand restarted after each screen update. Real Time mode enables optimizationof fiber connections at or near the OTDR connector, as the trace display showsthe effect of the making changes to the connections.
To attenuate a saturated event when in Real Time test mode, move the active cursorwithin the event, until the unit auto-attenuates the event (pulling the event out ofsaturation).
Standard OTDRStandard OTDR
117117

55..22 FTTAFTTA
Fiber To The Antenna (FTTA) is the technology connecting the base stations of
mobile communication system using the optical fiber. FTTA application is designed
for locating fault positions of an optical fiber installed in base stations.
Optimize the measurement parameters such as distance range, for short
distance optical fiber test.
The test result is displayed on Fiber Visualizer and Trace screen. However,
number of analysis parameters to set are decreased.
55..22..11 Measurement Condition SetupMeasurement Condition Setup
The first step in running an application is to set up the port interfaces. This isdone on the SetupSetup screen, which also provides port status information.
For following settings, refer to the sections in Standard OTDR application.
Port
Measurement
Only Wavelength can be set on Measurement screen.
IOR/BSC
Header
Preferences
55..22..22 Test SetupTest Setup
For screen description, refer to sections in Standard OTDR application.
Fiber
Auto Detect
Pass/Fail
In FTTA application, settings concerning the splitter do not appear. Number of parameters to set has been reduced than that of Standard OTDR application.
Optical Fiber Testing ApplicationsOptical Fiber Testing Applications
118118

55..22..33 Test ResultTest Result
55..22..33..11 Fiber VisualizerFiber Visualizer
Touching the Fiber VisualizerFiber Visualizer button in the navigation area will launch thefollowing screen.
For screen description, refer to Fiber Visualizer section in Standard OTDRapplication.
Soft keysSoft keys
Test ModeTest Mode
Touching this button switches the Test Mode between AutoAuto and ManualManual. Whensetting to ManualManual, the measurement parameters can be set.
WavelengthWavelength
Touching this button switches the wavelength applied for the test.
ParametersParameters
Touching this button launches the Test Parameter dialog box which allows toset Distance RangeDistance Range, Pulse WidthPulse Width, ResolutionResolution, and Average TimeAverage Time. This button isenabled when Test Mode is set to ManualManual.
OverlayOverlay
This key is available if overlay traces are loaded.
Swap OverlaySwap Overlay: Opens the dialog box selecting the trace to swap.
VFLVFL
Allows users to switch visible light output. When selecting OnOn or BlinkBlink, the redicon will blink at the bottom left of the screen.
VFL appears if Option 002 is installed.
FTTAFTTA
119119

55..22..33..22 TraceTrace
Touching the TraceTrace button in the navigation area will launch the followingscreen.
For screen description, refer to Trace section in Standard OTDR application.
Soft keysSoft keys
Test ModeTest Mode
Touching this button switches the Test Mode between AutoAuto and ManualManual.
WavelengthWavelength
Touching this button selects the wavelength applied for the test.
ParametersParameters
Touching this button launches the Test Parameter dialog box which allows toset Distance RangeDistance Range, Pulse WidthPulse Width, ResolutionResolution, and Average TimeAverage Time. This button isenabled when Test Mode is set to ManualManual.
OverlayOverlay
This key is available if overlay traces are loaded.
Drop OverlayDrop Overlay: Launches the dialog box selecting the trace to drop.
Swap OverlaySwap Overlay: Launches the dialog box selecting the trace to swap.
Align OverlayAlign Overlay: Switches how to align overlay traces.
OFFOFF: Does not align Overlay traces.
1dB Offset1dB Offset: Aligns Overlay traces with 1 dB spacing.
ONON: Forces all Overlay traces to align at the intersection of the
currently active cursor and the Primary trace.
Show OverlayShow Overlay: Turns the overlay trace display on or off.
EventEvent
AnalyzeAnalyze: Starts the event analysis.
Add EventAdd Event: Launches Add Event dialog box.
Edit EventEdit Event: Launches Edit Event dialog box.
Delete EventDelete Event: Deletes the event.
Optical Fiber Testing ApplicationsOptical Fiber Testing Applications
120120

Patch CordPatch Cord
Active Cursor to LaunchActive Cursor to Launch: Sets the active cursor position to Launch Length of
Patch-cord Setup.
Active Cursor to ReceiveActive Cursor to Receive: Sets the active cursor position to Receive Length of
Patch-cord Setup.
VFLVFL
Allows users to switch visible light output. When selecting OnOn or BlinkBlink, the redicon will blink at the bottom left of the screen.
VFL appears if Option 002 is installed.
55..22..33..33 Power MeterPower Meter
To measure the optical power, touch the tab at right-top to expand ApplicationToolbar.
1. Select the check box.
2. Select a wavelength.
3. When inputting the light to the OPM connector, the measured power value
appears.
Zero OffsetZero Offset
Zero offset performs the 0-level calibration of the power meter. Performing zerooffset will reduce measurement errors when the input power level is low.
1. Disconnect the fiber (if connected) and close the OPM port cover.
2. Touch Set ZeroSet Zero.
3. The confirmation message appears. Touch OKOK.
The message disappears when the zero offset process is completed
FTTAFTTA
121121

55..33 ConstructionConstruction
An optical cable contains many optical fibers. So testing those fibers is required
when installing the optical cables. Construction is the application which is designed
to test multiple fibers sequentially.
Example of Underground Optical Cable Installation
In Construction application, set Number of Fibers in the ProjectProject screen.Construction measurement repeats the fiber measurement in count set in theNumber of Fibre. It is allowed to skip a fiber measurement on the way ofConstruction measurement. Measurement Condition Setup and Test Setup are locked while theConstruction measurement is running.
55..33..11 Application ToolbarApplication Toolbar
Some icons on Application Toolbar are changed in Construction application.
Start TestStart Test
Touching the Start TestStart Test icon starts the test defined in Project.
After the measurement of all fibers has completed, the traces are deleted
automatically and the Setup screen is displayed.
Cancel All TestCancel All Test
Touching the Cancel All TestCancel All Test icon cancels the measurement defined by the project.
Skip This TestSkip This Test
This icon is available while the measurement is running. Touching the Skip This TestSkip This Test
icon skips one test of the fiber number under measurement without saving the
measurement results.
AcceptAccept
To use this icon, set Preview softkey to ONON during the fiber measurement. This icon
will be available after one fiber measurement in the project has finished. Touch the
AcceptAccept icon to save the measured fiber test result. The project resumes the next fiber
measurement.
Optical Fiber Testing ApplicationsOptical Fiber Testing Applications
122122

55..33..22 Measurement Condition SetupMeasurement Condition Setup
The first step in running an application is to set up the measurementconditions. This is done on the SetupSetup screen, which also provides port statusinformation.
55..33..22..11 ProjectProject
Touching the ProjectProject button in the navigation area will launch the followingscreen.
Project NameProject Name
Touch the field to enter the project name.
Number of FibersNumber of Fibers
Touch the field and set the number of fibers which will be tested.
Start Fiber NumberStart Fiber Number
Touch the field and set the start fiber number. When Number of FibersNumber of Fibers is 20and Start Fiber NumberStart Fiber Number is 5, the fiber numbers to be measured will be set to 5through 24
Location ALocation A
Sets the location name at measurement start.
Location BLocation B
Sets the location name at measurement end.
DirectionDirection
Selects a direction to be measured. A -> B: Location A to Location B B -> A: Location B to Location A
Store Files AtStore Files At
Sets the destination folder to save files.
ConstructionConstruction
123123

The folder name where the file will be saved actually is displayed at the bottomof the Setup area.
Base FilenameBase Filename
The Base Filename field provides a template for use when generating an auto-filename. You can enter the base filename of up to 70 characters.
The folder path and the filename to save first are displayed at the bottom of theSetup area.
55..33..22..22 MeasurementMeasurement
Touching the MeasurementMeasurement button in the navigation area displays two tabs.
WavelengthWavelength
Touching the WavelengthWavelength tab will launch the following screen.
Output PortOutput Port
Touch the field to select the port used for the test.
MU100020A, MU100022A: Fixed to Single ModeSingle Mode.
MU100021A: Single ModeSingle Mode, Multi ModeMulti Mode
WavelengthWavelength
Select the checkbox of the wavelength used for the test.
Output PortOutput Port Available wavelengthAvailable wavelength
Single Mode 1310 nm, 1550 nm, 1625 nm
Multi Mode 850 nm, 1300 nm
Available wavelength depends on the model.
Macro BendMacro Bend
Appears when Output PortOutput Port is set to Single Mode. Selecting the check box willrun the macro bend analysis from the measurement results.
Optical Fiber Testing ApplicationsOptical Fiber Testing Applications
124124

Test ParametersTest Parameters
Touching the Test ParametersTest Parameters tab will launch the following screen.
Same SettingsSame Settings
Select the check box if applying the same settings for all wavelengths.
The following items can be set for each wavelength.
Test ModeTest Mode
Touch the field to select the test mode. If selecting AutoAuto, the parameters will be set automatically. Selecting ManualManual allows a user to set parameters.
Distance RangeDistance Range
Select the upper limit of distance to locate faults.
Pulse WidthPulse Width
Select the pulse width of optical signal.
ResolutionResolution
Select the resolution in horizontal.
Average TimeAverage Time
Select the averaging time of measured traces applied for Start AveragingStart Averaging.
55..33..22..33 TemplateTemplate
Touching the TemplateTemplate button in the navigation area will launch the followingscreen.
ConstructionConstruction
125125

Use TemplateUse Template
To use template, select the check box.
Template mode is a function to display event information by generating apredefined event table and mapping the collected trace onto the eventconditions in this event table.
The reflectance events or the loss events are likely to appear at the same pointsin each measured trace, because the fibers installed in the same cable areconnected and bended at the same distances. Therefore the event analysis isperformed at the same distances by using the pre-defined trace (template).
Template FileTemplate File
Touch the field and select the template file.
Event DeterminationEvent Determination
The setting made in the Event Determination controls how the Template traceevent are applied to the selected target trace.
Copy from TemplateCopy from Template: all events are copied directly from the template trace and
onto the collected trace.
Merge Template and TraceMerge Template and Trace: the events in the template trace and the collected
trace are correlated and merged.
Both the collected trace and the template trace are analyzed.
Trace PriorityTrace Priority
The Trace Priority check box gives the target trace event location priority overcorrelated events from the template when Merge is selected.
If cleared, events are processed as the following.
Non-correlated template events are inserted into the target trace.
Correlated template events replace the correlating target trace events.
All other target trace events are left unchanged.
Optical Fiber Testing ApplicationsOptical Fiber Testing Applications
126126

In the left example, if the checkbox is not
selected, the event distance from the
collected trace (12.2 km) is replaced by
that from the template (11.5 km).
If the checkbox is selected, the event
distance from the collected trace (12.2 km)
is used as it is.
Relative DistanceRelative Distance
The Distance defines the size of the correlation window in percentage ratiowhich determines how close together events must be to correlate.
Absolute DistanceAbsolute Distance
Absolute Distance defines the size of the correlation window in km unit whichdetermines how close together events must be to correlate.
The minimum value of Relative Distance and Absolute Distance is applied tothe correlation window.
Example
When Relative Distance is 3 % and Absolute Distance is 1 km are set:
Event DistanceEvent Distance RelativeRelativeDistanceDistance
AbsoluteAbsoluteDistanceDistance
CorrelationCorrelationWindowWindow
10 km 0.3 km 1 km 0.3 km
50 km 1.5 km 1 km 1 km
Distance Helix Factor AdjustmentDistance Helix Factor Adjustment
Events in the template trace and the target trace may not align perfectly due tothe differences in lengths of the fibers within a single cable. Distance HelixFactor Adjust options compensate for the difference in length and also obtainimproved splice location and loss estimation.
NoneNone: The template and target trace event locations will be used as they are,
without Distance Helix Factor Adjustment.
Snap to Template EndSnap to Template End: All event distances of measured trace will be converted
by the following formula so that the far end distance of measured trace will
match the far event distance of the template.
E'Mes(i)= EMes(i) ×DTemp
DMes
EMes(i): The i-th event distance of the measured trace.
E'Mes(i): The i-th event distance after the conversion.
DTemp: Far End event distance of the template.
DMes: Far End event distance of the measured trace.
Snap to Trace EndSnap to Trace End: All template event distances will be converted by the
following formula so that the far end distance of template will match the far
event distance of measured trace.
E'Temp(i)= ETemp(i) ×DMes
DTemp
ConstructionConstruction
127127

ETemp(i): The i-th event distance of the template.
E'Temp(i): The i-th event distance after the conversion.
DTemp: Far End event distance of the template.
DMes: Far End event distance of the measured trace.
When the following conditions are assumed, the result event distances areshown in the table.
Event distances of the template (km): 10, 20, 40
Event distances of the measured trace (km): 20.1, 30.1, 40.1
Relative Distance: 3.0 %
Absolute Distance: 1.0000 km
Setting of Template Screen and Distances of Event AnalysisSetting of Template Screen and Distances of Event Analysis
Use TemplateUse Template EventEventDeterminationDetermination
Distance HelixDistance HelixFactorFactor
AdjustmentAdjustmentTraceTracePriorityPriority
Distances of EventDistances of EventAnalysis (km)Analysis (km)
Off - - - 20.1, 30.1, 40.1
On
Copy from
Template
None - 10, 20, 40
Snap to
Template End- 10, 20, 40
Snap to Trace
End- 10.025, 20.05, 40.1
Merge Template
and Trace
None
Off
10, 20, 30.1, 40
Snap to
Template End10, 20, 30.025, 40
Snap to Trace
End10.025, 20.05, 30.1, 40.1
None
On
10, 20.1, 30.1, 40.1
Snap to
Template End10, 20.05, 30.025, 40
Snap to Trace
End10.025, 20.1, 30.1, 40.1
Detailed explanation of the Distance Helix Factor Adjustment functionDetailed explanation of the Distance Helix Factor Adjustment function
The following explanation assumes the Template screen settings other than theDistance Helix Factor Adjustment options are as follows.
Event Determination: Merge
Trace Priority: OFF
Distance: 30%
Absolute Distance: 1 km
Also, assume that the Template trace and Target trace event locations are asfollows:
Target trace event locations
Template trace event locations
The following describes the corrections performed when each option isselected for the example shown above.
If NoneNone is selected
Optical Fiber Testing ApplicationsOptical Fiber Testing Applications
128128

1. The event locations for the Target trace and Template trace events
remain unchanged and correlation is performed without using the
Distance Helix Factor Adjustment function.
Target trace event
locations after
correlation
If Snap to Template EndSnap to Template End is selected
1. Each Template trace event is converted proportionately relative to the
Target trace end event location.
Adjusted Template
trace event locations
after conversion
2. Next, correlation is performed using the Target trace events and
converted temporary Template trace events.
Temporary Target
trace event locations
after correlation
3. Finally, the correlated temporary Template trace events are converted
proportionately relative to the end event location for the Template
trace events.
Final Target trace
event locations
If Snap to Trace EndSnap to Trace End is selected
1. Each Template trace event is converted proportionately relative to the
Target trace end event location.
Adjusted Template
trace event locations
after conversion
2. Next, correlation is performed using the Target trace events and
converted temporary Template trace events.
Target trace event
locations after
correlation
The following table shows examples of resultant target trace events for the threeDistance Helix Factor Adjustment options
Resultant Target Trace EventsResultant Target Trace Events
Template TraceTemplate TraceEvent LocationEvent Location
Target TraceTarget TraceEvent LocationEvent Location
ResultResultDistance Helix Factor Adjustment:Distance Helix Factor Adjustment:
NoneNone Snap to Snap to Template EndTemplate End
Snap to Snap to Trace EndTrace End
10 15 10, 15 10 ,13.33 11.25, 15
20 30 20, 30 20, 26.66 22.5, 30
40 45 40 40.0 45
ConstructionConstruction
129129
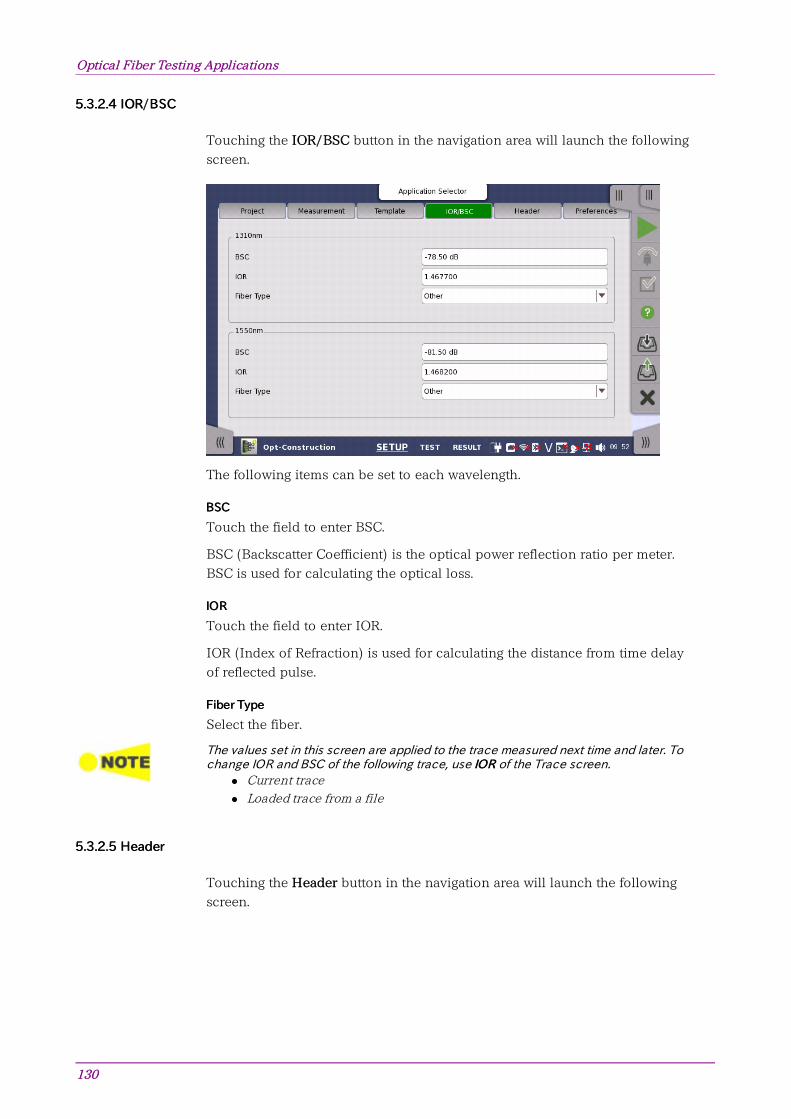
55..33..22..44 IOR/BSCIOR/BSC
Touching the IOR/BSCIOR/BSC button in the navigation area will launch the followingscreen.
The following items can be set to each wavelength.
BSCBSC
Touch the field to enter BSC.
BSC (Backscatter Coefficient) is the optical power reflection ratio per meter.BSC is used for calculating the optical loss.
IORIOR
Touch the field to enter IOR.
IOR (Index of Refraction) is used for calculating the distance from time delayof reflected pulse.
Fiber TypeFiber Type
Select the fiber.
The values set in this screen are applied to the trace measured next time and later. Tochange IOR and BSC of the following trace, use IORIOR of the Trace screen.
Current traceLoaded trace from a file
55..33..22..55 HeaderHeader
Touching the HeaderHeader button in the navigation area will launch the followingscreen.
Optical Fiber Testing ApplicationsOptical Fiber Testing Applications
130130

In this screen, the contents of File header which will be stored in the result file(*.sor) can be set.
Next items are printed in Report.
Cable ID, Fiber ID, Location A, Location B, Operator
Data FlagData Flag
Selects the data flag of the measured traces
BC(built)BC(built): The trace which was measured when the cable was built.
RC(repair)RC(repair): The trace which was measured when the cable was repaired.
OT(other)OT(other): The trace which was measured in other case.
Cable IDCable ID
Sets the ID of the measured cable.
Fiber IDFiber ID
Sets the ID of the measured fiber.
Cable CodeCable Code
Sets the cable code of the measured cable.
Location ALocation A
Sets the location name at measurement start. Location ALocation A of Project screen willbe changed to the name entered here.
Location BLocation B
Sets the location name at measurement end. Location BLocation B of Project screen willbe changed to the name entered here.
DirectionDirection
Selects a direction to be measured. DirectionDirection of Project screen will be changedto the direction selected here. A -> B: Location A to Location B B -> A: Location B to Location A
OperatorOperator
ConstructionConstruction
131131

Sets the the measured person's name.
CommentComment
Sets the comment concerned to the measured trace.
Sequence NumberSequence Number
Sets the starting number of the sequence number included in the header.
55..33..22..66 PreferencesPreferences
Touching the PreferencesPreferences button in the navigation area will display four tabs.
MeasurementMeasurement
Touching the MeasurementMeasurement tab displays the following screen.
Full checkFull check
Selecting the check box selects three check boxes of Connection CheckConnection Check, ActiveActiveFiber CheckFiber Check, and Realtime measurement checkRealtime measurement check.
Connection CheckConnection Check
The Connection Check function confirms whether or not the fiber is connectedcorrectly to the OTDR measurement port.
Active Fiber CheckActive Fiber Check
The Active Fiber Check performs a "live fiber" check on the currently attachedfiber under test to detect whether the fiber is carrying traffic before firing anyOTDR laser sources.
If no traffic is detected, the test proceeds normally.
If traffic is detected, a warning message appears on the screen and the test is
aborted.
The Active Fiber Check feature does not apply to the 850/1300 nm multimode fiber.
Realtime measurement checkRealtime measurement check
Optical Fiber Testing ApplicationsOptical Fiber Testing Applications
132132

Selecting the check box runs realtime measurement before performing eachfiber test. When multiple wavelengths are selected, the realtime measurementruns using the shortest wavelength.
AverageAverage
Select whether processing averaging or not in Realtime Measurement.
LowLow: Does not perform averaging.
HighHigh: Performs averaging. Set this setting when the distance range to
measure is long because the OTDR noise can be suppressed.
Measurement ModeMeasurement Mode
Select whether performing the averaging process or not at Realtimemeasurement.
NormalNormal: Set when measuring the back scatter light from the optical fiber.
High Reflection MeasurementHigh Reflection Measurement: Set when measuring the trace that large level
differences are included such as Fresnel reflections. This setting takes longer
measurement time than the NormalNormal setting.
Multimode fiber under testMultimode fiber under test
This setting appears when Multi ModeMulti Mode is selected on Wavelength tab ofMeasurement screen. Select the core diameter of the multimode fiber undertest. "um" is used in place of "μm".
AnalysisAnalysis
Touching the AnalysisAnalysis tab displays the following screen.
Reflectance CalculationReflectance Calculation
Select the reflectance calculation method.
OffOff: Reflectance will not be calculated.
AutoAuto: The reflectance of any event is reported based on the position of cursor
A. The Auto setting is most useful for reflective events that are not close
together or close-in to the OTDR.
ManualManual: When set to Manual, the reported reflectance is based on the
positions of both cursors (A and B). The Manual setting is most useful for
ConstructionConstruction
133133

reflective events that are close together or close-in to the OTDR.
For details, refer to Reflectance.
ORL CalculationORL Calculation
Select the starting point for ORL (Optical Return Loss) measurements.
Cursor ACursor A: The ORL measurement is calculated from the cursor A to the cursor
B, but the Incident Power is attained from the A cursor position.
OriginOrigin: The ORL measurement is calculated from the cursor A to the cursor B,
but the Incident Power is attained from the origin (e.g.: 0 km, or Bulkhead
connector).
Full TraceFull Trace: The ORL measurement is calculated from the Origin to the last
data point, and the Incident Power is attained from the origin (e.g.: 0 km, or
Bulkhead connector).
Event Table Span CalculationEvent Table Span Calculation
Selects whether to display the span length or transmission loss (dB/km) onevent table. This setting function applies only to Event Table in the Tracescreen.
dB/km
Span Length
End Event For ORL CalculationEnd Event For ORL Calculation
Set whether to include reflection in Far-End events or not when calculating theORL. This setting function applies to the following.
Include
Omit
DisplayDisplay
Touching the DisplayDisplay tab displays the following screen.
Distance Display UnitsDistance Display Units
Optical Fiber Testing ApplicationsOptical Fiber Testing Applications
134134

Select the unit of measurement used to display distance on the horizontal axisof the Trace graph. This affects Range and Resolution readings and analysisevents incorporating distance.
Trace OverviewTrace Overview
When the check box is selected, a small overview of the trace is displayed inthe lower left portion of the Trace graph.
Auto ScaleAuto Scale
When the check box is selected, Horizontal scale is automatically set so thatFar End event is displayed in the Trace screen.
Auto ZoomAuto Zoom
Selecting the check box will automatically zoom in on the event selected in theResult screen.
Display Mode After AnalysisDisplay Mode After Analysis
The Display Mode After Analysis setting is used to set the post-analysis displaymode.
End/BreakEnd/Break: Displays the range up to the Far end event or the broken point.
Full TraceFull Trace: Displays full range of distance.
CurrentCurrent: Displays the trace with the current scale settings.
Show Internal Launch FiberShow Internal Launch Fiber
Selecting the check box will display dummy fiber in the Trace screen.
File & OthersFile & Others
Touching the File & OthersFile & Others tab will launch the following screen.
File Save VerifyFile Save Verify
Selecting the check box displays the file save dialog box when the tests in allspecified wavelength have finished.
Calibration PeriodCalibration Period
Touch the field to set the calibration period in months.
ConstructionConstruction
135135

Calibration expiration date is printed in the Report.
Digit of File NumberDigit of File Number
Select a number of digits of a consecutive number which is add into file namesbeing created during the measurement.
55..33..33 Test SetupTest Setup
For screen description, refer to sections in Standard OTDR application.
Fiber
Auto Detect
Pass/Fail
In Construction application, settings concerning the splitter do not appear. Number of parameters to set has been reduced to less than that of Standard OTDRapplication.
Optical Fiber Testing ApplicationsOptical Fiber Testing Applications
136136

55..33..44 Test ResultTest Result
55..33..44..11 InformationInformation
When touching the start icon on the Application toolbar, the InformationInformation dialogbox appears.
In the upper frame, the fiber number is displayed under Connect FiberConnect Fiber and theconnecting connector on OTDR module is indicated. In the lower frame, filenames which will be stored are displayed.
ContinueContinue
Touch ContinueContinue to advance to the Connection Check screen, if ConnectionCheck is selected in the Measurement tab of the Preferences screen.
If Connection Check is cleared in the Measurement tab of the Preferencesscreen, touch ContinueContinue advances to the Trace screen and starts themeasurement of the currently connected fiber.
Change Fiber NumberChange Fiber Number
Allows to change the current Connect Fiber number.
Skip This TestSkip This Test
Skips the test of the displayed fiber number. The next fiber number is displayedin the dialog box.
Cancel All TestCancel All Test
Aborts the test of all fibers.
ConstructionConstruction
137137

55..33..44..22 Connection CheckConnection Check
If selecting Connection CheckConnection Check on Preference screen, Connection Check Levelwill appear after starting a measurement.
Bar ColorBar Color Connection LossConnection Loss**
Green <1 dB
Yellow 1 to 2 dB
Red >2 dB
*: Values for reference purposes. The value may not be
measured correctly depending on reflection from the optical
connector or the fiber.
1.5 dB is added to each value when using a 50μm multi-
mode fiber.
Good connectionGood connection
The gauge is green when connection is good. The closer the bar in theconnection gauge extends to "HIGH" end, the better the connection is.
Bad connectionBad connection
The gauge is red when connection is bad. And it is yellow when connection isnot good. If the bar color is yellow, touch ContinueContinue soft key to perform the test.
If the gauge is yellow or red, the fiber needs cleaning.
If the connection state is not improved even if the fiber is cleaned, the fiberneeds to be replaced.
Fibers shorter than approximately 48 meters (160 ft.) will generally result in a lowconnection level.
Optical Fiber Testing ApplicationsOptical Fiber Testing Applications
138138

55..33..44..33 TraceTrace
The following screen is displayed for test result of Construction application.
In the Trace screen, the fiber loss versus distance is shown in graphical. Thefollowing icons appear on the traces.
Appears at an event position with Event type icon.
This icon appears on the left hand axis, at the level of the active
cursor.
Appears at the position of an LSA (Least Squares Approximation)
cursor.
Appears if Launch fiber in Fiber screen is set to other than NoneNone.
This position is the start point of the fiber under test.
Appears if Receive fiber in Fiber screen is set to other than NoneNone.
This position is the end point of the fiber under test.
ConstructionConstruction
139139

Icons on the left hand control the screen display.
When this icon is green, dragging an area on the trace window
allows users to zoom the trace.
When this icon is green, touching a point on the trace window allows
users to zoom out the trace.
Touching this icon shows the trace in full range.
When this icon is green, touching the trace window allows users to
drag the trace.
Touching this icon displays the buttons moving a cursor and AA, BB,
UtilityUtility buttons under the trace window.
LSA1LSA1 to LSA4LSA4 buttons appear when selecting Splice LossSplice Loss, 2-pt LSA2-pt LSA,
or dB/km LSAdB/km LSA.
To select a cursor, touch a button of the cursor or touch Cursor A or
Cursor B on the screen.
To move a cursor:
Touch or .
Touch a point on the trace which is the destination of the
cursor.
Touching this icon displays the event table.
The following items appear under the trace window.
Cursor
A: Distance of Cursor A
B: Distance of Cursor B
A-B: Distance between Cursor A and Cursor B
Loss Mode
Selects a loss mode by touching the field.
When the loss mode is set to ORLORL, CalcCalc button appears.
For details of loss mode, refer to Loss Modes section.
Measurement Setup
WL: Wavelength, SM (Single mode fiber) or MM (Multi mode fiber)
DR: Distance range
PW: Pulse width
IOR: Index of reflection
RES: Resolution
AVG: Average times
UtilityUtility
Provides the cursor behavior setting and functions using a cursor.
Default LSADefault LSA: Moves LSA cursors to default positions. Enabled when LSA
cursors are displayed.
CursorsCursors:
Selecting LockedLocked will lock the distance between cursor A and cursor B.
Selecting UnlockedUnlocked allows setting distance of cursor A and cursor B
separately.
Adjust IOR by Cursor AAdjust IOR by Cursor A: Adjusts IOR by setting the actual distance of cursor A.
1. Move cursor A to the event which the distance is known.
2. Touch UtilityUtility.
Optical Fiber Testing ApplicationsOptical Fiber Testing Applications
140140

3. Touch the Adjust IOR by Cursor AAdjust IOR by Cursor A field.
4. Set the actual distance of cursor A by using a keypad.
5. Touch OKOK, then IOR will be adjusted so that actual distance of cursor A
is displayed.
Soft keysSoft keys
Open SummaryOpen Summary
Touching this button opens the SummarySummary dialog box.
PreviewPreview
This button is available when averaging measurement is running.
OffOff: After the averaging measurement has finished, saves the trace data to the
file. After the file saving has finished, traces on the window are erased. Then
next measurement starts automatically.
OnOn: After the averaging measurement has finished, touch or on the
application toolbar to start the next test.
OverlayOverlay
This key is available if overlay traces are loaded.
Swap OverlaySwap Overlay: Launches the dialog box selecting the trace to swap.
Show OverlayShow Overlay: Turns the overlay trace display on or off.
VFLVFL
Allows users to switch visible light output. When selecting OnOn or BlinkBlink, the redicon will blink at the bottom left of the screen.
VFL appears if Option 002 is installed.
55..33..44..44 Summary ViewSummary View
When Preview is set to ONON, the SummarySummary dialog box appears after a fibermeasurement of the project has finished.
The following items for each wavelength are displayed in the Summary dialogbox.
End / Fault Distance (km)End / Fault Distance (km): Distance of End event or Fault event.
Prior Event (km)Prior Event (km): Distance to the prior event of End event.
If End event is not found, **.*** is displayed.
Total Loss (dB)Total Loss (dB): Total loss of the fiber under measurement.
ORL (dB)ORL (dB): Optical return loss of the fiber under measurement.
ConstructionConstruction
141141

55..33..44..55 Power MeterPower Meter
To measure the optical power, touch the tab at right-top to expand ApplicationToolbar.
1. Select the check box.
2. Select a wavelength.
3. When inputting the light to the OPM connector, the measured power value
appears.
Zero OffsetZero Offset
Zero offset performs the 0-level calibration of the power meter. Performing zerooffset will reduce measurement errors when the input power level is low.
1. Disconnect the fiber (if connected) and close the OPM port cover.
2. Touch Set ZeroSet Zero.
3. The confirmation message appears. Touch OKOK.
The message disappears when the zero offset process is completed
Optical Fiber Testing ApplicationsOptical Fiber Testing Applications
142142

55..44 OLTSOLTS
Optical Loss Test Set (OLTS) applications allows users to measure an optical fiber
loss. The optical power and the optical loss are displayed as the test results.
To measure an optical loss:To measure an optical loss:
1. Connect the light source (OTDR/OLS) and OPM via adaptor. Confirm that fiber
type and the core diameter are appropriate.
2. Measure the optical power of the light source.
3. Set measured value to ReferenceReference.
4. Connect the light source (OTDR/OLS) and DUT (device under the test).
5. Connect DUT and OPM. The optical power passed through DUT is measured.
Loss is displayed as the differential between the reference and the measured
power.
OLTSOLTS
143143

To measure an optical loss by using two Network Masters:To measure an optical loss by using two Network Masters:
When a reference of the power meter cannot be measured directly, touch theReference field and input a power value.
In the transmitter side Network Master, setting the Output Mode of Light Sourceto Wave CodeWave Code sends the wavelength and its power meter reference modulatingoutput light. The receiver side Network Master sets the detected wavelengthand the reference value to itself automatically and displays the loss.
1. Set Output Mode in Light Source of Network Master 1 to CWCW.
2. Measure reference values of Network Master 1 for all wavelengths. Refer to
step 1 to 3 in "To measure an optical loss" for details.
3. Connect Network Master 1 Light Source (OTDR/OLS) and Network Master 2
OPM to both ends of DUT.
4. Set Network Master 1 Light Source as the following:
Wavelength: All (SM)All (SM)
Output Mode: Wave CodeWave Code
5. Set Network Master 1 Light Source to OnOn.
6. Network Master 2 detects wavelengths and reference values received from
Network Master 1. Wavelength of the power meter is set automatically and a
loss is displayed.
Optical Fiber Testing ApplicationsOptical Fiber Testing Applications
144144

Light SourceLight Source
Power MeterPower Meter
55..44..11 Loss Test SetupLoss Test Setup
Touching Loss Test SetLoss Test Set in navigation area displays the following screen.
This screen allows you to control the light source and the power meter.
WavelengthWavelength
Select the wavelength of the light source. The output connector will beindicated by green frame. When Output Mode is set to Wave CodeWave Code, ALL (SM)ALL (SM) isdisplayed. For MU100021A, ALL (MM)ALL (MM) is also displayed.
ALL (SM)ALL (SM): Switches the wavelength of the light outputting to SMF port to each
value periodically.
ALL (MM)ALL (MM): Switches the wavelength of the light outputting to MMF port to each
value periodically.
Output ModeOutput Mode
Select CW (Continuous Wave), a modulation frequency, or Wave Code.
Selecting CWCW does not modulate the output light. Selecting Wave CodeWave Codemodulates the output light with the data of the light source wavelength and itsreference value of the power meter.
When the inputted light is being modulating by Wave Code, Wavelength andReference are set automatically.
OLTSOLTS
145145
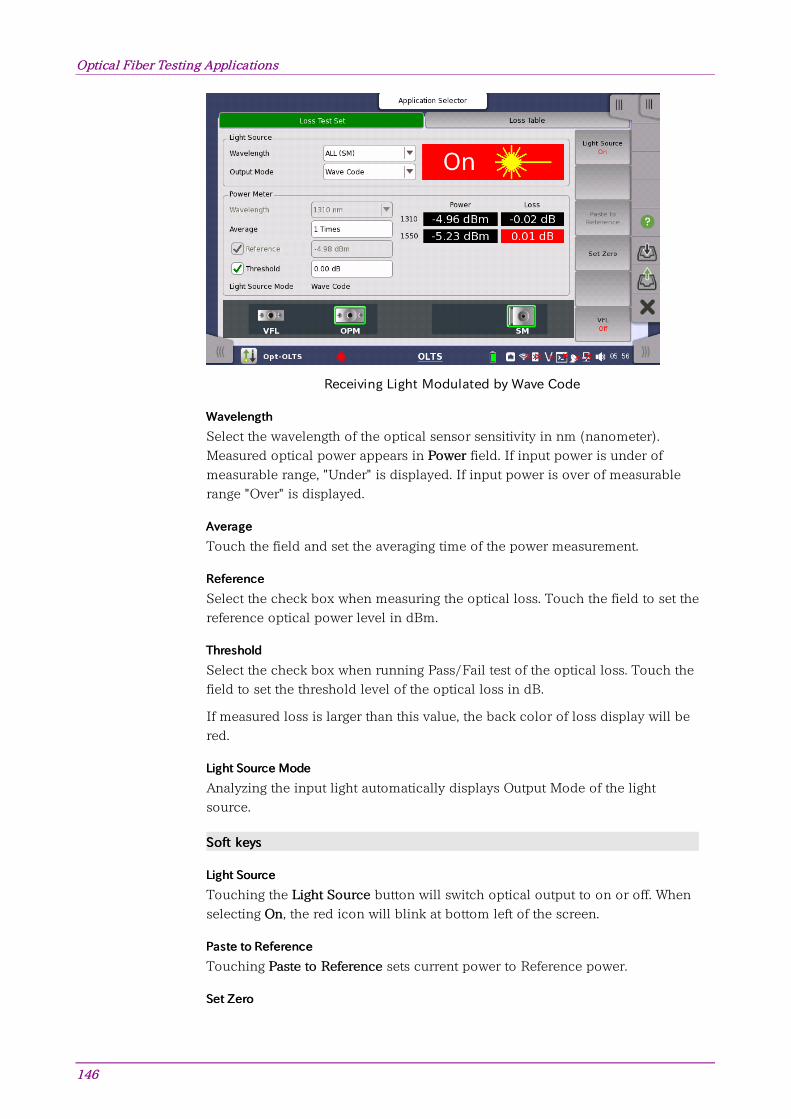
Receiving Light Modulated by Wave Code
WavelengthWavelength
Select the wavelength of the optical sensor sensitivity in nm (nanometer).Measured optical power appears in PowerPower field. If input power is under ofmeasurable range, "Under" is displayed. If input power is over of measurablerange "Over" is displayed.
AverageAverage
Touch the field and set the averaging time of the power measurement.
ReferenceReference
Select the check box when measuring the optical loss. Touch the field to set thereference optical power level in dBm.
ThresholdThreshold
Select the check box when running Pass/Fail test of the optical loss. Touch thefield to set the threshold level of the optical loss in dB.
If measured loss is larger than this value, the back color of loss display will bered.
Light Source ModeLight Source Mode
Analyzing the input light automatically displays Output Mode of the lightsource.
Soft keysSoft keys
Light SourceLight Source
Touching the Light SourceLight Source button will switch optical output to on or off. Whenselecting OnOn, the red icon will blink at bottom left of the screen.
Paste to ReferencePaste to Reference
Touching Paste to ReferencePaste to Reference sets current power to Reference power.
Set ZeroSet Zero
Optical Fiber Testing ApplicationsOptical Fiber Testing Applications
146146

Touching the Set ZeroSet Zero button will calibrate the zero level of the optical powermeter. Be sure to set the cap to the optical connector before running Set Zero.
VFLVFL
Allows users to switch visible light output. When selecting OnOn or BlinkBlink, the redicon will blink at bottom left of the screen.
VFL appears if Option 002 is installed.
55..44..22 Loss TableLoss Table
Touching the Loss TableLoss Table in the navigation area displays the following screen.
When Light Source Mode of the power meter isWave CodeWave Code, the power and theloss are displayed.
Display Example of MU100020A
Loss Table is the list of optical loss measurement results. This screen allowsusers to confirm and edit the Loss Table.
OLTSOLTS
147147

To save results to a file, touch on the Application toolbar.
No The number of the measured loss
WL Wavelength of measured loss
Loss Measured loss value
Power Measured optical power value
Pass/Fail
Pass or Fail appears if ThresholdThreshold is selected on "Loss
Test Set" screen.
When Loss value is equal or less than threshold,
"Pass" is displayed.
Comment Comments entered by using the soft key appear.
Soft keysSoft keys
AddAdd
Adds the measured optical loss to the table.
OverwriteOverwrite
Overwrites the measured optical loss to the selected number.
DeleteDelete
Deletes the added last item in the table.
Delete AllDelete All
Deletes all items in the table.
CommentComment
Launches the dialog box to edit the comment.
VFLVFL
Allows users to switch visible light output. When selecting OnOn or BlinkBlink, the redicon will blink at bottom left of the screen.
VFL appears if Option 002 is installed.
Optical Fiber Testing ApplicationsOptical Fiber Testing Applications
148148

66 Utility ApplicationsUtility ApplicationsThis chapter describes the applications on Utilities screen of ApplicationSelector.
The following applications are available:
Scenario
GPS
PDF Viewer
VIP
Wireshark
149149

66..11 ScenarioScenario
Scenario application executes applications according to the description in thescenario file. The contents of the scenario file can be edited by using theMX100003A MT1000A/MT1100A Scenario Editor Software on the PC.
MX100003A MT1000A/MT1100A Scenario Editor Software supports editing StandardOTDR application only.
If the scenario files are not loaded, only Scenario manager icon appears on theUtilities screen.
If the scenario file has loaded, that icon is displayed on the Utilities screen. Theicon of the scenario varies depending on the definition in the scenario.
An example of the scenario iconsAn example of the scenario icons
Displaying / hiding of the icon can be switched by the Scenario managerscreen setting.
66..11..11 Scenario ManagerScenario Manager
When you go to the test setup of the Scenario Manager, the following screen is
displayed.
This screen provides following operations:
Loading a scenario file
Switching displaying the icon of the scenario or not
Saving the scenario to file
Deleting the scenario in the table
Loading a scenario fileLoading a scenario file
1. Touch the on Application Toolbar.
2. Select the file using the dialog box.
Utility ApplicationsUtility Applications
150150
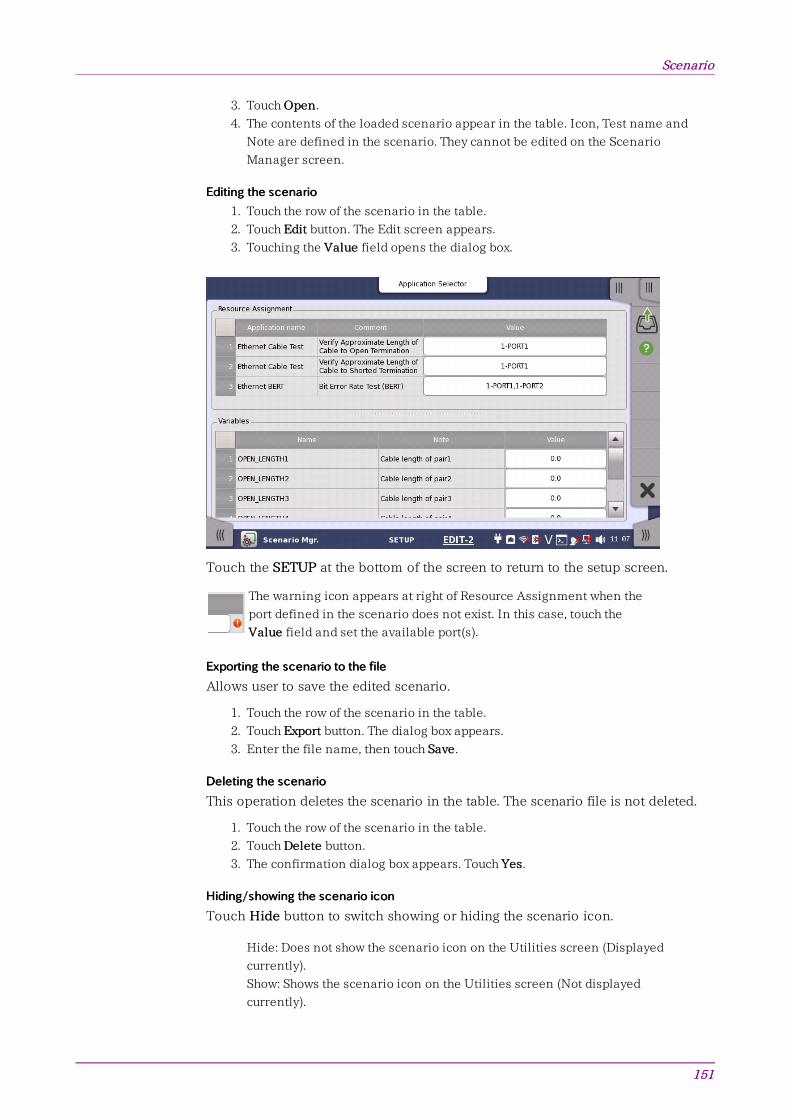
3. Touch OpenOpen.
4. The contents of the loaded scenario appear in the table. Icon, Test name and
Note are defined in the scenario. They cannot be edited on the Scenario
Manager screen.
Editing the scenarioEditing the scenario
1. Touch the row of the scenario in the table.
2. Touch EditEdit button. The Edit screen appears.
3. Touching the ValueValue field opens the dialog box.
Touch the SETUPSETUP at the bottom of the screen to return to the setup screen.
The warning icon appears at right of Resource Assignment when the
port defined in the scenario does not exist. In this case, touch the
ValueValue field and set the available port(s).
Exporting the scenario to the fileExporting the scenario to the file
Allows user to save the edited scenario.
1. Touch the row of the scenario in the table.
2. Touch ExportExport button. The dialog box appears.
3. Enter the file name, then touch SaveSave.
Deleting the scenarioDeleting the scenario
This operation deletes the scenario in the table. The scenario file is not deleted.
1. Touch the row of the scenario in the table.
2. Touch DeleteDelete button.
3. The confirmation dialog box appears. Touch YesYes.
Hiding/showing the scenario iconHiding/showing the scenario icon
Touch HideHide button to switch showing or hiding the scenario icon.
Hide: Does not show the scenario icon on the Utilities screen (Displayed
currently).
Show: Shows the scenario icon on the Utilities screen (Not displayed
currently).
ScenarioScenario
151151

66..11..22 Running the ScenarioRunning the Scenario
When scenario is loaded, the icon appears in Scenario of Utilities screen. Iftouching the icon, the following screen is displayed.
This screen displays the Pass/Fail results and status of the scenario execution.
To run the scenario, touch in the Application Toolbar.
Results folderResults folder
The destination folder to save the result file is displayed. Touch the field toopen the dialog box and select the folder. If selecting AutoAuto, the folder name willbe generated automatically.
The button to specify the destination drive appears when touching an icon onUtilities screen after USB memory stick was connected to the Network Master.
Even if Result Folder :UsbResult Folder :Usb has been set, result files are stored in Internalmemory temporary and moved to USB memory stick after the scenarioexecution has finished. In cases below, the warning message appears when Network Master has tried tosave result files to USB memory stick. If Network Master failed to save resultfiles to USB memory stick, they are stored in Internal memory.
USB memory stick was removed.
The free space of the USB memory stick is shortage.
Application and the result displayApplication and the result display
In the upper table, Application name, Port number for test use, and commentwhich are written in the scenario are displayed. If the scenario has executed,the test result and the result file name appear in the each column.
Status indication during Scenario executionStatus indication during Scenario execution
In the lower table, the status of the application and the time that has occurredare displayed.
Save resultsSave results
Utility ApplicationsUtility Applications
152152

1. Touch the on Application Toolbar
2. Set the file name using the dialog box displayed.
3. Touch SaveSave button.
Generating the reportGenerating the report
1. Touch the on Application Toolbar
2. Setup Report Generator using the dialog box. For details, refer to "Report" in
Application Toolbar.
3. Touch GenerateGenerate button.
ScenarioScenario
153153

Test TimeTest Time
66..22 GPSGPS
GPS application logs NMEA format data received from the GPS receiver. According to
the NMEA format data, the locations of satellite are displayed on the chart.
66..22..11 Test SetupTest Setup
When you go to the test setup of the GPS application, the following screen isdisplayed.
Select the how to stop the test.
Log until buffer is fullLog until buffer is full: The test stops when the buffer memory is full with the
log data. It takes around 13 hours to fill the buffer.
Timed (or until buffer is full)Timed (or until buffer is full): The test stops when the specified time has
elapsed. The test stops if the buffer memory has become full of data even
before the specified time has elapsed.
Days, Hours, MinutesDays, Hours, Minutes
Touch the field to set the test time.
66..22..22 Test ResultsTest Results
When you go to the test result of the GPS application, the following screen isdisplayed.
Utility ApplicationsUtility Applications
154154

Sky ViewSky View
SatellitesSatellites
This screen displays positions of satellite and the logged data. Touch a left topbutton to switch the result to display.
SatellitesSatellites: Displays the satellite positions by the chart and the table.
ConsoleConsole: Displays the logged data received from GPS receiver.
Touch to start a test.
Current GMT TimeCurrent GMT Time
The time received from GPS appears.
StatusStatus
Active: Data have been receiving from GPS receiver.
Stopped: Data reception from GPS receiver has stopped.
Time LeftTime Left
When TimedTimed is selected on the Test setup screen, the remaining test time isdisplayed.
SatellitesSatellites
Radius of the circle
corresponds to the
elevation. The
position at circle edge
is where the elevation
is 0 degree.
Clockwise angle
corresponds to the
azimuth. Top of the
circle corresponds to
north.
Data of the received satellites are displayed.
PRN: Displays the satellite number. (Pseudo-Random Noise sequences)
GPSGPS
155155

Text ConsoleText Console
Elev: Elevation
Azim: Azimuth
SNR: Signal to Noise Ratio
Depending on the SNR value, the text color varies in green, blue, or red.
ConsoleConsole
The logged data in text data are displayed. You can save the logged data by
touching icon on the Application Toolbar.
The log data format follows NMEA 0183 rev4.0 that is widely used in the GPStechnology.
Utility ApplicationsUtility Applications
156156

66..33 PDF ViewerPDF Viewer
PDF Viewer allows viewing of PDF files such as report files created by Network
Master, Operation Manual, etc.
Opening the PDF fileOpening the PDF file
Touching File Open icon ( ) on Application Toolbar launches the dialog box.
Select the PDF file using the dialog box.
Scrolling the windowScrolling the window
The page number is displayed at bottom center of the screen. Touching < or >side of the page number allows to move the page. Right hand scroll bar allows to scroll the view vertically.
Following functions are not supported.Zoom in and outLinkSearchBookmarks
PDF ViewerPDF Viewer
157157

66..44 VIPVIP
VIP (Video Inspection Probe) applications allows users to view the edge surface of an
optical fiber by using Video Inspection Probe accessory. The captured image and
analysis results can be saved to files.
66..44..11 Application ToolbarApplication Toolbar
Icons for VIP use appear on Application Toolbar.
CaptureCapture
Touch the CaptureCapture icon to capture the current displaying image. When Auto FocusAuto Focus is
selected in Setup screen, touching this icon performs autofocus and capturing the
image.
Press for Live imagePress for Live image
Touch the Press for Live imagePress for Live image icon to display the live image on the screen.
Analyze ImageAnalyze Image
Touch the Analyze ImageAnalyze Image icon to start analyzing the captured image.
SaveSave
Touch the SaveSave icon to save the image and analysis results to files.
LoadLoad
Touch the LoadLoad icon to load a following file.
Image file (*.png)
Analysis result file (*.vipi)
Only Load SaveLoad Save icon appears on the Expanded Application toolbar. The VIP images and analysis results can be loaded by touching the icon.
The analysis result file (extension vipi) is compatible to following models.MT9083 Series Access MasterMU909014x, MU909015x μOTDR Module
Utility ApplicationsUtility Applications
158158

Probe SetupProbe Setup
66..44..22 Connecting the probeConnecting the probe
Connect the USB connector of the Video Inspection Probe to Network Master.
G0382A Autofocus Video Inspection ProbeG0382A Autofocus Video Inspection Probe
Replace the adaptor of the Video Inspection Probe with one that matches theoptical connector. For handling the Video Inspection Probe, refer to the operation manual thatcame with the Video Inspection Probe.
Network Master also supports following the Video Inspection Probes.
OPTION-545VIP USB 200/400x Video Inspect Probe
G0293A Video Inspection Probe Lite
G0306A Video Inspection Probe
G0306B Video Inspection Probe
At the lower left area of the screen, this icon indicates the connection status of
the probe.
66..44..33 Test SetupTest Setup
When you go to the test setup of the VIP application, the following screen isdisplayed.
This screen allows you to configure the parameters related to a VIP test.
Probe ModelProbe Model
When G0306A, G0306B, or G0382A is connected to Network Master, themodel is displayed. Otherwise, select the model of the Video Inspection Probe.
VIPVIP
159159

Tip TypeTip Type
Select the tip type to use.
Test ProfileTest Profile
Select the observing fiber type. Limits which will be judged as "Pass" are shownin tables.
In the following tables, "None" means that scratches or defects should be none."No limit" means that there is no limit to the number of scratches or defects.For example, "None >3 μm" means that scratches or defects larger than 3 μmshould be none.
SM PC>45SM PC>45: Single Mode Fiber, Physical Contact, Return Loss is more than 45
dB.
Zone NameZone Name DefectsDefects ScratchesScratches
Core None None
Cladding
No limit <2μm
5 from 2 μm to 5 μm
None >5 μm
No limit ≤3μm
None > 3μm
Adhesive No limit No limit
Contact None ≥10 μm No limit
SM APCSM APC: Single Mode Fiber, Angled Physical ContactZone NameZone Name DefectsDefects ScratchesScratches
Core None ≤4
Cladding
No limit <2 μm
5 from 2 μm to 5 μm
None >5 μm
No limit
Adhesive No limit No limit
Contact None ≥10 μm No limit
SM PC>25SM PC>25: Single Mode Fiber, Physical Contact, Return Loss is more than 25
dB.Zone NameZone Name DefectsDefects ScratchesScratches
Core2 ≤3 μm
None > 3 μm
2 ≤3 μm
None > 3 μm
Cladding
No limit ≤2μm
5 from 2 μm to 5 μm
None >5 μm
No limit ≤3μm
3 > 3μm
Adhesive No limit No limit
Contact None ≥10 μm No limit
MM PC 62.5MM PC 62.5: Multi-Mode Fiber, Physical Contact, Core diameter 62.5 μmZone NameZone Name DefectsDefects ScratchesScratches
Core4 ≤5 μm
None >5 μm
No limit ≤3μm
0 > 5μm
Cladding
No limit ≤2μm
5 from ≤2 μm to ≤5 μm
None >5 μm
No limit ≤5μm
0 > 5μm
Adhesive No limit No limit
Contact None ≥10 μm No limit
MM PC 50.0MM PC 50.0: Multi-Mode Fiber, Physical Contact, Core diameter 50 μm
Limits are the same as MM PC 62.5MM PC 62.5.
Utility ApplicationsUtility Applications
160160

Auto FunctionsAuto Functions
Auto File NameAuto File NameSettingsSettings
Auto MeasurementAuto Measurement
When the fiber edge surface is recognized in the image, Auto Focus, AutoCapture, Auto Analyze On Capture, and saving a file will be done automatically.
Auto MeasurementAuto Measurement is available for G0306A, G0306B, and G0382A.
Auto FocusAuto Focus
When it is recognized that the fiber edge surface is in the image, performsautofocus and capture.
If it cannot be recognized that the fiber
edge surface is in the image, VIP may
not perform autofocus. In that case, get a
focus using << or >> button on G0382A.
Auto FocusAuto Focus is available for G0382A.
Auto CaptureAuto Capture
When it is recognized that the fiber edge surface is in focus, the image iscaptured automatically.
Auto CaptureAuto Capture is available for G0306A, G0306B, and G0382A.
Auto Analyze On CaptureAuto Analyze On Capture
Executes Auto Analyze when the image has been captured.
Auto File Name GenerationAuto File Name Generation
File name is generated automatically when saving the file. Selecting the checkbox activates Auto File Name SettingsAuto File Name Settings.
Auto Exposure SettingAuto Exposure Setting
The value can be set when Auto MeasurementAuto Measurement is selected. Set target value ofauto exposure in the range of 160 to 190.
File LocationFile Location
Touch the BrowseBrowse button to select a folder to save files.
File PrefixFile Prefix
Touch the field and set the string used in the file name. Touching Quick MatrixQuick Matrixat bottom of File Prefix EditFile Prefix Edit dialog box opens Input TextInput Text dialog box to registerstring.
VIPVIP
161161

To register string, touch a blank button. Touching labeled button adds thestring to file name.
Import/ExportImport/Export: Saves string on buttons to a file or loads string from a file.
ResetReset: Erases string on all buttons.
CancelCancel: Discards edited string and closes dialog box.
OKOK: Applies edited string and closes dialog box.
Start NumberStart Number
Touch the field and set the start number of value used in the file name.
Include DateInclude Date
If selecting the check box, date will be appended in the file name.
Include NumberInclude Number
If selecting the check box, a file number will be appended in the file name.
The file name to be generated first is displayed under this item.
66..44..44 Test ResultsTest Results
When you go to the test results of the VIP application, the following screen isdisplayed.
Utility ApplicationsUtility Applications
162162

Analyzing an imageAnalyzing an image
This screen displays the image taken by the fiber scope. Analyzing an image ofthe fiber edge surface is also available.
When Auto CaptureAuto Capture is not selected, follow the procedure below:
1. Touch .
2. Touch .
After the analysis finishes normally, the results appear in the table.
If Overlays OnOverlays On is selected, the circles showing the analysis area appear.
3. Adjust image position by touching ZoomZoom buttons or PANPAN buttons.
When using G0382A, pressing M
button on VIP starts image
capture and analysis.
The items in tables are:
[Zone]: Name of the analysis area
[Dia. (μm)]: Measurement result of the diameter
[Defects]: Judgement result of defects
[Defect Count]: Number of measured defects
[Area (μm2)]: Total area of the detected defects
[Scratch]: Judgement result of scratches
[Scratch Count]: Number of measured scratches
Overlays OnOverlays On
If selecting the check box, the circles showing the analysis area appear.
Auto ExposureAuto Exposure
This button appears when Probe Model is G0382AG0382A. Touching the button maintains the image brightness at appropriate level byadjusting exposure.
VIPVIP
163163

66..55 WiresharkWireshark
Wireshark allows users to analyze captured Ethernet frames.
This application is provided for Ethernet application of Transport modules.
When Wireshark is started, the following screen appears.
For OTDR modules, there are no applications to analyze using Wireshark.
Utility ApplicationsUtility Applications
164164

77 Performance Test andPerformance Test andCalibrationCalibration
This chapter describes how to check the performance of the OTDR module andcalibrate measurement values. Contact Anritsu or our sales dealer when theperformance test proves that the specifications are not satisfied.
165165

77..11 Performance TestPerformance Test
Clean the optical connector before testing.
Rated values for Each Test ItemRated values for Each Test Item
Unless otherwise specified, the following rated values are guaranteed at atemperature of 25°C ±5°C.
77..11..11 Required instruments for performance testRequired instruments for performance test
The following table shows the instruments and their performance required forthe performance tests.
Only MU100021A requires: Multi mode fiber Multi mode Optical Coupler Multi mode Variable Optical Attenuator Optical-to-Electrical Converter for 850 nm
Required Instruments for Performance TestRequired Instruments for Performance Test
ItemItem PerformancePerformanceName of Name of
Recommended Recommended DeviceDevice
Optical Spectrum
Analyzer
Wavelength: 600 to 1650 nm
Level: -65 to +20 dBm
Wavelength accuracy: ±0.3 nm
Supported Single mode / Multi mode
Fiber
MS9740A
(Anritsu)
Single mode
Variable Optical
Attenuator
Wavelength: 1200 to 1650 nm
Insertion loss: 3 dB or less
Attenuation: 0 to 30 dB
Resolution: 0.001 dB or less
8163B+81570A
(Keysight
Technologies)
Multi mode
Variable Optical
Attenuator
Wavelength: 800 to 1350 nm
Insertion loss: 3 dB or less
Attenuation: 0 to 30 dB
Resolution: 0.001 dB or less
8163B+81578A
(Keysight
Technologies)
Optical-to-Electrical
Converter
Wavelength: 1100 to 1650 nm
Rising/Falling: 500 ps or less
Compatible fiber:
Single mode fiber and
62.5 μm Multi mode fiber
P6703B
(Tektronix)
Optical-to-Electrical
Converter
Wavelength: 800 to 900 nm
Rising/Falling: 500 ps or less
Compatible fiber: 62.5 μm Multi mode
fiber
P6701B
(Tektronix)
Oscilloscope Bandwidth: DC to 1 GHzTDS5104B
(Tektronix)
Single mode
fiber
Fiber length:
2 km one, 40 to 50 km one,
500 to 800 m one, 2 to 3 m two
Performance Test and CalibrationPerformance Test and Calibration
166166

Required Instruments for Performance Test (Cont'd)Required Instruments for Performance Test (Cont'd)
ItemItem PerformancePerformanceName of Name of
Recommended Recommended DeviceDevice
Single mode
Optical Coupler
(1:1)
Structure: 1×2
Splitting ratio: 50%:50%
Excess loss: 1 dB or less
Single mode
Optical Coupler
(10:1)
Structure: 1×2
Splitting ratio: 10%:90%
Excess loss: 1 dB or less
Multi mode
fiber
Fiber length:
2 km 1one, 20 to 25 km one,
500 to 800 m one, 2 to 3 m two
Multi mode
Optical Coupler
(1:1)
Structure: 1×2
Splitting ratio: 50%:50%
Excess loss: 1 dB or less
Multi mode
Optical Coupler
(10:1)
Structure: 1×2
Splitting ratio: 10%:90%
Excess loss: 1 dB or less
Optical Power
Meter
Wavelength: 800 to 1650 nm
Level: -50 to +10 dBm
Accuracy: ±2.5%
8163B+81623A
(Keysight
Technologies)
Optical Power
Meter
(Wavelength: 650
nm)
Wavelength: 650 nm
Level: -65 to +10 dBm
Accuracy: ±0.3 dB
OPM37LAN
(Sanwa Electric
Instrument Co.,
Ltd.)
Light Source
Wavelength: 1310±5 nm
Level: +10 dBm or more
Level stability: ±0.1 dB
Compatible fiber: Single mode
81635A #131
(Keysight
Technologies)
Wavelength: 1550±5 nm
Level: +10 dBm or more
Level stability: ±0.1 dB
81635A #155
(Keysight
Technologies)
Wavelength: 850±5 nm
Level: +10 dBm or more
Level stability: ±0.1 dB
Performance TestPerformance Test
167167

77..11..22 WavelengthWavelength
Connection diagramConnection diagram
Test Procedure:Test Procedure:
1. Connect Network Master and the optical spectrum analyzer.
2. Set the optical spectrum analyzer as follows:
Span: 50 nm
Res: 0.05 nm
VBW: 1 kHz
Sampling Point: 2001
Analysis: RMS K=1, S.Level: 20 dB
3. Start Standard OTDR application.
4. For MU100021A, set the port in Port screen of SETUP.
5. Set Wavelength in Measurement screen.
6. Set Test mode to ManualManual in Measurement screen and set parameters as
follows:
WavelengthWavelength 1310/1550 nm1310/1550 nm 850/1300 nm850/1300 nmDistance
Range25km 2.5km
Resolution Coarse
Pulse Width 1us 100ns
7. Set the wavelength of the Network Master at Center of the spectrum analyzer.
8. Touch .
9. Measure the optical pulse spectrum of the Network Master with the spectrum
analyzer.
If the waveform level measured by the spectrum analyzer is saturated, adjust
the attenuation of the variable optical attenuator.
Performance Test and CalibrationPerformance Test and Calibration
168168

10. Record the center wavelength measured by the spectrum analyzer.
11. Change Wavelength in the Measurement screen of SETUP and repeat steps 6
to 10 over.
77..11..33 Pulse WidthPulse Width
Connection diagramConnection diagram
Test Procedure:Test Procedure:
1. Connect Network Master and the measuring instruments as shown in
Connection diagram.
2. Start Standard OTDR application.
3. For MU100021A, set the port in Port screen of SETUP.
4. Set Wavelength in Measurement screen.
5. Set Test mode to ManualManual in Measurement screen and set parameters as
follows:
Distance Range: 0.5km
Pulse Width: 3ns
6. Touch .
7. Adjust the oscilloscope trigger level, amplitude and time base scale to display
the waveform in the oscilloscope.
Adjust the optical variable attenuator to prevent the waveform monitor from
becoming saturated.
8. Monitor the waveform with the oscilloscope and measure the pulse width at
half the amplitude of the peak level as shown in the figure and record the
results.
Performance TestPerformance Test
169169

Width of the waveform to be measured
9. Change Pulse WidthPulse Width as described in Step 5 and repeat steps 6 to 8 over.
10. Change Wavelength in the Measurement screen of SETUP and repeat steps 5
to 9 over.
77..11..44 Dynamic RangeDynamic Range
Connection diagramConnection diagram
When testing the dynamic range of 850 nm and 1300 nm, change the opticalfiber in Connection diagram to the multi-mode fiber (20 to 25 km).
Test Procedure:Test Procedure:
1. Connect the optical fiber to Network Master as shown in Connection diagram.
2. Start Standard OTDR application.
3. For MU100021A, set the port in Port screen of SETUP.
4. Set Wavelength in Measurement screen.
5. Set Test mode to ManualManual in Measurement screen and clear Same SettingsSame Settings
check box. Set parameters as follows:
WavelengthWavelength 1310/15501310/1550nmnm 850 nm850 nm 1300 nm1300 nm
Distance
Range100km 25km 25km
Resolution Coarse
Pulse Width 20us 500ns 4us
Average Time 3min
6. Set Loss Mode to 2-pt Loss2-pt Loss in Trace screen of RESULT.
7. Touch .
Performance Test and CalibrationPerformance Test and Calibration
170170

8. When measurement is completed, move cursor A to the position of the optical
output connector .
9. Move cursor B to the peak noise position and record the 2-pt Loss.
10. Add 2.6 dB to the value recorded at step 9. Record the measured result.
11. Change PortPort in Port screen and WavelengthWavelength in Measurement screen. Repeat
steps 7 to 10 over.
Measurement point on the trace
77..11..55 Distance Measurement AccuracyDistance Measurement Accuracy
Measure the optical fiber whose length and refraction index are known, thenperform a horizontal axis (i.e., measurement distance) accuracy test. This is notrequired for other ranges when this test is performed at a certain distancerange.
Connection diagramConnection diagram
When testing the distance measurement accuracy of 850 nm and 1300 nm,change the optical fiber in Connection diagram to the multi-mode fiber (2 km).
Test Procedure:Test Procedure:
1. Connect the optical fiber to Network Master as shown in Connection diagram.
2. Start Standard OTDR application.
3. For MU100021A, set the port to Single ModeSingle Mode in Port screen of SETUP.
4. Set Wavelength to 1310nm1310nm in Measurement screen.
Performance TestPerformance Test
171171

5. Set Test mode to ManualManual in Measurement screen and set parameters as
follows:
Distance Range: 2.5km
Resolution: Medium
Pulse Width: 10ns
Average Time: 3min
6. Set the optical fiber's index of refraction to IOR in IOR/BSC screen.
7. Set Loss Mode to 2-pt Loss2-pt Loss in Trace screen of RESULT.
8. Touch .
9. When the measurement is completed, touch in Trace screen.
10. Move the cursor A to the 0 km position.
11. Move the cursor to the location of Fresnel reflection.
12. Touch and set the horizontal-axis scale to 0.005 km/div.
13. Touch and align cursor B precisely with the rise point of the Fresnel
reflection.
Record the measured result.
14. Change Wavelength in the Measurement screen of SETUP and repeat steps 6
to 13 over.
Measurement point on the trace
Performance Test and CalibrationPerformance Test and Calibration
172172

77..11..66 LinearityLinearity
Connection diagramConnection diagram
When testing the linearity of 850 nm, change the optical fiber in Connectiondiagram to the multi-mode fiber (20 to 25 km).
Test Procedure Single mode port:Test Procedure Single mode port:
1. Connect the single mode optical fiber to Network Master.
2. Start Standard OTDR application.
3. For MU100021A, set the port to Single ModeSingle Mode in Port screen of SETUP.
4. Set Wavelength to 1310nm1310nm in Measurement screen.
5. Set Test mode to ManualManual in Measurement screen and set parameters as
follows:
Distance Range: 100km
Resolution: Coarse
Pulse Width: 2us
Average Time: 3min
6. Set Loss Mode to 2-pt LSA2-pt LSA in Trace screen of RESULT.
7. Touch .
8. When the measurement is completed, touch in Trace screen.
9. Move cursor A to the 0 km position.
10. Move cursor B to the 3 km position.
11. Touch UtilityUtility and set Cursors to LockedLocked.
12. Move cursor LSA1 to the 0.05 km position.
13. Move cursor LSA2 to the 0.3 km position.
14. Move cursor LSA3 to the 2.7 km position.
15. Move cursor LSA4 to the 3.3 km position.
16. Record the loss value.
17. Move cursor A to the 1.5 km position. Cursor B moves to the 4.5 km position.
18. Move cursor LSA1 to the 1.2 km position.
19. Record the loss value.
20. Move cursor A in 1.5-km increments until cursor A reaches the 28.5 km
position and record the measured value.
Performance TestPerformance Test
173173

21. Calculate the average of the values recorded from steps 16 to 20.
22. Calculate the difference between the average value in step 21 and the values
recorded in steps 16 and multiply this value by 3.
Test Procedure of Multi mode port:Test Procedure of Multi mode port:
1. Connect the multi mode optical fiber to Network Master.
2. Start Standard OTDR application.
3. For MU100021A, set the port to Multi ModeMulti Mode in Port screen of SETUP.
4. Set Wavelength to 850nm850nm in Measurement screen.
5. Set Test mode to ManualManual in Measurement screen and set parameters as
follows:
Distance Range: 10km
Resolution: Coarse
Pulse Width: 100ns
Average Time: 3min
6. Set Loss Mode to 2-pt LSA2-pt LSA in Trace screen of RESULT.
7. Touch .
8. When the measurement is completed, touch in Trace screen.
9. Move cursor A to the 0 km position.
10. Move cursor B to the 0.6 km position.
11. Touch UtilityUtility and set Cursors to LockedLocked.
12. Move cursor LSA1 to the 0.05 km position.
13. Move cursor LSA2 to the 0.15 km position.
14. Move cursor LSA3 to the 0.5 km position.
15. Move cursor LSA4 to the 0.7 km position.
16. Record the loss value.
17. Move cursor A to the 0.3 km position. Cursor B moves to the 0.9 km position.
18. Move cursor LSA1 to the 0.2 km position.
19. Move cursor LSA2 to the 0.4 km position.
20. Record the loss value.
21. Move cursor A in 0.3-km increments until cursor A reaches the 5.7 km position
and record the measured value.
22. Calculate the average of the values recorded from steps 17 to 21.
23. Calculate the difference between the average value in step 22 and the values
recorded in steps 16 and multiply this value by 3.
Performance Test and CalibrationPerformance Test and Calibration
174174

77..11..77 Dead ZoneDead Zone
Connection diagramConnection diagram
When testing the dead zone of 850 nm and 1300 nm, change the optical fiberand the optical coupler in Connection diagram to the multi-mode fiber. Use thevariable optical attenuator for multi mode fiber.
Test Procedure:Test Procedure:
1. Connect Network Master and the measuring instruments as shown in
Connection diagram.
2. Start Standard OTDR application.
3. For MU100021A, set the port to Single ModeSingle Mode in Port screen of SETUP.
4. Set Wavelength to 1310nm1310nm in Measurement screen.
5. Set Test mode to ManualManual in Measurement screen and set parameters as
follows:
Distance Range: 25km
Resolution: Medium
Pulse Width: 500ns
Average Time: 10s
6. Touch .
7. When the measurement is completed, touch in Trace screen.
8. Confirm the Fresnel reflection return loss at the 300 to 400 m point in the
event table.
9. Adjust the attenuation of the variable optical attenuator so the return loss
becomes 40 ±0.2 dB.
10. Repeat steps 6 to 9 until the return loss in the event table becomes 40 ±0.2 dB.
11. Set parameters in Measurement screen as follows:
Distance Range: 1km
Resolution: Medium
Pulse Width: 3ns
Average Time: 10s
12. Set Loss Mode to 2-pt Loss2-pt Loss in Trace screen of RESULT.
Performance TestPerformance Test
175175

13. Touch .
14. When the measurement is completed, touch in Trace screen.
15. Move cursor A to the position before the Fresnel reflection where the level is
1.5 dB lower than Fresnel reflection peak.
16. Move cursor B to the position after the Fresnel reflection where the level is 1.5
dB lower than the Fresnel reflection peak.
Cursor Position to Measure Fresnel Dead Zone
17. Record the difference in the position of cursor A and cursor B (Fresnel dead
zone).
18. Set parameters in Measurement screen as follows:
Distance Range: 25km
Resolution: Medium
Pulse Width: 500ns
Average Time: 10s
19. Touch .
20. When the measurement is completed, touch in Trace screen.
21. Confirm the Fresnel reflection return loss at the 300 to 400 m point in the
event table.
22. Adjust the attenuation of the variable optical attenuator so the return loss
becomes 55 ±0.2 dB.
23. Repeat steps 19 to 22 until the return loss in the event table becomes 55 ±0.2
dB.
24. Set parameters in Measurement screen as follows:
Distance Range: 1km
Resolution: Medium
Pulse Width: 3ns
Average Time: 10s
25. Touch .
26. When the measurement is completed, touch in Trace screen.
27. Move cursor B to a position 0.5 dB higher than the BSC level of the Fresnel
reflection.
28. Move cursor A to the rising position of the Fresnel reflection.
Performance Test and CalibrationPerformance Test and Calibration
176176

Cursor Position to Measure Backscatter coefficient Dead Zone
29. Record the difference in the position of cursor A and cursor B (backscatter
coefficient dead zone).
30. Change the wavelength in Measurement screen and repeat over from step 5 to
29.
When measuring the dead zone of 850 nm and 1300 nm, skip step 18 to 26.
Performance TestPerformance Test
177177

77..11..88 Optical Power Level and Wavelength of VFLOptical Power Level and Wavelength of VFL
Check that the output power level and wavelength of the optional Visual FaultLocator satisfy their respective specifications.
Connection diagramConnection diagram
Test Procedure:Test Procedure:
1. Connect the VFL port of Network Master to the optical spectrum analyzer.
2. Set the optical spectrum analyzer as follows:
Center: 650 nm
Span: 50 nm
Res: 0.05 nm
VBW: 1 kHz
Sampling Point: 2001
Analysis: Threshold, Cut.Level: 3 dB
3. Start OLTS application.
4. Touch VFLVFL soft key.
5. Touch OnOn.
6. Measure the center wavelength of the spectrum analyzer and record the result.
7. Set the optical power meter wavelength to 650 nm.
8. Connect the VFL port of Network Master to the optical power meter.
9. Measure the level with the optical power meter and record the result.
Performance Test and CalibrationPerformance Test and Calibration
178178

77..11..99 Optical Power Level and Wavelength of Light SourceOptical Power Level and Wavelength of Light Source
Confirm that the wavelength, spectrum width and optical output level of thelight source satisfy their respective specifications.
Connection diagramConnection diagram
Test Procedure:Test Procedure:
The test procedure is described below, taking the 1310-nm wavelength as anexample. For the test for other wavelengths, change the waveform setting forthe optical spectrum analyzer and optical power meter.
1. Start OLTS application.
2. Set the Light Source - Wavelength to 1310 nm1310 nm in Loss Test Set screen.
3. Connect the OLS port of Network Master to the optical spectrum analyzer.
4. Set the optical spectrum analyzer as follows:
Center: 1310 nm
Span: 50 nm
Res: 0.05 nm
VBW: 1 kHz
Sampling Point: 2001
Analysis: Threshold, Cut.Level: 3 dB
5. Set the Light Source - Modulation to CWCW.
6. Touch Light SourceLight Source soft key to change the display to OnOn.
7. Measure the center wavelength and spectrum width of the optical spectrum
analyzer and record the result.
8. Set the optical power meter wavelength to 1310 nm.
9. Connect the OLS port of Network Master to the optical power meter.
10. Measure the optical output level with the optical power meter and record the
result.
Performance TestPerformance Test
179179

77..11..1010 Optical Power Meter Measurement AccuracyOptical Power Meter Measurement Accuracy
Confirm that the measurement accuracy of the power meter satisfy thespecifications. Be sure to execute the zero offset of the optical power meterbefore measurement.
Connection diagramConnection diagram
Test Procedure:Test Procedure:
The test procedure is described below, taking the 1550-nm wavelength as anexample. For the test for other wavelengths, change the waveform setting forthe light source and optical power meter.
1. Connect the light source and variable optical attenuator using optical fiber as
shown in Connection diagram.
2. Use an optical fiber to connect the output of the variable optical attenuator to
the optical power meter.
3. Set the wavelength of the light source to 1550 nm and output the signal.
4. Set the wavelength of the optical power meter to 1550 nm.
5. Adjust the attenuation of the variable optical attenuator so that the optical
power meter displays -10 ±0.005 dBm.
Record the level display of the optical power meter.
6. Disconnect the fiber connected to the power meter and connect to the OPM
port of Network Master.
7. Start OLTS application.
8. Set the Power Meter - Wavelength to 1550 nm1550 nm in Loss Test Set screen.
9. Record the power display.
10. Calculate the difference between the display levels recorded at steps 6 and 10.
Performance Test and CalibrationPerformance Test and Calibration
180180

77..22 CalibrationCalibration
The parameters that can be calibrated are the Backscatter coefficient (BSC)level and the measurement accuracy of OPM (Optical Power Meter).
Annual calibration of OTDR module is recommended. However, performing the first calibration is recommended 3 years after factoryshipment .
77..22..11 Backscatter coefficient level calibrationBackscatter coefficient level calibration
Backscatter coefficient level calibrationBackscatter coefficient level calibration
ItemItem Rated valuesRated values QuantityQuantity
Single mode Optical Fiber 5 km or longer 2
Optical Connector With known return loss 1
Connection diagramConnection diagram
Calibration Procedure:Calibration Procedure:
1. Prepare an optical connector with a known return loss of R0 dB and connect it
with an optical fiber to the Network Master.
2. Start Standard OTDR application.
3. For MU100021A, set the port to Single ModeSingle Mode in Port screen of SETUP.
4. Set Wavelength to 1310nm1310nm in Measurement screen.
5. Set Test mode to ManualManual in Measurement screen and set parameters as
follows:
Distance Range: 10km
Resolution: Coarse
Pulse Width: 100ns
Average Time: 3min
6. Set Loss Mode to 2-pt LSA2-pt LSA in Trace screen of RESULT.
7. Touch .
8. When the measurement is completed, touch in Trace screen.
9. Touch EventEvent soft key ad touch AnalyzeAnalyze.
CalibrationCalibration
181181

10. Confirm that the connector event is displayed in the screen and record the
return loss. This value is assumed to be R1 dB.
11. Find the difference between this value and R0 dB as &DELTA;R = (R1-R0).
12. Set the sum of the currently set BSC value and &DELTA;R in IOR/BSC screen.
13. Repeat steps 7 to 12 over; calibration is completed when the displayed return
losses become the same as the value of R0.
77..22..22 Measurement accuracy calibration of optical power meterMeasurement accuracy calibration of optical power meter
To maintain the performance of this power meter, we recommend thatcalibration be performed once or twice a year.
Please contact Anritsu for calibration of the OPM measurement accuracy.
Performance Test and CalibrationPerformance Test and Calibration
182182

77..33 Performance Test Result SheetPerformance Test Result Sheet
Values in Measurement Accuracy column are assumed that RecommendedDevices in "Required Instruments for Performance Test" are used.
WavelengthWavelength
Wavelength Wavelength SettingsSettings
MinimumMinimumValueValue
MeasuredMeasuredValueValue
MaximumMaximumValueValue
MeasurementMeasurementAccuracyAccuracy Pass/FailPass/Fail
1310 nm 1285 nm nm 1335 nm ±1.83 nm Pass / Fail
1550 nm 1525 nm nm 1575 nm ±1.83 nm Pass / Fail
1625 nm 1600 nm nm 1650 nm ±1.83 nm Pass / Fail
850 nm 820 nm nm 880 nm ±1.86 nm Pass / Fail
1300 nm 1270 nm nm 1330 nm ±1.86 nm Pass / Fail
Pulse Width (Wavelength 1310 nm)Pulse Width (Wavelength 1310 nm)
Pulse widthPulse widthSettingsSettings
MinimumMinimumValue*Value*
MeasuredMeasuredValueValue
MaximumMaximumValue*Value*
MeasurementMeasurementAccuracyAccuracy Pass/FailPass/Fail
3 ns - ns - Pass / Fail
10 ns 7 ns ns 13 ns ±2.31% Pass / Fail
20 ns 14 ns ns 26 ns ±2.31% Pass / Fail
50 ns 35 ns ns 65 ns ±2.31% Pass / Fail
100 ns 85 ns ns 115 ns ±2.31% Pass / Fail
200 ns 170 ns ns 230 ns ±2.31% Pass / Fail
500 ns 465 ns ns 535 ns ±2.31% Pass / Fail
1 μs 0.93 μs μs 1.07 μs ±2.31% Pass / Fail
2 μs 1.86 μs μs 2.14 μs ±2.31% Pass / Fail
5 μs 4.65 μs μs 5.35 μs ±2.31% Pass / Fail
10 μs 9.3 μs μs 10.7 μs ±2.31% Pass / Fail
20 μs 18.6 μs μs 21.4 μs ±2.31% Pass / Fail
*: Indicative values
Performance Test Result SheetPerformance Test Result Sheet
183183

Pulse Width (Wavelength 1550 nm)Pulse Width (Wavelength 1550 nm)
Pulse widthPulse widthSettingsSettings
MinimumMinimumValue*Value*
MeasuredMeasuredValueValue
MaximumMaximumValue*Value*
MeasurementMeasurementAccuracyAccuracy Pass/FailPass/Fail
3 ns - ns - Pass / Fail
10 ns 7 ns ns 13 ns ±2.31% Pass / Fail
20 ns 14 ns ns 26 ns ±2.31% Pass / Fail
50 ns 35 ns ns 65 ns ±2.31% Pass / Fail
100 ns 85 ns ns 115 ns ±2.31% Pass / Fail
200 ns 170 ns ns 230 ns ±2.31% Pass / Fail
500 ns 465 ns ns 535 ns ±2.31% Pass / Fail
1 μs 0.93 μs μs 1.07 μs ±2.31% Pass / Fail
2 μs 1.86 μs μs 2.14 μs ±2.31% Pass / Fail
5 μs 4.65 μs μs 5.35 μs ±2.31% Pass / Fail
10 μs 9.3 μs μs 10.7 μs ±2.31% Pass / Fail
20 μs 18.6 μs μs 21.4 μs ±2.31% Pass / Fail
*: Indicative values
Pulse Width (Wavelength 1625 nm)Pulse Width (Wavelength 1625 nm)
Pulse widthPulse widthSettingsSettings
MinimumMinimumValue*Value*
MeasuredMeasuredValueValue
MaximumMaximumValue*Value*
MeasurementMeasurementAccuracyAccuracy Pass/FailPass/Fail
3 ns - ns - Pass / Fail
10 ns 7 ns ns 13 ns ±2.31% Pass / Fail
20 ns 14 ns ns 26 ns ±2.31% Pass / Fail
50 ns 35 ns ns 65 ns ±2.31% Pass / Fail
100 ns 85 ns ns 115 ns ±2.31% Pass / Fail
200 ns 170 ns ns 230 ns ±2.31% Pass / Fail
500 ns 465 ns ns 535 ns ±2.31% Pass / Fail
1 μs 0.93 μs μs 1.07 μs ±2.31% Pass / Fail
2 μs 1.86 μs μs 2.14 μs ±2.31% Pass / Fail
5 μs 4.65 μs μs 5.35 μs ±2.31% Pass / Fail
10 μs 9.3 μs μs 10.7 μs ±2.31% Pass / Fail
20 μs 18.6 μs μs 21.4 μs ±2.31% Pass / Fail
*: Indicative values
Performance Test and CalibrationPerformance Test and Calibration
184184

Pulse Width (Wavelength 850 nm)Pulse Width (Wavelength 850 nm)
Pulse widthPulse widthSettingsSettings
MinimumMinimumValue*Value*
MeasuredMeasuredValueValue
MaximumMaximumValue*Value*
MeasurementMeasurementAccuracyAccuracy Pass/FailPass/Fail
3 ns - ns - Pass / Fail
10 ns 7 ns ns 13 ns ±2.31% Pass / Fail
20 ns 14 ns ns 26 ns ±2.31% Pass / Fail
50 ns 35 ns ns 65 ns ±2.31% Pass / Fail
100 ns 85 ns ns 115 ns ±2.31% Pass / Fail
200 ns 170 ns ns 230 ns ±2.31% Pass / Fail
500 ns 465 ns ns 535 ns ±2.31% Pass / Fail
*: Indicative values
Pulse Width (Wavelength 1300 nm)Pulse Width (Wavelength 1300 nm)
Pulse widthPulse widthSettingsSettings
MinimumMinimumValue*Value*
MeasuredMeasuredValueValue
MaximumMaximumValue*Value*
MeasurementMeasurementAccuracyAccuracy Pass/FailPass/Fail
3 ns - ns - Pass / Fail
10 ns 7 ns ns 13 ns ±2.31% Pass / Fail
20 ns 14 ns ns 26 ns ±2.31% Pass / Fail
50 ns 35 ns ns 65 ns ±2.31% Pass / Fail
100 ns 85 ns ns 115 ns ±2.31% Pass / Fail
200 ns 170 ns ns 230 ns ±2.31% Pass / Fail
500 ns 465 ns ns 535 ns ±2.31% Pass / Fail
1 μs 0.93 μs μs 1.07 μs ±2.31% Pass / Fail
2 μs 1.86 μs μs 2.14 μs ±2.31% Pass / Fail
4 μs 3.72 μs μs 4.24 μs ±2.31% Pass / Fail
*: Indicative values
Dynamic Range (MU100020A-020)Dynamic Range (MU100020A-020)
WavelengthWavelength MinimumMinimumValueValue
MeasuredMeasuredValueValue
MeasurementMeasurementAccuracyAccuracy Pass/FailPass/Fail
1310 nm 38 dB dB ±0.39 dB Pass / Fail
1550 nm 36.5 dB dB ±0.39 dB Pass / Fail
Dynamic Range (MU100020A-021)Dynamic Range (MU100020A-021)
WavelengthWavelength MinimumMinimumValueValue
MeasuredMeasuredValueValue
MeasurementMeasurementAccuracyAccuracy Pass/FailPass/Fail
1310 nm 41 dB dB ±0.39 dB Pass / Fail
1550 nm 40 dB dB ±0.39 dB Pass / Fail
Performance Test Result SheetPerformance Test Result Sheet
185185

Dynamic Range (MU100020A-022)Dynamic Range (MU100020A-022)
WavelengthWavelength Pulse widthPulse widthSettingsSettings
MinimumMinimumValueValue
MeasuredMeasuredValueValue
MeasurementMeasurementAccuracyAccuracy Pass/FailPass/Fail
1310 nm 20 μs 45 dB dB ±0.39 dB Pass / Fail
1550 nm 20 μs 45 dB dB ±0.39 dB Pass / Fail
1310 nm 100 ns 24 dB dB ±0.39 dB Pass / Fail
1550 nm 100 ns 24 dB dB ±0.39 dB Pass / Fail
Dynamic Range (MU100021A-021)Dynamic Range (MU100021A-021)
WavelengthWavelength Pulse widthPulse widthSettingsSettings
MinimumMinimumValueValue
MeasuredMeasuredValueValue
MeasurementMeasurementAccuracyAccuracy Pass/FailPass/Fail
850 nm 500 ns 28 dB dB ±0.39 dB Pass / Fail
1300 nm 1 μs 27 dB dB ±0.39 dB Pass / Fail
1310 nm 20 μs 41 dB dB ±0.39 dB Pass / Fail
1550 nm 20 μs 40 dB dB ±0.39 dB Pass / Fail
Dynamic Range (MU100022A-022)Dynamic Range (MU100022A-022)
WavelengthWavelength Pulse widthPulse widthSettingsSettings
MinimumMinimumValueValue
MeasuredMeasuredValueValue
MeasurementMeasurementAccuracyAccuracy Pass/FailPass/Fail
1310 nm 20 μs 46 dB dB ±0.39 dB Pass / Fail
1550 nm 20 μs 46 dB dB ±0.39 dB Pass / Fail
1625 nm 20 μs 44 dB dB ±0.39 dB Pass / Fail
1310 nm 100 ns 25 dB dB ±0.39 dB Pass / Fail
1550 nm 100 ns 25 dB dB ±0.39 dB Pass / Fail
1625 nm 100 ns 23 dB dB ±0.39 dB Pass / Fail
Distance Measurement AccuracyDistance Measurement Accuracy
WavelengthWavelengthLength ofLength ofOpticalOptical
Fiber (km)Fiber (km)
MinimumMinimumValueValue
(m)(m)MeasuredMeasuredValue (km)Value (km)
MaximumMaximumValueValue
(m)(m)Pass/FailPass/Fail
850 nm -1.27 +1.27 Pass / Fail
1300 nm -1.27 +1.27 Pass / Fail
1310 nm -1.27 +1.27 Pass / Fail
1550 nm -1.27 +1.27 Pass / Fail
1625 nm -1.27 +1.27 Pass / Fail
Specifications: ±1 m ±(3 m×measured distance (m)×10-5 ±cursor resolution
When Range is 2.5 km and the horizontal scale is 0.005 km/div, themeasurement range is 2500 m and the cursor resolution is 0.2 m.
Performance Test and CalibrationPerformance Test and Calibration
186186

Linearity (Wavelength 1310 nm, Pulse Width 2 μs)Linearity (Wavelength 1310 nm, Pulse Width 2 μs)
LocationLocationofof
Cursor ACursor A(km)(km)
LocationLocationofof
Cursor BCursor B(km)(km)
LossLoss(dB/km)(dB/km)
MinimumMinimumValueValue(dB)(dB)
(Difference(Differencefrom Meanfrom Mean
Loss) Loss) ×3 (dB)×3 (dB)
MaximumMaximumValueValue(dB)(dB)
Pass/FailPass/Fail
0 nm 3 -0.1 +0.1 Pass / Fail
1.5 4.5 -0.1 +0.1 Pass / Fail
3 6 -0.1 +0.1 Pass / Fail
4.5 7.5 -0.1 +0.1 Pass / Fail
6 9 -0.1 +0.1 Pass / Fail
7.5 10.5 -0.1 +0.1 Pass / Fail
9 12 -0.1 +0.1 Pass / Fail
10.5 13.5 -0.1 +0.1 Pass / Fail
12 15 -0.1 +0.1 Pass / Fail
13.5 16.5 -0.1 +0.1 Pass / Fail
15 18 -0.1 +0.1 Pass / Fail
16.5 19.5 -0.1 +0.1 Pass / Fail
18 21 -0.1 +0.1 Pass / Fail
19.5 22.5 -0.1 +0.1 Pass / Fail
21 24 -0.1 +0.1 Pass / Fail
22.5 25.5 -0.1 +0.1 Pass / Fail
24 271 -0.1 +0.1 Pass / Fail
25.5 28.5 -0.1 +0.1 Pass / Fail
27 30 -0.1 +0.1 Pass / Fail
Mean Loss dB/km
Mean Difference dB/km
Performance Test Result SheetPerformance Test Result Sheet
187187

Linearity (Wavelength 850 nm, Pulse Width 100 ns)Linearity (Wavelength 850 nm, Pulse Width 100 ns)
LocationLocationofof
Cursor ACursor A(km)(km)
LocationLocationofof
Cursor BCursor B(km)(km)
LossLoss(dB/km)(dB/km)
MinimumMinimumValueValue(dB)(dB)
(Difference(Differencefrom Meanfrom Mean
Loss) Loss) ×3 (dB)×3 (dB)
MaximumMaximumValueValue(dB)(dB)
Pass/FailPass/Fail
0 nm 0.6 -0.1 +0.1 Pass / Fail
0.3 0.9 -0.1 +0.1 Pass / Fail
0.6 1.2 -0.1 +0.1 Pass / Fail
0.9 1.2 -0.1 +0.1 Pass / Fail
1.2 1.8 -0.1 +0.1 Pass / Fail
1.5 2.1 -0.1 +0.1 Pass / Fail
1.8 2.4 -0.1 +0.1 Pass / Fail
2.1 2.7 -0.1 +0.1 Pass / Fail
2.4 3 -0.1 +0.1 Pass / Fail
2.7 3.3 -0.1 +0.1 Pass / Fail
3 3.6 -0.1 +0.1 Pass / Fail
3.3 3.9 -0.1 +0.1 Pass / Fail
3.6 4.2 -0.1 +0.1 Pass / Fail
3.9 4.5 -0.1 +0.1 Pass / Fail
4.2 4.8 -0.1 +0.1 Pass / Fail
4.5 5.1 -0.1 +0.1 Pass / Fail
4.8 5.4 -0.1 +0.1 Pass / Fail
5.1 5.7 -0.1 +0.1 Pass / Fail
5.4 6 -0.1 +0.1 Pass / Fail
Mean Loss dB/km
Mean Difference dB/km
Fresnel Dead ZoneFresnel Dead Zone
WavelengthWavelength MeasuredMeasuredValueValue
MaximumMaximumValueValue
MeasurementMeasurementAccuracyAccuracy Pass/FailPass/Fail
1310 nm m 0.8 m ±0.05 m Pass / Fail
1550 nm m 0.8 m ±0.05 m Pass / Fail
1625 nm m 0.8 m ±0.05 m Pass / Fail
850 nm m 0.8 m ±0.05 m Pass / Fail
1300 nm m 0.8 m ±0.05 m Pass / Fail
Backscatter Dead ZoneBackscatter Dead Zone
WavelengthWavelength MeasuredMeasuredValueValue
MaximumMaximumValueValue
MeasurementMeasurementAccuracyAccuracy Pass/FailPass/Fail
1310 nm m 3.8 m ±0.3 m Pass / Fail
1550 nm m 4.3 m ±0.3 m Pass / Fail
1625 nm m 4.8 m ±0.3 m Pass / Fail
850 nm m 4.0 m ±0.3 m Pass / Fail
1300 nm m 5.0 m ±0.3 m Pass / Fail
Performance Test and CalibrationPerformance Test and Calibration
188188

Light Source - WavelengthLight Source - Wavelength
Wavelength Wavelength SettingsSettings
MinimumMinimumValueValue
MeasuredMeasuredValueValue
MaximumMaximumValueValue
MeasurementMeasurementAccuracyAccuracy Pass/FailPass/Fail
1310 nm 1280 nm nm 1340 nm ±1.83 nm Pass / Fail
1550 nm 1520 nm nm 1580 nm ±1.83 nm Pass / Fail
1625 nm 1595 nm nm 1655 nm ±1.83 nm Pass / Fail
850 nm 820 nm nm 880 nm ±1.86 nm Pass / Fail
1300 nm 1270 nm nm 1330 nm ±1.86 nm Pass / Fail
Light Source - Spectrum widthLight Source - Spectrum width
Wavelength Wavelength SettingsSettings
MeasuredMeasuredValueValue
MaximumMaximumValueValue
MeasurementMeasurementAccuracyAccuracy Pass/FailPass/Fail
1310 nm nm 5 nm ±0.23 nm Pass / Fail
1550 nm nm 10 nm ±0.23 nm Pass / Fail
1625 nm nm 10 nm ±0.23 nm Pass / Fail
850 nm nm 10 nm ±0.23 nm Pass / Fail
1300 nm nm 10 nm ±0.23 nm Pass / Fail
Light Source - LevelLight Source - Level
Wavelength Wavelength SettingsSettings
MinimumMinimumValueValue
MeasuredMeasuredValueValue
MaximumMaximumValueValue
MeasurementMeasurementAccuracyAccuracy Pass/FailPass/Fail
1310 nm -6.5 dBm dBm -3.5 dBm ±0.25 dB Pass / Fail
1550 nm -6.5 dBm dBm -3.5 dBm ±0.25 dB Pass / Fail
1625 nm -6.5 dBm dBm -3.5 dBm ±0.25 dB Pass / Fail
850 nm -6.5 dBm dBm -3.5 dBm ±0.25 dB Pass / Fail
1300 nm -6.5 dBm dBm -3.5 dBm ±0.25 dB Pass / Fail
Power MeterPower Meter
Wavelength Wavelength SettingsSettings
MinimumMinimumValueValue
MeasuredMeasuredValueValue
MaximumMaximumValueValue
MeasurementMeasurementAccuracyAccuracy Pass/FailPass/Fail
1310 nm -5% % +5% ±1.87% Pass / Fail
1550 nm -5% % +5% ±1.87% Pass / Fail
850 nm -10% % +10% ±6.01% Pass / Fail
Wavelength
Optical power
meter
display
Network Master
displayDifference
1310 nm dBm dBm dB
1550 nm dBm dBm dB
850 nm dBm dBm dB
Performance Test Result SheetPerformance Test Result Sheet
189189

VFLVFL
ItemItem MinimumMinimumValueValue
MeasuredMeasuredValueValue
MaximumMaximumValueValue
MeasurementMeasurementAccuracyAccuracy Pass/FailPass/Fail
Wavelength 635 nm nm 665 nm ±1.83 nm Pass / Fail
Level -2.5 dBm dBm +2.5 dBm ±0.26 dB Pass / Fail
Performance Test and CalibrationPerformance Test and Calibration
190190

88 SpecificationsSpecifications
191191

88..11 MT1000AMT1000A
This section contains specifications for the Network Master Pro, MT1000A(mainframe).
88..11..11 ConfigurationConfiguration
- Main Frame -- Main Frame -
MT1000A Network Master Pro
- Standard Accessories -- Standard Accessories -
J0980 A-2 Power Cord *1
J0981 B4 Power Cord *1
J0982 C7 Power Cord *1
J0983 S3 Power Cord *1
J1027 P4 Power Cord *1
G0310A LiION Battery
G0385A High Power AC Adapter
B0690A Softbag
B0728A Rear Panel Kit
Z1746A Stylus
Z1747A Carrying Strap
Z1748A Handle
Z1817A Utilities ROM *2
W3935AE MT1000A Transport Modules Quick Reference Guide
*1: One of these power cord come with according to a shipping destination.
*2: Following manuals are stored:
W3933AE MT1000A Transport Modules Operation Manual
W3736AE MT1000A Network Master Pro MT1100A Network Master
Flex Remote Scripting Operation Manual
W3810AE MT1000A Network Master Pro OTDR Modules Operation
Manual
W3859AE MT1000A Network Master Pro OTDR Modules Remote
Scripting Operation Manual
10580-00423 MT1000A/MU100040A Network Master Pro Operation
Manual
- Options -- Options -
MT1000A-003 Connectivity for WLAN/Bluetooth
MT1000A-005 AUX I/O
MT1000A-006 High Power Supply
MT1000A-ES210 2 Years Extended Warranty Service
MT1000A-ES310 3 Years Extended Warranty Service
MT1000A-ES510 5 Years Extended Warranty Service
*: Necessary when using MU100011A.
SpecificationsSpecifications
192192

Internal ClockInternal Clock
Ref Clock InputRef Clock Input
Service interfaceService interface
AUX I/OAUX I/O
Remote ControlRemote Control
Input deviceInput device
- Optional Accessories -- Optional Accessories -
B0691A Hard case
B0691B Hard case
B0720A Rear Cover
B0729A Screw 1U
B0730A Screw 2U
B0731A Screw 3U
B0732A Screw Kit
B0733A Hard Case
G0306B Video Inspection Probe
G0324A Battery Charger
G0325A GPS receiver
G0382A Autofocus Video Inspection Probe
J1569A Car 12 Vdc adapter
W3933AE MT1000A Transport Modules Operation Manual
- Modules -- Modules -
MU100010A 10G Multirate Module
MU100011A 100G Multirate Module
MU100020A OTDR Module 1310/1550nm SMF
MU100021A OTDR Module 1310/1550/850/1300nm SMF/MMF
MU100022A OTDR Module 1310/1550/1625nm SMF
MU100040A CPRI RF Module
MU100090A High Performance GPS Disciplined Oscillator
88..11..22 External InterfacesExternal Interfaces
Accuracy ±4.6 ppm or less, STRATUM 3 compliant
BITS (DS1 1.544 Mbit/s), SETS (E1 2.048 Mbit/s), 2MHz Clock, 10MHz Clock ITU-T G.703 compliant
Connector BNC Jack
Range ±100ppm
USB (A x 2,mini B x 1 Port, Revision 2.0) RJ45 Ethernet (10/100/1000 BASE-T) WLAN (2.4GHz IEEE802.11b/g/n) Bluetooth (BT2.1+EDR) 3.5mm Audio Jack AUX Connector (for connection of optional G0325A GPS receiver)
When AUX I/O option is set, the interface is available by combining withJ1705A AUX Conversion Adaptor. J1705A AUX Conversion Adaptor is a standard accessory of the MU100090A.
Ref 1PPS Input TTL 50Ω/DC
1PPS Input TTL 50Ω/DC
Ethernet, GPIB (USB-GPIB)
88..11..33 Other InterfacesOther Interfaces
Power switch, Touch panel
MT1000AMT1000A
193193

LCDLCD
LEDLED
SpeakerSpeaker
Storage MemoryStorage Memory
VoltageVoltage
Power consumptionPower consumption
Battery Charging TimeBattery Charging Time
Temperature rangeTemperature range
EMCEMC
LVDLVD
Wireless CertificationWireless Certification
SizeSize
MassMass
9 inch display with WVGA resolution (800x480 pixels).
On, Standby, Charge
Built-in monaural speaker
Without MT1000A-x06: 1 GB With MT1000A-x06: 7 GB
88..11..44 Environment PerformanceEnvironment Performance
DC 18 V
AC 100 V to 240 V, 50/60 Hz
Without MT1000A-x06: 3.62 A Max. (with dedicated G0309A AC
adaptor)
With MT1000A-x06: 6.6 A Max. (with dedicated G0385A AC adaptor)
BatteryDedicated 10.8 V Rechargeable smart Li-ion battery
Without MT1000A-x06: 65 W max.
With MT1000A-x06: 120 W max.
3 to 6 hours (at 25°C, typical)
*: The maximum allowed charging temperature will be reduced if the
instrument is switched on.
Operating: 0°C to +50°C, ≤85%RH (non-condensing) *
Charging
battery:
0°C to +40°C, ≤85%RH (non-condensing)
Storage: -30°C to +60°C, ≤90%RH (Excluding battery and AC
adapter)
-20°C to +50°C, ≤90%RH (Including battery and AC
adapter)
(non-condensing)
EN61326-1 and EN61000-3-2.
EN61010-1.
For countries and regions permitting WLAN use, refer to the following URL. http://www.anritsu.com/ja-JP/test-measurement/support/downloads/brochures-datasheets-and-catalogs/dwl16689
88..11..55 Mechanical PerformanceMechanical Performance
163(H) x 257.6 (W) x 43.5(D) (Excluding projections)
1.6 kg max.
SpecificationsSpecifications
194194

WavelengthWavelength
Fiber under testFiber under test
Optical ConnectorOptical Connector
88..22 MU100020A OTDR Module 1310/1550nm SMFMU100020A OTDR Module 1310/1550nm SMF
In the following you find specifications for MU100020A OTDR module. TheMU100020A specification lists the functionality added to the basic NetworkMaster Pro by installing the MU100020A option. Refer to the Specifications,MT1000A section for further information about the Network Master Pro's basicfunctionality.
88..22..11 ConfigurationConfiguration
- Module -- Module -
MU100020A OTDR Module 1310/1550nm SMF
- Standard Accessories -- Standard Accessories -
J1693A Universal Connector 2.5mm for OPM
J1694A Universal Connector 1.25mm for OPM
W3811AE MT1000A Network Master Pro OTDR Modules Quick
Reference Guide
- Options -- Options -
MU100020A-002 Visual Fault Locator
MU100020A-ES210 2 Years Extended Warranty Service
MU100020A-ES310 3 Years Extended Warranty Service
MU100020A-ES510 5 Years Extended Warranty Service
- Polish Type Option -- Polish Type Option -
MU100020A-010 UPC Polish
MU100020A-011 APC Polish
- Dynamic Range Option -- Dynamic Range Option -
MU100020A-020 Standard Dynamic Range
MU100020A-021 Enhanced Dynamic Range
MU100020A-022 High-Performance Dynamic Range
- Connector Option -- Connector Option -
MU100020A-025 FC Connector key width 2.0mm
MU100020A-026 SC Connector
MU100020A-037 FC Connector
MU100020A-039 DIN 47256 Connector
MU100020A-040 SC Connector
88..22..22 OTDROTDR
1310 ±25 nm, 1550 ±25 nm
Temperature: 25°C
Pulse width: 1 μs
Except for when charging the battery.
10/125 μm single mode fiber (ITU-T G.652)
For Option 010
MU100020A OTDR Module 1310/1550nm SMFMU100020A OTDR Module 1310/1550nm SMF
195195

Pulse WidthPulse Width
Dynamic RangeDynamic Range(S/N=1)(S/N=1)
Dead Zone (Back-Dead Zone (Back-scattered light)scattered light)
FC: Option 037
DIN47256: Option 039
SC: Option 040
For Option 011
FC: Option 025
SC: Option 026
3, 10, 20, 50, 100, 200, 500 ns, 1, 2, 4, 10, 20 μs
MU100020A-020MU100020A-020
1310 nm: 39 dB
1550 nm: 37.5 dB
Typical value, Pulse width: 20 μs, Guaranteed value is 1 dB lower than above
values.
Measurement conditions are:
SNR=1, Temperature: 25°C, Distance Range: 100 km, Averaging: 180 s
Except for when charging the battery.
MU100020A-021MU100020A-021
1310 nm: 42 dB
1550 nm: 41 dB
Typical value, Pulse width: 20 μs, Guaranteed value is 1 dB lower than above
values.
Measurement conditions are:
SNR=1, Temperature: 25°C, Distance Range: 100 km, Averaging: 180 s
Except for when charging the battery.
MU100020A-022MU100020A-022
1310 nm: 46 dB (Pulse width: 20 μs)
1550 nm: 46 dB (Pulse width: 20 μs)
1310 nm: 25 dB (Pulse width: 100 ns)
1550 nm: 25 dB (Pulse width: 100 ns)
Typical value, Guaranteed value is 1 dB lower than above values.
Measurement conditions are:
SNR=1, Temperature: 25°C, Distance Range: 100 km, Averaging: 180 s
Except for when charging the battery.
1310 nm: ≤ 3.8 m
1550 nm: ≤ 4.3 m
IOR=1.500000
Pulse width: 10 ns, Return loss: 55 dB, Deviation: ±0.5 dB, Temperature: 25°C
Except for when charging the battery.
SpecificationsSpecifications
196196

Dead Zone (FresnelDead Zone (Fresnelreflection)reflection)
Loss MeasurementLoss MeasurementAccuracy (Linearity)Accuracy (Linearity)
Return LossReturn LossMeasurementMeasurementAccuracyAccuracy
DistanceDistanceMeasurementMeasurementAccuracyAccuracy
Distance RangeDistance Range
Sampling ResolutionSampling Resolution
Sampling PointsSampling Points
IOR SettingIOR Setting
Realtime Sweep TimeRealtime Sweep Time
Applicable FiberApplicable Fiber
Wavelength RangeWavelength Range
Wavelength settingWavelength setting
Optical powerOptical powermeasurement rangemeasurement range
MeasurementMeasurementaccuracyaccuracy
0.8 m
IOR=1.500000
Typical value, Pulse width: 3 ns, Return loss: 40 dB, Temperature: 25°C
The width for 1.5 dB lower than the peak value of the reflected waveform
Except for when charging the battery.
±0.05 dB/dB or ±0.1 dB (whichever larger)
±2 dB
±1 m ±3 × d × 10-5 ±mr
d: Measurement distance (m)
mr: Cursor resolution
However, excludes uncertainty due to IOR
0.5/1/2.5/5/10/25/50/100/200/300 km
IOR=1.500000
0.02/0.05/0.1/0.2/0.5/1/2/5/10/20/40 m
250001 points max.
1.300000 to 1.700000 (0.000001 step)
≤ 0.2 s
Test Mode: Manual
Distance Range: 50 km
Resolution: Coarse
88..22..33 Optical Power MeterOptical Power Meter
10/125 μm single mode fiber (ITU-T G.652)
62.5/125 μm GI fiber
800 to 1700 nm
850, 1300, 1310, 1490, 1550, 1625, 1650 nm
-67 to +6 dBm (CW light, 1550 nm)
-60 to +3 dBm (CW light, 850 nm)
-70 to +3 dBm (Modulated light, 1550 nm)
-63 to +0 dBm (Modulated light, 850 nm)
±5%
MU100020A OTDR Module 1310/1550nm SMFMU100020A OTDR Module 1310/1550nm SMF
197197

Modulated lightModulated lightmeasurementmeasurement
ConnectorConnector
Applicable FiberApplicable Fiber
Optical connectorOptical connector
Central wavelengthCentral wavelength
Spectrum widthSpectrum width
Optical output powerOptical output power
Optical output powerOptical output powerinstant stabilityinstant stability
ModulationModulation
Warm-up timeWarm-up time
Central wavelengthCentral wavelength
Optical output powerOptical output power
-10 dBm, Wavelength: 1310/1550 nm, CW light, Temperature: 25°C,
after executing zero offset,
When a fiber with master FC connector and a 2.5mm universal connector are
used.
±10%
-10 dBm, Wavelength: 850 nm, CW light, Temperature: 25°C,
after executing zero offset,
When a fiber with master FC connector and a 2.5mm universal connector are
used.
CW, 270 Hz, 1 kHz, 2 kHz, Wave Code
2.5 mm Universal, 1.25 mm Universal
88..22..44 Light SourceLight Source
10/125 μm single mode fiber (ITU-T G.652)
Common with OTDR ports for the each wavelength
1310 ±30 nm
1550 ±30 nm
CW light, Temperature: 25°C
1310 nm: ≤5 nm
1550 nm: ≤10 nm
CW light, Temperature: 25°C
-5 ±1.5 dBm
CW light, Temperature: 25°C, SM or GI fiber length: 2 m, after warming up
≤0.1 dB
CW light, at a point between -10 to 50°C [±1°C], difference between maximum
and minimum values within one minute, SM fiber length: 2 m
When an optical power meter with 40 dB or greater return loss is used.
After warming up
CW, 270 Hz, 1 kHz, 2 kHz, Wave Code
10 minutes (after turning optical output On)
88..22..55 VFL (Option 002)VFL (Option 002)
650 ±15 nm
Temperature: 25°C
0 ±3 dBm
CW, Temperature: 25°C
SpecificationsSpecifications
198198

Optical connectorOptical connector
Outputting opticalOutputting opticalfiberfiberOptical output modeOptical output mode
Battery operating timeBattery operating time
Temperature andTemperature andHumidity rangeHumidity range
Laser SafetyLaser Safety
EMCEMC
LVDLVD
SizeSize
MassMass
2.5 mm, universal
10/125 μm single mode fiber (ITU-T G.652)
Off, On, Blink
88..22..66 Environment PerformanceEnvironment Performance
Operating time: 6 hours (Typ.)
Telcordia GR-196-CORE Issue2, September 2010
Temperature: 25°C
When combined with MT1000A and charged fully.
Operating: 0°C to +50°C, ≤85%RH (non-condensing)
Storage:-30°C to +60°C, ≤90%RH (Excluding battery and AC adapter)
-20°C to +50°C, ≤90%RH (Including battery and AC adapter)
(non-condensing)
IEC 60825-1:2007 Class 1M
FDA 21CFR1040.10 and 1040.11 except for deviations pursuant to LaserNotice No.50, issued on June 24, 2007.
For MU100020A-002For MU100020A-002
IEC 60825-1:2007 Class 3R
FDA 21CFR1040.10 and 1040.11 except for deviations pursuant to LaserNotice No.50, issued on June 24, 2007.
EN61326-1 and EN61000-3-2
EN61010-1
88..22..77 Mechanical PerformanceMechanical Performance
MU100020A only:
163 (H) x 257.6 (W) x 25 (D) (Excluding projections and the rear panel)
When combined to MT1000A:
163 (H) x 257.6 (W) x 84.3 (D) (Excluding projections)
When combined to MT1000A and MU100010A:
163 (H) x 257.6 (W) x 102.2 (D) (Excluding projections)
MU100020A only:
0.8 kg max. (Excluding the rear panel)
When combined to MT1000A:
2.7 kg max. (Including battery (G0310A))
When combined to MT1000A and MU100010A:
3.5 kg max. (Including battery (G0310A))
MU100020A OTDR Module 1310/1550nm SMFMU100020A OTDR Module 1310/1550nm SMF
199199

WavelengthWavelength
Fiber under testFiber under test
Optical ConnectorOptical Connector
88..33 MU100021A OTDR Module 1310/1550/850/1300nmMU100021A OTDR Module 1310/1550/850/1300nmSMF/MMFSMF/MMF
In the following you find specifications for MU100021A OTDR module. TheMU100021A specification lists the functionality added to the basic NetworkMaster Pro by installing the MU100021A option. Refer to the Specifications,MT1000A section for further information about the Network Master Pro's basicfunctionality.
88..33..11 ConfigurationConfiguration
- Module -- Module -
MU100021A OTDR Module 1310/1550/850/1300nm SMF/MMF
- Standard Accessories -- Standard Accessories -
J1693A Universal Connector 2.5mm for OPM
J1694A Universal Connector 1.25mm for OPM
W3811AE MT1000A Network Master Pro OTDR Modules Quick
Reference Guide
- Options -- Options -
MU100021A-002 Visual Fault Locator
MU100021A-ES210 2 Years Extended Warranty Service
MU100021A-ES310 3 Years Extended Warranty Service
MU100021A-ES510 5 Years Extended Warranty Service
- Polish Type Option -- Polish Type Option -
MU100021A-010 UPC Polish
MU100021A-011 APC Polish
- Dynamic Range Option -- Dynamic Range Option -
MU100021A-021 Enhanced Dynamic Range
- Connector Option -- Connector Option -
MU100021A-025 FC Connector key width 2.0mm
MU100021A-026 SC Connector
MU100021A-037 FC Connector
MU100021A-039 DIN 47256 Connector
MU100021A-040 SC Connector
88..33..22 OTDROTDR
850 ±30 nm, 1300 ±30 nm, 1310 ±25 nm, 1550 ±25 nm
Temperature: 25°C
Pulse width: 1 μs (1310/1550 nm), 100 ns (580/1300 nm)
Except for when charging the battery.
10/125 μm single mode fiber (ITU-T G.652)
62.5/125 μm GI fiber
For Option 010 and the connector for MMF
SpecificationsSpecifications
200200

Pulse WidthPulse Width
Dynamic RangeDynamic Range(S/N=1)(S/N=1)
Dead Zone (Back-Dead Zone (Back-scattered light)scattered light)
Dead Zone (FresnelDead Zone (Fresnelreflection)reflection)
Loss MeasurementLoss MeasurementAccuracy (Linearity)Accuracy (Linearity)
Return LossReturn LossMeasurementMeasurementAccuracyAccuracy
FC: Option 037
DIN47256: Option 039
SC: Option 040
For Option 011
FC: Option 025
SC: Option 026
1310/1550 nm: 3, 10, 20, 50, 100, 200, 500 ns, 1, 2, 4, 10, 20 μs
850 nm: 3, 10, 20, 50, 100, 200, 500 ns
1300 nm: 3, 10, 20, 50, 100, 200, 500 ns, 1, 2, 4 μs
MU100021A-021MU100021A-021
850 nm: 29 dB (Pulse width 500 ns, Distance Range: 25 km) *
1300 nm: 28 dB (Pulse width 5 μs, Distance Range: 25 km) *
1310 nm: 42 dB (Pulse width 20 μs, Distance Range: 100 km)
1550 nm: 41 dB (Pulse width 20 μs, Distance Range: 100 km)
Typical value, Guaranteed value is 1 dB lower than above values.
SNR=1, Temperature: 25°C, Averaging: 180 s
Except for when charging the battery.
*: The dynamic range is lowered by about 3 dB when using a 50/125 μm
optical fiber.
850 nm: ≤ 4.0 m
1300 nm: ≤ 5.0 m
1310 nm: ≤ 3.8 m
1550 nm: ≤ 4.3 m
IOR=1.500000, Deviation: ±0.5 dB, Temperature: 25°C
For 1310 nm and 1550 nm, Pulse width: 10 ns, Return loss: 55 dB
For 850 nm and 1300 nm, Pulse width: 3 ns, Return loss: 40 dB
Except for when charging the battery.
0.8 m
IOR=1.500000
Typical value, Pulse width: 3 ns, Return loss: 40 dB, Temperature: 25°C
The width for 1.5 dB lower than the peak value of the reflected waveform
Except for when charging the battery.
±0.05 dB/dB or ±0.1 dB (whichever larger)
850/1300 nm: ±4 dB
1310/1550 nm: ±2 dB
MU100021A OTDR Module 1310/1550/850/1300nm SMF/MMFMU100021A OTDR Module 1310/1550/850/1300nm SMF/MMF
201201

DistanceDistanceMeasurementMeasurementAccuracyAccuracy
Distance RangeDistance Range
Sampling ResolutionSampling Resolution
Sampling PointsSampling Points
IOR SettingIOR Setting
Realtime Sweep TimeRealtime Sweep Time
Applicable FiberApplicable Fiber
Wavelength RangeWavelength Range
Wavelength settingWavelength setting
Optical powerOptical powermeasurement rangemeasurement range
MeasurementMeasurementaccuracyaccuracy
Modulated lightModulated lightmeasurementmeasurement
±1 m ±3 × d × 10-5 ±mr
d: Measurement distance (m)
mr: Cursor resolution (m)
However, excludes uncertainty due to IOR
850/1300 nm: 0.5/1/2.5/5/10/25/50/100 km
1310/1550 nm: 0.5/1/2.5/5/10/25/50/100/200/300 km
IOR=1.500000
0.02/0.05/0.1/0.2/0.5/1/2/5/10/20/40 m
250001 points max.
1.300000 to 1.700000 (0.000001 step)
≤ 0.2 s
Test Mode: Manual
Distance Range: 50 km
Resolution: Coarse
88..33..33 Optical Power MeterOptical Power Meter
10/125 μm single mode fiber (ITU-T G.652)
62.5/125 μm GI fiber
800 to 1700 nm
850, 1300, 1310, 1490, 1550, 1625, 1650 nm
-67 to +6 dBm (CW light, 1550 nm)
-60 to +3 dBm (CW light, 850 nm)
-70 to +3 dBm (Modulated light, 1550 nm)
-63 to +0 dBm (Modulated light, 850 nm)
±5%
-10 dBm, Wavelength: 1310/1550 nm, CW light, Temperature: 25°C,
after executing zero offset,
When a fiber with master FC connector and a 2.5mm universal connector are
used.
±10%
-10 dBm, Wavelength: 850 nm, CW light, Temperature: 25°C,
after executing zero offset,
When a fiber with master FC connector and a 2.5mm universal connector are
used.
CW, 270 Hz, 1 kHz, 2 kHz, Wave Code
SpecificationsSpecifications
202202

ConnectorConnector
Applicable FiberApplicable Fiber
Optical connectorOptical connector
Central wavelengthCentral wavelength
Spectrum widthSpectrum width
Optical output powerOptical output power
Optical output powerOptical output powerinstant stabilityinstant stability
ModulationModulation
Warm-up timeWarm-up time
Central wavelengthCentral wavelength
Optical output powerOptical output power
Optical connectorOptical connector
2.5 mm Universal, 1.25 mm Universal
88..33..44 Light SourceLight Source
10/125 μm single mode fiber (ITU-T G.652)
62.5/125 μm GI fiber
Common with OTDR ports for the each wavelength
850 ±30 nm
1300 ±30 nm
1310 ±30 nm
1550 ±30 nm
CW light, Temperature: 25°C
850 nm: ≤10 nm
1300 nm: ≤10 nm
1310 nm: ≤5 nm
1550 nm: ≤10 nm
CW light, Temperature: 25°C
-5 ±1.5 dBm
CW light, Temperature: 25°C, SM or GI fiber length: 2 m, after warming up
1310/1550 nm: ≤0.1 dB
CW light, at a point between -10 to 50°C [±1°C], difference between maximum
and minimum values within one minute, SM fiber length: 2 m
When an optical power meter with 40 dB or greater return loss is used (SM)
After warming up
850/1300 nm: Not specified
CW, 270 Hz, 1 kHz, 2 kHz, Wave Code
10 minutes (after turning optical output On)
88..33..55 VFL (Option 002)VFL (Option 002)
650 ±15 nm
Temperature: 25°C
0 ±3 dBm
CW, Temperature: 25°C
2.5 mm, universal
MU100021A OTDR Module 1310/1550/850/1300nm SMF/MMFMU100021A OTDR Module 1310/1550/850/1300nm SMF/MMF
203203

Outputting opticalOutputting opticalfiberfiberOptical output modeOptical output mode
Battery operating timeBattery operating time
Temperature andTemperature andHumidity rangeHumidity range
Laser SafetyLaser Safety
EMCEMC
LVDLVD
SizeSize
MassMass
10/125 μm single mode fiber (ITU-T G.652)
Off, On, Blink
88..33..66 Environment PerformanceEnvironment Performance
Operating time: 6 hours (Typ.)
Telcordia GR-196-CORE Issue2, September 2010
Temperature: 25°C
When combined with MT1000A and charged fully.
Operating: 0°C to +50°C, ≤85%RH (non-condensing)
Storage:-30°C to +60°C, ≤90%RH (Excluding battery and AC adapter)
-20°C to +50°C, ≤90%RH (Including battery and AC adapter)
(non-condensing)
IEC 60825-1:2007 Class 1M
FDA 21CFR1040.10 and 1040.11 except for deviations pursuant to LaserNotice No.50, issued on June 24, 2007.
For MU100021A-002For MU100021A-002
IEC 60825-1:2007 Class 3R
FDA 21CFR1040.10 and 1040.11 except for deviations pursuant to LaserNotice No.50, issued on June 24, 2007.
EN61326-1 and EN61000-3-2.
EN61010-1.
88..33..77 Mechanical PerformanceMechanical Performance
MU100021A only:
163 (H) x 257.6 (W) x 25 (D) (Excluding projections and the rear panel)
When combined to MT1000A:
163 (H) x 257.6 (W) x 84.3 (D) (Excluding projections)
When combined to MT1000A and MU100010A:
163 (H) x 257.6 (W) x 102.2 (D) (Excluding projections)
MU100021A only:
0.8 kg max. (Excluding the rear panel)
When combined to MT1000A:
2.7 kg max. (Including battery (G0310A))
When combined to MT1000A and MU100010A:
3.5 kg max. (Including battery (G0310A))
SpecificationsSpecifications
204204

WavelengthWavelength
Fiber under testFiber under test
Optical ConnectorOptical Connector
88..44 MU100022A OTDR Module 1310/1550/1625nm SMFMU100022A OTDR Module 1310/1550/1625nm SMF
In the following you find specifications for MU100022A OTDR module. TheMU100022A specification lists the functionality added to the basic NetworkMaster Pro by installing the MU100022A option. Refer to the Specifications,MT1000A section for further information about the Network Master Pro's basicfunctionality.
88..44..11 ConfigurationConfiguration
- Module -- Module -
MU100022A OTDR Module 1310/1550/1625nm SMF
- Standard Accessories -- Standard Accessories -
J1693A Universal Connector 2.5mm for OPM
J1694A Universal Connector 1.25mm for OPM
W3811AE MT1000A Network Master Pro OTDR Modules Quick
Reference Guide
- Options -- Options -
MU100022A-002 Visual Fault Locator
MU100022A-ES210 2 Years Extended Warranty Service
MU100022A-ES310 3 Years Extended Warranty Service
MU100022A-ES510 5 Years Extended Warranty Service
- Polish Type Option -- Polish Type Option -
MU100022A-010 UPC Polish
MU100022A-011 APC Polish
- Dynamic Range Option -- Dynamic Range Option -
MU100022A-022 High-Performance Dynamic Range
- Connector Option -- Connector Option -
MU100022A-025 FC Connector key width 2.0mm
MU100022A-026 SC Connector
MU100022A-037 FC Connector
MU100022A-039 DIN 47256 Connector
MU100022A-040 SC Connector
88..44..22 OTDROTDR
1310 ±25 nm, 1550 ±25 nm, 1625 ±25 nm
Temperature: 25°C
Pulse width: 1 μs
Except for when charging the battery.
10/125 μm single mode fiber (ITU-T G.652)
For Option 010
FC: Option 037
DIN47256: Option 039
SC: Option 040
For Option 011
MU100022A OTDR Module 1310/1550/1625nm SMFMU100022A OTDR Module 1310/1550/1625nm SMF
205205

Pulse WidthPulse Width
Dynamic RangeDynamic Range(S/N=1)(S/N=1)
Dead Zone (Back-Dead Zone (Back-scattered light)scattered light)
Dead Zone (FresnelDead Zone (Fresnelreflection)reflection)
Loss MeasurementLoss MeasurementAccuracy (Linearity)Accuracy (Linearity)
Return LossReturn LossMeasurementMeasurementAccuracyAccuracy
DistanceDistanceMeasurementMeasurementAccuracyAccuracy
Distance RangeDistance Range
FC: Option 025
SC: Option 026
3, 10, 20, 50, 100, 200, 500 ns, 1, 2, 4, 10, 20 μs
MU100022A-022MU100022A-022
1310 nm: 46 dB (Pulse width: 20 μs)
1550 nm: 46 dB (Pulse width: 20 μs)
1625 nm: 44 dB (Pulse width: 20 μs)
1310 nm: 25 dB (Pulse width: 100 ns)
1550 nm: 25 dB (Pulse width: 100 ns)
1625 nm: 23 dB (Pulse width: 100 ns)
Typical value, Guaranteed value is 1 dB lower than above values.
Measurement conditions are:
SNR=1, Temperature: 25°C, Distance Range: 100 km, Averaging: 180 s
Except for when charging the battery.
1310 nm: ≤ 3.8 m
1550 nm: ≤ 4.3 m
1625 nm: ≤ 4.8 m
IOR=1.500000
Pulse width: 10 ns, Return loss: 55 dB, Deviation: ±0.5 dB, Temperature: 25°C
Except for when charging the battery.
0.8 m
IOR=1.500000
Typical value, Pulse width: 3 ns, Return loss: 40 dB, Temperature: 25°C
The width for 1.5 dB lower than the peak value of the reflected waveform
Except for when charging the battery.
±0.05 dB/dB or ±0.1 dB (whichever larger)
±2 dB
±1 m ±3 × d × 10-5 ±mr
d: Measurement distance (m)
mr: Cursor resolution
However, excludes uncertainty due to IOR
0.5/1/2.5/5/10/25/50/100/200/300 km
IOR=1.500000
SpecificationsSpecifications
206206

Sampling ResolutionSampling Resolution
Sampling PointsSampling Points
IOR SettingIOR Setting
Realtime Sweep TimeRealtime Sweep Time
Applicable FiberApplicable Fiber
Wavelength RangeWavelength Range
Wavelength settingWavelength setting
Optical powerOptical powermeasurement rangemeasurement range
MeasurementMeasurementaccuracyaccuracy
Modulated lightModulated lightmeasurementmeasurement
ConnectorConnector
Applicable FiberApplicable Fiber
Optical connectorOptical connector
Central wavelengthCentral wavelength
0.02/0.05/0.1/0.2/0.5/1/2/5/10/20/40 m
250001 points max.
1.300000 to 1.700000 (0.000001 step)
≤ 0.2 s
Test Mode: Manual
Distance Range: 50 km
Resolution: Coarse
88..44..33 Optical Power MeterOptical Power Meter
10/125 μm single mode fiber (ITU-T G.652)
62.5/125 μm GI fiber
800 to 1700 nm
850, 1300, 1310, 1490, 1550, 1625, 1650 nm
-67 to +6 dBm (CW light, 1550 nm)
-60 to +3 dBm (CW light, 850 nm)
-70 to +3 dBm (Modulated light, 1550 nm)
-63 to +0 dBm (Modulated light, 850 nm)
±5%
-10 dBm, Wavelength: 1310/1550 nm, CW light, Temperature: 25°C,
after executing zero offset,
When a fiber with master FC connector and a 2.5mm universal connector are
used.
±10%
-10 dBm, Wavelength: 850 nm, CW light, Temperature: 25°C,
after executing zero offset,
When a fiber with master FC connector and a 2.5mm universal connector are
used.
CW, 270 Hz, 1 kHz, 2 kHz, Wave Code
2.5 mm Universal, 1.25 mm Universal
88..44..44 Light SourceLight Source
10/125 μm single mode fiber (ITU-T G.652)
Common with OTDR ports for the each wavelength
1310 ±30 nm
1550 ±30 nm
MU100022A OTDR Module 1310/1550/1625nm SMFMU100022A OTDR Module 1310/1550/1625nm SMF
207207
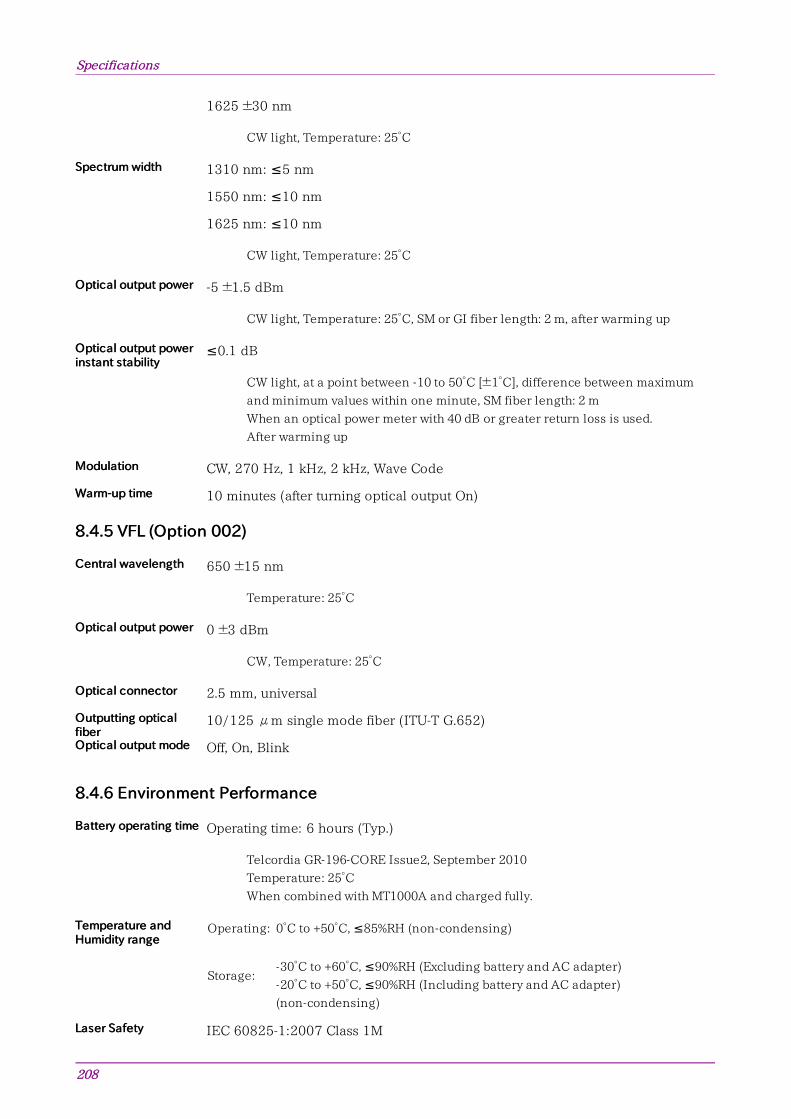
Spectrum widthSpectrum width
Optical output powerOptical output power
Optical output powerOptical output powerinstant stabilityinstant stability
ModulationModulation
Warm-up timeWarm-up time
Central wavelengthCentral wavelength
Optical output powerOptical output power
Optical connectorOptical connector
Outputting opticalOutputting opticalfiberfiberOptical output modeOptical output mode
Battery operating timeBattery operating time
Temperature andTemperature andHumidity rangeHumidity range
Laser SafetyLaser Safety
1625 ±30 nm
CW light, Temperature: 25°C
1310 nm: ≤5 nm
1550 nm: ≤10 nm
1625 nm: ≤10 nm
CW light, Temperature: 25°C
-5 ±1.5 dBm
CW light, Temperature: 25°C, SM or GI fiber length: 2 m, after warming up
≤0.1 dB
CW light, at a point between -10 to 50°C [±1°C], difference between maximum
and minimum values within one minute, SM fiber length: 2 m
When an optical power meter with 40 dB or greater return loss is used.
After warming up
CW, 270 Hz, 1 kHz, 2 kHz, Wave Code
10 minutes (after turning optical output On)
88..44..55 VFL (Option 002)VFL (Option 002)
650 ±15 nm
Temperature: 25°C
0 ±3 dBm
CW, Temperature: 25°C
2.5 mm, universal
10/125 μm single mode fiber (ITU-T G.652)
Off, On, Blink
88..44..66 Environment PerformanceEnvironment Performance
Operating time: 6 hours (Typ.)
Telcordia GR-196-CORE Issue2, September 2010
Temperature: 25°C
When combined with MT1000A and charged fully.
Operating: 0°C to +50°C, ≤85%RH (non-condensing)
Storage:-30°C to +60°C, ≤90%RH (Excluding battery and AC adapter)
-20°C to +50°C, ≤90%RH (Including battery and AC adapter)
(non-condensing)
IEC 60825-1:2007 Class 1M
SpecificationsSpecifications
208208

EMCEMC
LVDLVD
SizeSize
MassMass
FDA 21CFR1040.10 and 1040.11 except for deviations pursuant to LaserNotice No.50, issued on June 24, 2007.
For MU100022A-002For MU100022A-002
IEC 60825-1:2007 Class 3R
FDA 21CFR1040.10 and 1040.11 except for deviations pursuant to LaserNotice No.50, issued on June 24, 2007.
EN61326-1 and EN61000-3-2
EN61010-1
88..44..77 Mechanical PerformanceMechanical Performance
MU100022A only:
163 (H) x 257.6 (W) x 25 (D) (Excluding projections and the rear panel)
When combined to MT1000A:
163 (H) x 257.6 (W) x 84.3 (D) (Excluding projections)
When combined to MT1000A and MU100010A:
163 (H) x 257.6 (W) x 102.2 (D) (Excluding projections)
MU100022A only:
0.8 kg max. (Excluding the rear panel)
When combined to MT1000A:
2.7 kg max. (Including battery (G0310A))
When combined to MT1000A and MU100010A:
3.5 kg max. (Including battery (G0310A))
MU100022A OTDR Module 1310/1550/1625nm SMFMU100022A OTDR Module 1310/1550/1625nm SMF
209209

SpecificationsSpecifications
210210

99 SupportSupportThis chapter contains information about general maintenance of the NetworkMaster. It also contains information on how to obtain support or serviceassistance.
211211

99..11 Maintenance and CleaningMaintenance and Cleaning
This section contains information about general maintenance and cleaning ofthe Network Master.
99..11..11 MaintenanceMaintenance
The Network Master does not require any regular adjustments.
Using the Network Master in a normal environment and under normalconditions will not call for general maintenance.
WARNINGWARNING
There are no user-serviceable parts in the Network Master. Possible There are no user-serviceable parts in the Network Master. Possible service orservice orrepair should be performed by Anritsu authorized personnel only.repair should be performed by Anritsu authorized personnel only.
99..11..22 CleaningCleaning
From time to time the Network Master needs to be cleaned. The surfaces of theNetwork Master can be cleaned with any mild detergent that does not containsolvents.
Before any cleaning, please take notice of the warnings below:
WARNINGWARNING
Disconnect the Network Master from the mains power connection before anyDisconnect the Network Master from the mains power connection before anycleaning involving fluid.cleaning involving fluid.
Only use a soft cloth moisturized with a mild detergent to clean the surface of
the touch screen.
Clean the main power adapter regularly. If dust accumulates around the power
pins, there is a risk of fire.
Keep the cooling fan clean so that the ventilation holes are not obstructed. If
the ventilation is obstructed, the cabinet may overheat and catch fire.
MT1000A and OTDR moduleMT1000A and OTDR module MT1000A, OTDR module and MU100010AMT1000A, OTDR module and MU100010A
SupportSupport
212212

99..22 Notes On StorageNotes On Storage
Remove any dust or dirt adhering to the equipment before storage.
Remove batteries from the Network Master.
Pack accessories, such as adapters and Utilities ROM, etc., into the accessoriesbox and store it with the main frame.
Avoid storing in these places:
In direct sunlight
Dusty places
Damp places where condensation may occur on the equipment's surface
Places with active/corrosive gases
Places where the equipment may be oxidized
Places where there is a risk of vibration or mechanical shock
Places where there is a risk of packing boxes falling over
Places where the temperature and humidity are as follows:
Temperature: -20°C or lower, or 50°C or higher
Humidity: 90% or higher
Recommended storage conditionsRecommended storage conditions
It is recommended that the equipment be stored in a place that meets theambient conditions suggested above, plus the following conditions, if it is notto be used for a long period of time:
Temperature: 5°C to 45°C
Humidity: 40% to 80%
Little temperature and humidity fluctuations within 1 day
Notes On StorageNotes On Storage
213213

99..33 Formatting the data area in the Network MasterFormatting the data area in the Network Master
Occasionally it is required to remove customer data from Network Master suchas after instrument rental. With Software tools you can format Network Masterinternal data area.
Two data areas are available: Data area and Property area. Data area contains user rewritable data. Property area contains system data.
Each area can be formatted with tools stored on a USB memory stick. The toolsare stored on the Utilities ROM. Please refer to the following description toformat.
To perform Data area formatting, copy "REFORMAT_DATA_AREA.MT1000_SW" to root of USB memory stick.
To perform Property area formatting, copy "REFORMAT_PROPERTY_AREA.MT1000_SW" to root of USB memory stick.
Place the format tools in the root of an empty of USB memory stick. To performboth kinds of formattings simultaneously, place both tools in the root together.
ProcedureProcedure
1. Remove power cable and turn instrument off. Power button turns off.
2. Insert the USB memory stick with the tools in one of the USB Type-A ports.
3. Connect power cable or push power button to turn power on. Then formatting
is executed and Network Master will reboot automatically.
4. Remove USB memory stick. The formatting is completed.
SupportSupport
214214

99..44 Upgrading the SoftwareUpgrading the Software
Connect the AC adapter to the Network Master while updating the software. When updating the software with battery operation, make sure that there is 40% (ormore) power in the battery of the Network Master.
Installation by using USB memory stickInstallation by using USB memory stick
Visit our website and download the latest version. We have two types ofinstallers as below.
MT1000A_Software with MU100011A: For using MT1000A which module
configuration includes MU100011A.
MT1000A_Software: For using MT1000A which module
configuration does not include MU100011A.
"MT1000A_Software with MU100011A" is consisted from two files. Copy both files toUSB memory stick and perform the installation. Note that installing "MT1000A_Software" is not able to work the MU100011A.
1. Copy the installer onto an empty USB memory stick.
2. If USB memory stick is inserted to the Network Master, remove it. If the
Network Master is powered-down while the USB memory stick is still inserted,
there is a risk that the USB memory stick may not operate normally after the
installation.
3. Press the power button to shut down the Network Master. Never force to power
off by holding the power button pressed for several seconds.
4. Remove AC adapter or power cable and confirm the power button turns to
gray.
5. Insert the USB memory stick into the Network Master.
6. Connect AC adapter to the Network Master.
7. Press the power button to boot the Network Master.
The Network Master will detect the installer stored in the USB memory stick,
and start installing the software. After the installation has finished, the
Network Master will reboot.If the software is installed on battery operation without connecting AC adapter,Network Master does not reboot. Press the power button to boot the NetworkMaster.When installing MT1000A software which includes MU100011A, the
installation of MU100011A data starts automatically at the Network Master
rebooting.
8. Check the software version at System Information on the Instrument ToolbarInstrument Toolbar.
9. Remove USB memory stick after the installation has completed.
Upgrading the SoftwareUpgrading the Software
215215

99..55 Support and Service AssistanceSupport and Service Assistance
In case your Network Master needs support or service, follow the instructionsgiven in the sub-sections below.
99..55..11 Before you obtain assistanceBefore you obtain assistance
To ensure fast help the Anritsu representative or the Anritsu Customer Servicesneed detailed information about the Network Master and the problemsconcerning the Network Master. The minimum information required is listedbelow:
A file containing the system information. The file can be generated using the
icon in the instrument toolbar.Possible error code displayed on the touch screen, or any other error
indications
A detailed description of the problem and how it occurred. Please make the
description as detailed as possible, e.g. by drawing an illustration and/or
saving relevant screen captures.
99..55..22 Obtaining Support or Service AssistanceObtaining Support or Service Assistance
In the event that this equipment malfunctions, contact an Anritsu Service andSales office. Contact information is available in a separate file on the PDFversion.
SupportSupport
216216

99..66 Transporting and DisposalTransporting and Disposal
This section describes the precautions to observe when transporting anddisposing of the main frame.
99..66..11 RepackagingRepackaging
Use the original shipping materials, or an approved optional transit case, whenrepacking the unit for transport. Repack according to the following procedurewhen the original shipping materials (or a transit case) are not available.
1. Procure a corrugated cardboard, wooden, or aluminum box large enough to
pack in cushioning material around the unit.
2. Wrap the main frame in some material such as plastic sheeting that will
prevent entry of dust and water.
3. Place the unit into the box.
4. Pack soft materials around the main frame so that it cannot slide around
inside the packing box.
5. Secure the outside of the box with packaging cord, adhesive tape, bands, or
other such implements.
99..66..22 TransportingTransporting
In addition to preventing vibration as much as possible, transport underconditions meeting the storage conditions outlined above.
99..66..33 DisposalDisposal
When the Network Master has reached the end of its useful life, dispose of it inaccordance with local environmental regulations. Before disposal, dismantle orphysically destroy any non-volatile memory media in the Network Master toensure that data in memory cannot be recovered by third parties.
Transporting and DisposalTransporting and Disposal
217217
99..77 Special InformationSpecial Information
99..77..11 Equipment CertificateEquipment Certificate
Anritsu Corporation certifies that this equipment was tested before shipmentusing calibrated measuring instruments with direct traceability to public testingorganizations, and was found to meet the published specifications.
99..77..22 Anritsu WarrantyAnritsu Warranty
Anritsu Corporation will repair this equipment free-of-charge if a malfunctionoccurs within one year after shipment due to a manufacturing fault. However,software fixes will be made in accordance with the separate Software End-UserLicense Agreement. Moreover, Anritsu Corporation will deem this warrantyvoid when:
The fault is outside the scope of the warranty conditions separately described
in the operation manual.
The fault is due to mishandling, misuse, or unauthorized modification or
repair of the equipment by the customer.
The fault is due to severe usage clearly exceeding normal usage.
The fault is due to improper or insufficient maintenance by the customer.
The fault is due to natural disaster, including fire, wind, flooding, earthquake,
lightning strike, or volcanic ash, etc.
The fault is due to damage caused by acts of destruction, including civil
disturbance, riot, or war, etc.
The fault is due to explosion, accident, or breakdown of any other machinery,
facility, or plant, etc.
The fault is due to use of non-specified peripheral or applied equipment or
parts, or consumables, etc.
The fault is due to use of a non-specified power supply or in a non-specified
installation location.
The fault is due to use in unusual environments(Note).
The fault is due to activities or ingress of living organisms, such as insects,
spiders, fungus, pollen, or seeds.
In addition, this warranty is valid only for the original equipment purchaser. Itis not transferable if the equipment is resold.
Anritsu Corporation shall assume no liability for injury or financial loss of thecustomer due to the use of or a failure to be able to use this equipment.
Note: For the purpose of this Warranty, "unusual environments" means use:
In places of direct sunlight
In dusty places
In liquids, such as water, oil, or organic solvents, and medical fluids, or places
where these liquids may adhere
In salty air or in places where chemically active gases (sulfur dioxide,
hydrogen sulfide, chlorine, ammonia, nitrogen dioxide, or hydrogen chloride
etc.) are present
In places where high-intensity static electric charges or electromagnetic fields
are present
SupportSupport
218218

In places where abnormal power voltages (high or low) or instantaneous
power failures occur
In places where condensation occurs
In the presence of lubricating oil mists
In places at an altitude of more than 2,000 m
In the presence of frequent vibration or mechanical shock, such as in cars,
ships, or airplanes
99..77..33 Anritsu Corporation ContactAnritsu Corporation Contact
In the event of this equipment malfunctions, contact an Anritsu Service andSales office. Contact information can be found on the last page of the printedversion of this manual, and is available in a separate file on the PDF version.
99..77..44 Licensing InformationLicensing Information
This product includes copyrighted third-party software licensed under theterms of the GNU General Public License.
Please see the GNU General Public License for the exact terms and conditionsof this license.
Especially the following parts of this product are subject to GNU GPL:
The Linux operating system kernel
The busybox swiss army knife of embedded linux
e2fsprogs - filesystem utilities for use with the ext2 filesystem
All listed software packages are copyrighted by their respective authors. Pleasesee the source code for detailed information.
99..77..55 Availability of Source CodeAvailability of Source Code
Anritsu Corporation has the full source code of the GPL licensed software,including any scripts to control compilation of the object code.
Special InformationSpecial Information
219219

99..88 Software License DocumentSoftware License Document
Network Master comes with the package software as described in followingTable. Note, however, that the package software is not covered by the AnritsuSoftware License Agreement.
Go to the following website for details of each license. http://www.anritsu.com/ja-JP/test-measurement/support/downloads/manuals/dwl16668
NameName VersionVersion LicenseLicense
Software LicenseSoftware License
ace_tao 2.2a custom
alsa-lib 1.0.24.1 LGPL
alsa-utils 1.0.24.2 GPL
atk 2.10.0-1 LGPL
at-spi 1.32.0-5 GPL
at-spi2-atk 2.10.2-1 GPL2
at-spi2-core 2.10.2-1 GPL2
attr 2.4.47-1 LGPL
avahi 0.6.31-11 LGPL
bash 2.05b GPL2
binutils 2.24-1 GPL
bluez 4.101 GPL
bluez-tools 0.1.38 GPL
busybox 1.20.2 GPL2
cairo 1.12.16-1 LGPL,MPL
compositeproto 0.4 MIT
coreutils 8.23-1 GPL3
cups-filters 1.0.41-1 GPL
damageproto 1.1.0 MIT
dbus 1.4.14 GPL,custom
dbus-glib 0.82 GPL2,custom
DirectFB 1.4.0 LGPL
dosfstools 3.0.26-1 GPL2
e2fsprogs 1.41.4 GPL
expat 2.0.1 MIT
fontconfig 2.11.0-1 custom
font-util 1.0.1 MIT
freetype 2.3.9 GPLorFTL
gdb 6.6 GPL
gdk-pixbuf2 2.30.2-1 LGPL2.1
glib 1.2.10-11 LGPL
glib2 2.38.2-1 LGPL
glibc 2.17-5.1 GPL,LGPL
SupportSupport
220220

NameName VersionVersion LicenseLicense
Software License (Cont'd)Software License (Cont'd)
gmp 5.1.3-2 LGPL3
gnutls 3.2.7-1 GPL3,LGPL2.1
graphite 1:1.2.4-1 LGPL,GPL,custom
gsettings-desktop-schemas 3.10.1-1 GPL
gtk2 2.14.3 LGPL
gtk3 3.10.6-1 LGPL
gzip 1.6-1 GPL3
harfbuzz 0.9.24-1 MIT
hicolor-icon-theme 0.12-2 GPL2
hplip 3.14.1 custom
icewm 1.3.7 GPL
inputproto 1.4.4 MIT
jack 0.121.3-7 GPL,LGPL
kbproto 1.0.3 MIT
keyutils 1.5.8-1 GPL2,LGPL2.1
kobs-ng 12.09.01 GPL
krb5 1.11.4-1 custom
lcms2 2.5-2 MIT
libcap 2.22-5 GPL2
libcups 1.7.0-2 GPL
libdbus 3.5.7 GPL,custom
libdrm 2.3.1 MIT
liberation-fonts 20070509 GPL+exception
libffi 3.0.13-4 MIT
libfontenc 1.0.4 MIT
libgcrypt 1.5.3-1 LGPL
libgpg-error 1.12-1 LGPL
libICE 1.0.4 MIT
libidn 1.28-2 GPL3,LGPL
libjpeg-turbo 1.3.0-3 GPL,custom
liblzma 5.0.5-2 PublicDomain
libnfnetlink 0.0.25 GPL
libnl 3.2.23-1 GPL
libpciaccess 0.10.6 MIT
libpng 1.6.7-1 custom
libpthread-stubs 0.1 MIT
libSM 1.0.2 MIT
libtasn1 3.4-1 GPL3,LGPL
libtermcap 2.0.8 LGPL
libtiff 4.0.3-4 custom
libusbx 1.0.17-1 LGPL
Software License DocumentSoftware License Document
221221
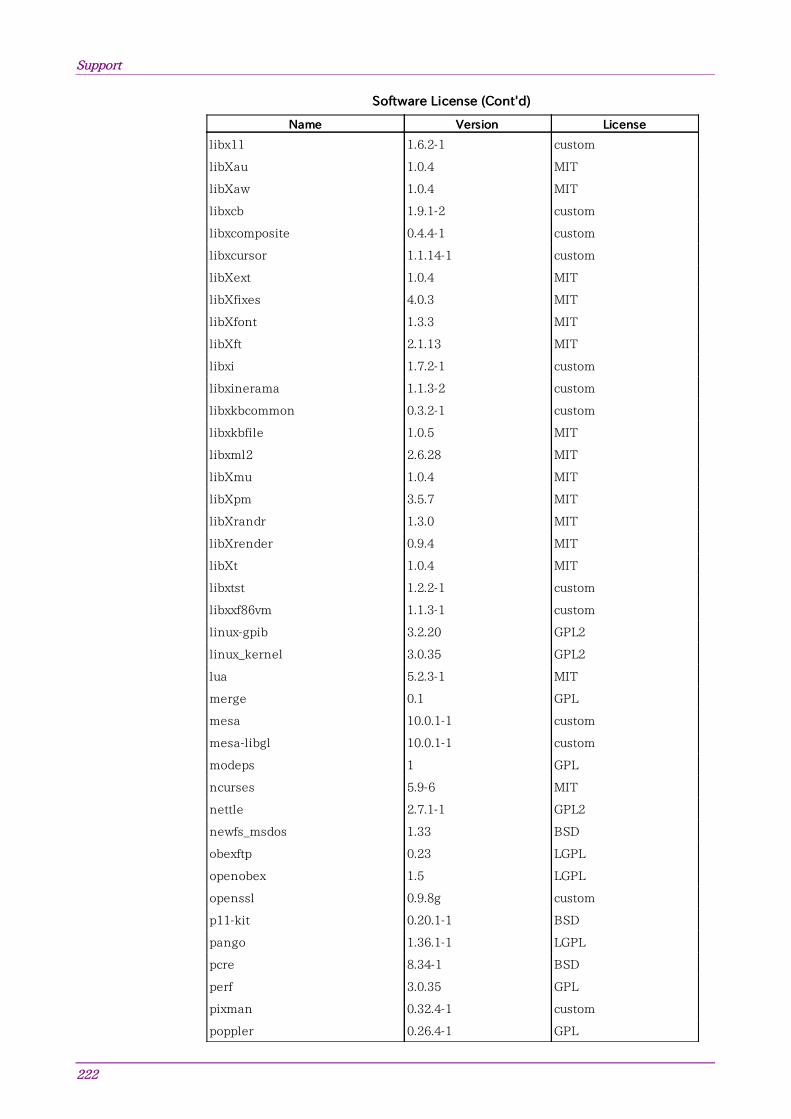
NameName VersionVersion LicenseLicense
Software License (Cont'd)Software License (Cont'd)
libx11 1.6.2-1 custom
libXau 1.0.4 MIT
libXaw 1.0.4 MIT
libxcb 1.9.1-2 custom
libxcomposite 0.4.4-1 custom
libxcursor 1.1.14-1 custom
libXext 1.0.4 MIT
libXfixes 4.0.3 MIT
libXfont 1.3.3 MIT
libXft 2.1.13 MIT
libxi 1.7.2-1 custom
libxinerama 1.1.3-2 custom
libxkbcommon 0.3.2-1 custom
libxkbfile 1.0.5 MIT
libxml2 2.6.28 MIT
libXmu 1.0.4 MIT
libXpm 3.5.7 MIT
libXrandr 1.3.0 MIT
libXrender 0.9.4 MIT
libXt 1.0.4 MIT
libxtst 1.2.2-1 custom
libxxf86vm 1.1.3-1 custom
linux-gpib 3.2.20 GPL2
linux_kernel 3.0.35 GPL2
lua 5.2.3-1 MIT
merge 0.1 GPL
mesa 10.0.1-1 custom
mesa-libgl 10.0.1-1 custom
modeps 1 GPL
ncurses 5.9-6 MIT
nettle 2.7.1-1 GPL2
newfs_msdos 1.33 BSD
obexftp 0.23 LGPL
openobex 1.5 LGPL
openssl 0.9.8g custom
p11-kit 0.20.1-1 BSD
pango 1.36.1-1 LGPL
pcre 8.34-1 BSD
perf 3.0.35 GPL
pixman 0.32.4-1 custom
poppler 0.26.4-1 GPL
SupportSupport
222222

NameName VersionVersion LicenseLicense
Software License (Cont'd)Software License (Cont'd)
poppler-data 0.4.6-1 custom,GPL2
poppler-qt4 0.26.3-1 GPL
portaudio 19_20111121- custom
portmap 5beta BSD
qt4 4.8.2GPL3,LGPL,
FDL,custom
qwt 6.1.0rc3 LGPL
randrproto 1.2.2 MIT
readline 6.2.004-2 GPL
recordproto 1.13.2 MIT
renderproto 0.9.3 MIT
resourceproto 1.0.2 MIT
samba 3.6.23 GPL3
scrnsaverproto 1.1.0 MIT
talloc 2.1.1-1 GPL3
tcpdump 4.5.1-1 BSD
tcp_wrappers 7.6 BSD
timezone 2006n BSD
tslib 1 LGPL
u-boot Jan-13 GPL
udev 117 GPL
wayland 1.3.0-1 MIT
wget 1.15-1 GPL3
wireless_tools 29 GPL
wireshark 1.12.1 GPL2
wpa_supplicant 0.5.9 GPL
x11vnc 0.9.13-6 GPL2
xcb-proto 1.2 MIT
xcmiscproto 1.1.2 MIT
xextproto 7.0.3 MIT
xf86bigfontproto 1.1.2 MIT
xf86driproto 2.0.4 MIT
xorg-server 1.6.1 MIT
xorg-x11-drv-keyboard 1.3.2 MIT
xorg-x11-drv-mouse 1.4.0 MIT
xorg-x11-proto-devel 7.5 MIT
xorg-x11-xkb-utils 7.2 MIT
xproto 7.0.13 MIT
xterm 234 MIT
xtrans 1.2.3 MIT
zlib 1.2.8 zlibv
Software License DocumentSoftware License Document
223223

99..99 EULA License DocumentEULA License Document
Software End-User License Agreement (EULA)Software End-User License Agreement (EULA)
Please read this Software End-User License Agreement (hereafter this EULA)carefully before using (includes executing, copying, registering, etc.) thissoftware (includes programs, databases, scenarios, etc., used to operate, set,etc., Anritsu electronic equipment). By reading this EULA and using thissoftware, you are agreeing to be bound by the terms of its contents and AnritsuCorporation (hereafter Anritsu) hereby grants you the right to use this Softwarewith the Anritsu-specified equipment (hereafter Equipment) for the purposesset out in this EULA.
1. Grant of License and Limitations1. Grant of License and Limitations
1. Regardless of whether this Software was purchased from or provided free-of-
charge by Anritsu, you agree not to rent, lease, lend, or otherwise distribute
this Software to third parties and further agree not to disassemble, recompile,
reverse engineer, modify, or create derivative works of this Software.
2. You may make one copy of this Software for backup purposes only.
3. You are not permitted to reverse engineer this software.
4. This EULA allows you to install one copy of this Software on one piece of
Equipment.
2. Disclaimers2. Disclaimers
To the extent not prohibited by law, in no event shall Anritsu be liable for personal
injury, or any incidental, special, indirect or consequential damages whatsoever,
including, without limitation, damages for loss of profits, loss of data, business
interruption or any other commercial damages or losses, arising out of or related to
your use or inability to use this Software.
3. Limitation of Liability3. Limitation of Liability
a. If a fault (bug) is discovered in this Software, preventing operation as
described in the operation manual or specifications whether or not the
customer uses this software as described in the manual, Anritsu shall at its
own discretion, fix the bug, or exchange the software, or suggest a workaround,
free-of-charge. However, notwithstanding the above, the following items shall
be excluded from repair and warranty.
i. If this Software is deemed to be used for purposes not described in the
operation manual or specifications.
ii. If this Software is used in conjunction with other non-Anritsu-approved
software.
iii. Recovery of lost or damaged data.
iv. If this Software or the Equipment has been modified, repaired, or
otherwise altered without Anritsu's prior approval.
v. For any other reasons out of Anritsu's direct control and responsibility,
such as but not limited to, natural disasters, software virus infections,
etc.
b. Expenses incurred for transport, hotel, daily allowance, etc., for on-site repairs
by Anritsu engineers necessitated by the above faults shall be borne by you.
c. The warranty period for faults listed in article 3a above covered by this EULA
shall be either 6 months from the date of purchase of this Software or 30 days
SupportSupport
224224

after the date of repair, whichever is longer.
4. Export Restrictions4. Export Restrictions
You may not use or otherwise export or re-export directly or indirectly this Software
except as authorized by Japanese and United States law. In particular, this software
may not be exported or re-exported (a) into any Japanese or US embargoed countries
or (b) to anyone on the Japanese or US Treasury Department's list of Specially
Designated Nationals or the US Department of Commerce Denied Persons List or
Entity List. By using this Software, you warrant that you are not located in any such
country or on any such list. You also agree that you will not use this Software for any
purposes prohibited by Japanese and US law, including, without limitation, the
development, design and manufacture or production of missiles or nuclear, chemical
or biological weapons of mass destruction.
5. Termination5. Termination
Anritsu shall deem this EULA terminated if you violate any conditions described
herein. This EULA shall also be terminated if the conditions herein cannot be
continued for any good reason, such as violation of copyrights, patents, or other laws
and ordinances.
6. Reparations6. Reparations
If Anritsu suffers any loss, financial or otherwise, due to your violation of the terms of
this EULA, Anritsu shall have the right to seek proportional damages from you.
7. Responsibility after Termination7. Responsibility after Termination
Upon termination of this EULA in accordance with item 5, you shall cease all use of
this Software immediately and shall as directed by Anritsu either destroy or return
this Software and any backup copies, full or partial, to Anritsu.
8. Dispute Resolution8. Dispute Resolution
If matters of dispute or items not covered by this EULA arise, they shall be resolved
by negotiations in good faith between you and Anritsu.
9. Court of Jurisdiction9. Court of Jurisdiction
This EULA shall be interpreted in accordance with Japanese law and any disputes
that cannot be resolved by negotiation described in Article 8 shall be settled by the
Japanese courts.
EULA License DocumentEULA License Document
225225

99..1010 CE Conformity MarkingCE Conformity Marking
Anritsu affixes the CE conformity marking on the following product(s) inaccordance with the Decision 768/2008/EC to indicate that they conform tothe EMC, LVD, and RoHS directive of the European Union (EU).
CE marking
99..1010..11 Product ModelProduct Model
Model:
MT1000A Network Master Pro
99..1010..22 Applied DirectiveApplied Directive
EMC:
Directive 2014/30/EU
LVD:
Directive 2014/35/EU
RoHS:
Directive 2011/65/EU
99..1010..33 Applied StandardsApplied Standards
EMC:
Emission: EN 61326-1: 2013 (Class A)
Immunity: EN 61326-1: 2013 (Table 2)
StandardStandard Performance Criteria*Performance Criteria*IEC 61000-4-2 (ESD) B
IEC 61000-4-3 (EMF) A
IEC 61000-4-4 (Burst) B
IEC 61000-4-5 (Surge) B
IEC 61000-4-6 (CRF) A
IEC 61000-4-8 (RPFMF) A
IEC 61000-4-11 (V dip/short) B, C
*: Performance Criteria
A. The equipment shall continue to operate as intended during and after
the test. No degradation of performance or loss of function is allowed
below a performance level specified by the manufacturer, when the
equipment is used as intended. The performance level may be replaced
by a permissible loss of performance. If the minimum performance
level or the permissible performance loss is not specified by the
manufacturer, either of these may be derived from the product
description and documentation and what the user may reasonably
expect from the equipment if used as intended.
B. The equipment shall continue to operate as intended after the test. No
degradation of performance or loss of function is allowed below a
performance level specified by the manufacturer, when the equipment
SupportSupport
226226

is used as intended. The performance level may be replaced by a
permissible loss of performance. During the test, degradation of
performance is however allowed. No change of actual operating state
or stored data is allowed. If the minimum performance level or the
permissible performance loss is not specified by the manufacturer,
either of these may be derived from the product description and
documentation and what the user may reasonably expect from the
equipment if used as intended.
C. Temporary loss of function is allowed, provided the function is self-
recoverable or can be restored by the operation of the controls.
Harmonic current emissions:
EN 61000-3-2:2014 (Class A equipment)
LVD:
EN 61010-1:2010 (Pollution Degree 2)
RoHS:
EN 50581:2012 (Category 9)
If the third digit of the serial number is "6",
the product complies with RoHS.
Serial number example
99..1010..44 Authorized RepresentativeAuthorized Representative
Name:
Murray Coleman
Head of Customer Service EMEA
ANRITSU EMEA Ltd
Address, City:200 Capability Green, Luton
Bedfordshire, LU1 3LU
Country: United Kingdom
CE Conformity MarkingCE Conformity Marking
227227

99..1010..55 CE DeclarationCE Declaration
SupportSupport
228228

99..1111 RCM Conformity MarkingRCM Conformity Marking
Anritsu affixes the RCM mark on the following product(s) in accordance withthe regulation to indicate that they conform to the EMC framework ofAustralia/New Zealand.
RCM marking
99..1111..11 Product ModelProduct Model
Model:
MT1000A Network Master Pro
99..1111..22 Applied StandardsApplied Standards
EMC:
Emission: EN 61326-1:2013 (Class A equipment)
RCM Conformity MarkingRCM Conformity Marking
229229

99..1212 Laser SafetyLaser Safety
99..1212..11 Laser Safety ClassificationsLaser Safety Classifications
Class 1, 1M and 3R indicate the danger degree of the laser radiation specifiedbelow according to IEC 60825-1:2007.
Class 1:
Lasers that are safe under reasonably foreseeable conditions of operation,
including the use of optical instruments for intrabeam viewing.
Class 1M:
Lasers emitting in the wavelength range from 302.5 to 4000 nm that are safe
under reasonably foreseeable conditions of operation, but may be hazardous
if the user employs optics within the beam. Two conditions apply:
a. for diverging beams, if the user views the laser output with certain
optical instruments (for example, eye loupes, magnifiers and
microscopes) within a distance of 100 mm;
or,
b. for collimated beams, if the user views the laser output with certain
optical instruments (for example, telescopes and binoculars).
Class 3R:
Lasers that emit in the wavelength range from 302.5 to 106 nm where direct
intrabeam viewing is potentially hazardous but the risk is lower than for Class
3B lasers.
WARNINGWARNING
Before using this instrument, always ensure that the warning light is lit whenthe optical output switch is turned on. If this warning light does not turn on, the equipment may be faulty and forsafety reasons should be returned to an Anritsu service center or representativefor repair.
The laser in the module provided for this equipment is classified as Class 1,1M, or 3R according to the IEC 60825-1:2007 standard.
Never use optical instruments to directly view Class 1M laser products. Doingso may result in serious damage to the eyes.
CAUTIONCAUTION
Use of controls or adjustments or performance of procedures other than thosespecified herein may result in hazardous radiation exposure.
SupportSupport
230230

Table 1 Table 1 Laser Safety Classifications Based on IEC 60825-1:2007Laser Safety Classifications Based on IEC 60825-1:2007
Model NameModel Name ClassClassMax. OpticalMax. OpticalOutput PowerOutput Power
(mW)*(mW)*Pulse Width (s)/ Pulse Width (s)/ Repetition RateRepetition Rate
EmittedEmittedWavelengthWavelength
(nm)(nm)
BeamBeamDivergenceDivergence
(deg)(deg)LaserLaser
ApertureAperture Built-in LaserBuilt-in Laser
* Indicates the possible optical output power when each and every reasonably foreseeable single-fault
condition is included.
MU100020A 1M 0.15 20×10-6/
0.0191310 11.5
Figure 1,
[1]Table 2 (a)
1 0.15 20×10-6/
0.0191550 11.5 Table 2 (b)
MU100021A 1M 0.15 20×10-6/
0.0191310 11.5
Figure 2,
[1]Table 2 (a)
1 0.15 20×10-6/
0.0191550 11.5 Table 2 (b)
1M 0.012 0.5×10⁻⁶/
0.036850 36.9
Figure 2,
[3]Table 2 (c)
1 0.15 4×10⁻⁶/
0.0371300 36.9 Table 2 (d)
MU100022A 1M 0.15 20×10-6/
0.0191310 11.5
Figure 3,
[1]Table 2 (a)
1 0.15 20×10-6/
0.0191550 11.5 Table 2 (b)
1 0.15 20×10-6/
0.0191625 11.5 Table 2 (f)
Option 002 3R 0.003 CW 650 11.5
Figure 1,
[2]
Figure 2,
[2]
Figure 3,
[2]
Table 2 (e)
Laser SafetyLaser Safety
231231

Table 2 Table 2 Specifications of Laser Built into MU100020A, MU100021A, andSpecifications of Laser Built into MU100020A, MU100021A, andMU100022AMU100022A
Max. OpticalMax. OpticalOutput PowerOutput Power
(mW)*(mW)*Pulse Width (s)/ Pulse Width (s)/ Repetition RateRepetition Rate
EmittedEmittedWavelength (nm)Wavelength (nm)
BeamBeamDivergenceDivergence
(deg)(deg)
* Indicates the possible optical output power when each and every reasonably
foreseeable single-fault condition is included.
(a) 0.3 20×10-6/
0.0191310 11.5
(b) 0.3 20×10-6/
0.0191550 11.5
(c) 0.024 0.5×10⁻⁶/
0.036850 36.9
(d) 0.3 4×10⁻⁶/
0.0371300 36.9
(e) 0.003 CW 650 11.5
(f) 0.3 20×10-6/
0.0191625 11.5
SupportSupport
232232

99..1212..22 Indication Labels on ProductIndication Labels on Product
Table 3 Table 3 Labels on ProductLabels on Product
TypeType LabelLabel Affix toAffix to Model NameModel Name
1 ExplanationFigure 4, A
Figure 7, A
MU100020A,
MU100021A,
MU100022A
2 Explanation
Figure 4, B
Figure 6, B
Figure 7, B
MU100020A,
MU100021A,
MU100022A
3 CertificationFigure 4, C
Figure 5, C
MU100020A,
MU100021A,
MU100022A
4 Identification Figure 6, D
MU100020A,
MU100021A,
MU100022A
5 Warning
Figure 4, E
Figure 5, E
Figure 6, E
Figure 7, E
MU100020A,
MU100021A,
MU100022A
6 Aperture Figure 8, F
MU100020A,
MU100021A,
MU100022A with
option 002
99..1212..33 Laser Radiation MarkingsLaser Radiation Markings
Figure 1: Locations of laser aperture (MU100020A)
Laser SafetyLaser Safety
233233

Figure 2: Locations of laser aperture (MU100021A)
Figure 3: Locations of laser aperture (MU100022A)
Figure 4: Locations of labels (MU100020A, MU100021A, MU100022A withRear panel)
SupportSupport
234234

Figure 5: Locations of labels (MU100020A, MU100021A, MU100022A withMU100010A)
Figure 6: Locations of labels (Bottom side of MU100020A, MU100021A,MU100022A)
Laser SafetyLaser Safety
235235
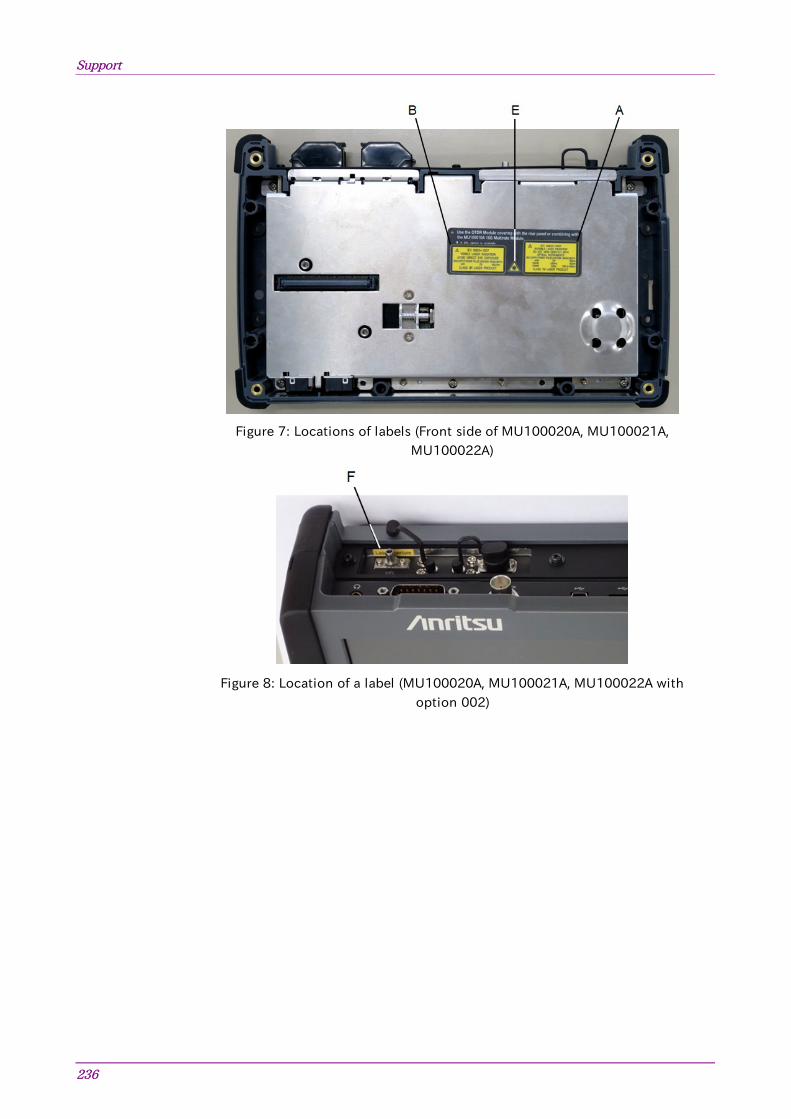
Figure 7: Locations of labels (Front side of MU100020A, MU100021A,MU100022A)
Figure 8: Location of a label (MU100020A, MU100021A, MU100022A withoption 002)
SupportSupport
236236

99..1313 Wireless CertificationWireless Certification
99..1313..11 Japan MICJapan MIC
MT1000A is certified the certification of construction type of specified radio
equipment.
99..1313..22 North America (USA FCC and Canada IC)North America (USA FCC and Canada IC)
This device complies with Industry Canada license-exempt RSS standard(s).
Operation is subject to the following two conditions:
1. This device may not cause interference.
2. This device must accept any interference, including interference that may
cause undesired operation of this device.
Le présent appareil est conforme aux CNR d'Industrie Canada applicables aux
appareils radio exempts de licence. L'exploitation est autorisée aux deux conditions
suivantes :
1. l'appareil ne doit pas produire de brouillage.
2. l'utilisateur de l'appareil doit accepter tout brouillage radioélectrique subi,
même si le brouillage est susceptible d'en compromettre le fonctionnement.
FCC CAUTIONFCC CAUTION
Changes or modifications not expressly approved by the party responsible forcompliance could void the user's authority to operate the equipment.
This transmitter must not be co-located or operated in conjunction with anyother antenna or transmitter.
The available scientific evidence does not show that any health problems areassociated with using low power wireless devices. There is no proof, however,that these low power wireless devices are absolutely safe. Low power Wirelessdevices emit low levels of radio frequency energy (RF) in the microwave rangewhile being used. Whereas high levels of RF can produce health effects (byheating tissue), exposure of low-level RF that does not produce heating effectscauses no known adverse health effects. Many studies of low-level RFexposures have not found any biological effects. Some studies have suggestedthat some biological effects might occur, but such findings have not beenconfirmed by additional research. MT1000A has been tested and found tocomply with FCC/IC radiation exposure limits set forth for an uncontrolledenvironment and meets the FCC radio frequency (RF) Exposure Guidelines andRSS-102 of the IC radio frequency (RF) Exposure rules.
Wireless CertificationWireless Certification
237237

Les connaissances scientifiques dont nous disposons n'ont mis en évidenceaucun probème de santé associé à l'usage des appareils sans fil à faiblepuissance. Nous ne sommes cependant pas en mesure de prouver que cesappareils sans fil à faible puissance sont entièrement sans danger. Les appareilssans fil à faible puissance émettent une énergie radioélectrique (RF) très faibledans le spectre des micro-ondes lorsqu'ils sont utilisés. Alors qu'une doseélevée de RF peut avoir des effets sur la santé (en chauffant les tissus),l'exposition à de faibles RF qui ne produisent pas de chaleur n'a pas demauvais effets connus sur la santé. De nombreuses études ont été menées surles expositions aux RF faibles et n'ont découvert aucun effet biologique.Certaines études ont suggéré qu'il pouvait y avoir certains effets biologiques,mais ces résultats n'ont pas été confirmés par des recherches supplémentaires.MT1000A a été testé et jugé conforme aux limites d'exposition auxrayonnements énoncées pour un environnement non contrôlé et respecte lesrégles les radioélectriques (RF) de la FCC lignes directrices d'exposition etd'exposition aux fréquences radioélectriques (RF) CNR-102 de l'IC.
99..1313..33 Europe CEEurope CE
Hereby, Anritsu Corporation, declares that this instrument is in compliance with the
essential requirements and other relevant provisions of Directive 1999/5/EC.
99..1313..44 Brazil ANATELBrazil ANATEL
This equipment is certified by ANATEL in accordance with the regulatedprocedure by Resolution 242/2000 and meets the applicable technicalrequirements, including exposure limits of Specific Absorption Rate related toelectric fields, magnetic and electromagnetic radio frequency, in accordancewith the Resolution No. 303/2002 and 533/2009. This device complies with the RF exposure guidelines when positioned at least0 cm away from the body. For more information, see the website of ANATEL -www.anatel.gov.br
Este produto está homologado pela Anatel, de acordo com os procedimentosregulamentados pela Resolução n°242/2000 e atende aos requisitos técnicosaplicados, incluindo os limites de exposição da Taxa de Absorção Específicareferente a campos elétricos, magnéticos e eletromagnéticos deradiofrequência, de acordo com as Resoluções n° 303/2002 e 533/2009. Estedispositivo está em conformidade com as diretrizes de exposição áradiofrequência quando posicionado a pelo menos 0 centímetros de distânciado corpo. Para maiores informações, consulte o site da Anatel -www.anatel.gov.br
SupportSupport
238238

99..1313..55 China SRRCChina SRRC
99..1313..66 Indonesia SDPPIIndonesia SDPPI
MT1000A is certified SDPPI wireless certification.
99..1313..77 Israel MoCIsrael MoC
Wireless CertificationWireless Certification
239239

99..1313..88 Mexico IFETELMexico IFETEL
IFETEL certification number: RCPANMT14-0759
The operation of this equipment is subject to the following two conditions:
1. It is possible that this equipment or device may not cause harmful
interference.
2. This equipment or device must accept any interference, including
interference that may cause undesired operation.
La operación de este equipo está sujeta a las siguientes dos condiciones: :
1. es posible que este equipo o dispositivo no cause interferencia prejudicial.
2. este equipo o dispositivo debe aceptar cualquier interferencia, incluyendo la
que pueda causar su operación no deseada.
99..1313..99 Philippines NTCPhilippines NTC
MT1000A is certified NTC wireless certification.
99..1313..1010 Russia CU Scheme and MinsvyazRussia CU Scheme and Minsvyaz
MT1000A is certified CU scheme and Minsvyaz wireless certification.
99..1313..1111 Singapore IMDASingapore IMDA
MT1000A is certified IMDA wireless certification.
99..1313..1212 Thailand NTCThailand NTC
This telecommunication equipment is in compliance with NTC requirements.
SupportSupport
240240

99..1414 DeclarationsDeclarations
99..1414..11 Notes on Export ManagementNotes on Export Management
This product and its manuals may require an Export License/Approval by theGovernment of the product's country of origin for re-export from your country.
Before re-exporting the product or manuals, please contact us to confirmBefore re-exporting the product or manuals, please contact us to confirmwhether whether they are export-controlled items or not.they are export-controlled items or not.
When you dispose of export-controlled items, the products/manuals need to bebroken/shredded so as to be unlawfully used for military purposes.
99..1414..22 Information for EU and EFTA Customers OnlyInformation for EU and EFTA Customers Only
Please recycle the batteryPlease recycle the battery
The product that you have purchased contains a rechargeable battery. Thebattery is recyclable. At the end of its useful life, under various state and locallaws, it may be illegal to dispose of this battery into the municipal waste. Checkwith your local solid-waste disposal officials for details of recycling options orproper disposal in your area.
Before disposing of this product, discharge the battery and mail it to yourAnritsu Service or Sales office.
1. Disconnect the AC adapter, if used.
2. Turn the power switch to on.
3. Leave the product on until the power indicator goes off; the battery is now
discharged.
4. Remove the battery.
5. Insulate the battery terminals with adhesive tape.
6. Please recycle in accordance with your national or regional legislation.
Equipment marked with the Crossed-out Wheeled Bin Symbol complies with councildirective 2012/19/EU (the "WEEE directive") in European Union. For products placed on the EU market after August 13, 2005, please contact your localAnritsu representative at the end of the product's useful life to arrange disposal inaccordance with your initial contract and the local law.
99..1414..33 Information for U.S. Customers OnlyInformation for U.S. Customers Only
Please recycle the batteryPlease recycle the battery
DeclarationsDeclarations
241241

The product that you have purchased contains a rechargeable battery. Thebattery is recyclable. At the end of its useful life, under various state and locallaws, it may be illegal to dispose of this battery into the municipal wastestream. Check with your local solid waste officials for details in your area forrecycling options or proper disposal.
Before disposing of this product, discharge the battery and mail it to yourAnritsu Service or Sales office.
1. Attach the battery pack to the product.
2. Disconnect the AC adapter, if used.
3. Turn the power switch to ON.
4. Leave the product on until the power indicator goes off; the battery is now
discharged.
5. Remove the battery.
6. Insulate the battery terminals with adhesive tape.
7. Mail it to your Anritsu Service or Sales office, or to the address shown below.
ANRITSU COMPANY 490 Jarvis Drive, Morgan Hill, CA 95037-2809, USA
99..1414..44 Information for the Chinese Market OnlyInformation for the Chinese Market Only
Concerning declaration of China RoHS, please see the note below.
China RoHS is not 100% identical to the European (EU) RoHS. EU RoHS has exemptionsfor Pb and Hg in various alloys, soldering, displays and other products. The China RoHSdeclaration in the next table does NOTNOT comply with EU RoHS.
SupportSupport
242242