alfresco day barcelona 2016 - developer track - herramientas para administradores, el modulo...
TRANSCRIPT

AlfrescoSupportAdminTools
AntonioSolerPremierAdvanceSupportEngineerEMEA

CONTENIDO:
● Presentación
● Dependencias
● Características● Casos de uso.

OVERVIEW
Presentación
● Alfresco no es una aplicación fácil de mantener, necesitamos herramientas de diagnostico y monitorización externas para analizar problemas de rendimiento o ajustar parámetros de customizaciones y configuraciones especificas de un caso de uso. (Herramientas tales como jstack, jVisualVM , Yourkit, etc).
04/FEB/2016

OVERVIEW
En compañías de tamaño medio las labores de administración normalmente son llevadas a cabo por un solo “hombre orquesta”.

OVERVIEW
En grandes empresas la investigación o configuración de una característica del sistema puede requerir involucrar a diferentes personas: Alfresco admin, sysAdmin, DBAdmin, Developer , network admin, DevOps, project Manager … esto en el mejor de los casos son 4 o 5 personas ...

Investigacióndeunproblema
Hombre orquesta:•Es un tipo hábil en todos los terrenos.
•Alfresco no es su única responsabilidad.
•No esta especializado en ningún campo… no tiene herramientas adecuadas.
•Las labores requieren que el admin aprenda a usar herramientas externas para mantener Alfresco
Equipo DevOps:•No todos están disponibles a la vez.
•Alfresco no es su única responsabilidad.
•Tareas tan simples como poner una clase en DEBUG y mirar el log requieren de varios días (envío petición para cambiarla, esperar un día, mandar petición para una copia del log…)
•Las restricciones de seguridad pueden dificultarnos hacer la labor de diagnostico/mantenimiento.

Dependencias
La forma de controlar tradicionalmente como esta funcionando la aplicación en una JVM es a través de JMX (Java Management Extension), que nos da acceso a los Management Beans (MBeans) y los parámetros de monitorizables de la JVM. (JMX solo esta disponible en la versión Enterprise de Alfresco)
Desde la versión Alfresco 4.2.0 hemos agregado visibilidad desde la JS API a los objetos de la JMX.

Dependencies
● Las herramientas aparecerán en la nueva consola de administración de Alfresco.
● Sample URL http://127.0.0.1:8080/alfresco/s/enterprise/admin/

Dependencies
● Los graficos en vivo usan el objeto CANVAS del navegador,
Internet Explorer Firefox
Safari (Desktop) Chrome
Opera (Desktop) Safari
(Mobile) Opera
(Mobile) Android
Browser
6.0 2.0 - 6.0 3.1 - 3.2 4.0 - 13.0 9.0 - 11.0 3.2 10.0 2.0
7.0 7.0 4.0 14.0 11.1 4.0 11.0 2.1
8.0 8.0 5.0 15.0 11.5 4.2 - 4.3 11.1 2.3,3.0
9.0 9.0 5.1 16.0 11.6 5.0 11.5 4.0
● Para los graficos en vivo uso la libreria http://smoothiecharts.org/

Dependencies
JMXLogger
• "Tail" operation relies on a custom log4 appender called "JMXLogger" that I took from log4j and added 2 new jmx bean operations, "settailsize" and "tail", you can see them through Jconsole Mbeans tab. ( source of my customized version on support svn)
• In order to work this requires to add to the file [tomcat]/webapps/alfresco/WEB-INF/clasees/log4j.properties this configuration:
log4j.rootLogger=error, Console, File, jmxlogger1log4j.appender.jmxlogger2=jmxlogger.integrati on.l og4j.JmxLogAppenderlog4j.appender.jmxlogger2.layout=org.apache.log4j.PatternLayoutlog4j.appender.jmxlogger2.layout.ConversionPatter n=%-5p %c[1] - %m%nlog4j.appender.jmxlogger2.ObjectN ame=jmxlogger:type=LogEmitterAlfrescolog4j.appender.jmxlogger2.threshold=debuglog4j.appender.jmxlogger2.serverSel ection=platform
• And copy the file /lib/jmxlogger-log4j-0.1.0-AlfrescoPatched.jar to [tomcat]/webapps/alfresco/WEB-INF/lib/
Dependencies
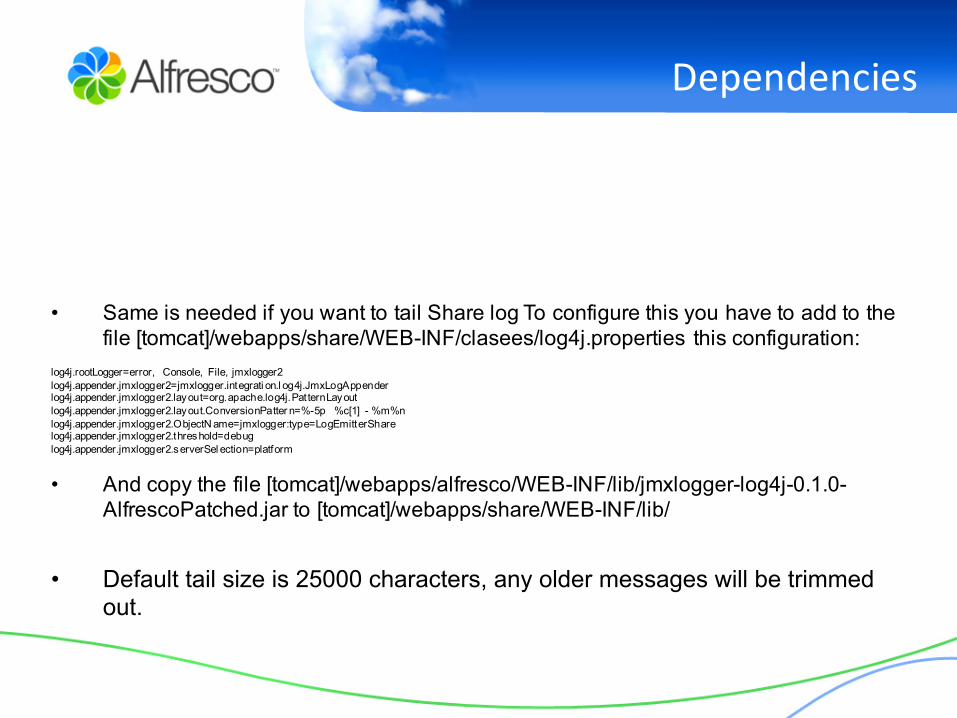
• Same is needed if you want to tail Share log To configure this you have to add to the file [tomcat]/webapps/share/WEB-INF/clasees/log4j.properties this configuration:
log4j.rootLogger=error, Console, File, jmxlogger2log4j.appender.jmxlogger2=jmxlogger.integrati on.l og4j.JmxLogAppenderlog4j.appender.jmxlogger2.layout=org.apache.log4j.PatternLayoutlog4j.appender.jmxlogger2.layout.ConversionPatter n=%-5p %c[1] - %m%nlog4j.appender.jmxlogger2.ObjectN ame=jmxlogger:type=LogEmitterSharelog4j.appender.jmxlogger2.threshold=debuglog4j.appender.jmxlogger2.serverSel ection=platform
• And copy the file [tomcat]/webapps/alfresco/WEB-INF/lib/jmxlogger-log4j-0.1.0-AlfrescoPatched.jar to [tomcat]/webapps/share/WEB-INF/lib/
• Default tail size is 25000 characters, any older messages will be trimmed out.
Features
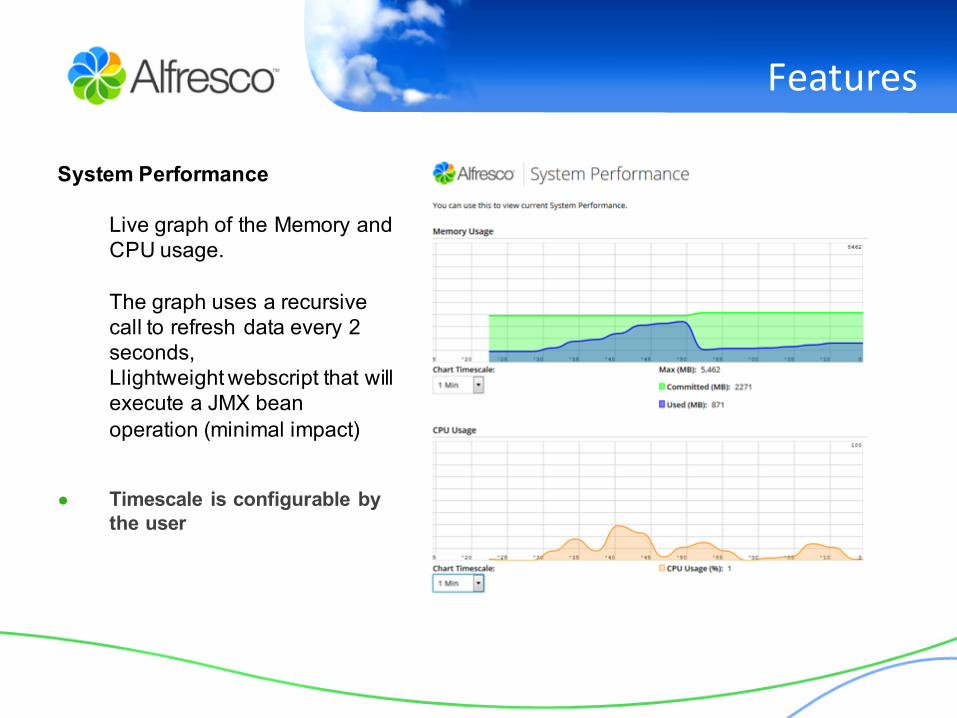
System Performance
Live graph of the Memory and CPU usage.
The graph uses a recursive call to refresh data every 2 seconds, Llightweight webscript that will execute a JMX bean operation (minimal impact)
● Timescale is configurable by the user
Features
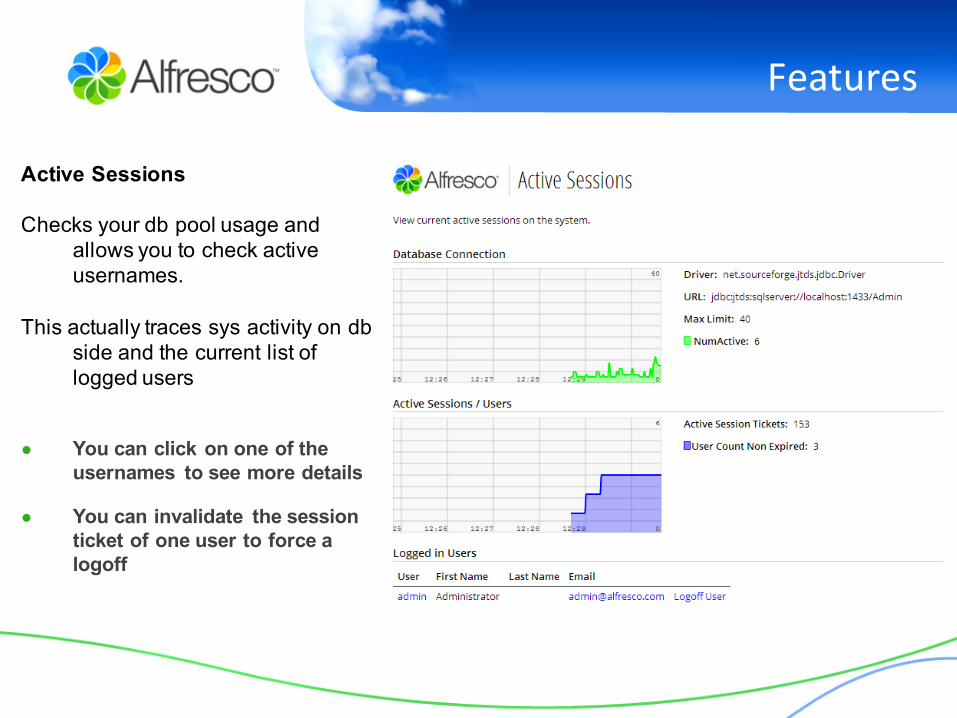
Active Sessions
Checks your db pool usage and allows you to check active usernames.
This actually traces sys activity on dbside and the current list of logged users
● You can click on one of the usernames to see more details
● You can invalidate the session ticket of one user to force a logoff

Features
HOT THREADS
Based on the famous java too, calculates CPU usage.
The script calculates the CPU during 5 seconds and displays the stack trace of the 5 more consuming threads.
● You can generate some of them and save them to send them to support

Features
Thread dump
to troubleshoot performance problems and deadlocks
You can generate as many as you need and navigate through them to compare. Save all and study later (this may not work on IE8 due the functions used to save, copy and paste then manually).
I've formated the output to lookalike the Jstack
Features
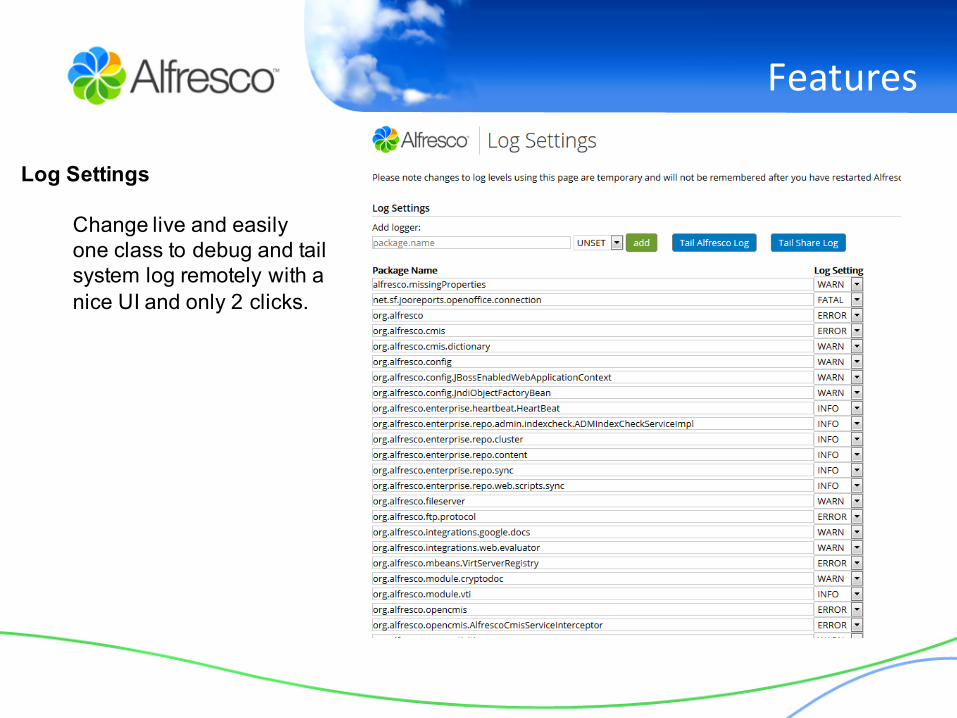
Log Settings
Change live and easily one class to debug and tail system log remotely with a nice UI and only 2 clicks.

Features
TAIL
See Live the system log, also the timestamp and with a color code to differentiate the ERROR WARNS, DEBUG, …
UI forAutorefresh on/off and allows to get a txt only version for support
Features
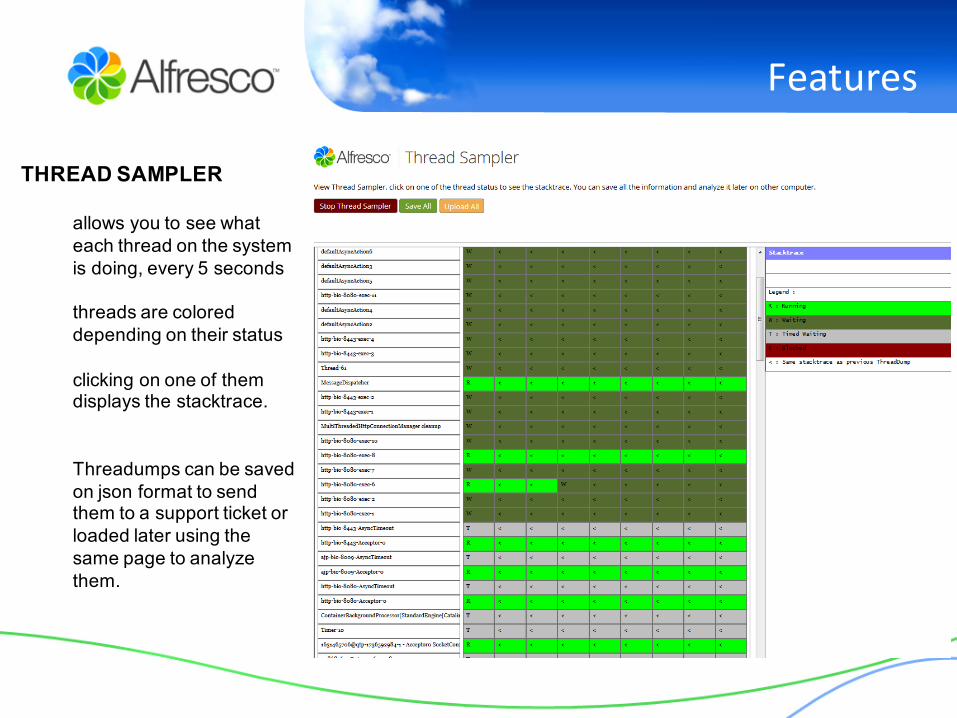
THREAD SAMPLER
allows you to see what each thread on the system is doing, every 5 seconds
threads are coloreddepending on their status
clicking on one of them displays the stacktrace.
Threadumps can be saved on json format to send them to a support ticket or loaded later using the same page to analyzethem.

Features
THREAD SAMPLER
allows you to see what each thread on the system is doing, every 5 seconds
threads are coloreddepending on their status
clicking on one of them displays the stacktrace.
Threadumps can be saved on json format to send them to a support ticket or loaded later using the same page to analyzethem.
Features
Apart from that there are 2 little tools that could be helpful on some cases
JMX Settings on the DB
To find which beans have values overridden from the DB and revert them to the values on the properties files, use with care
Test Transformation
Transformation settings and test transformations.Transformations limits can be changed from here and also add and configure an extra
transformer.To test some dummy files are added internally but not all mimetypes.

Contents:
● Acknowledgments
Special thanks to:Mike Farman for his support on this project and parts of the code.
Marco Mancuso for his help on the development and adapting it to Maven standards.
Rich McKnight for his code to access the persisted Mbeans on the DB.
Jamie Allison for his code review, "polish" and improvements.
Will Abson for his useful advice.
The Smoothie Charts creators: http:smoothiecharts.org/ the library from which was quite useful and fun to use
J
Source code on Github: Alfresco Support toolsThanks for watching...