alfalfa fertilization strategies alfalfa...and tissue tests are included. before applying fertilizer...
TRANSCRIPT
Alfalfa Fertilization StrategiesRoland D. MeyerCooperative Extension Specialist Emeritus, Department of Land, Air, and Water Resources, University of California, Davis
Daniel B. MarcumFarm Advisor, University of California Cooperative Extension, McArthur, CA
Steve B. OrloffFarm Advisor, University of California Cooperative Extension, Yreka, CA
Jerry L. SchmiererFarm Advisor, University of California Cooperative Extension, Colusa, CA
Providing an adequate supply of nutrients is important for alfalfa production and is essential for maintaining high and profitable yields. However, supplying proper plant nutri-
tion requires complex and often difficult management decisions. The process includes an analysis of which nutrients are needed, selection of the proper fertilizer, application rate, timing and placement, economics, record keeping, and environmental con-siderations. This chapter serves as a guide to alfalfa fertilization in the arid and semi-arid alfalfa production regions of the world, which include the Sacramento, San Joaquin, and Imperial Valleys of California, and coastal valley regions of the state. Information on appropriate methods of sampling alfalfa and interpreting soil and tissue tests are included.
Before applying fertilizer to alfalfa, consider other factors that may limit yield. It makes little sense to apply fertiliz-ers when another factor is more limiting to plant growth. For example, an application of phosphorus, even when phosphorus is deficient, may not increase yields if water is not sufficient to
Chapter 6Corresponding Author: Roland D. Meyer ([email protected])
This publication is Chapter 6 of a 24-chapter series on Irrigated Alfalfa Management published by the University of California Alfalfa & Forage Systems Workgroup. Citation: Meyer, R. D.; Marcum, D. B.; Orloff, S. B.; Schmierer, J. L. 2007. Alfalfa fer-tilization strategies. IN C. G. Summers and D. H. Putnam, eds., Irrigated alfalfa management for Mediterranean and Desert zones. Chapter 6. Oakland: University of California Agriculture and Natural Resources Publication 8292. See: http://alfalfa.ucdavis.edu/IrrigatedAlfalfa
Irrigated Alfalfa Managementfor Mediterranean and Desert Zones
UNIVERSITY OF CALIFORNIA
Division of Agriculture and Natural Resources
Publication 8292
12/2007
http://anrcatalog.ucdavis.edu
UCD Alfa
lfa
Wor
kgro
up

allow plants to grow in response to the applied fertilizer.
Since historical trends help with man-agement decisions, thorough, well-organized records of plant tissue and soil-test information are important. Records should include infor-mation about date of sampling; crop yield and fertilizer application history; and, most impor-tantly, the location of the samples. The advent of GPS (global positioning system) technology provides for accurate location of where samples are taken, allowing the sampler to return to the same location for future sampling.
Essential Plant Nutrients
Seventeen elements are needed, in varying amounts, for plant growth (see Table 6.1). Carbon, hydrogen, and oxygen come from water and from carbon dioxide in the air. The other 14 elements are obtained from either the soil or fixation of atmospheric nitrogen by bac-teria in root nodules. Another nutrient, cobalt, is essential to legumes for nitrogen fixation. Growth slows or stops when a plant is unable to obtain one or more of the essential elements. Thus, all nutrients must be available to the plant in adequate quantities throughout the production season. The nutrients that are most commonly in short supply for alfalfa produc-tion are phosphorus, followed by potassium, sulfur, molybdenum, and boron (Table 6.1).
Diagnosis of Nutrient Deficiencies
A key aspect of designing a fertilization pro-gram is evaluating the nutritional status of the alfalfa crop. Nutritional status can be evaluated by visual observation, soil analysis, or plant tissue testing. Using all three in combination provides the best results.
Visual Observation
Nutrient deficiencies may be expressed as visual plant symptoms, such as obvious plant stunting or yellowing. Table 6.2 summarizes visual symptoms of common deficiencies (also see Color Plates 6.1 through 6.7 at the end of this chapter). Unfortunately, visual symptoms are seldom definitive and can be easily con-fused or mistaken for symptoms caused by other factors, such as insect injury, diseases, excess water, salt or water stress, restricted root growth, or rodent damage. Additionally, sig-nificant yield losses may have already occurred by the time the symptoms appear. Thus, visual diagnosis should always be confirmed with laboratory analysis or test strips with selected fertilizers.
TAblE 6.1Common nutritional and fertilizer requirements of alfalfa in arid and semi-arid regions
ElementNeeded Symbol
FertilizerRequireda
Nitrogen N Seldom
Phosphorus P Frequently
Potassium K Less frequently
Calciumb Ca Never
Magnesium Mg Less frequently
Sulfurc S Less frequently
Iron Fe Never
Manganese Mn Never
Chlorine Cl Never
Boron B Seldom
Zinc Zn Never
Copper Cu Never
Molybdenumd Mo Less frequently
Nickel Ni Never
Cobalte Co Never
a. Frequently: 25% or more of the acreage shows need for fertilization with this nutrient. Less frequently: Less than 25% of the acreage shows need for fertilization.
Seldom: Less than 1% of the acreage shows need for fertilization. Never: A deficiency has never been reported or observed.b. Liming materials containing calcium are used for pH amendment of acid
soils.c. Various forms of sulfur are used for soil salinity management.d. Needed in Sacramento Valley but may be in excess in San Joaquin and
Imperial Valleys and coastal valleys.e. Necessary for nitrogen fixation only.
A l f a l f a Fe r t i l i z at i o n St r ate gi e s A N R P u b l i c a t i o n 8 2 92 2
UCD Alfa
lfa
Wor
kgro
up
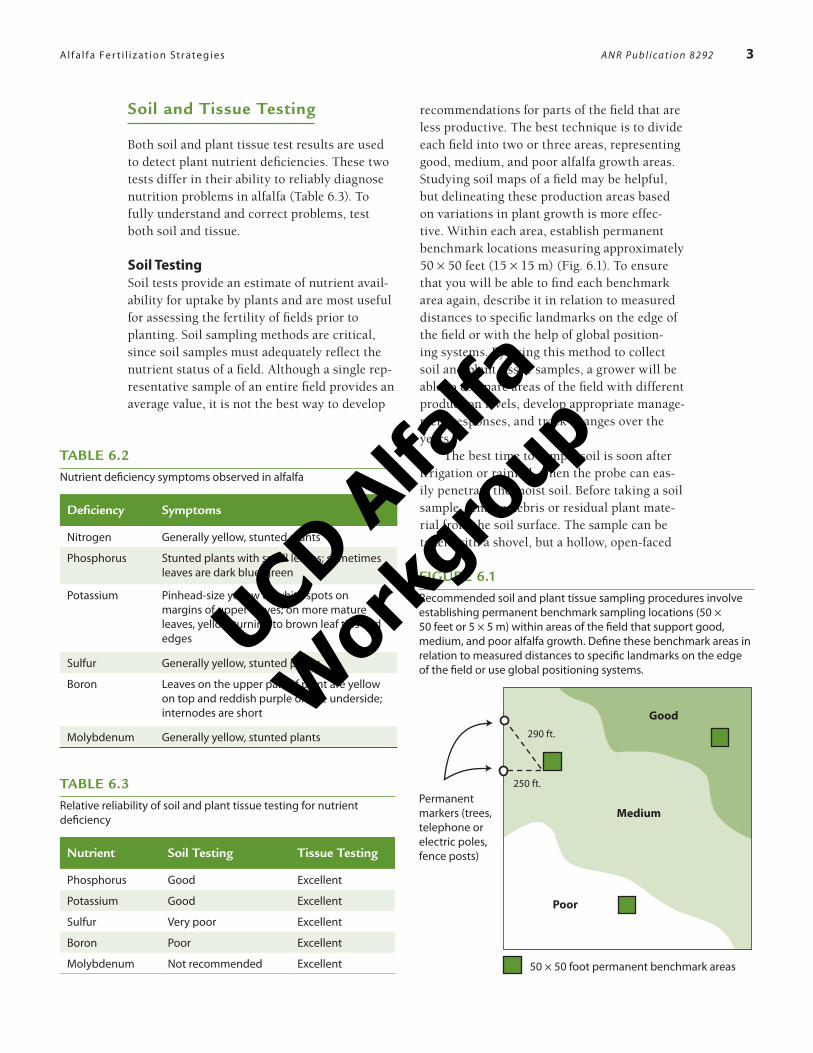
TAblE 6.2Nutrient deficiency symptoms observed in alfalfa
Deficiency Symptoms
Nitrogen Generally yellow, stunted plants
Phosphorus Stunted plants with small leaves; sometimes leaves are dark blue-green
Potassium Pinhead-size yellow or white spots on margins of upper leaves; on more mature leaves, yellow turning to brown leaf tips and edges
Sulfur Generally yellow, stunted plants
Boron Leaves on the upper part of plant are yellow on top and reddish purple on the underside; internodes are short
Molybdenum Generally yellow, stunted plants
TAblE 6.3 Relative reliability of soil and plant tissue testing for nutrient deficiency
Nutrient Soil Testing Tissue Testing
Phosphorus Good Excellent
Potassium Good Excellent
Sulfur Very poor Excellent
Boron Poor Excellent
Molybdenum Not recommended Excellent 50 × 50 foot permanent benchmark areas
290 ft.
250 ft.
Good
Medium
Poor
Permanent markers (trees, telephone or electric poles, fence posts)
FiguRE 6.1Recommended soil and plant tissue sampling procedures involve establishing permanent benchmark sampling locations (50 × 50 feet or 5 × 5 m) within areas of the field that support good, medium, and poor alfalfa growth. Define these benchmark areas in relation to measured distances to specific landmarks on the edge of the field or use global positioning systems.
Soil and Tissue Testing
Both soil and plant tissue test results are used to detect plant nutrient deficiencies. These two tests differ in their ability to reliably diagnose nutrition problems in alfalfa (Table 6.3). To fully understand and correct problems, test both soil and tissue.
Soil TestingSoil tests provide an estimate of nutrient avail-ability for uptake by plants and are most useful for assessing the fertility of fields prior to planting. Soil sampling methods are critical, since soil samples must adequately reflect the nutrient status of a field. Although a single rep-resentative sample of an entire field provides an average value, it is not the best way to develop
recommendations for parts of the field that are less productive. The best technique is to divide each field into two or three areas, representing good, medium, and poor alfalfa growth areas. Studying soil maps of a field may be helpful, but delineating these production areas based on variations in plant growth is more effec-tive. Within each area, establish permanent benchmark locations measuring approximately 50 × 50 feet (15 × 15 m) (Fig. 6.1). To ensure that you will be able to find each benchmark area again, describe it in relation to measured distances to specific landmarks on the edge of the field or with the help of global position-ing systems. By using this method to collect soil and plant tissue samples, a grower will be able to compare areas of the field with different production levels, develop appropriate manage-ment responses, and track changes over the years.
The best time to sample soil is soon after irrigation or rainfall, when the probe can eas-ily penetrate the moist soil. Before taking a soil sample, remove debris or residual plant mate-rial from the soil surface. The sample can be taken with a shovel, but a hollow, open-faced
Al f a l f a Fe r t i l i z at i o n St r ate gi e s A N R P u b l i c a t i o n 8 2 92 3
UCD Alfa
lfa
Wor
kgro
up
TAblE 6.4 Suggested tests for a complete examination of soil and alfalfa tissue
Soil Plant Tissue
pHa Phosphorus (PO4–P)
Phosphorus Potassium
Potassium Sulfur (SO4–S)
ECea Boron
Calcium, Magnesium, Sodiuma Molybdenum
SARa Copper
a. These tests evaluate factors that affect the availability of nutrients and the presence of undesirable salt levels. ECe = electrical conductivity of saturated paste extract (dS/m or mmho/cm); SAR = sodium adsorption ratio.
TAblE 6.5Interpretation of soil test results for alfalfa production
Soil Value (ppm)a
Nutrient Extractb Deficient Marginal Adequate High
Phosphorus Bicarbonate <5 5–10 10–20 >20
Potassium Ammonium acetate
<40 40–80 80–125 >125
Boron Saturated paste 0.1c 0.1–0.2 0.2–0.4 >0.4d
a. An economic yield response to fertilizer application is very likely for values below the deficient level, somewhat likely for values in the marginal range, and unlikely for values over the adequate level.
b. Soil test values are based on use of the cited extract; values for other extracts are different.c. Soil testing is not a suitable method to diagnose a deficiency. Use a plant tissue test.d. Possible toxicity to sensitive crops, such as cereals.
Plant tissue testing…by far the most precise method of determining the nutrient needs of alfalfa.
tube, such as an Oakfield soil probe, is pre-ferred. Sample the top 6–8 inches (15–20 cm) of soil unless a salt problem or an acidic soil is suspected. If this is likely, then the second foot (12–24 inches [30–60 cm]) and even the third foot (24–36 inches [60–90 cm]) should also be sampled. Take 15 to 20 cores at random from each benchmark area and mix them thoroughly in a plastic bucket to produce a single 1-pint (0.47 L) composite sample for each benchmark area. Since there is usually less variability, only 8 to 12 cores need to be composited for the sec-ond- and third-foot samples. Place each sample in a separate double-thick paper bag and air dry the soil at room temperature before mailing to the laboratory. To get a complete assessment of the nutrition status of an alfalfa field, perform all the soil and tissue tests cited in Table 6.4. A
list of laboratories is found in University of California Special Publication 3024, California Commercial Laboratories Providing Agricultural Testing.
Taking soil samples every year may not be necessary once his-torical trends have been established. Sampling benchmark areas every time alfalfa is planted is usually sufficient to establish trends. If poor alfalfa growth is observed in other parts of the field, take sam-ples from both good and poor growth areas so the fertility level of the two areas can be com-pared. Table 6.5 lists guidelines for interpreting soil test results with values given for deficient, marginal, adequate, and high levels. An eco-nomic yield response to fertilizer application is very likely for values below the deficient level, somewhat likely for values in the marginal level, and unlikely for values over the adequate level (Table 6.5).
Plant Tissue TestingThe most precise method of determining the nutrient needs of alfalfa is plant tissue testing. Although soil tests are helpful, plant tissue tests are the best reflection of what the plant has taken up and are far more accurate than soil tests, particularly for sulfur, boron, and molybdenum. Plant tissue tests are useful in monitoring nutritional status and evaluating
the effectiveness of current fertilization practices.
The best time to take a tissue sample is when the crop is at the one-tenth bloom growth stage or when regrowth length measures ¼–½ inch (0.6–1.3 cm). Since alfalfa is often cut before one-tenth bloom (e.g., bud stage) to attain high-quality forage, preliminary
Al f a l f a Fe r t i l i z at i o n St r ate gi e s A N R P u b l i c a t i o n 8 2 92 4
UCD Alfa
lfa
Wor
kgro
up
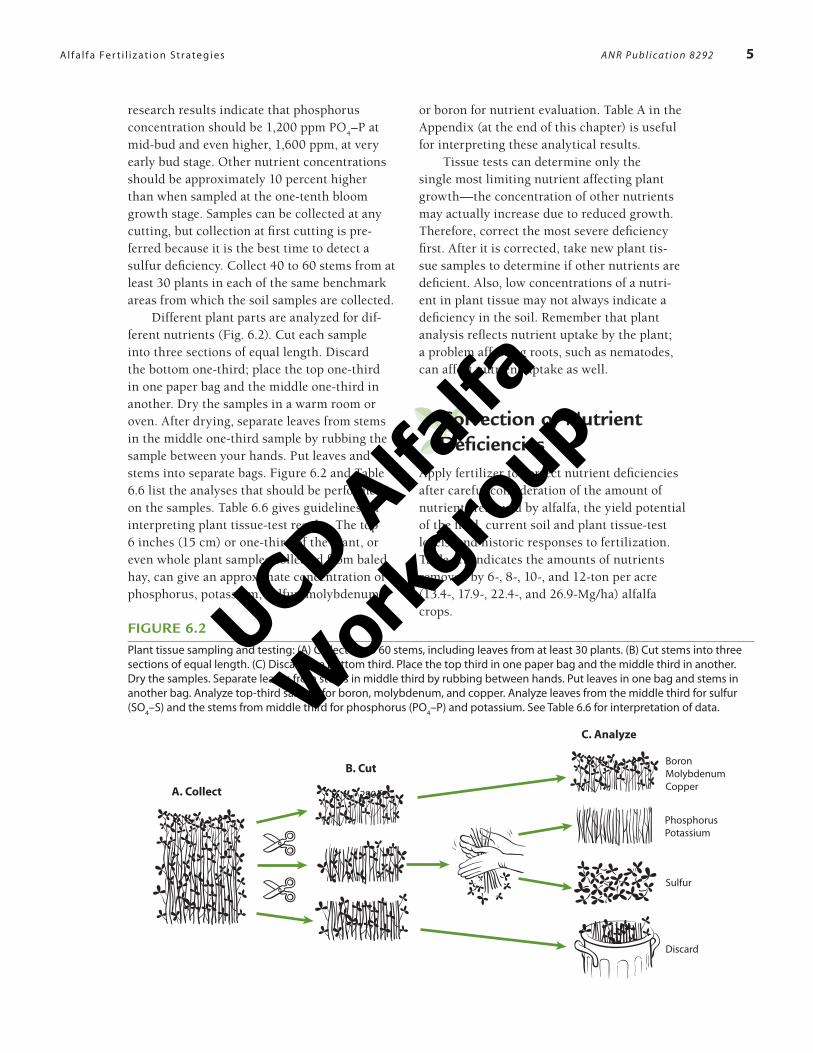
FiguRE 6.2Plant tissue sampling and testing: (A) Collect 40 to 60 stems, including leaves from at least 30 plants. (B) Cut stems into three sections of equal length. (C) Discard the bottom third. Place the top third in one paper bag and the middle third in another. Dry the samples. Separate leaves from stems in middle third by rubbing between hands. Put leaves in one bag and stems in another bag. Analyze top-third sample for boron, molybdenum, and copper. Analyze leaves from the middle third for sulfur (SO4–S) and the stems from middle third for phosphorus (PO4–P) and potassium. See Table 6.6 for interpretation of data.
290 ft.A. Collect
B. Cut
C. Analyze
BoronMolybdenumCopper
PhosphorusPotassium
Sulfur
Discard
research results indicate that phosphorus concentration should be 1,200 ppm PO
4–P at
mid-bud and even higher, 1,600 ppm, at very early bud stage. Other nutrient concentrations should be approximately 10 percent higher than when sampled at the one-tenth bloom growth stage. Samples can be collected at any cutting, but collection at first cutting is pre-ferred because it is the best time to detect a sulfur deficiency. Collect 40 to 60 stems from at least 30 plants in each of the same benchmark areas from which the soil samples are collected.
Different plant parts are analyzed for dif-ferent nutrients (Fig. 6.2). Cut each sample into three sections of equal length. Discard the bottom one-third; place the top one-third in one paper bag and the middle one-third in another. Dry the samples in a warm room or oven. After drying, separate leaves from stems in the middle one-third sample by rubbing the sample between your hands. Put leaves and stems into separate bags. Figure 6.2 and Table 6.6 list the analyses that should be performed on the samples. Table 6.6 gives guidelines for interpreting plant tissue-test results. The top 6 inches (15 cm) or one-third of the plant, or even whole plant samples collected from baled hay, can give an approximate concentration of phosphorus, potassium, sulfur, molybdenum,
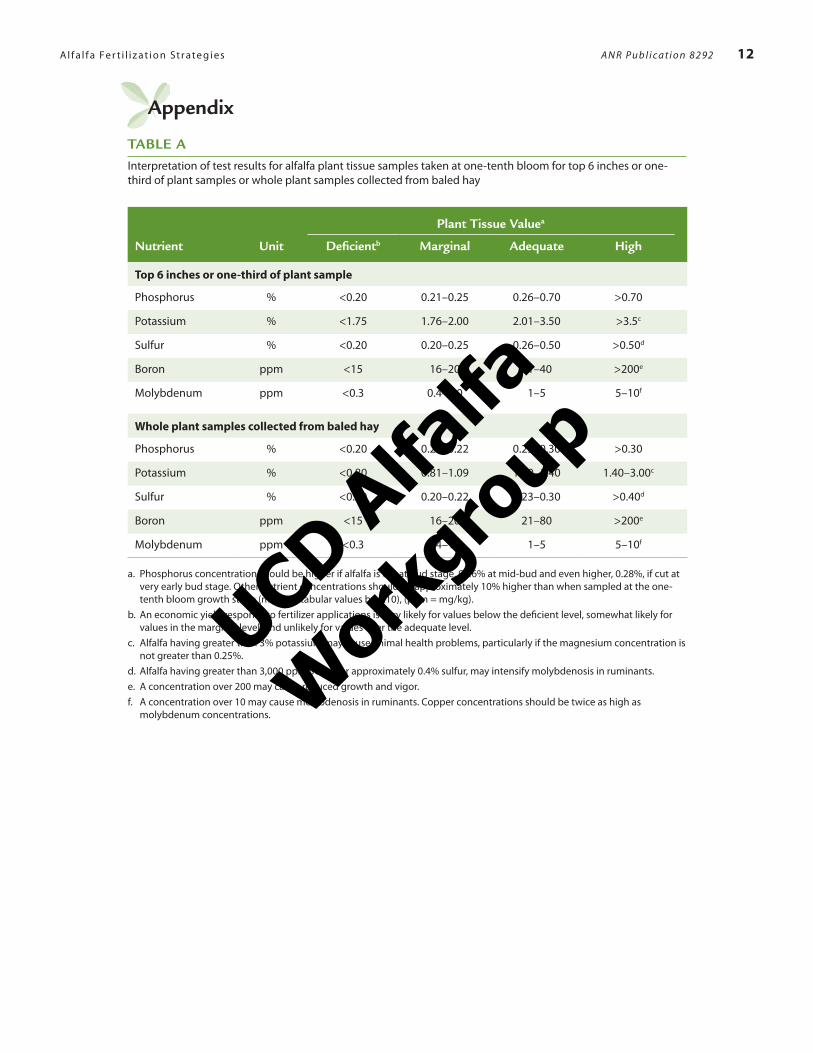
or boron for nutrient evaluation. Table A in the Appendix (at the end of this chapter) is useful for interpreting these analytical results.
Tissue tests can determine only the single most limiting nutrient affecting plant growth—the concentration of other nutrients may actually increase due to reduced growth. Therefore, correct the most severe deficiency first. After it is corrected, take new plant tis-sue samples to determine if other nutrients are deficient. Also, low concentrations of a nutri-ent in plant tissue may not always indicate a deficiency in the soil. Remember that plant analysis reflects nutrient uptake by the plant; a problem affecting roots, such as nematodes, can affect nutrient uptake as well.
Correction of Nutrient Deficiencies
Apply fertilizer to correct nutrient deficiencies after careful consideration of the amount of nutrients removed by alfalfa, the yield potential of the field, current soil and plant tissue-test levels, and historic responses to fertilization. Table 6.7 indicates the amounts of nutrients removed by 6-, 8-, 10-, and 12-ton per acre (13.4-, 17.9-, 22.4-, and 26.9-Mg/ha) alfalfa crops.
Al f a l f a Fe r t i l i z at i o n St r ate gi e s A N R P u b l i c a t i o n 8 2 92 5
UCD Alfa
lfa
Wor
kgro
up
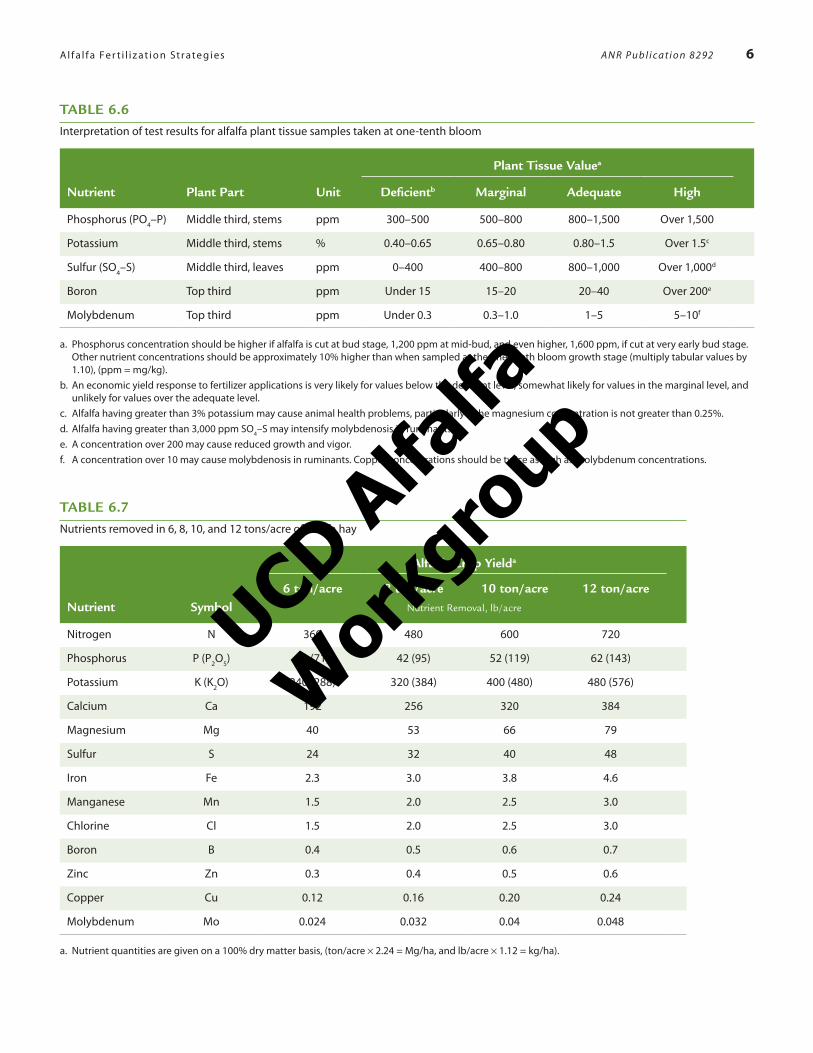
TAblE 6.6Interpretation of test results for alfalfa plant tissue samples taken at one-tenth bloom
Plant Tissue Valuea
Nutrient Plant Part unit Deficientb Marginal Adequate High
Phosphorus (PO4–P) Middle third, stems ppm 300–500 500–800 800–1,500 Over 1,500
Potassium Middle third, stems % 0.40–0.65 0.65–0.80 0.80–1.5 Over 1.5c
Sulfur (SO4–S) Middle third, leaves ppm 0–400 400–800 800–1,000 Over 1,000d
Boron Top third ppm Under 15 15–20 20–40 Over 200e
Molybdenum Top third ppm Under 0.3 0.3–1.0 1–5 5–10f
a. Phosphorus concentration should be higher if alfalfa is cut at bud stage, 1,200 ppm at mid-bud, and even higher, 1,600 ppm, if cut at very early bud stage. Other nutrient concentrations should be approximately 10% higher than when sampled at the one-tenth bloom growth stage (multiply tabular values by 1.10), (ppm = mg/kg).
b. An economic yield response to fertilizer applications is very likely for values below the deficient level, somewhat likely for values in the marginal level, and unlikely for values over the adequate level.
c. Alfalfa having greater than 3% potassium may cause animal health problems, particularly if the magnesium concentration is not greater than 0.25%.d. Alfalfa having greater than 3,000 ppm SO4–S may intensify molybdenosis in ruminants.e. A concentration over 200 may cause reduced growth and vigor.f. A concentration over 10 may cause molybdenosis in ruminants. Copper concentrations should be twice as high as molybdenum concentrations.
TAblE 6.7Nutrients removed in 6, 8, 10, and 12 tons/acre of alfalfa hay
Nutrient Symbol
Alfalfa Crop Yielda
6 ton/acre 8 ton/acre 10 ton/acre 12 ton/acreNutrient Removal, lb/acre
Nitrogen N 360 480 600 720
Phosphorus P (P2O5) 31 (71) 42 (95) 52 (119) 62 (143)
Potassium K (K2O) 240 (288) 320 (384) 400 (480) 480 (576)
Calcium Ca 192 256 320 384
Magnesium Mg 40 53 66 79
Sulfur S 24 32 40 48
Iron Fe 2.3 3.0 3.8 4.6
Manganese Mn 1.5 2.0 2.5 3.0
Chlorine Cl 1.5 2.0 2.5 3.0
Boron B 0.4 0.5 0.6 0.7
Zinc Zn 0.3 0.4 0.5 0.6
Copper Cu 0.12 0.16 0.20 0.24
Molybdenum Mo 0.024 0.032 0.04 0.048
a. Nutrient quantities are given on a 100% dry matter basis, (ton/acre × 2.24 = Mg/ha, and lb/acre × 1.12 = kg/ha).
A l f a l f a Fe r t i l i z at i o n St r ate gi e s A N R P u b l i c a t i o n 8 2 92 6
UCD Alfa
lfa
Wor
kgro
up
Applying nitrogen fertilizer to alfalfa is seldom beneficial or profitable. Adequate nitrogen is provided by the symbiotic nitrogen-fixing bacteria (Rhizobium meliloti Dang.) that live in nodules on alfalfa roots.
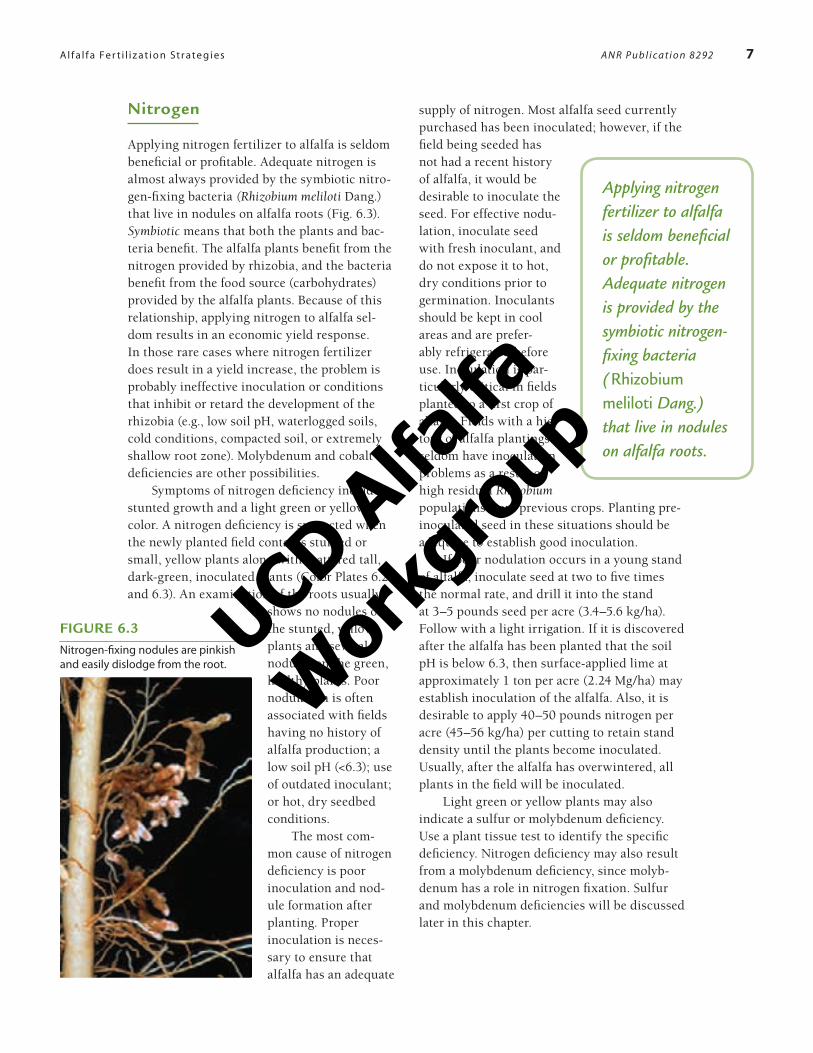
FiguRE 6.3Nitrogen-fixing nodules are pinkish and easily dislodge from the root.
Nitrogen
Applying nitrogen fertilizer to alfalfa is seldom beneficial or profitable. Adequate nitrogen is almost always provided by the symbiotic nitro-gen-fixing bacteria (Rhizobium meliloti Dang.) that live in nodules on alfalfa roots (Fig. 6.3). Symbiotic means that both the plants and bac-teria benefit. The alfalfa plants benefit from the nitrogen provided by rhizobia, and the bacteria benefit from the food source (carbohydrates) provided by the alfalfa plants. Because of this relationship, applying nitrogen to alfalfa sel-dom results in an economic yield response. In those rare cases where nitrogen fertilizer does result in a yield increase, the problem is probably ineffective inoculation or conditions that inhibit or retard the development of the rhizobia (e.g., low soil pH, waterlogged soils, cold conditions, compacted soil, or extremely shallow root zone). Molybdenum and cobalt deficiencies are other possibilities.
Symptoms of nitrogen deficiency include stunted growth and a light green or yellow color. A nitrogen deficiency is suspected when the newly planted field contains stunted or small, yellow plants along with scattered tall, dark-green, inoculated plants (Color Plates 6.2 and 6.3). An examination of the roots usually
shows no nodules on the stunted, yellow plants and several nodules on the green, healthy plants. Poor nodulation is often associated with fields having no history of alfalfa production; a low soil pH (<6.3); use of outdated inoculant; or hot, dry seedbed conditions.
The most com-mon cause of nitrogen deficiency is poor inoculation and nod-ule formation after planting. Proper inoculation is neces-sary to ensure that alfalfa has an adequate
supply of nitrogen. Most alfalfa seed currently purchased has been inoculated; however, if the field being seeded has not had a recent history of alfalfa, it would be desirable to inoculate the seed. For effective nodu-lation, inoculate seed with fresh inoculant, and do not expose it to hot, dry conditions prior to germination. Inoculants should be kept in cool areas and are prefer-ably refrigerated before use. Inoculation is par-ticularly critical in fields planted to a first crop of alfalfa. Fields with a his-tory of alfalfa plantings seldom have inoculation problems as a result of high residual Rhizobium populations from previous crops. Planting pre-inoculated seed in these situations should be adequate to establish good inoculation.
If poor nodulation occurs in a young stand of alfalfa, inoculate seed at two to five times the normal rate, and drill it into the stand at 3–5 pounds seed per acre (3.4–5.6 kg/ha). Follow with a light irrigation. If it is discovered after the alfalfa has been planted that the soil pH is below 6.3, then surface-applied lime at approximately 1 ton per acre (2.24 Mg/ha) may establish inoculation of the alfalfa. Also, it is desirable to apply 40–50 pounds nitrogen per acre (45–56 kg/ha) per cutting to retain stand density until the plants become inoculated. Usually, after the alfalfa has overwintered, all plants in the field will be inoculated.
Light green or yellow plants may also indicate a sulfur or molybdenum deficiency. Use a plant tissue test to identify the specific deficiency. Nitrogen deficiency may also result from a molybdenum deficiency, since molyb-denum has a role in nitrogen fixation. Sulfur and molybdenum deficiencies will be discussed later in this chapter.
Al f a l f a Fe r t i l i z at i o n St r ate gi e s A N R P u b l i c a t i o n 8 2 92 7
UCD Alfa
lfa
Wor
kgro
up

TAblE 6.8Recommended phosphorus and potassium application rates based on results of soil or plant tissue tests
Soil or Plant Tissue Test Result
NutrientYield level Deficienta Marginal Adequate
(ton/acre) Application Rate, lb/acre
Phosphorus (P2O5) 8 120–180 60–90 0–45
12 180–270 90–130 0–60
Potassium (K2O) 8 300–400 150–200 0–100
12 400–600 200–300 0–150
a. An economic yield response to fertilizer applications is very likely for values below the deficient level, somewhat likely for values in the marginal level, and unlikely for values over the adequate level (ton/acre × 2.24 = Mg/ha; lb/acre × 1.12 = kg/ha).
Phosphorus
Phosphorus is the most commonly deficient nutrient in alfalfa in the Sacramento, San Joaquin, and Imperial Valleys, in coastal California valleys, and in many other alfalfa producing environments in Mediterranean and desert zones. Before planting, use a soil test to assess the phosphorus and potassium needs, as soil tests are fairly reliable for determining the status of these nutrients in the soil (this is not the case for sulfur, boron, or molybdenum). As indicated in Table 6.5, soil with a phospho-rus level of less than 5 parts per million (ppm or mg/kg) is considered deficient; soil with 5–10 ppm phosphorus is marginal; and soil with 10 ppm or greater phosphorus is initially adequate. A plant tissue test for phosphorus is preferred over soil testing after alfalfa is estab-lished. Phosphorus deficiency is very difficult to identify visually (Color Plate 6.1) because it looks like moisture stress or several other stresses that cause stunted plants with dark leaves.
To correct a phosphorus deficiency, a high-analysis phosphorus fertilizer, such as 0-45-0, 11-52-0, or liquid 10-34-0, is usually the most economical. In alfalfa, these three common phosphorus sources result in the same yield response per pound of P
2O
5 applied. Liquid or
granular phosphorus fertilizers with water sol-ubility values greater that 55 percent are nearly equal in terms of plant availability. Rock phos-phate, however, is not recommended because
of low phosphate availability, particularly when applied to anything other than very acid soils (those with a pH less than 5.5). When higher nitrogen-containing fertilizers, such as 16-20-0 or 18-46-0, are applied prior to or at planting, take care to control weeds because the supple-mental nitrogen will stimulate their growth.
Before planting, use soil tests to determine the amount of phosphorus needed (Table 6.8). Incorporate no more than a 2-year supply of fertilizer into the top 2–4 inches (5–10 cm) of soil. Use a double disk to incorporate and mix the fertilizer with the soil. Avoid deep plow-ing after spreading the fertilizer because this decreases the efficient uptake of phosphorus by the plant. Even if high rates of phosphorus are applied (>200 lb P
2O
5 per acre, [224 kg/ha]), it
may be economical to reapply after 2 years. Use plant tissue analysis to determine the need for phosphorus after the seedling year. Applying phosphorus fertilizers on the soil surface in an established stand has been very effective. Apply fertilizer any time, but applications made from October through February are preferred because alfalfa responses to phosphorus fertil-izer are not usually observed until 60 to 90 days after application.
Table 6.8 gives a range of application rates because some soils and growing conditions require larger amounts to meet nutritional requirements and maintain high alfalfa yields. Various combinations of phosphorus amounts and application timing can be used to achieve the rates recommended. Recent UC Davis
Al f a l f a Fe r t i l i z at i o n St r ate gi e s A N R P u b l i c a t i o n 8 2 92 8
UCD Alfa
lfa
Wor
kgro
up
The visual symptoms of potassium deficiency are pinhead-size white or yellow spots on new leaves. Unlike the symptoms of other nutrient shortages, those of potassium deficiency are distinctive and fairly reliable.
research has indicated that fewer applica-tions (at least every 2 years) of higher rates can be applied more economically than lower rates (less than 50 lb P
2O
5 per acre [56 kg/
ha]) applied each year. For more efficient use of phosphorus fertilizers, single applica-tion rates should not exceed 100–150 pounds P
2O
5 per acre (112–168 kg/ha) and should
be applied during late fall or winter prior to alfalfa growth. If higher rates of phosphorus are needed, then apply half in late fall or winter prior to alfalfa growth and the second half after the second or third cutting. Mid-season appli-cations of phosphorus can be injected into the irrigation water provided there is good water distribution and no tailwater leaves the ranch. It can also be applied on the soil surface as either dry granular or a liquid fertilizer before the initiation of much regrowth. Take plant tissue samples 60–90 days after a fertilizer application to re-evaluate the fertility status.
Potassium
Potassium deficiency is less frequent in the Imperial Valley and coastal valleys of California but is often observed on the east side of the Sacramento and northern San Joaquin Valleys, where soils tend to be low in potassium. Like a lack of phosphorus, a potassium deficiency
can be diagnosed by either a soil or plant tissue test. The visual symptoms of potassium deficiency are pinhead-size white or yellow spots on new leaves (see Color Plate 6.6). Unlike the symptoms of other nutrient shortages, those of potassium defi-ciency are distinctive and fairly reliable. Note, however, that genetic differences between alfalfa plants affect symptom development; not all potassium-deficient plants show deficiency symptoms.
Also, some insects, such as blue alfalfa aphid, and diseases cause symptoms similar to those of potassium deficiency.
The most economical fertilizer for cor-recting this deficiency is muriate of potash (0-0-60). Sometimes potassium sulfate (0-0-52, 18% sulfur) is used when sulfur is also deficient. However, compared to muriate of potash, potassium sulfate and other mixed fer-tilizers are usually more expensive per pound of potassium. Table 6.8 lists recommended potassium rates for both preplant-incorporated and surface applications. Applications on the soil surface are very effective and can be made at any time. For the most efficient use of the potassium fertilizers, single applica-tion rates should not exceed 200–300 pounds K
2O per acre (224–336 kg/ha) and should
be applied during late fall or winter prior to alfalfa growth, and again if needed after the second or third cutting. Like phosphorus, the growth response to applied potassium may not be observed until 60–90 days after fertilizer application.
Sulfur
Historically, sulfur has only been deficient in alfalfa in the Sacramento Valley and perhaps the east side of the northern San Joaquin Valley. Visual deficiency symptoms include stunting and a light green or yellow color—symptoms that may also indicate nitrogen or molybdenum deficiency (see Color Plates 6.2 and 6.4). Only tissue testing can confirm a sulfur deficiency; soil tests do not provide reliable results. It is important to have an adequate level of available sulfate–sulfur in the soil at the time of plant-ing. Two principle forms of fertilizer sulfur exist: (1) long-term, slowly available elemental sulfur, and (2) short-term, rapidly available sul-fate. The most economical practice is to apply and incorporate 200–300 pounds of elemental sulfur per acre (224–336 kg/ha) before plant-ing. Elemental sulfur is gradually converted to the sulfate form and should last 3 to 5 years or longer.
To ensure a multiple-year supply of avail-able sulfur, the particle size of elemental sulfur must range from large to small. Small particles
Al f a l f a Fe r t i l i z at i o n St r ate gi e s A N R P u b l i c a t i o n 8 2 92 9
UCD Alfa
lfa
Wor
kgro
up
Adequate supplies of boron are more important for production of alfalfa seed than for production of alfalfa hay.
are rapidly converted to the sulfate form; the large particles will continue to release sul-fate over several years. Ideally, 10 percent of elemental sulfur should pass through a 100-mesh screen; 30 percent through a 50-mesh screen; and the remaining 60 percent through a 6-mesh screen. Very fine grades of sulfur are readily available but do not persist long enough to provide a multiple-year supply. Fertilizers used to supply the sulfate form of sulfur include gypsum (15–17% sulfur), ammo-nium sulfate 21-0-0 (24% sulfur), and 16-20-0 (14–15% sulfur).
Gypsum, as well as elemental sulfur and other materials, are often used to aid in water penetration of “low-salt” content irrigation water and reclamation of “high-salt” content soils. Growers may apply from 500 to 1,000 pounds of gypsum per acre (560–1,120 kg/ha) every year or two to accom-plish these objectives.
iron
On rare occasions, growers have observed symptoms of iron deficiency in alfalfa, but only tissue tests have been helpful in confirming the problem. The deficiency produces nearly white or canary-yellow plants in areas where drainage is poor. Iron deficiency in alfalfa is associated with high pH or poorly drained soils high in lime. If the soil pH is greater than 8.0 and free lime is present, begin to correct the iron deficiency by lowering the soil pH using high rates of elemental sulfur (at least 1,000 lb per acre [1,120 kg/ha]). Also, it is important to improve drainage in low areas of the field.
boron
Although deficiency symptoms are easily iden-tified (Color Plate 6.7), boron deficiency is more effectively confirmed with a plant tissue test. Early stages of boron deficiency are often associated with drought conditions and, in a few cases, potassium deficiencies. Adequate supplies of boron are more important for pro-duction of alfalfa seed than for production of alfalfa hay. When tissue tests indicate boron
is deficient and boron-sensitive crops, such as cereals, are likely to be planted in the field within 12 months, broadcast 1–3 pounds of boron per acre (1.12–3.36 kg/ha) on the soil surface. Use higher rates of 3.5–7 pounds per acre (3.9–7.8 kg/ha) if boron-tolerant crops, such as alfalfa, sugar-beets, or onions, will be grown for the next 24 months. Use the lower rates on sandy soils; the higher rates are sug-gested for fine-textured soils. Higher rates of boron will often provide an adequate supply for 5–7 years. The most common boron fertilizers are 45–48 percent borate (14.3–14.9% boron) and 65–68 percent borate (20.4–21.1% boron). Boron is usually applied as a granular product, either by air or through the small seed box in a grain drill. Some forms can be applied as a liquid along with herbicide applications; make sure the boron and herbicide are compatible before mixing them.
Molybdenum
Molybdenum deficiency is infrequent in the Central Valley, but has been found on the west side of the Sacramento Valley. Generally toxici-ties of molybdenum are more likely to occur in the San Joaquin and Imperial Valleys and some of the coastal valleys. Symptoms of molybde-num deficiency are like those of nitrogen and sulfur deficiency: light green or yellow, stunted plants (Color Plates 6.2 and 6.5). A positive response to ammonium sulfate fertilizer could mean a nitrogen, sulfur, or molybdenum defi-ciency. A positive response to urea rules out a sulfur deficiency but could indicate a shortage of nitrogen or molybdenum. Plant tissue testing or applying sulfur and molybdenum fertilizers to separate trial strips are the only means of confirming a molybdenum deficiency.
The most common molybdenum fertil-izer is sodium molybdate (40% molybdenum), but ammonium molybdate can be used as
Al f a l f a Fe r t i l i z at i o n St r ate gi e s A N R P u b l i c a t i o n 8 2 92 10
UCD Alfa
lfa
Wor
kgro
up
well. Apply 0.4 pound per acre of molybde-num (1 pound per acre or 1.12 kg/ha sodium molybdate) during winter or before regrowth has resumed after cutting. Broadcast on the soil surface only and avoid application to any plant foliage. A single application of 0.4 pound per acre molybdenum should last from 5 to 15 years. Thorough records of molybdenum application times and amounts along with repeated tissue testing are essential to deter-mine when to apply or reapply the nutrient.
Do not apply excessive molybdenum (that is, double or triple coverage)—the concentra-tion of the element in alfalfa may become so high that the forage becomes toxic to livestock. For the same reason, do not apply molybdenum directly on foliage. Analyzing the top one-third of the plant for both copper and molybdenum can detect deficiencies and suboptimum ratios of these elements. Consult an animal nutri-tion specialist if you suspect molybdenum problems.
Record Keeping
Clear and complete records are essential to a successful alfalfa fertilization program. Keep a record for each field and include the location of permanent benchmark sampling areas, dates of sampling, soil and plant tissue test results, fer-tilizer application dates, fertilizers applied and the rate of application, and crop yields. This information can help you evaluate both the need for and the response to applied fertilizer and allow you to develop an economical, long-term fertilization program.
Additional Reading
DANR Analytical Laboratory. 1991. California commercial laboratories providing agri-cultural testing. University of California Division of Agriculture and Natural Resources, Oakland. Special Publication 3024.
Kelling, K.A., and J.E. Matocha. 1990. Plant analysis as an aid in fertilizing forage crops. Pp. 603–643 in: R.L. Westerman, ed., Soil testing and plant analysis, 3rd ed. Soil Science Society of America, Madison, WI.
Martin, W.E., and J.E. Matocha. 1973. Plant analysis as an aid in the fertilization of forage crops. Pp. 393–426 in: L.M. Walsh and J.D. Beaton, eds., Soil testing and plant analysis, revised edition. Soil Science Society of America, Madison, WI.
Meyer, R.D., and W.E. Martin. 1983. Plant analysis as a guide for fertilization of alfalfa. Pp. 32–33 in: H.M. Reisenauer, ed., Soil and plant tissue testing in California. University of California Division of Agriculture and Natural Resources, Oakland. Bulletin 1879.
Phillips, R.L., and R.D. Meyer. 1993. Molybdenum concentration of alfalfa in Kern County, California: 1950 versus 1985. Commun. Soil Sci. Plant Anal. 24(19–20): 2725–2731.
Reisenauer, H.M., J. Quick, R.E. Voss, and A.L. Brown. 1983. Chemical soil tests for soil fertility evaluation. Pp. 39–41 in: H.M. Reisenauer, ed., Soil and plant tissue test-ing in California. University of California Division of Agriculture and Natural Resources, Oakland. Bulletin 1879.
Soil Improvement Committee, California Fertilizer Association. 2003. Western Fertilizer Handbook, 9th ed. Interstate Printers and Publishers, Danville, IL.
Al f a l f a Fe r t i l i z at i o n St r ate gi e s A N R P u b l i c a t i o n 8 2 92 11
UCD Alfa
lfa
Wor
kgro
up
Appendix
TAblE AInterpretation of test results for alfalfa plant tissue samples taken at one-tenth bloom for top 6 inches or one-third of plant samples or whole plant samples collected from baled hay
Plant Tissue Valuea
Nutrient unit Deficientb Marginal Adequate High
Top 6 inches or one-third of plant sample
Phosphorus % <0.20 0.21–0.25 0.26–0.70 >0.70
Potassium % <1.75 1.76–2.00 2.01–3.50 >3.5c
Sulfur % <0.20 0.20–0.25 0.26–0.50 >0.50d
Boron ppm <15 16–20 21–40 >200e
Molybdenum ppm <0.3 0.4–1.0 1–5 5–10f
Whole plant samples collected from baled hay
Phosphorus % <0.20 0.21–0.22 0.23–0.30 >0.30
Potassium % <0.80 0.81–1.09 1.10–1.40 1.40–3.00c
Sulfur % <0.20 0.20–0.22 0.23–0.30 >0.40d
Boron ppm <15 16–20 21–80 >200e
Molybdenum ppm <0.3 0.4–1.0 1–5 5–10f
a. Phosphorus concentration should be higher if alfalfa is cut at bud stage, 0.26% at mid-bud and even higher, 0.28%, if cut at very early bud stage. Other nutrient concentrations should be approximately 10% higher than when sampled at the one-tenth bloom growth stage (multiply tabular values by 1.10), (ppm = mg/kg).
b. An economic yield response to fertilizer applications is very likely for values below the deficient level, somewhat likely for values in the marginal level, and unlikely for values over the adequate level.
c. Alfalfa having greater than 3% potassium may cause animal health problems, particularly if the magnesium concentration is not greater than 0.25%.
d. Alfalfa having greater than 3,000 ppm SO4–S, or approximately 0.4% sulfur, may intensify molybdenosis in ruminants.e. A concentration over 200 may cause reduced growth and vigor.f. A concentration over 10 may cause molybdenosis in ruminants. Copper concentrations should be twice as high as
molybdenum concentrations.
A l f a l f a Fe r t i l i z at i o n St r ate gi e s A N R P u b l i c a t i o n 8 2 92 12
UCD Alfa
lfa
Wor
kgro
up
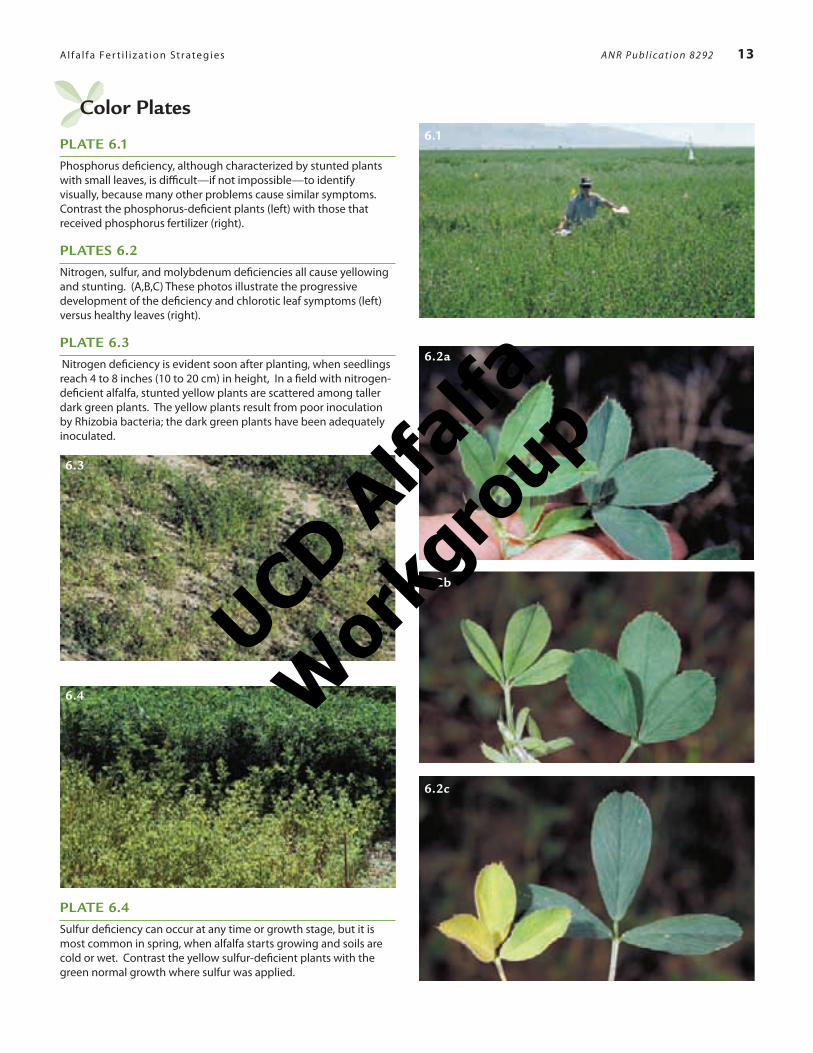
PlATE 6.4
Sulfur deficiency can occur at any time or growth stage, but it is most common in spring, when alfalfa starts growing and soils are cold or wet. Contrast the yellow sulfur-deficient plants with the green normal growth where sulfur was applied.
Color Plates
PlATE 6.1Phosphorus deficiency, although characterized by stunted plants with small leaves, is difficult—if not impossible—to identify visually, because many other problems cause similar symptoms. Contrast the phosphorus-deficient plants (left) with those that received phosphorus fertilizer (right).
PlATES 6.2
Nitrogen, sulfur, and molybdenum deficiencies all cause yellowing and stunting. (A,B,C) These photos illustrate the progressive development of the deficiency and chlorotic leaf symptoms (left) versus healthy leaves (right).
PlATE 6.3 Nitrogen deficiency is evident soon after planting, when seedlings reach 4 to 8 inches (10 to 20 cm) in height, In a field with nitrogen-deficient alfalfa, stunted yellow plants are scattered among taller dark green plants. The yellow plants result from poor inoculation by Rhizobia bacteria; the dark green plants have been adequately inoculated.
6.1
6.2a
6.2b
6.2c
6.4
6.3
Al f a l f a Fe r t i l i z at i o n St r ate gi e s A N R P u b l i c a t i o n 8 2 92 13
UCD Alfa
lfa
Wor
kgro
up
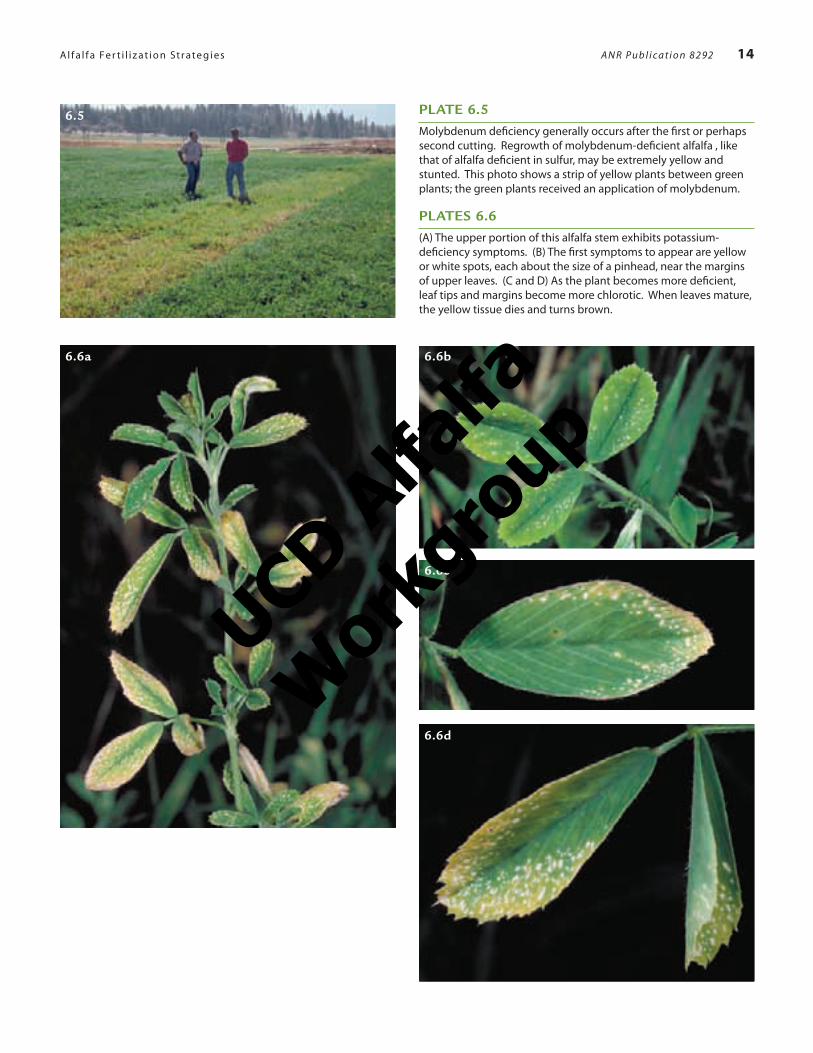
PlATE 6.5
Molybdenum deficiency generally occurs after the first or perhaps second cutting. Regrowth of molybdenum-deficient alfalfa , like that of alfalfa deficient in sulfur, may be extremely yellow and stunted. This photo shows a strip of yellow plants between green plants; the green plants received an application of molybdenum.
PlATES 6.6
(A) The upper portion of this alfalfa stem exhibits potassium-deficiency symptoms. (B) The first symptoms to appear are yellow or white spots, each about the size of a pinhead, near the margins of upper leaves. (C and D) As the plant becomes more deficient, leaf tips and margins become more chlorotic. When leaves mature, the yellow tissue dies and turns brown.
6.5
6.6a 6.6b
6.6c
6.6d
Al f a l f a Fe r t i l i z at i o n St r ate gi e s A N R P u b l i c a t i o n 8 2 92 14
UCD Alfa
lfa
Wor
kgro
up
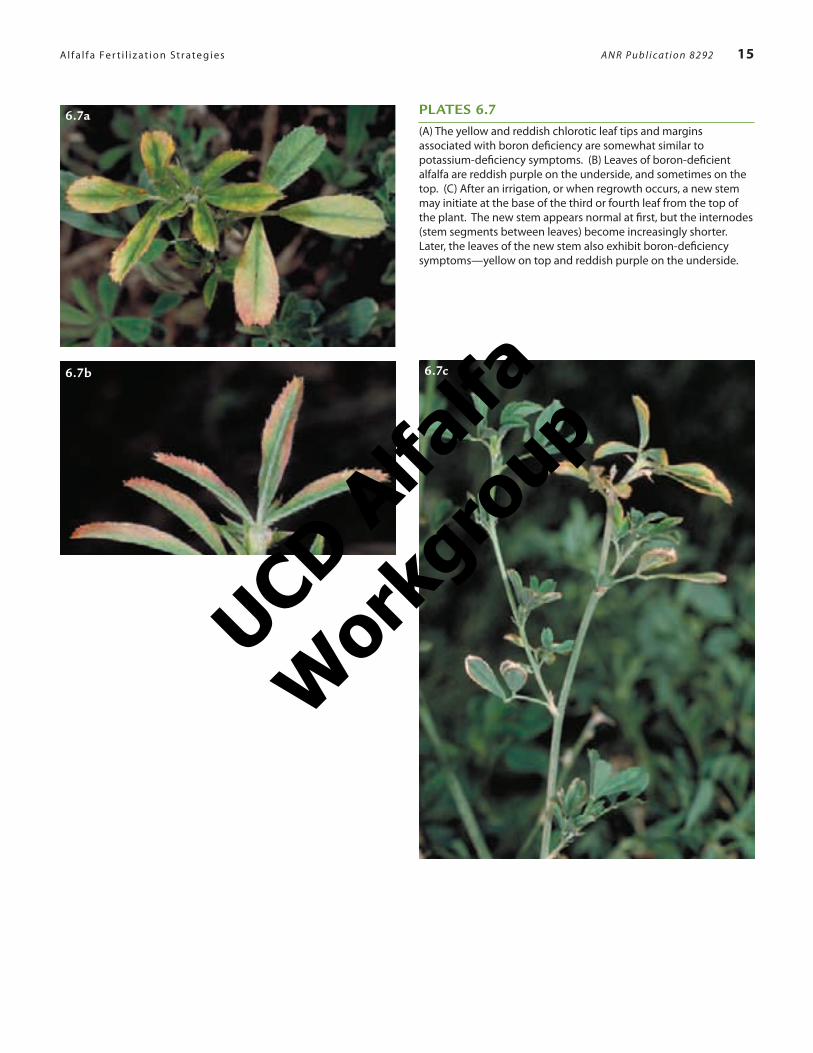
PlATES 6.7
(A) The yellow and reddish chlorotic leaf tips and margins associated with boron deficiency are somewhat similar to potassium-deficiency symptoms. (B) Leaves of boron-deficient alfalfa are reddish purple on the underside, and sometimes on the top. (C) After an irrigation, or when regrowth occurs, a new stem may initiate at the base of the third or fourth leaf from the top of the plant. The new stem appears normal at first, but the internodes (stem segments between leaves) become increasingly shorter. Later, the leaves of the new stem also exhibit boron-deficiency symptoms—yellow on top and reddish purple on the underside.
6.7a
6.7b 6.7c
Al f a l f a Fe r t i l i z at i o n St r ate gi e s A N R P u b l i c a t i o n 8 2 92 15
UCD Alfa
lfa
Wor
kgro
up

For More information
To order or obtain printed ANR publications and other products, visit the ANR Communication Services online catalog at http://anrcatalog.ucdavis.edu. You can also place orders by mail, phone, or FAX, or request a printed catalog of our products from:
University of CaliforniaAgriculture and Natural ResourcesCommunication Services6701 San Pablo Avenue, 2nd FloorOakland, California 94608-1239
Telephone: (800) 994-8849 or (510) 642-2431FAX: (510) 643-5470E-mail inquiries: [email protected]
An electronic version of this publication is available on the ANR Communication Services Web site at http://anrcatalog.ucdavis.edu.
Publication 8292ISBN-13: 978-1-60107-536-9
© 2007 by the Regents of the University of California, Division of Agriculture and Natural Resources. All rights reserved.
To simplify information, trade names of products have been used. No endorsement of named or illustrated products is intended, nor is criticism implied of similar products that are not mentioned or illustrated.
The University of California prohibits discrimination or harassment of any person on the basis of race, color, national origin, religion, sex, gender identity, pregnancy (including childbirth, and medical condi-tions related to pregnancy or childbirth), physical or mental disability, medical condition (cancer-related or genetic characteristics), ancestry, marital status, age, sexual orientation, citizenship, or status as a covered veteran (covered veterans are special disabled veterans, recently separated veterans, Vietnam era veterans, or any other veterans who served on active duty during a war or in a campaign or expedition for which a campaign badge has been authorized) in any of its programs or activities. University policy is intended to be consistent with the provisions of applicable State and Federal laws.
Inquiries regarding the University’s nondiscrimination policies may be directed to the Affirmative Action/Staff Personnel Services Director, University of California, Agriculture and Natural Resources, 1111 Franklin Street, 6th Floor, Oakland, CA 94607-5201, (510) 987-0096. For a free catalog of other publica-tions, call (800) 994-8849. For help downloading this publication, call (530) 297-4445.
This publication has been anonymously peer reviewed for technical accuracy by University of California scientists and other qualified professionals. This review process was managed by the ANR Associate Editor for Pest Management.
12/07-WFS
Al f a l f a Fe r t i l i z at i o n St r ate gi e s A N R P u b l i c a t i o n 8 2 92 16
UCD Alfa
lfa
Wor
kgro
up