alcohol and tobacco in nsw: consumption, revenue and concern · alcohol and tobacco in nsw:...
TRANSCRIPT
NSW PARLIAMENTARY LIBRARYRESEARCH SERVICE
Alcohol and Tobacco in NSW:Consumption, Revenue and
Concern
by
John Wilkinson
Briefing Paper No 7/97

Alcohol and Tobacco in NSW:Consumption, Revenue and
Concern
by
John Wilkinson

NSW PARLIAMENTARY LIBRARY RESEARCH SERVICE
Dr David Clune (9230 2484), Manager
Ms Honor Figgis (9230 2768) Research Officer, Law
Dr Gareth Griffith (9230 2356) Senior Research Officer, Politics and Government
Mr Stewart Smith (9230 2798) Research Officer, Environment
Ms Marie Swain (9230 2003) Research Officer, Law/Social Issues
Mr John Wilkinson (9230 2006) Research Officer, Economics
ISSN 1325-5142ISBN 0 7310 5981 6
© 1997
Except to the extent of the uses permitted under the Copyright Act 1968, no part ofthis document may be reproduced or transmitted in any form or by any meansincluding information storage and retrieval systems, without the prior written consentfrom the Librarian, New South Wales Parliamentary Library, other than by Membersof the New South Wales Parliament in the course of their official duties.
Should Members or their staff require further information about this publicationplease contact the author.
Information about Research Publications can be found on the Internet at:http://www.parliament.nsw.gov.au/gi/library/publicn.html
May 1997
Briefing Paper is published by the NSW Parliamentary Library

CONTENTS
Executive Summary . . . . . . . . . . . . . . . . . . . . . . . . . . . . . . . . . . . . . . . . . . . . . . . . . . 3
1. Introduction . . . . . . . . . . . . . . . . . . . . . . . . . . . . . . . . . . . . . . . . . . . . . . . . . . 4
2. Alcohol and Tobacco: A Brief Outline of their Production and Consumption in New South Wales . . . . . . . . . . . . . . . . . . . . . . . . . . . . . 4
3. NSW Revenue from Alcohol and Tobacco . . . . . . . . . . . . . . . . . . . . . . . . . 19
4. Social and Medical Concerns over Alcohol and Tobacco Consumption . . . 30
5. Some Commercial and Revenue Aspects of Alcohol and Tobacco . . . . . . . 45
6. Conclusion . . . . . . . . . . . . . . . . . . . . . . . . . . . . . . . . . . . . . . . . . . . . . . . . . . 53
Alcohol and Tobacco in NSW: Consumption, Revenue and Concern 3
EXECUTIVE SUMMARY
New South Wales is a major centre of beer, wine and cigarette production i nAustralia (pp.4-18)
New South Wales is likewise a major centre of alcohol and tobacco consumptionin Australia (pp.9-18)
Alcohol and tobacco have been used for centuries as source of revenue, and theystill retain revenue significance in the present day (pp.19-30)
Concerns over alcohol and (later) tobacco have been constantly raised - first, inthe case of alcohol, by church groups and subsequently, in the case of bot hsubstances, by health and allied organisations (pp.30-45)
Some dilemmas in the continuing government revenue reliance on alcohol andtobacco are discussed (pp.46-53)
Some policy tendencies for the future are outlined (p.53)
Alcohol and Tobacco in NSW: Consumption, Revenue and Concern4
Keith Dunstan, The Amber Nectar (Viking O’Neil, Melbourne, 1987), p.173; Roy Powell and1
Mark McGovern, The Eonomic Impact of the Australian Tobacco Industry 1983-84: AReport to the Tobacco Institute of Australia (Tobacco Institute of Australia, Sydney, 1987),chapter 4.
1 INTRODUCTION
Drinking and smoking, along with gambling, tend to have been viewed as indulgences,or vices, and the revenues from these three sources have consequently come to b eknown as the “sin taxes”.
As was the case with gambling, so it is similarly true that alcohol and tobacc oconsumption are particularly significant in the case of New South Wales.
In terms of production, New South Wales, over the decades, ha s been the biggest marketfor beer in Australia, and Sydney has also been the biggest centre of tobacc omanufacturing in Australia. 1
Revenue from these sources, as will be shown in the paper, has also become significantfor NSW government revenue - revenue from tobacco in particular.
On the other hand, there have been many concerns raised, ever since Britain’ sestablishment of its colony of New South Wales, over the abusive aspects o fconsumption of both of these two substances. Only alcohol, at first, was the object o fpublic concern but, in recent times, both drink ing and smoking have become the subjectof considerable public scrutiny.
A briefing note on gambling has already been produced by the NSW parliamentar ylibrary research service and this accompanying paper endeavours to complete a surveyof these activities. It examines the growth of beer production and consumption, an dtobacco production and consumption, in New South Wales. It also loo ks at the early, andcontinued, use of these two activities for their revenue pote ntial. Finally it looks at socialand medical concerns which have been raised by the consumption of these tw osubstances.
2 ALCOHOL AND TOBACCO: A BRIEF OUTLINE OF THEI RPRODUCTION AND CONSUMPTION IN NEW SOUTH WALES
(a) Alcohol
Alcohol consumption was well established in Britain, the country which, in 1788 ,occupied the continent of Australia, and it is not surprising that the British settlers whobegan to arrive in Australia, from that time onwards, brought their habits of drinkin gwith them. W.S. Campbell has estimated that, during the twelve years from 1788 to mid-

Alcohol and Tobacco in NSW: Consumption, Revenue and Concern 5
W.S. Campbell, “The Use and Abuse of Stimulants in the Early Days of Settlement in New2
South Wales” in the Journal of the Royal Australian Historical Society, vol.18, 1932, p.95.
Noel Butlin, “Yo, Ho, Ho and How Many Bottles of Rum?” in the Australian Economic3
History Review, vol.23, no.1, March 1983, p.5.
ibid., pp.10-11.4
G.P. Walsh, “The Geography of Manufacturing in Sydney, 1788-1851" in Business5
Archives and History, vol.3, no.1, February 1963, pp.21-28.
The First Hundred Years: A Brief History of the Kent Brewery 1835-1935 (Tooth and6
Company, Sydney, 1935), pp.11-12.
K.T.H. Farrer, A Settlement Amply Supplied: Food Technology in Nineteenth Century7
Australia (Melbourne University Press, Melbourne, 1980), p.211.
Brewing Industry Feature in Food Australia, vol.46, no.4, April 1994, p.158. 8
1800, 26,974 gallons of spirits and 8,896 gallons of wine were imported. Although2
chroniclers of life in Australia have tended to emphasise the tendency towards a hig hconsumption of alcohol, which developed amongst certain members of the population,early consumption of alcohol appears to have been relatively low. Noel Butli ncommented that, “Allocated as an annual average. . .this would imply very lo wconsumption. . .three-quarters of a gallon of spirits and one-quarter of a gallon of wineper person per year.”3
From 1800 onwards, alcohol imports began to significantly increase. In 1800, during theentire year, 45,000 gallons of spirits and 24,000 gallons of wine were imported. B y1811, the yearly importation of alcohol had risen to over 77,000 gallons of spirits andover 21,000 gallons of wine. Beer imports had also begun and, during the year 1815,647 hogsheads of beer were imported into the colony. 4
Beer production within the colony began not long after settlement. In 1804, a tParramatta, the colonial government established a brewery - an undertaking which waslater leased to a private individual. Subsequently, John Tooth, who had left England in5
the early 1830s, went into partnership with John Newnham and, in 1835, established alarge brewery near the city. In 1875, John Toohey, a descendant of Irish emigrants ,6
established a large brewery in Elizabeth Street. Although Toohey’s was a smalle r7
concern than Tooth’s, the brewery that was opened in 1875 had a sizeable productioncapacity: 32,000 gallons (144,000 litres) a week. 8
Apart from these two big breweries, there were a number o f smaller ones. T.A. Coghlan,statistician for the NSW colonial government, observed in 1887 that, “Brewing [is oneof the] industries which have increased. . .and. . .will further develop in the future. ”While in 1877 there were 38 breweries and bottlers of ale and stout in New South Wales,by 1886 their number had increased to 74. Coghlan gave the following figures for aleand stout production in the late 1880s:

Alcohol and Tobacco in NSW: Consumption, Revenue and Concern6
T.A. Coghlan, The Wealth and Progress of New South Wales 1886-87 (NSW Government,9
Sydney, 1887), pp.480-481.
Philip Norrie, Vineyards of Sydney: Cradle of the Australian Wine Industry (Horwitz10
Grahame, Sydney, 1990), pp.15,25,33,71; Max Lake, Hunter Wine (Jacaranda Press,Brisbane, 1964), pp.21-23.
Max Lake, Hunter Winemakers: Their Canvas and Art (Jacaranda Press, Brisbane, 1970),11
p.34.
Milton Lewis, A Rum State: Alcohol and State Policy in Australia 1788-1988 (Australian12
Government Publishing Service, Canberra, 1992), p.8.
Brewing and Employees QuantityBottling Concern Produced
1886 74 987 10,000,000gallons9
Wine production in the colony began with the first governor, Arthur Phillip, wh osucceeded in growing grapes, in his ga rden, from vines procured at Capetown. The firstexport of wine, from the colony to England, was sent in 1822 by Gregory Blaxlan d(brother of John Blaxland, discoverer of the route across the Blue Mountains). The firstof the forerunners of the Australian vineyards of the pres ent day was established in 1828when George Wyndham, who had lef t England in 1827, obtained a grant of crown landbeside the Hunter River and planted six acres of vine cuttings. Henry Lindeman, after10
leaving Britain in the early 1840s, began planting grapes on a property near Gresford,also in the Hunter Valley and, by the late 1840s, set out to expor t wine back to London. 11
Spirits and wine consumption, and that of alcohol in general, d eclined sharply during thefirst great business slump, which struck the colony in the 1840s. Milton Lewis ha scommented that, “The consumption of wine in New South Wales followed the sam epattern as the consumption of spirits. A marked decline in the 1840s heralded adownward trend lasting to the end of the century”. 12
Increased drinking of beer appears to have taken the place of the decline in th econsumption of spirits and wine. Tony Dingle has provided the following sets o fstatistics for per capita alcohol consumption in New South Wales during the nineteenthcentury:

Alcohol and Tobacco in NSW: Consumption, Revenue and Concern 7
Anthony Dingle, “‘The Truly Magnificant Thirst’: An Historical Survey of Australian Drinking13
Habits” in Historical Studies, vol.19, no.75, October 1980, pp.247-248.
Brett Stubbs, “The Revival and Decline of the Independent Breweries in New South Wales,14
1946-1961" in the Australian Economic History Review, vol.34, no.1, March 1996, p.34.
Asher Joel Advertising, A Survey of, and Report upon, the Hotel Industry of New South15
Wales (Asher Joel Advertising, Sydney, 1957), p.8.
Dunstan, ibid.16
Dermot O’Donnell, “Brewing in Australia 1970-1988" in Food Australia, vol,40, no.12, 1988.17
Beer Wine Spirits
1829 ( per person) 5.8 gallons 5.6 gallons 7.2 gallons1886 (per person) 13.4 gallons 0.8 gallons 1.3 gallons13
Drinking of beer expanded as the opportunity to access it increa sed. The principal meansof availability was the public house and most became “tied” to either Tooth’s (whic hheld the majority of such arrangements) or Toohey’s (“tying”, a ccording to Brett Stubbs,involved the publican undertaking “to purchase from the brewer all his beer”). The14
number of public houses reached an all-time high just at the beginning of the next tradedepression, in the 1890s:
Publicans’ Licences in New South Wales
1870 2,1871891 3,44115
Beer production in New South Wales, despite the temporary setback caused by th edepression of the 1890s, surged ahead during the 1900s and 1910s. Not only di dincreased drinking of beer take the place of the decline in consumption of spirits an dwine, but, on an overall level, as Keith Dunstan has written,
New South Wales. . .was by far the biggest market for beer in Australia. 16
In the 1920s, Tooth’s continued to be the biggest company making beer in New SouthWales - becoming even bigger when it took over Resch’s brewery in 1929. During the1930s, Tooth’s was responsible for 80% of beer sales in NSW and was one of the largestcompanies in Australia. One of the reasons for Tooth’s predominance was that, during17
the first half of the twentieth century, it gained the freehold of over 800 public houses

Alcohol and Tobacco in NSW: Consumption, Revenue and Concern8
Stubbs, op.cit., p.35.18
The Official Year Book of New South Wales 1929-30 (NSW Government, Sydney, 1931),19
p.481.
Quentin Beresford, Drinkers and the anti-Drink Movement in Sydney, 1870-1930 (PhD20
Thesis, Australian National University, 1984), p.212.
Joel, op.cit., p.54.21
Beresford, op.cit., p.235.22
and had “tied” arrangements with another 200. Toohey’s gained the freehold of around200 public houses and had “tied” arrangements with another 100. 18
During the period from 1900-1920 there was, then, an even greater in crease in the outputof beer, however, in the 1920s, for reasons which shall be discussed later, outpu tstabilised. The official year book of New South Wales gives statistics for the period asfollows:
Brewery Employees Quantity Produced
1901 1,016 13,973,751 gallons1911 912 19,804,540 gallons1920-21 1,122 25,470,404 gallons1928-29 1,276 29,420,920 gallons19
One reason for the overall stabilisation in consumption of alcohol was the restrictiv elegislation introduced by the Carruthers government which successfully obtaine dpassage of the Liquor Amendment Act 1905. Not only did the Act, as Quentin Beresfordhas described, extend “local option voting to parliamentary elections allowing” voters“to decide . . .whether the number of pu blic house licences. . .should be reduced”, but20
it also froze the number of clubs in ex istence in New South Wales. Another reason for21
stabilisation, which shall also be discussed later, was the passing of a state-wid ereferendum, during the First World War , which brought in the closing of public housesat 6 pm.22
Despite these restrictions on alcohol consumption, Tooth’s and Toohey’s continued tobe very profitable. Their returns in 1925, for instance, were as follows:

Alcohol and Tobacco in NSW: Consumption, Revenue and Concern 9
J. Peter Thoeming, Here’s Too’ee: The History of Tooheys (Crawford House Publishing,23
Bathurst, 1997), pp.89-103.
Max Lake, Hunter Winemakers, pp.34-35.24
Joel, op.cit., p.79.25
ibid., p.170.26
Gross Profits in 1925
Tooth’s £826,933Toohey’s £296,56223
Wine production in New South Wales, on the other hand, declined sharply afte rfederation of the colonies. Max Lake has explained this accordingly:
In 1866 there were 5,840 acres under grapes. . .in 1900, federation. . .dealt themost serious blow to the prosperity of the Hunter vignerons. With. . .custom sbarriers down, New South Wales experienced a sudden and overwhelmin gimportation of South Australian wines, both table and fortified. These. . .wineswere cheaper. . .As a result, in the next decade or so there were more vine spulled out in the Hunter Valley than at any time. . .In 1936 the vineyard acreagewas down to 1,500 and in 1947 about 1,100 acres remained. 24
Once again, with the onset of business slump in the 1930s, beer production, and bee rconsumption, declined and, once more, with better conditions, it revived with asignificant expansion during subsequent following decades.
This increase in consumption was facilitated, at leas t in New South Wales, by the easingof restrictions on access to drinking under the McKell and Cahill governments, in thelate 1940s and mid-1950s. The McKell government, through securing passage of th eLiquor Amendment Act 1946, withdrew the freeze on the number of clubs in New SouthWales (introduced in the Carruthers government’s Liquor Amendment Act 1905) andincreased the number of permissable registered clubs to 41 4. This measure, in particular,foreshadowed the coming expansion in the number of ex-service personnel, or RSL ,clubs after the Second World War. A year later, access to liquor in clubs wa s25
significantly widened when, in a test case before the Full Court of NSW, regardin gprovision of alcohol at the Royal Sydney Golf Club, a majority of the court decided thatclub members could legally be served with alcohol at their clubs at all times. 26
The Cahill government carried on the removal of restrictions on access to alcohol ,foreshadowing the expansion of the Leagues clubs. Firstly, in October 1954, the Cahillgovernment succeeded in obtaining passage of a bill to hold a referendum on closin ghours in New South Wales. In the following month, the referendum returned a smal l
Alcohol and Tobacco in NSW: Consumption, Revenue and Concern10
ibid., p.123.27
ibid., pp.124-129.28
Ibid., p.8; Official Year Book of New South Wales 1974, p.1069; ibid., 1983, p.573; NSW29
Department of Gaming and Racing, New South Wales Gaming Analysis (NSW Departmentof Gaming and Racing, Sydney, 1995), p.19.
Stubbs, op.cit., p.43.30
Thoeming, op.cit., p.107.31
Dunstan, op.cit., p.173.32
Thoeming, ibid.33
Thoeming, op.cit., p.109.34
majority in favour of 10 pm closing, and this was quickly introduced. Then, in the last27
month of 1954, the Cahill government obtained passage of another bill, which becamethe Liquor Amendment Act 1954, removing the limit on the number of issuable clu blicences. Two years later the Cahill government provided an impetus to the expansion28
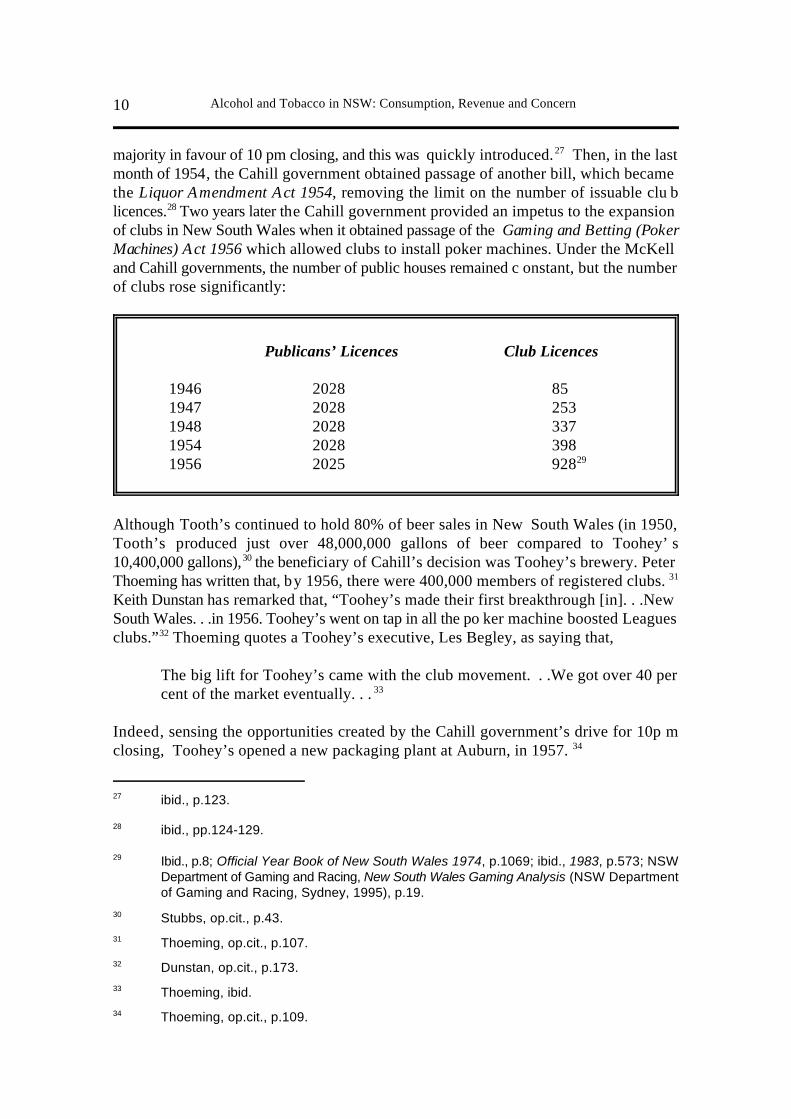
of clubs in New South Wales when it obtained passage of the Gaming and Betting (PokerMachines) Act 1956 which allowed clubs to install poker machines. Under the McKelland Cahill governments, the number of public houses remained c onstant, but the numberof clubs rose significantly:
Publicans’ Licences Club Licences
1946 2028 851947 2028 2531948 2028 3371954 2028 3981956 2025 92829
Although Tooth’s continued to hold 80% of beer sales in New South Wales (in 1950,Tooth’s produced just over 48,000,000 gallons of beer compared to Toohey’ s10,400,000 gallons), the beneficiary of Cahill’s decision was Toohey’s brewery. Peter30
Thoeming has written that, by 1956, there were 400,000 members of registered clubs. 31
Keith Dunstan has remarked that, “Toohey’s made their first breakthrough [in]. . .NewSouth Wales. . .in 1956. Toohey’s went on tap in all the po ker machine boosted Leaguesclubs.” Thoeming quotes a Toohey’s executive, Les Begley, as saying that,32
The big lift for Toohey’s came with the club movement. . .We got over 40 percent of the market eventually. . . 33
Indeed, sensing the opportunities created by the Cahill government’s drive for 10p mclosing, Toohey’s opened a new packaging plant at Auburn, in 1957. 34

Alcohol and Tobacco in NSW: Consumption, Revenue and Concern 11
Official Year Book of New South Wales, 1939-1940, p.943; ibid., 1959, p.863; ibid, 1961,35
pp.731-732; ibid., 1973, p.1031.
Senate Standing Committee on Social Welfare, Drug Problems in Australia - An Intoxicated36
Society?, parliamentary paper no. 228/1977 (Australian Government Printing Service,Canberra, 1977), p.33.
Thoeming, op.cit., pp.135-137.37
ibid., pp.141,151,160.38
This increase in ease of access to alcohol - facilitated by the McKell and Cahil lgovernment’s endorsement of the club movement, and their support for lengthene dopening hours - enabled the breweries to dramatically increase production as th efollowing figures show:
Beer Produced in New South Wales
1939 33,899,000 gallons1955 88,081,000 gallons1960 94,712,000 gallons1969-70 134,958,000 gallons35
A corresponding increase in consumption in alcohol consumption also occurred a sindicated by the following figures for consumption of beer in Australia:
Yearly Average Consumption of Beer in Australia per Person (est.)
1886 13.4 gallons 1965-66 24 gallons (110 litres or 293 cans of
beer)36
During the 1970s, the brewing companies’ production and profits in creased even further.In 1971, Toohey’s Auburn brewery, according to Thoeming, “got a new high spee dcanning line, capable of producing more th an 48,000 cans of beer an hour.” In the sameyear, Toohey’s profit was $3.7 million, in 1972 it reached $4.8 million. In 1973,37
Toohey’s began brewing operations at its Auburn plant. By the end of the 1970s ,particularly through its television advertising campaign, in fiscal year 1978-1979 ,Toohey’s profit reached $12.5 million. 38
Even more opportunities for drinking were subsequently provided for by the Wra n

Alcohol and Tobacco in NSW: Consumption, Revenue and Concern12
7 George IV no.2, 1826, An Act for Repealing the Laws now in Force to the Licensing and39
Regulating of Public Houses and for the Better Regulating the Granting of Licenses for theSale of Ale, Beer, Wine, Spirits and other Liquors in New South Wales in Future.
Beresford, op.cit., pp.93-94.40
Gar Dillon, A Delusion of the Australian Culture: A Brief History of the Clash with Alcohol41
in New South Wales 1788-1983 (NSW Temperance Alliance, Sydney, 1985), pp.160-161.
Lewis, op.cit., p.91.42
Thoeming, op.cit., p.175.43
government which, in 1979, secured the passage of legislation allowing for Sunda yopening of hotels.
After the Cahill government’s reinstituting 10 pm closing, in 1954, successiv egovernments in New South Wales sought to gain public approval for Sunday trading.Sunday closing had been instituted as early as 1 826 when Darling was governor of NewSouth Wales. The Legislative Council, which had only re cently been established, passeda bill which became the Licensed Publicans Act 1826, forbidding a publican to, “permit.. .any drinking . . .on Sunday”. In the early 1860s, however, the Cowper government39
liberalised the laws relating to the consumption of alcohol through passage of th eLicensed Publicans Act 1862: not only providing for trading until 10 pm, Monday t oSaturday, but providing for limited trading on Sundays. Nearly twenty years later ,however, Henry Parkes, who became prem ier in 1880, subsequently secured passage ofthe Licensing Act 1881 which once more barred trading on Sundays. Sunday trading40
remained barred in New South Wales throughout the first half of the twentieth century,but following the Cahill government’s obtaining a lengthening of closing hours, in 1954,the Askin government, which gained office in 1965, decided to hold a referendum onopening of public houses on Sunday. The referendum was conducted in 1969 bu t1,249,835 people voted against, while 906,276 voted in favour. Nine years later,41
however, in 1978, the Wran government announced that it would introduce legislationto allow for trading on Sundays. Although the Liberal and Country par ties, in opposition,advocated the holding of a referendum on the issue (which, as shall be outline dsubsequently in this paper, had been the convention for matters such as this), thei rrequests were not heeded and, in 1979, the Wran government obtained passage of theLiquor Amendment Act 1979 which provided for Sunday trading. 42
Toohey’s, not long afterwards, expanded its operations further. In 1983, at its Auburnplant, according to Thoeming, “a new can filling line was commissioned with a rate dcapacity of 2,000 cans per minute [120,000 cans an hour] making it the fastest in th eworld.”43
Beer consumption increased in New South Wales during the early 1980s, and the ndecreased in the mid-1980s, partly, as O’Donne ll has remarked, because of the “severe”

Alcohol and Tobacco in NSW: Consumption, Revenue and Concern 13
O’Donnell, ibid.44
Official Year Book of New South Wales, 1985, p.532; ibid., 1988, p.390.45
Thoeming, op.cit., p.203.46
Senate Standing Committee on Social Welfare, ibid; Dunstan, op.cit., p.147. 47
Daniel Lewis, “Australia Losing Ocker Image as Beer Sales Go Flat” in the Sydney Morning48
Herald, 8 November, 1995, p.8.
increase “in . . .excise. . .in 1975 and 1978" (which shall be looked at later in thi s44
paper). From a figure of around 135 million gallons of beer produced in NSW during1969-1970, consumption increased, and then fell, during the 1980s as follows:
Beer Consumption in New South Wales in the 1980s
1980 177,486,000 gallons (807,555,000 litres)1985-86 144,837,000 gallons (659,010,000 litres) 45
Drinking of beer, per person, has similarly declined. Indeed, Peter Thoeming ha srecalled that, in 1992-1993, “New South Wales beer consumption was down, wit hToohey’s especially down. . .10 per cent”. This is indicated by the following figures:46
Yearly Average Consumption of Beer in Australia perPerson (est.)
1974-75 31 gallons (141 litres or 376 cans of beer)1984-85 25 gallons (115 litres or 306 cans of beer) 47
1990 24 gallons (112 litres or 299 cans of beer)1994 21 gallons (96 litres or 255 cans of beer) 48
Retail outlets for beer in Australia were also changing. In the late 1970s the Trad ePractices Commission (TPC) investigated the system of breweries having controllin ginterests in public houses, as in New South Wales. Eventually, in 1979, the TPC issuinga ruling ending this practice. Lloyd Hartigan, chief executive of Toohey’s in 1976 ,predicted, according to Thoeming, that with
the decline in tap, or bulk, beer sales, [which had] account[ed] for 60 per cent inthe mid-1960s . . .packaged beer sales [would]. . .rise, [and that] liquor stores ,

Alcohol and Tobacco in NSW: Consumption, Revenue and Concern14
Thoeming, op.cit., pp.150,160.49
Graham Gregory, “The New Vineyards” in Lake, op.cit., pp.74,88-89.50
Thoeming, op.cit., pp.139,154.51
Australian Wine and Brandy Corporation, “Wine” in National Farmers Federation (eds.),52
Australian Agricultural Year Book 1986 (Publishing and Marketing Australia, Melbourne,1985), p.256.
and big retail groups, would become strong new customers. . . 49
Wine production in New South Wales a lso began to expand once more - during the late1960s. Graham Gregory wrote in 1970 that,
wine. . .gradually returned to boom conditions as the sixties progressed . ..Already there are 3,500 acres of wine grapes in the Hunter Valley. . .grea tprogress [has been] made by the longer established firms, Draytons, Elliots ,Lindemans, McWilliams, Penfolds, Tullochs and Tyrrells . .. 50
From then on wine production in New South Wales expanded dramatically - helped bythe introduction of the wine cask, in the 1970s. Peter Thoeming has noted that sales ofAustralian white table wine increased by over 20% during the late 1970s. This51
expansion in production, which continued into the 1980s, is highlighted by the figuresbelow:
Wine Production: NSW Wine Production:Australia
1965 29,113 kilolitres 176,000 kilolitres1970 54,949 kilolitres 287,000 kilolitres1975 74,314 kilolitres 361,000 kilolitres1980 97,009 kilolitres 414,000 kilolitres1985 107,368 kilolitres 451,000
kilolitres52
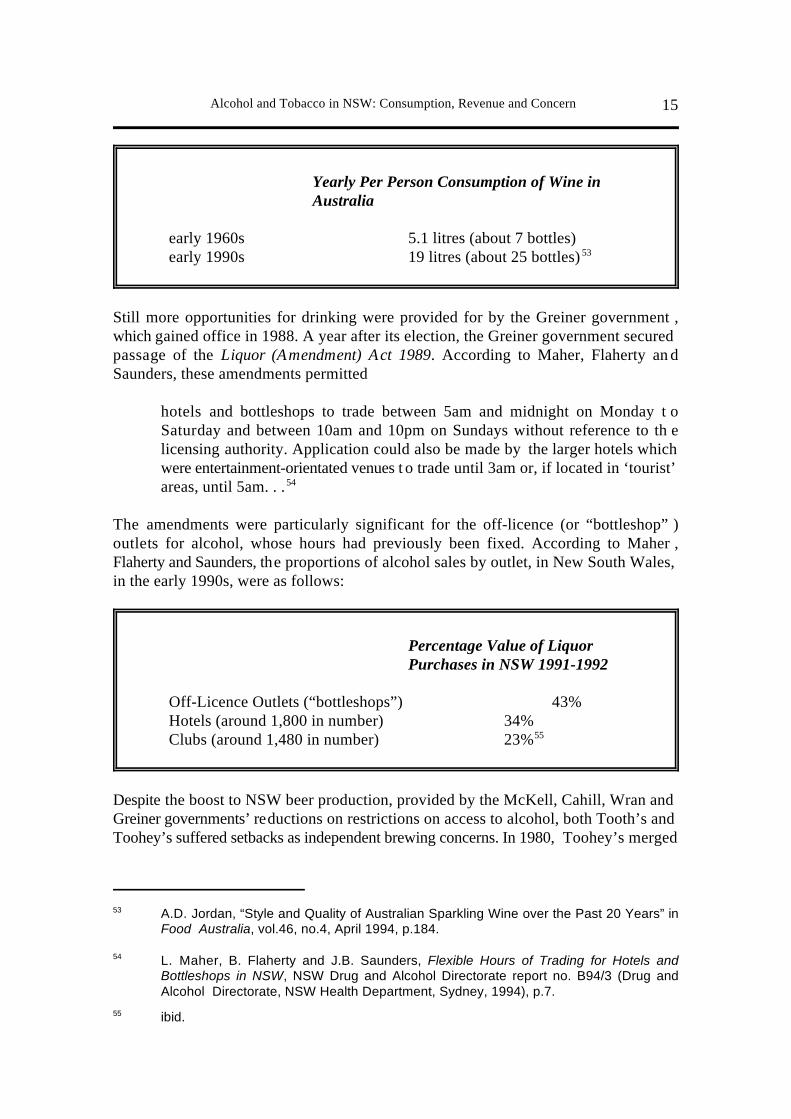
The increase in wine drinking is illustrated by the following figures for per perso nconsumption of wine Australia-wide:
Alcohol and Tobacco in NSW: Consumption, Revenue and Concern 15
A.D. Jordan, “Style and Quality of Australian Sparkling Wine over the Past 20 Years” in53
Food Australia, vol.46, no.4, April 1994, p.184.
L. Maher, B. Flaherty and J.B. Saunders, Flexible Hours of Trading for Hotels and54
Bottleshops in NSW, NSW Drug and Alcohol Directorate report no. B94/3 (Drug andAlcohol Directorate, NSW Health Department, Sydney, 1994), p.7.
ibid.55
Yearly Per Person Consumption of Wine inAustralia
early 1960s 5.1 litres (about 7 bottles)early 1990s 19 litres (about 25 bottles) 53
Still more opportunities for drinking were provided for by the Greiner government ,which gained office in 1988. A year after its election, the Greiner government securedpassage of the Liquor (Amendment) Act 1989. According to Maher, Flaherty an dSaunders, these amendments permitted
hotels and bottleshops to trade between 5am and midnight on Monday t oSaturday and between 10am and 10pm on Sundays without reference to th elicensing authority. Application could also be made by the larger hotels whichwere entertainment-orientated venues t o trade until 3am or, if located in ‘tourist’areas, until 5am. . .54
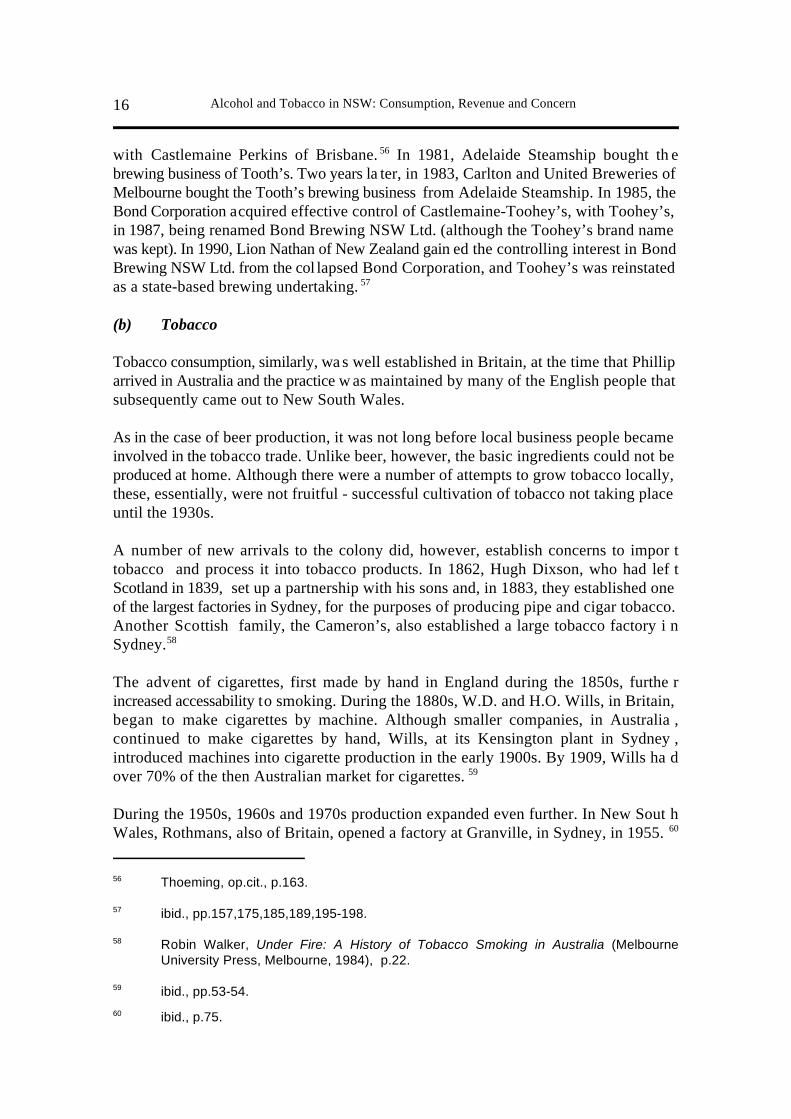
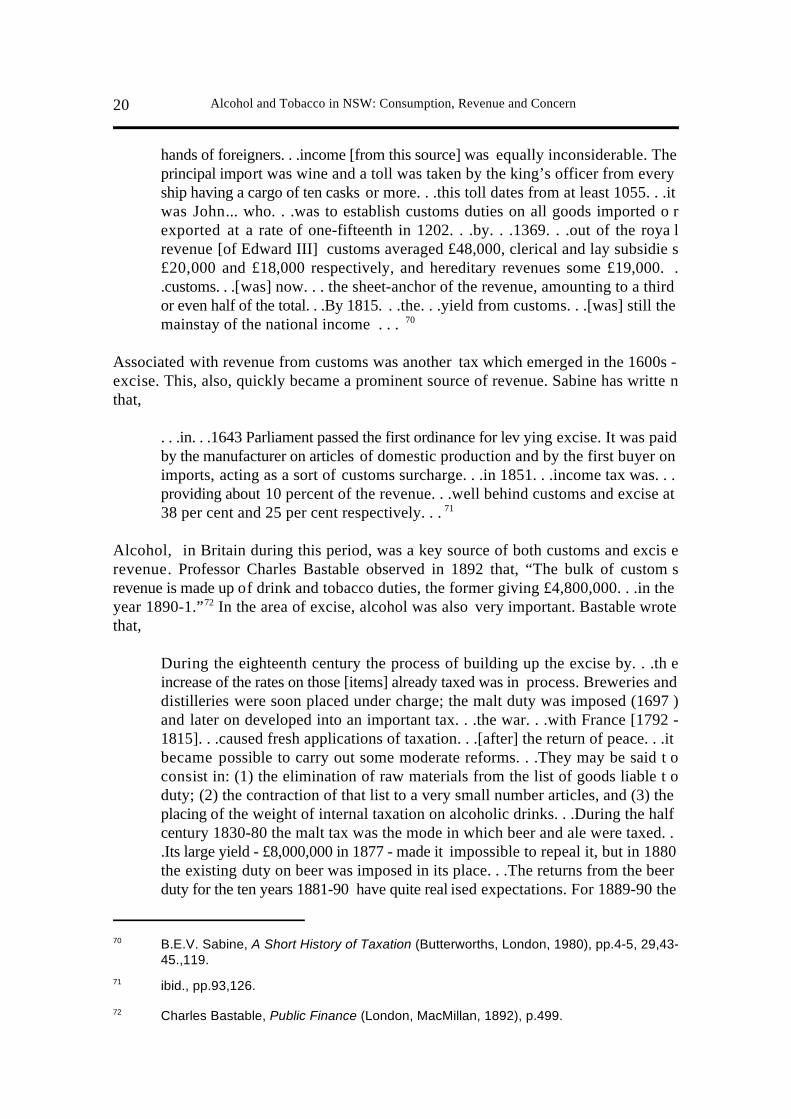
The amendments were particularly significant for the off-licence (or “bottleshop” )outlets for alcohol, whose hours had previously been fixed. According to Maher ,Flaherty and Saunders, the proportions of alcohol sales by outlet, in New South Wales,in the early 1990s, were as follows:
Percentage Value of Liquor Purchases in NSW 1991-1992
Off-Licence Outlets (“bottleshops”) 43%Hotels (around 1,800 in number) 34%Clubs (around 1,480 in number) 23%55
Despite the boost to NSW beer production, provided by the McKell, Cahill, Wran andGreiner governments’ reductions on restrictions on access to alcohol, both Tooth’s andToohey’s suffered setbacks as independent brewing concerns. In 1980, Toohey’s merged
Alcohol and Tobacco in NSW: Consumption, Revenue and Concern16
Thoeming, op.cit., p.163.56
ibid., pp.157,175,185,189,195-198.57
Robin Walker, Under Fire: A History of Tobacco Smoking in Australia (Melbourne58
University Press, Melbourne, 1984), p.22.
ibid., pp.53-54.59
ibid., p.75.60
with Castlemaine Perkins of Brisbane. In 1981, Adelaide Steamship bought th e56
brewing business of Tooth’s. Two years la ter, in 1983, Carlton and United Breweries ofMelbourne bought the Tooth’s brewing business from Adelaide Steamship. In 1985, theBond Corporation acquired effective control of Castlemaine-Toohey’s, with Toohey’s,in 1987, being renamed Bond Brewing NSW Ltd. (although the Toohey’s brand namewas kept). In 1990, Lion Nathan of New Zealand gain ed the controlling interest in BondBrewing NSW Ltd. from the col lapsed Bond Corporation, and Toohey’s was reinstatedas a state-based brewing undertaking. 57
(b) Tobacco
Tobacco consumption, similarly, was well established in Britain, at the time that Philliparrived in Australia and the practice w as maintained by many of the English people thatsubsequently came out to New South Wales.
As in the case of beer production, it was not long before local business people becameinvolved in the tobacco trade. Unlike beer, however, the basic ingredients could not beproduced at home. Although there were a number of attempts to grow tobacco locally,these, essentially, were not fruitful - successful cultivation of tobacco not taking placeuntil the 1930s.
A number of new arrivals to the colony did, however, establish concerns to impor ttobacco and process it into tobacco products. In 1862, Hugh Dixson, who had lef tScotland in 1839, set up a partnership with his sons and, in 1883, they established oneof the largest factories in Sydney, for the purposes of producing pipe and cigar tobacco.Another Scottish family, the Cameron’s, also established a large tobacco factory i nSydney.58
The advent of cigarettes, first made by hand in England during the 1850s, furthe rincreased accessability to smoking. During the 1880s, W.D. and H.O. Wills, in Britain,began to make cigarettes by machine. Although smaller companies, in Australia ,continued to make cigarettes by hand, Wills, at its Kensington plant in Sydney ,introduced machines into cigarette production in the early 1900s. By 1909, Wills ha dover 70% of the then Australian market for cigarettes. 59
During the 1950s, 1960s and 1970s production expanded even further. In New Sout hWales, Rothmans, also of Britain, opened a factory at Granville, in Sydney, in 1955. 60

Alcohol and Tobacco in NSW: Consumption, Revenue and Concern 17
Walker, op.cit., p.75.61
Tobacco Institute of Australia, Tobacco Industry Fact Sheet (Tobacco Institute of Australia,62
Sydney, 1995).
Powell and McGovern, ibid.63
Sally Jackson, “Tobacco Stocks Singed by Price War” in The Australian, 22 March 1997,64
p.55 citing estimates produced by Deutsche Morgan Grenfell.
Wills continued in production at Kensington.
On an Australia-wide level, however, Victoria also began to emerge as a centre o ftobacco manufacturing when Philip Morris of the USA established a factory i nMelbourne, in 1954.61
During the the 1980s and 1990s, however, production has declined somewhat. Th eTobacco Institute of Australia has estimated the total quantity of cigarettes produced ,throughout the whole of Australia, as follows:
Australian Total Quantity of Cigarettes Produced
1970-1971 27.9 billion (1.4 billion packets of 20)1975-1976 31.9 billion (1.6 billion packets of 20)
1980-1981 34.1 billion (1.7 billion packets of 20)1985-1986 32.9 billion (1.6 billion packets of 20)1990-1991 35.6 billion (1.8 billion packets of 20)1993-1994 31.6 billion (1.5 billion packets of 20) 62
New South Wales is significant in the overall output of tobacco products in Australia.Powell and McGovern remarked in 1986 that “NSW is the main tobacco manufacturingstate in Australia. . .NSW has increased its share of the Australian industry to just over40 per cent”.63
During the 1990s, the share of tobacco manufacturing in New South Wales appears tohave increased even more. In 1997 the approximate shares of the Australian tobacc omarket held by Rothmans and W.D. and H.O. Wills, based in Sydney, were 33.5% and29% respectively: 62.5% of the national market overall. Philip Morris held 37.5%. 64
New South Wales’ approximate share of national cigare tte production - based on having40% in 1986 and around 60% in the mid-1990s - would seem to be as follows:

Alcohol and Tobacco in NSW: Consumption, Revenue and Concern18
Margaret Winstanley, Stephen Woodward and Noni Walker, Tobacco in Australia: Facts65
and Issues, second edition (Quit Victoria, Melbourne, 1995), p.243.
Walker, op.cit., p.34.66
Cigarettes Produced in New South Wales(estimated)
1985-1986 13.2 billion (640 million packets of 20)1993-1994 18.9 billion (900 million packets of 20)
In terms of value of sales, Margaret Winstanley and her colleagues have written that,
In 1994, the cigarette market generated more than $5,400 million in sale sthrough all types of grocery outlets (including supermarkets), far outstrippin gother product categories such as confectionary ($757 million), breakfast cereals($660 million) and ice-cream (470 million). 65
New South Wales’ share of the value of cigarette sales, based on an approximate shareof around 60%, would appear to be around $3.2 billion.
Robin Walker has estimated the annual consumption of tobacco per person in NSW ,during the late 1800s, as follows:
Annual Average Consumption of Tobacco per Person in Australia
1894 1.14 kilograms66
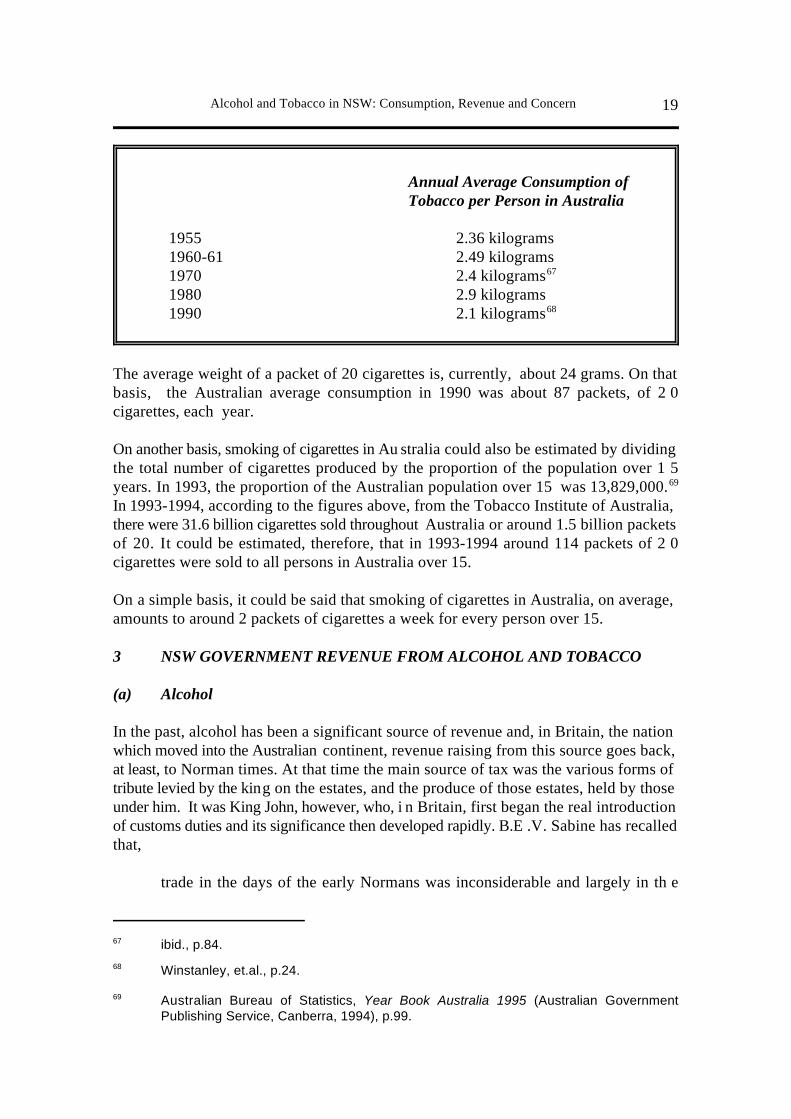
Consumption since then has also grown reaching a peak in the early 1980s and the ngradually declining, as the following figures indicate:
Alcohol and Tobacco in NSW: Consumption, Revenue and Concern 19
ibid., p.84.67
Winstanley, et.al., p.24.68
Australian Bureau of Statistics, Year Book Australia 1995 (Australian Government69
Publishing Service, Canberra, 1994), p.99.
Annual Average Consumption of Tobacco per Person in Australia
1955 2.36 kilograms1960-61 2.49 kilograms1970 2.4 kilograms67
1980 2.9 kilograms1990 2.1 kilograms68
The average weight of a packet of 20 cigarettes is, currently, about 24 grams. On thatbasis, the Australian average consumption in 1990 was about 87 packets, of 2 0cigarettes, each year.
On another basis, smoking of cigarettes in Au stralia could also be estimated by dividingthe total number of cigarettes produced by the proportion of the population over 1 5years. In 1993, the proportion of the Australian population over 15 was 13,829,000.69
In 1993-1994, according to the figures above, from the Tobacco Institute of Australia,there were 31.6 billion cigarettes sold throughout Australia or around 1.5 billion packetsof 20. It could be estimated, therefore, that in 1993-1994 around 114 packets of 2 0cigarettes were sold to all persons in Australia over 15.
On a simple basis, it could be said that smoking of cigarettes in Australia, on average,amounts to around 2 packets of cigarettes a week for every person over 15.
3 NSW GOVERNMENT REVENUE FROM ALCOHOL AND TOBACCO
(a) Alcohol
In the past, alcohol has been a significant source of revenue and, in Britain, the nationwhich moved into the Australian continent, revenue raising from this source goes back,at least, to Norman times. At that time the main source of tax was the various forms oftribute levied by the king on the estates, and the produce of those estates, held by thoseunder him. It was King John, however, who, i n Britain, first began the real introductionof customs duties and its significance then developed rapidly. B.E .V. Sabine has recalledthat,
trade in the days of the early Normans was inconsiderable and largely in th e
Alcohol and Tobacco in NSW: Consumption, Revenue and Concern20
B.E.V. Sabine, A Short History of Taxation (Butterworths, London, 1980), pp.4-5, 29,43-70
45.,119.
ibid., pp.93,126.71
Charles Bastable, Public Finance (London, MacMillan, 1892), p.499.72
hands of foreigners. . .income [from this source] was equally inconsiderable. Theprincipal import was wine and a toll was taken by the king’s officer from everyship having a cargo of ten casks or more. . .this toll dates from at least 1055. . .itwas John... who. . .was to establish customs duties on all goods imported o rexported at a rate of one-fifteenth in 1202. . .by. . .1369. . .out of the roya lrevenue [of Edward III] customs averaged £48,000, clerical and lay subsidie s£20,000 and £18,000 respectively, and hereditary revenues some £19,000. ..customs. . .[was] now. . . the sheet-anchor of the revenue, amounting to a thirdor even half of the total. . .By 1815. . .the. . .yield from customs. . .[was] still themainstay of the national income . . . 70
Associated with revenue from customs was another tax which emerged in the 1600s -excise. This, also, quickly became a prominent source of revenue. Sabine has writte nthat,
. . .in. . .1643 Parliament passed the first ordinance for lev ying excise. It was paidby the manufacturer on articles of domestic production and by the first buyer onimports, acting as a sort of customs surcharge. . .in 1851. . .income tax was. . .providing about 10 percent of the revenue. . .well behind customs and excise at38 per cent and 25 per cent respectively. . . 71
Alcohol, in Britain during this period, was a key source of both customs and excis erevenue. Professor Charles Bastable observed in 1892 that, “The bulk of custom srevenue is made up of drink and tobacco duties, the former giving £4,800,000. . .in theyear 1890-1.” In the area of excise, alcohol was also very important. Bastable wrote72
that,
During the eighteenth century the process of building up the excise by. . .th eincrease of the rates on those [items] already taxed was in process. Breweries anddistilleries were soon placed under charge; the malt duty was imposed (1697 )and later on developed into an important tax. . .the war. . .with France [1792 -1815]. . .caused fresh applications of taxation. . .[after] the return of peace. . .itbecame possible to carry out some moderate reforms. . .They may be said t oconsist in: (1) the elimination of raw materials from the list of goods liable t oduty; (2) the contraction of that list to a very small number articles, and (3) theplacing of the weight of internal taxation on alcoholic drinks. . .During the halfcentury 1830-80 the malt tax was the mode in which beer and ale were taxed. ..Its large yield - £8,000,000 in 1877 - made it impossible to repeal it, but in 1880the existing duty on beer was imposed in its place. . .The returns from the beerduty for the ten years 1881-90 have quite real ised expectations. For 1889-90 the
Alcohol and Tobacco in NSW: Consumption, Revenue and Concern 21
Ibid, pp.457-461.73
Noel Butlin, Forming a Colonial Economy: Australia 1810-1850 (Cambridge University74
Press, Melbourne, 1994), pp.89-91.
Lewis, op.cit., p.17.75
amount was £9,400,000. 73
Initially the financial means of supporting the colony in Australia was provided b yTreasury bills but gradually the British governmen t instituted a reliance on customs andexcise as the major sources of revenue. Noel Butlin has recalled that, following th earrival of British forces in 1788,
Treasury bills drawn on Britain. . .had been the dominant sources of total chargesraised in NSW. . .after 1820. . .NSW. . .was compelled to look to its ow ncapabilities to fund public purposes. . .Customs and excise. . .revenue lifte dsharply in 1825. . .Although the depression of the 1840s forced contraction ,customs and excise during the decade to 1850 was typically the major source ofpublic funds in the colony. 74
A large share of customs revenue came from imposts levied on imports of spirits an dwine and, as beer production expanded in the colony (particularly when Tooth’s an dToohey’s began operations), a significant share of revenue was also levied from a nexcise on beer production (introduced in 1887). Milton Lewis has observed that, “NewSouth Wales receipts from alcohol were, in 1860, almost 34 per cent of total revenue.In 1900 they were still almost 11 per cent of total revenue.” An illustration of the75
colony’s reliance on revenue from alcohol is provided by the following figures:

Alcohol and Tobacco in NSW: Consumption, Revenue and Concern22
ibid., pp.18-19.76
Sabine, op.cit., pp.114,119,122.77
Philip Bagwell and George Mingay, Britain and America: A Study of Economic Change78
(Routledge and Kegan Paul, London, 1970), p.222.
Customs Receipts Customs Receipts Excise TotalNSW
(Spirits) (Wine) (Beer) Revenue
1860 £302,000 £28,000 £1,309,000(25%)
1870 £320,000 £22,000 £2,103,000(16.5%)
1880 £600,000 £41,000 £4,412,000(14.7%)
1890 £823,000 £46,000 £120,000 £9,495,000(9.5%)76
After federation of the colonies, customs and excise levying was transferred to the newCommonwealth government.
Revenue from customs and excise, as will be disc ussed later in this paper, is categorisedas indirect taxation. Both in Britain and in Australia, however, governments wer elooking to new forms of revenue - which later came to be categorised as direct taxation.In 1798, Pitt, as Prime Minister in Britain, had introduced income tax as an additionalmeans of financing the war with France. Under pressure from the wealthier sections ofthe population, the British government repealed the income tax in 1816. In 1842, Peelreinstituted the income tax at a low rate of 7 pence in th e £. The first decided use of the77
income tax as a means of public finance, in Britain, came in Lloyd George’s first termas Prime Minister. According to Bagwell and Mingay,
in 1909 Lloyd George raised the income tax to 1s 2d in the pound - a nunprecedented level in peace time. ‘This is a war budget,’ said Lloyd George, ‘itis for raising money to wage implacable warfare against poverty an dsqualidness.’78

Alcohol and Tobacco in NSW: Consumption, Revenue and Concern 23
Sabine, op.cit., p.139.79
Derek Aldcroft, The British Economy between the Wars (Philip Alan, Oxford, 1983), p.100.80
Sabine, op.cit., p.132.81
Julie Smith, Taxing Popularity: The Story of Taxation in Australia (Federalism Research82
Centre, Australian National University, Canberra, 1993), p.152.
Douglas Copland, “Australia in the World War (III) Economic” in Ernest Scott (ed.),83
Cambridge History of the British Empire, Vol. VII, part I, Australia, first published 1933(Cambridge University Press, Melbourne, 1988), p.592.
Expansion of income tax then occurred very rapidly in Britain because of the enormousexpenditure required during the First World War. Sabine has recalled that Reginal dMcKenna, Chancellor of the Exchequer,
was forced the meet the challenge of daily expenditure of the £4.5 million mark.. . The Budget (1915). . .ushered in. . .income tax. . . [of] 3s 6d in the £. . .By theend of the war income tax had changed ou t of all recognition. . .yield from some£34 million pre-war [rose] to nearly £585 million in 1918. 79
Derek Aldcroft has written that,
In 1913-14 five sources contributed 85% of the. . .government’s revenue; theywere income and surtax [a special tax on incomes above a certain level] (27 percent), estate duties (16), alcohol (25), to bacco (11) and tea and sugar (6). By themiddle of the 1920s these five items still produced 80 per cent of the revenue ,though. . . income and surtax now provided 43 per cent of the total. . . 80
In Britain, from the 1920s onwards, the emphasis moved towards direct tax - particularlyas political parties committed to social equity saw indirect tax as impacting unfairly onthe poor. Sabine has commented that “the growing. . .Labour [Party] was consistentlyopposed to any extension of indirect taxation, basically because of its lack o fdiscrimination between rich and poor.” 81
To finance Australia’s participation i n the Great War in Europe, the Fisher government,in 1915, also introduced an income tax and a tax on undistributed company profits. 82
Douglas Copland commented in 1933 that, “Of the new Commonwealth taxes by far themost important was the income tax, which in 1917-18 was responsible for £7,400,000out of a total tax revenue of £24,600,000, of which customs and excise accounted for£13,200,000. 83
In Australia, during the 1920s, income tax, as a source of federal government revenue,still remained behind customs and excise. Professor Findlay Shirras noted in 1936 that,“Excise duties were increased from 25th September 1918. The Commonwealth revenuefrom excise was £127,041 in 1914 and £11,928,000 in 1933-34, or over half that o f
Alcohol and Tobacco in NSW: Consumption, Revenue and Concern24
G. Findlay Shirras, Science of Public Finance, vol.II, third edition (MacMillan, London,84
1936), pp.660-661.
Smith, op.cit., p.51.85
Ibid, p.71.86
Australian Taxation Office, Annual Report 1995-96 (Australian Government Publishing87
Service, Canberra, 1996), p.292.
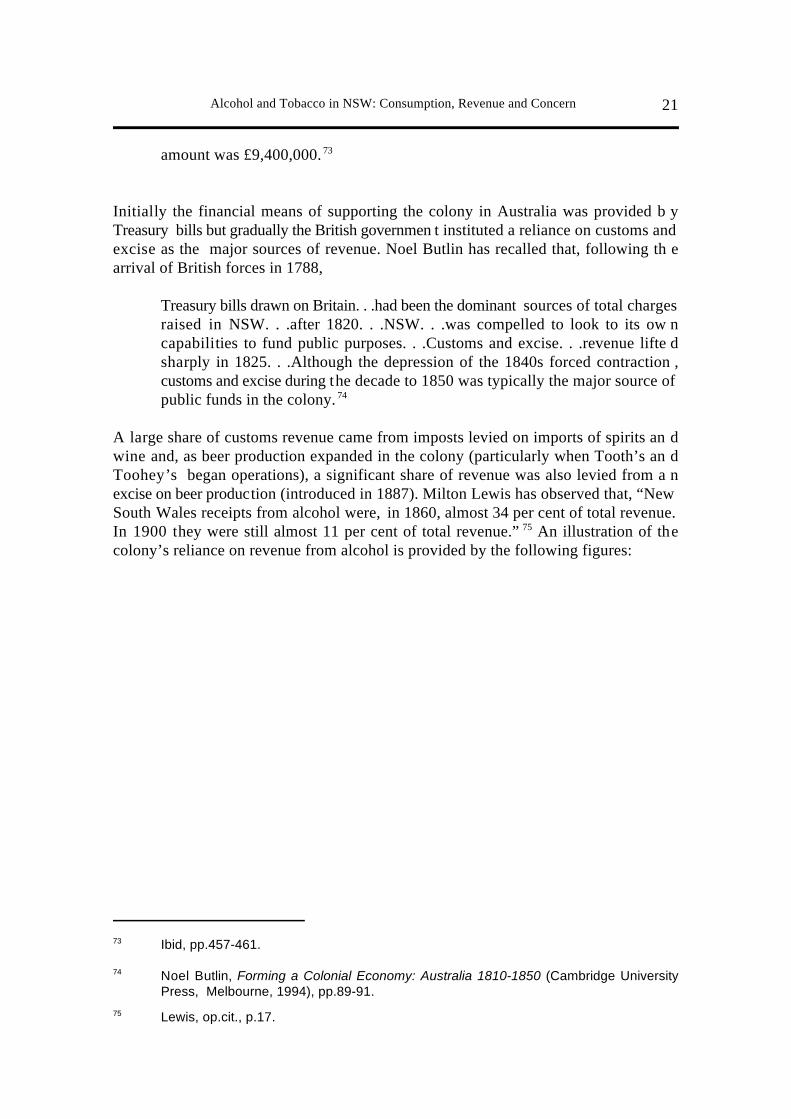
customs (£22,327,000) out of a total Commonwealth revenue of £56,409,000.” 84
In 1930, in response to the drop in government revenue brought about the depression,a new addition to indirect tax was intr oduced by the then Scullin government - the salestax, levied at a rate of 2.5% on goods at the wholesale stage of distribution. 85
It was the war in the Pacific, and the Curtin government’s need for large-scale revenueto support Australia’s involvement, which saw the dramatic rise in reliance on incometax as a source of revenue. By the last year of the following Chifley government’s termin office the proportion of federal government revenue from income tax, compared tocustoms and excise and sales tax, was as follows:
Federal Government Revenue 1948-1949
Income Tax 57%Customs and Excise 27%Sales Tax 8%86
Present day proportions of income tax, and other direct taxes, in overall federa lgovernment tax revenues, are as follows:
Australian Federal GovernmentDirect Tax Revenue 1995-1996
Income Tax $67.2 billionCompany Tax $18.2 billionTotal From All Direct Tax Sources $98.4 billion87
Present day shares of indirect tax, by source, are as follows:

Alcohol and Tobacco in NSW: Consumption, Revenue and Concern 25
Treasurer of the Commonwealth of Australia, Budget Statements 1996-97, Budget Paper88
no.1 (Australian Government Publishing Service, Canberra, 1996), p.4-36.
Lewis, op.cit., pp.20-21.89
Shirras, ibid.90
Australian Federal GovernmentIndirect Tax Revenue 1995-1996
Sales Tax $12.9 billionExcise Duty: Petroleum Products $10.2 billionExcise Duty: Alcohol and Tobacco $2.6 billionCustoms Duty: Imports $3.1 billionTotal from All Indirect Tax Sources $28.9 billion88
Alcohol, consequently, is not the outstan ding source of revenue as it used to be. It does,however, continue to make a contribution of some significance - first as an element offederal revenues on imports, as illustrated:
Commonwealth Customs Duties: Spirits Beer Wine
1949-50 $2,038,000 $549,000 $16,0001959-60 $9,401,000 $58,000 $72,0001969-70 $28,099,000 $161,000 $616,0001979-80 $174,626,000 $494,000 $2,282,0001984-85 $264,553,000 $2,776,000 $6,957,00089
Excise duties on alcohol, during the 1920s and 1930s, rose to become very significantfor federal government revenue. Findlay Shirras wrote in 1936 that,
In Australia, the Commonwealth excise revenue is confined to beer, spirits ,tobacco, and starch, and also some direct taxes, as in the case of Great Britain,namely licences. The excise revenue in 1933-34 was 23 per cent of th eCommonwealth tax revenue. In 1925-26 beer yielded more than half. . .of th eCommonwealth excise revenue. Since 1917-18 the revenue from [this] item ..has [surged]. . .90
Since the Pacific War, however, as outlined above, the main emphasis in federa lgovernment revenue has shifted to income tax. Nevertheless, successive federa l

Alcohol and Tobacco in NSW: Consumption, Revenue and Concern26
Lewis, op.cit., p.39. Stubbs has written that Menzies increased the rate of excise by about91
37%. Stubbs op.cit., p54.
Frank Crowley, Tough Times: Australia in the Seventies (William Heinemann, Melbiourne,92
1986), pp.99,132.
Thoeming, op.cit., p.147.93
Dunstan, op.cit., p.146.94
Thoeming, op.cit., p.159.95
ibid., p.174.96
O’Donnell, ibid.97
governments have still looked to excise on alcohol as a means of increasing revenue.Millton Lewis has observed that,
When the Menzies Liberal-Country Party government increased the beer excisein 1956 by 2 shillings and 8 pence a gallon. . .the Brewing and Wine Journal[commented on the] . . .‘terrific imposts drawn from the public from the liquorindustry’. . .The President of the South Australian Licensed Victualler sAssociation . . .pointed out that beer excise had grown by 5,800 per cent since1911-12 and the industry contributed 10 per cent of total federal revenue. 91
This reliance on excise duties on alcohol continued during the 1970s and 1980s. Th eWhitlam government, while having a commitment, as Treasurer Frank Crean declared,to a “program of social reform”, set out to finance its objectives as much by indirect asby direct taxation. Crean’s first budget, in 1973, according to Frank Crowley, sought toincrease revenue by “raising the excise on cigarettes, spirits and petrol”. In 1975, in92
its last year of office, the Whitlam government significantly increas ed the excise on beer.Peter Thoeming has noted that, “In the August 1975 Federal Budget, beer excise wa sincreased by 56 per cent.” Keith Dunstan has written that,93
On the night of 19 August 1975, the Federal Treasurer, Mr. Hayden, on behalfof the Labour government, brough t down the. . .budget. . .beer went up 11 centsa bottle, bringing the price to 70 cents. The federal tax went up 11 cents to 3 0cents . . .On draught beer an 18-gallon kilderkin, which used to cost hotel s$30.76 wholesale, now cost $41.92 with excise rising from $19.97 to $31.13. 94
Only three years later, the Fraser government, with John Howard as Treasurer, in th eAugust 1978 Budget, according to Thoeming, “increased the excise on beer by 32 percent.” During fiscal year 1978-1979, Toohe y’s alone paid $158 million in excise duty. 95
In its August 1982 Budget, the Fraser government raised the excise again - by 15%. Ayear later the new Hawke government, with Paul Keating as Treasurer, once mor eincreased the level of excise. O”Donnell has written that, in the August 1983 Federal96
Budget, the beer excise . . .rate was [to be] increased every six months in line with thecost of living.” 97
Alcohol and Tobacco in NSW: Consumption, Revenue and Concern 27
Lewis, op.cit., pp.20-21.98
Budget Statements 1996-97, ibid.99
Peter Walsh, Confessions of a Failed Finance Minister (Random House, Sydney, 1995),100
pp.119,256.
Commissioner of Taxation, op.cit., p.208.101
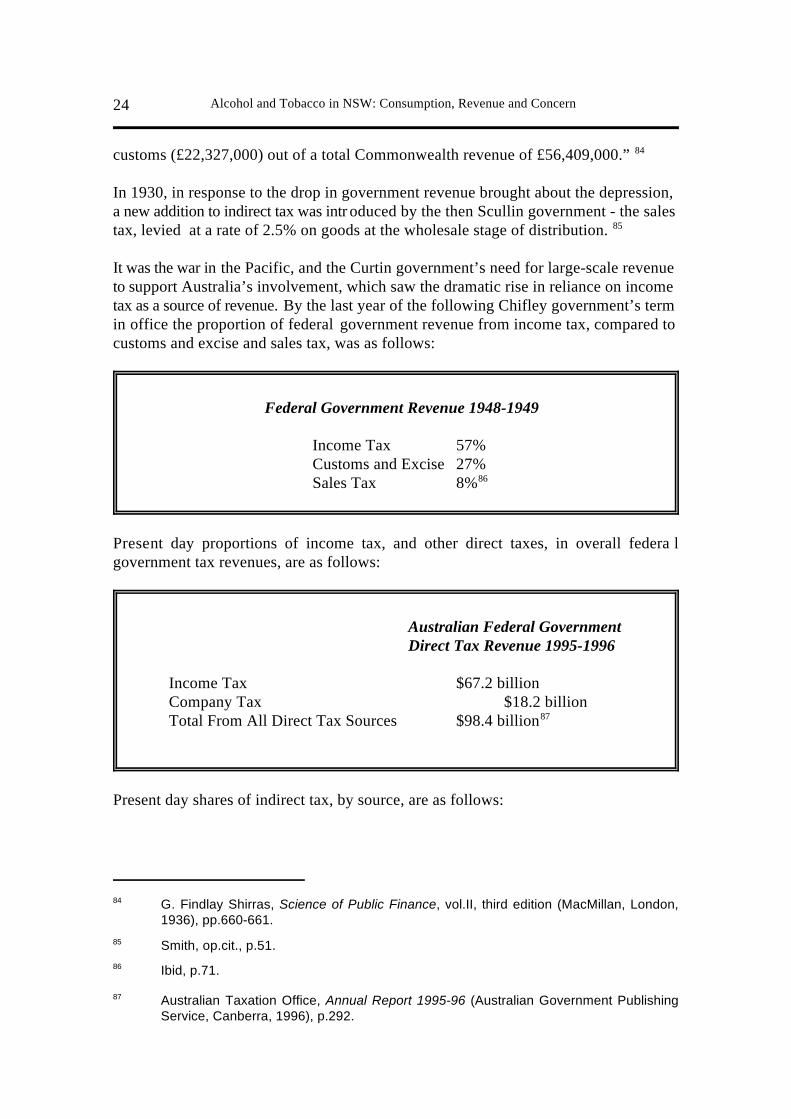
This is highlighted, over the two decades, by the figures below:
Commonwealth Excise Duties: Beer Spirits
1949-50 $66,804,000 $13,852,0001959-60 $219,448,000 $17,366,0001969-70 $369,937,000 $26,525,0001979-80 $1,003,316,000 $100,156,0001984-85 $1,176,736,000 $119,776,00098
1995-96 $829,000,000 $197,000,000 99
Wine sales, during the period of the Hawke government, in the 1980s, were finally alsofocused on as a source of federal government revenue. Peter Walsh, Finance Ministerin the Hawke government, recalled that,
The 1984 Budget did include. . .the 10 per cent wholesale sales tax on wine .Wine had never before been taxed, except for a brief period after the Gorto ngovernment imposed a 50 cent a litre excise in 1970, later reduced to 25 centsand later still abolished by the Whitlam government. . .in the 1986 Budget. ..sales tax changes . . .includ[ed] an increase to 20 per cent on the wholesale taxon wine. . .the 20 per cent wholesale sales tax levied after 1986 was still highlyconcessional compared with taxes on beer or spirits. 100
Indeed sales tax on alchol has become a revenue source of some significance for th efederal government as the following figures show:
Australian Federal Government Sales Tax on Beer, Wine andSpirits
1986-87 $257 million1989-90 $933 million1995-96 $1.3 billion101
On a state level, licence fees for publicans were alr eady in existence during the time that
Alcohol and Tobacco in NSW: Consumption, Revenue and Concern28
Beresford, op.cit., p.68 citing Sydney Morning Herald, 11 October 1870.102
The Official Year Book of New South Wales 1913 (NSW Government, Sydney, 1914),103
pp.465-466.
NSW Treasury, Introduction to Government Finance and Accounting in New South Wales104
(NSW Treasury, Sydney, 1987), p.30.
Treasurer of New South Wales, NSW Budget 1996-97, budget paper no.2 (NSW Treasury,105
Sydney, 1996), p.3-6.
New South Wales was a colony. The Sydney Morning Herald noted in 1870 that, “thelicence fee brings in a good round sum, which ministers dare not curtail”. 102
Although New South Wales was excluded from levying customs and excise duties onalcohol after federation, it continued to raise revenue from liquor by licences. After theelection the first Labor government in New South Wales, in 1910, the new Labo rPremier, James McGowen, sought to rationalise liquor legisl ation in the state. Two yearslater he secured passage of the Liquor Act 1912 which not only became an umbrella actfor liquor related activities in the state but maintained the use of liquor licences. Th eOfficial Year Book of New South Wales 1913 noted that,
The annual fee for a publican’s licenc e is regulated by the annual assessed valueof the hotel. During the year 1912, an amount of £77,026 was collected o naccount of such licences. . .the Liquor Act provides for the issue of ‘AdditionalBar’ licences to the holders of publicans’ licences, when liquor is to be sold inmore than one room in the licensed premises. During the year 1912 there were124 of these licences granted, the total amount of licence fees collected bein g£2,423. . .In 1912 there were 186 Spirit Me rchant licences, for which the licencefees amounted to £4,720...In 1912. . .Clubs [at which liquor is sold]. . .numbered76, for which licence fees amounting to £869 were collected. . . 103
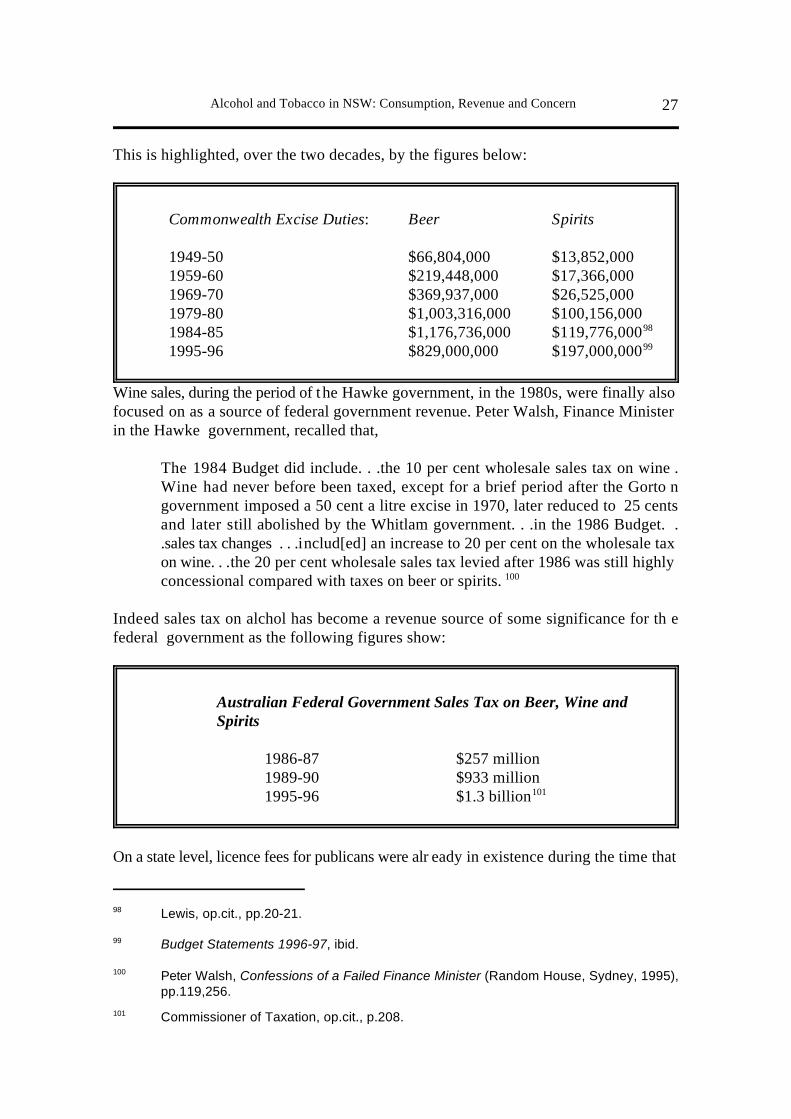
By the 1980s revenue from liquor licences had bec ome considerable and have increasedeven further during the 1990s:
NSW Revenue from Liquor Licences
1985-86 $138 million104
1995-96 $285 million105
b) Tobacco
In Britain customs revenue from tobacco develop ed into an important source of revenuefrom the 1649 onwards, when the British established Virginia. Charles Bastabl e

Alcohol and Tobacco in NSW: Consumption, Revenue and Concern 29
Bastable, op.cit., pp.495-499.106
Shirras, ibid.107
Winstanley, et.al., op.cit., p.142.108
observed in 1892 that,
the English custom systems. . .expanded in the seventeenth century. . .receipts -derived from the general tax of five per cent on all imports and exports, and theduties on wine, cloth, tobacco, silk and brandy - rose. . .to nearly. . .£1,000,000in 1688. . .by 1702 they came to £1,500,000. . .the eigh teenth century. . .brought.. . further extra duties on sugar and tobacco. . .The bulk of the customs revenueis made up of drink and tobacco duties. . .the l atter [providing] £9,500,000 in theyear 1890-1.106
After the federation of the colonies, New South Wales ceded its right to levy excise tothe new Commonwealth government. Tobacco levies were then used by the federa lgovernment - as it did with alcohol - to provide a considerable source of governmentrevenue. Professor Findlay Shirras noted that, “In 192 5-26 [excise duties on]. . .tobacco[yielded] slightly less than one-third of the Commonwealth excise revenue.” 107
In 1974, however, the Victorian state government introduced a stat e tobacco licence fee.Subsequently the Askin government in New South Wales in its last year in office ,obtained passage of the Business Franchise Licences (Tobacco) Act 1975 which nowintroduced, in the area of tobacco sales, a form of state levy which had already bee nimposed in the area of alcohol sales for many years. Margaret Winstanley and he rcolleagues have written, in regard to such licences, which have now been introduced inall states, that,
The fee is a charge on both wholesalers and retailers of tobacco products, eachof which must pay a set licence fee at prescribed intervals. Additionally ,wholesalers must pay a dollar percentage of the wholesale value of tobacc osold. 108
Initially the impost was modest but, gradually, the following Wran, Unsworth, Greinerand Fahey governments significantly increased the rate:

Alcohol and Tobacco in NSW: Consumption, Revenue and Concern30
ibid., p.144.109
Winstanley, et.al., p.145.110
NSW Budget 1996-97, ibid.111
Licence Fee Charges in NSW as a Percentage of theValue of Tobacco Sold
1975 10%1983 15%1985 25%1986 30%1990 35%1992 50%1993 75%109
1995 100%
The amount of revenue collected from tobacco licence fees has likewise rise nsignificantly:
Revenue from Tobacco Licence Fees in New South Wales
1976 $19 million1980 $42 million1986 $113 million1989 $204 million1990 $282 million1992 $388 million1993 $595 million1994 $633 million110
1996 $872 million111
4 SOCIAL CONCERN OVER ALCOHOL AND TOBACCO CONSUMPTION
(a) Alcohol: Past Scrutiny by Church Groups, 1850s-1950s
Each generation has established scrutinies of alcohol and, more recently, tobacco, as ,within each generation, the same problems with alcohol, and tobacco consumption ,

Alcohol and Tobacco in NSW: Consumption, Revenue and Concern 31
Beresford, op.cit., p.6.112
David Dunstan, “Boozers and Wowsers” in Verity Burgmann and Jenny Lee (eds.),113
Constructing a Culture: A People’s History of Australia since 1788 (McPhee Gribble,Melbourne, 1988), p.102; see also Beresford, op.cit., p.101.
Beresford, p.30.114
ibid., p.49.115
ibid., p.252.116
have re-emerged.
On a governmental level, in New South Wales, the first parliamentary inquiry into theproblems of drinking was established in 1854 by the Legislative Council. In 1887 the112
New South Wales parliament established the Intoxicating Drink Inquiry Commission -a body which included John Toohey of Toohey’s Brewery as a representative of th ebrewing industry. One of the conclusions of the commission was that the “largest partof the poverty and squalor which exists in certain parts of Sydney” could be attributedto “the squandering of money upon drink”. 113
The prime movers in the scrutiny of alcohol, in nineteenth century New South Wales,were the Protestant Church groups - particularly the more evangelical of these. Th eChurch of England was the largest protestant group, with around 220,000 members .Next were the Presbyterians, with around 49,000 members, and the Methodists wit habout 39,000 members. On an overall level, the protestant church groups, collectively,formed the largest section amongst church-goers in Sydney - Catholics formed onl yaround 30%. In the late nineteenth century the protestant church groups particularly114
focused their attention on alcohol as a anti-social influence. In 1873 the Anglican Deanof Sydney, the Reverend Greenwood, declared that public houses had “swallowed upthe income of families”. 115
Women were another section of the community who were particularly affected by theadverse effects of alcohol consumption. A stipendiary magistrate told the IntoxicatingDrink Inquiry Commission that he and his fellow magistrates heard “cases every day”concerning “the drunken habits of husbands”. 116
Towards the end of the nineteenth century, and into the first half of the twentiet hcentury, the protestant church groups increased their ability to organise on the alcoholissue, and were correspondingly more and more able to influence government policy.Not only was the NSW parliament’s Intoxicating Drink Inquiry Commission largely aninitiative of the Protestant members of parliament, but their efforts were finally directlymanifested in the policy of the Carruthers government. In his campai gn for the July 1904state election, Carruthers had made concern over alcohol a direct issue and he late rdescribed drinking and gambling as “the two great curses of the country”. Following hiselection, he secured passage of the the Liquor Amendment Act 1905 which, as outlinedabove, not only set out to restrict the outlets for alcohol but, through the local optio n

Alcohol and Tobacco in NSW: Consumption, Revenue and Concern32
ibid., pp.206-213.117
ibid., p.58.118
Walter Phillips, “‘Six o’clock Swill’: The Introduction of Early Closing of Hotel Bars in119
Australia” in Historical Studies, vol.19, no.75, October 1980, p.260.
Beresford, op.cit., pp.235-251.120
ibid., p.278.121
program, offered the public the opportunity to reduce the number of public houses. 117
Carruthers’ legislation, rather than inducing the protestant church groups to relax, onlyencouraged their efforts - in particular to achieve the closure of public houses at 6 pm.In the early 1860s the NSW colonial government, under Charles Cowper, as mentionedabove, had obtained passage of the Licensed Publicans Act 1862 which set the hours ofclosure at 10 pm. Ever since then the protestant church groups had advocated earlier118
closure and the holding of a referendum in South Austr alia, in 1915, in which a majorityof citizens voted for 6 pm closing, encouraged the protestant groups in New Sout hWales. In May 1915 a huge meeting was held at t he Sydney Town Hall and, using the119
Great War and its associated imperatives for efficient production as further reason, theprotestant church groups, led by the Anglican Archdeacon of Sydney, marched t oParliament House to present a huge petition for 6 pm closing.
Women’s groups were particularly active in the campaign with the formation, i nFebruary 1916, of the National Women’s Movement for 6 pm closing.
The ALP Premier of New South Wales, Wi lliam Holman, did not endorse these goals -in fact he subsequently referred to 6 pm closure as a “superficial issue”. However, i nJune 1916, Holman reluctantly held a referendum on early closing: a referendum whichwas won overwhelmingly by the proponents of 6 pm closing (the vote was 329,582 infavour of 6 pm closing versus 169,950 in fa vour of 9 pm closing). Holman then, even120
more reluctantly, had to obtain passage of the Early Closing Act 1916 to enact the wishesof the electors.
Once more, rather than relaxing their efforts, the protestant church groups wer eencouraged even more by the victory over 6 pm closing. The introduct ion of nation-wideprohibition in the USA, in 1920, encouraged them further and Sir George Fuller’ sNationalist Party, which won the NSW electi ons of November 1921, had a section in itsparty policy calling for the holding of a referendum on state-wide prohibition. After hiselection, however, Fuller hesitated on the holding of a referendu m - and then announcedthat it would be held in 1928. The referendum was duly held, in 1928, while ThomasBavin’s Nationalist-Country Party coalition was in government. 833,652 people votedagainst state-wide prohibition of alcohol while 336,771 voted in favour. 121
Women’s groups were active in the campaign, although not to the same extent as in the

Alcohol and Tobacco in NSW: Consumption, Revenue and Concern 33
ibid., pp.283-284.122
Dillon, op.cit., p.143.123
ibid., p.148.124
Joel, op.cit., p.123.125
Dillon, op.cit., pp.159-160.126
Lewis, op.cit., p.92.127
6 pm closing campaign. The Women’s Citizens organisation, the Business Women’ sLeague and the Women’s Prohibition League, however, did campaign actively in favourof prohibition.122
The 1928 referendum on total prohibition of alcohol in New South Wales was the highpoint of the protestant church groups’ efforts in the scrutiny of alcohol consumption.
After 1928, at least for several decades, the opportunity to consume alcohol wa sidentified with enjoyment and - with the advent of radio, cinema, cars and aeroplanes -the era for this seemed to have arrived. The Bavin governme nt appeared to endorse this,as soon as the referendum was over, by suspending the local option provisions. Just123
after the Second World War, as mentioned above, the McKell government set out t owithdraw the restrictions on alcohol consumption. Not only did McKell obtain th epassage of legislation paving the way f or the increase in the number of registered clubs,but he also set out to lengthen the hours of opening: initiating a referendum in earl y1947. Although the referendum was lost, with 1,051,260 people voting for the retentionof 6 pm closing and 604,833 voting for 10 pm, it seemed that restrictions on124
consumption of alcohol now belonged to the past. Subsequently, in 1954, as als ooutlined above, Cahill’s government intiated a referendum which finally saw the publicnarrowly endorse lengthened hours of opening - 902,532 for 10 pm and 892,740 fo rretention of 6 pm. 125
As mentioned above, a certain amount of influence was still capable of being exercisedby the church groups. The New South Wales Protestant church groups, through th eNSW Temperance Alliance, played a significant part in ensuring that the Aski ngovernment held a referendum on Su nday trading - rather than just passing legislation -and they played a significant part in ensuring a “no” v ote when the referendum was heldin 1969. 126
Milton Lewis has commented that, despite the Wran government’s introduction o fSunday trading, in 1979, the Protestant church groups continued to monitor any furtherextension of trading hours. Lewis has written that, following its election in 1988, “theGreiner government . . .instituted a review of the liquor industry. It retreated fro mallowing 24-hour trading in the face of opposition from Churches”. 127
(b) Alcohol: Present Day Scrutiny by Health Groups and Women’s Groups

Alcohol and Tobacco in NSW: Consumption, Revenue and Concern34
Senate Standing Committee on Social Welfare, op.cit., p.25. Pierre Stolz, then executive128
director of the Australian Foundation on Alcoholism and Drug Dependence, wrote in 1978that, “Alcoholism has been ranked as the fourth major health problem in Australia. . .Basedon past Australian surveys, it is estimated that. . .300,000 persons. . .are suffering fromalocholism in Australia. There are an additional 300,000 persons whose drinking habits canbe described as hazardous”. See Pierre Stolz, “The Australian Foundation on Alcoholismand Drug Dependence: A National Perspective” in A.P. Diehm, R.F. Seaborn and G.C.Wilson (eds.), Alcohol in Australia: Problems and Programmes (McGraw-Hill, Sydney,1978), p.227.
Senate Standing Committee on Social Welfare, op.cit., pp.46,62.129
In the past then, as described above , scrutiny of alcohol tended to come from Protestantchurch groups and these, over the years, came to be seen by some as the enemies o fenjoyment. As people came to see themselves as up to date, anti-alcohol views, an dtheir church-going proponents, were seen as out of date.
Just when restrictions on consumption of alcohol were being completely relaxed ,however, scrutiny of alcohol has resurfaced, but from different sources.
In the late 1970s warnings about the over-consumption of alcohol began to come fromgroups concerned with health. In 1977, during the Fraser government’s term in office,the Australian Senate’s standing committee on social welfare held an inquiry into drugproblems in Australia. In its report, on the section dealing with acohol, it declared that,“Alcohol is the major drug of abuse in Austral ia.” To support this claim it produced thefollowing statistics:
Alcohol has been a major factor causing the deaths of over 30,000 Australiansin the. . .ten years [1967-1977]. . .Deaths from cirrhosis of the liver have risen75 per cent in the. . .ten years [1967-1977]. . .one-quarter of a millio nAustralians can be classified as alcoholics. . .One million two hundred thousandAustralians are affected personally or in their f amily situations by alcohol. . .Onein every five of our hospital beds is occupied by a person suffering from th eadverse effects of alcohol. . .Some 73 per cent of the men who have committeda violent crime had been drinking prior to the commission of the crime. . .a smany as 10 per cent of school children between the ages of 12 and 17 get ‘verydrunk’ at least once a month. . . 128
Amongst the recommendations made by the committee, at least two had a certai nenduring significance. The first was the recommendation by the committee that “th eCommonwealth Government ban the advertising of a lcoholic beverages. . .on radio andtelevision”. This was noteworthy because it was a call taken up by other organisationsduring the 1980s. The second was significant because it actually became part o fgovernment policy. This was the recommendation that “the excise imposed on beers ofa low alcohol content. . .be 30 per cent less than that on other beers.” 129
A year later, in New South Wales, G. Egger and R. Champion of the Health Commissionof NSW, produced a report entitled Adolescent Drug and Alcohol Use in New South

Alcohol and Tobacco in NSW: Consumption, Revenue and Concern 35
G. Egger and R. Champion, Adolescent Drug and Alcohol Use in New South Wales 1971-130
1977 (Health Commission of New South Wales, Sydney, 1978), p.27.
Lewis, op.cit., p.180.131
Thoeming, op.cit., p.158. John Harvey has observed that, “it was Swan Brewery Co. Ltd.132
who were first into the field . . .when. . .in late 1978 they released Swan Gold, a 3.5%alcohol beer”. See John Harvey, “Lower Alcohol Beers in Australia: An HistoricalIntroduction” in Food Australia, vol.46, no.4, April 1994, p.153. Dunstan has written thatthe Carlton and United Breweries of Melbourne, which became the owners of Tooth’s inthe early 1980s, launched “Carlton Light in 1979. Its alcohol content was 3.3 per cent”. SeeDunstan, op.cit., p.193.
Adit Laixuthai and Frank Chaloupka, Youth Alcohol Abuse and Public Policy, working paper133
no.4278 (National Bureau of Economic Research, Cambridge, Massachusetts, 1993), p.1.
Wales 1971 to 1977. One of their findings was that “alcohol. . .use has become mor ewidespread over the last six years amongst year 10 students”. 130
Acting on the recommendations of the Senate committee’s report, the Frase rgovernment, in 1980, declared its intention to develop a health-orientated nationa lstrategy on the dangers of alcohol. This was the first time that an Australian govermenthad issued a policy statement on alcohol abuse. However, as Lewis points out, the Frasergovernment’s declaration was “basically a declaration of intent”. 131
One small, initial, response to these concerns came fr om the breweries themselves in theform of their development of low alcohol beers. Peter Thoeming has written that, in NewSouth Wales, “In April 1978, Toohey’s Lite Lager was launched. . .Lite had a[n]. ..alcohol content. . . [of] 3.3 per cent by volume.” 132
In other countries, concerns were also developing about the extent of alcohol abuse -particularly amongst teenagers. During the 1970s a number of states in the USA ha dlowered the minimum legal drinking age to 18. By the late 1970s sections of th eAmerican public had become alarmed at the consequent extent of teenage drinking. Oneof the policies of the Reagan administration, elected in 1980, was to reintroduc erestrictions on teenage consumption of alcohol. Three years after taking office, th eReagan administration secured passage through Congress of the Federal UniformDrinking Age Act 1984. According to Laixuthai and Chaloupka, this legislatio n“threatened to withhold federal highway funds if a state failed to raise its minimum legaldrinking age to 21 years by October 1, 1986. By 1987, all had complied”. Meanwhile,133
in Britain, the Royal College of Physicians produced a report in 1987 entitled A Greatand Growing Evil: The Medical Consequences of Alcohol Abuse which urged the thenThatcher government to reduce overall alcohol consumption in Britain. A year later, inthe USA, in the last year of his second term as President, Reagan obtained passag ethrough Congress of the Anti-Drug Abuse Act 1988 which provided that, as Rober tParker and his colleagues have described,
By the end of November 1989, all alcoholic beverage containers manufactured,imported or bottled for sale or distribution in the United States were required to
Alcohol and Tobacco in NSW: Consumption, Revenue and Concern36
Robert Parker, Robert Saltz and Michael Hennessy, “The Impact of Alcohol Beverage134
Container Warning Labels on Alcohol-Impaired Drivers, Drinking Drivers and the GeneralPopulation in Northern California” in Addiction, vol.89, 1994, p.1639.
Thoeming, op.cit., p.174.135
Alcohol Advertising on Television, a submission in reply to the Australian Broadcasting136
Tribunal’s discussion paper (NSW Drug and Alcohol Authority, Sydney, 1983), p.14.
Laurayne Bowler and Teresa Lea, “The National Campaign against Drug Abuse: How it137
Works and How it Has Addressed Women” in Dorothy Broom (ed.), Double Bind: WomenAffected by Alcohol and other Drugs (Allen and Unwin, Sydney, 1994), p.155.
ibid., pp.158-169.138
incorporate the following statement: Government Warning. . .Consumption o falcoholic beverages impairs your ability to drive a car or operate machinery, andmay cause health problems. 134
In Australia, meanwhile, governmen ts during the 1980s began to introduce measures toaddress some of the more noticeably harmful effects of drinking. In New South Wales,in 1982, the Wran government introduced Random Breath Testing. During the same135
year, as Don Dunoon has written, in New South Wales,
the Drug and Alcohol Authority. . .adopt[ed] the policy - which it conveyed tothe Broadcasting Tribunal - of supporting a total ban on electronic medi aadvertising of alcohol. A number of other bodies. . .also called for a ban, amongthem the. . . Royal Australian College of Surgeons, and the ACT Road Safet yAuthority.136
During the 1984 election, the then Prime Minister, Bob Hawke, promised, if elected, toestablish a national campaign against drug abuse. In 1985 this National Campaig nagainst Drug Abuse (NCADA) was officially launched at a special premiers’ conferenceon drugs. Laurayne Bowler and Teresa Lea noted in 1994 that, “Over the past six years,NCADA has provided $359 million to alcohol and other drug projects”. Bowler and137
Lea have written that,
The best known element of NCADA is its public information and awareness -raising programs under the National Drug Offensive logo [in the late 1980s]. ..NCADA [launched the] ‘Cubby House’ [television ] commercial, which targetedparents. . .a second major phase of the adolescent alcohol abuse program wa slaunched in May 1991 with the theme ‘How Will You Feel Tomorrow?’. . .in1991, NCADA was relaunched as the National Drug Strategy. . . 138
In its August 1988 Federal Budget, the Hawke government i ntroduced a further measureto lessen the adverse effects of alcohol. As John Harvey has explained,
a system of calculating beer excise on the alcohol content exceeding 1.15% by
Alcohol and Tobacco in NSW: Consumption, Revenue and Concern 37
Harvey, ibid.139
Lewis, op.cit., p.187.140
David Hawks, “The Contribution of the National Drug Strategy to the Prevention of Alcohol141
Related Harm”, paper presented at the Eighth National Drug and Alcohol Research Centresymposium, Sydney November 1995, published in Paul Dillon (ed.), The National DrugStrategy: The First Ten Years and Beyond (National Drug and Alcohol Centre, Universityof New South Wales, Sydney, 1995), p.45.
volume was introduced. With this system a beer of 3.0% is taxed on 3.0-1.15=1.85% alcohol at the standard excise duty rate, while excise for one at 5.0% islevied on 3.85% alcohol. The effect of this change . . .reduced wholesale pricesof reduced alcohol beers by as much as 22%. 139
Progress on a general alcohol strategy, during the late 1980s, appears to have dragged.Milton Lewis has written that,
The draft national health policy on alcohol was. . .released for public discussionby Neal Blewett [Federal Minister for Health]. . .in December 1986. . .The 1987draft policy stated that attainment of the overal l objective of ‘minimisation of theharm associated with the use of alcohol’ would require an independent strategyinvolving initiatives in public education and health promotion, enhance dprofessional training and education, access to early treatment, and contro lpolicies.This last would address availability, pricing, and advertising an dmarketing. . .In March 1988. . . ministers met again to consider the draft nationalpolicy. Most accepted the general position adopted in the drafy policy. But Dr.Cornwall, the Minister for Health in South Austral ia, the leading wine-producingstate, soon identified the areas of the policy - av ailability, pricing and advertising- which he thought were controversial. Dr. Cornwall stated that. . .’Alcohol. . .ifused in moderation. . .is not harmful’. . .At the March 1989 meeting of th eMinisterial Council on Drug Strategy, a watered down version of the draf tnational policy was adopted. The [new] South Australian Minister for Healt h[Frank Blevins] moved deletion of two sections of the draft. The other states. ..agreed. . .The ministers also rejected the idea of government supervision o fadvertising. . . 140
In the 1990s the harmful effects of drinking, on an overall level, continues to be o fconcern. Professor David Hawks has remarked that, according to figures collecte dAustralia-wide in the early 1990s,
in 1992 hazardous and harmful consumption of alcohol was responsible for theloss of 3,660 lives and 55,450 person y ears of life before 70 years, at an averageof 15.2 years of life lost per death. There was also a net occurrence of 71,59 3hospital episodes and use of 731,169 hospital bed days caused by suc hconsumption. . .141
New South Wales continues to have a significant proportion of these alcohol-relate d

Alcohol and Tobacco in NSW: Consumption, Revenue and Concern38
Drug and Alcohol Directorate, NSW Alcohol Situation Report (NSW Department of Health,142
Sydney, 1993), p.7.
Chief Health Officer, The Health of the People of New South Wales (NSW Department of143
Health, Sydney, 1996), p.10
Drug and Alcohol Directorate, op.cit., pp.11-28.144
Liquor Act 1982, sections 116,125.145
Nick Heather, Carolyn Muir and Jennifer Tebbutt, Drug Use Trends in New South Wales146
(National Drug and Alcohol Research Centre, University of New South Wales, Sydney,1991), p.19.
deaths. A publication of the NSW Department of Health reported that, “In 1990 therewere an estimated 2,384 alcohol related deaths in NSW. Of these one quarter were dueto stroke occurring mostly in the 65+ age group. 13% were due to alcoholic live rcirrhosis”. Another report from the NSW Department of Health, issued in the mid -142
1990s, states that, “In 1994, in NSW, 17 per cent of fatal road accidents involve dalcohol.”143
Efforts to deal with the adverse effects of drinking likewise continue. The Drug an dAlchol directorate of the New South Wales Department of Health has the responsibilityfor the implementation of the above mentioned national health policy on alcohol. Thedirectorate undertakes activities in the following areas:
public education and health promotion (such as the “stay in control ”advertising campaign)
professional training and education, and early intervention (such a sprovision of training for doctors in early identification of alcoho lproblems)
research (such as surveys of secondary school students’ alcoho lconsumption) 144
In 1994 the Fahey government sought to encourage the drinking of low alcohol beersby removing the licence fees on sales of these products. In 1996 the Carr government,in New South Wales, brought in additional measures (already introduced in other states)to deal with the issue. Amendments were made to the Liquor Act 1982 which increasedthe penalty for serving alcohol to people already drunk, and increased the penalty fo rselling alcohol to teenagers under 18. 145
Under-age and teenage drinking is one particular area of drinking which continues t oattract attention. A study of drug use trends in New South Wales, during the 1970s and1980s, noted that, on the basis of surveys of drinking patterns, conducted by th eAustralian Bureau of Statistics, there was, between 1977 and 1985, “a significant 28%increase in consumption by male and female drinkers in the 18-24 years age group”. 146

Alcohol and Tobacco in NSW: Consumption, Revenue and Concern 39
Peat Marwick Hungerfords, Young Australians and Drugs (Australian Government147
Publishing Service, Canberra, 1988), p.20.
Neil Donnelly, Bruce Flaherty, David Lyle, Petra Macaskill, Susan Quine and Catherine148
Spooner, “Changes in Reported Drug Prevalence among New South Wales SecondarySchool Students, 1983-1989" in the Australian Journal of Public Health, vol.16, no.1, 1992,p.53.
Drug and Alcohol Authority, op.cit., p.7.149
ibid., p.20.150
ibid.151
See Keys Young Consultants, The Incidence and Prevalence of Alcohol Use and Violence152
in the Australian Community (Australian Government Publishing Service, Canberra, 1994).
Richard Stevenson, The Impact of Alcohol Sales on Violent Crime, Property Destruction153
and Public Disorder (NSW Bureau of Crime Statistics and Research, Sydney, 1996), p.1.
In 1988 the youth bureau of the federal department of employment commissioned PeatMarwick Hungerfords to undertake a report on young people and drugs. In their study,which was published as Young Australians and Drugs, Peat Marwick noted that, amongstthe drugs abused by young people, “alcohol is the most important because it is used bya larger proportion” of teenagers. Although drinking by New South Wales secondary147
school students is reported to have declined during the late 1980s, it remains an issue148
of concern. Alcohol as a factor in road deaths amongst young people has bee nparticularly highlighted. The NSW Department of Health estimated that, in 1990, 50%of the alcohol related deaths amongst people under 34 years old were road acciden tdeaths. In 1991 the Greiner government introduced the NSW Proof of Age card in an149
effort to curb the degree of under-age drinking in the state. 150
Physical violence and alcohol has also been a pa rticular concern. According to the Drugand Alcohol Directorate of the NSW Department of Health, in its NSW AlcoholSituation Report 1993, “Recent research conducted by the NSW police service ”estimated that “alcohol was . . .a contributing factor in 73% of all assaults”. In late151
1993, during the Keating government’s term in office, the federal department of healthand human services held a national symposium on alcohol misuse and violence. In152
1996 a study produced by the NSW Bureau of Crime Statistics concluded that, on thebasis of a 1995 survey by the National Drug Strategy unit in the Commonwealt hDepartment of Health and Family Services,
eight per cent of 14-19 year olds reported that they had physically abuse dsomeone whilst affected by alcohol. . .In NSW, this tran slates into approximately34,000 violent incidents where alcohol is involved - just for this age group. Forthose aged 20-34, the figure was four per cent, which translates to over 54,000violent incidents involving alcohol in NSW - a total for both age groups o f91,000 incidents.153
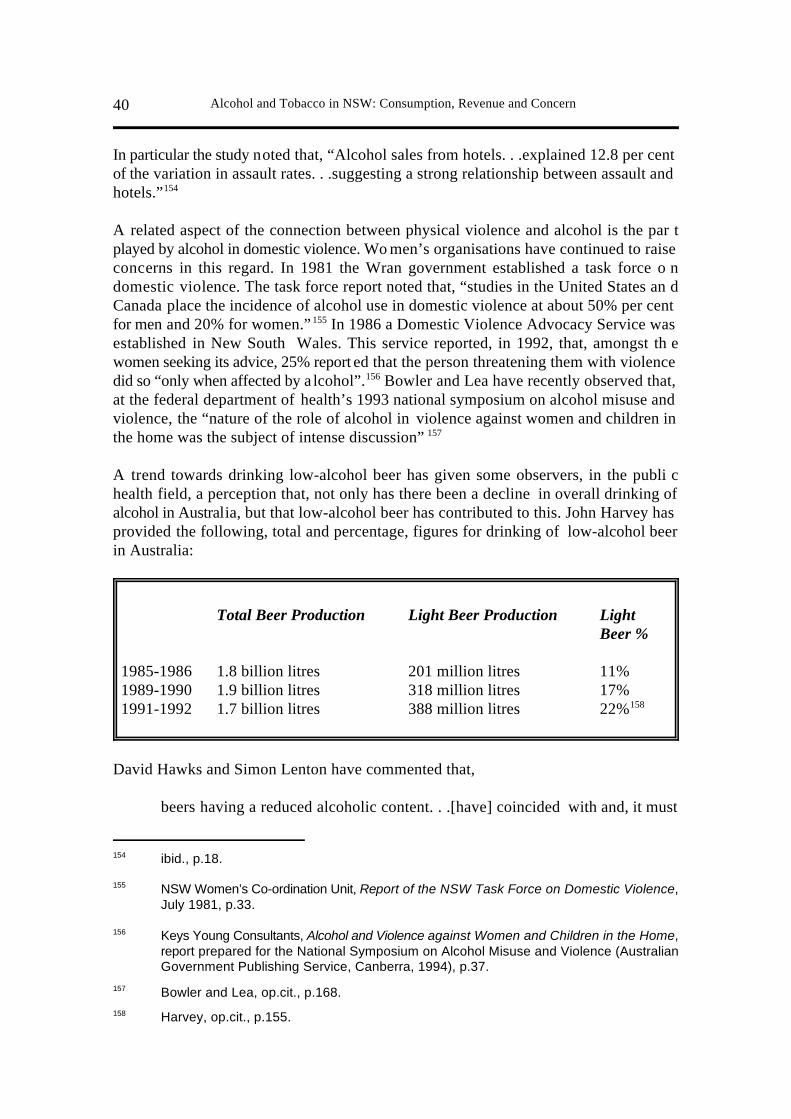
Alcohol and Tobacco in NSW: Consumption, Revenue and Concern40
ibid., p.18.154
NSW Women’s Co-ordination Unit, Report of the NSW Task Force on Domestic Violence,155
July 1981, p.33.
Keys Young Consultants, Alcohol and Violence against Women and Children in the Home,156
report prepared for the National Symposium on Alcohol Misuse and Violence (AustralianGovernment Publishing Service, Canberra, 1994), p.37.
Bowler and Lea, op.cit., p.168.157
Harvey, op.cit., p.155.158
In particular the study noted that, “Alcohol sales from hotels. . .explained 12.8 per centof the variation in assault rates. . .suggesting a strong relationship between assault andhotels.”154
A related aspect of the connection between physical violence and alcohol is the par tplayed by alcohol in domestic violence. Wo men’s organisations have continued to raiseconcerns in this regard. In 1981 the Wran government established a task force o ndomestic violence. The task force report noted that, “studies in the United States an dCanada place the incidence of alcohol use in domestic violence at about 50% per centfor men and 20% for women.” In 1986 a Domestic Violence Advocacy Service was155
established in New South Wales. This service reported, in 1992, that, amongst th ewomen seeking its advice, 25% report ed that the person threatening them with violencedid so “only when affected by a lcohol”. Bowler and Lea have recently observed that,156
at the federal department of health’s 1993 national symposium on alcohol misuse andviolence, the “nature of the role of alcohol in violence against women and children inthe home was the subject of intense discussion” 157
A trend towards drinking low-alcohol beer has given some observers, in the publi chealth field, a perception that, not only has there been a decline in overall drinking ofalcohol in Australia, but that low-alcohol beer has contributed to this. John Harvey hasprovided the following, total and percentage, figures for drinking of low-alcohol beerin Australia:
Total Beer Production Light Beer Production LightBeer %
1985-1986 1.8 billion litres 201 million litres 11%1989-1990 1.9 billion litres 318 million litres 17%1991-1992 1.7 billion litres 388 million litres 22%158
David Hawks and Simon Lenton have commented that,
beers having a reduced alcoholic content. . .[have] coincided with and, it must
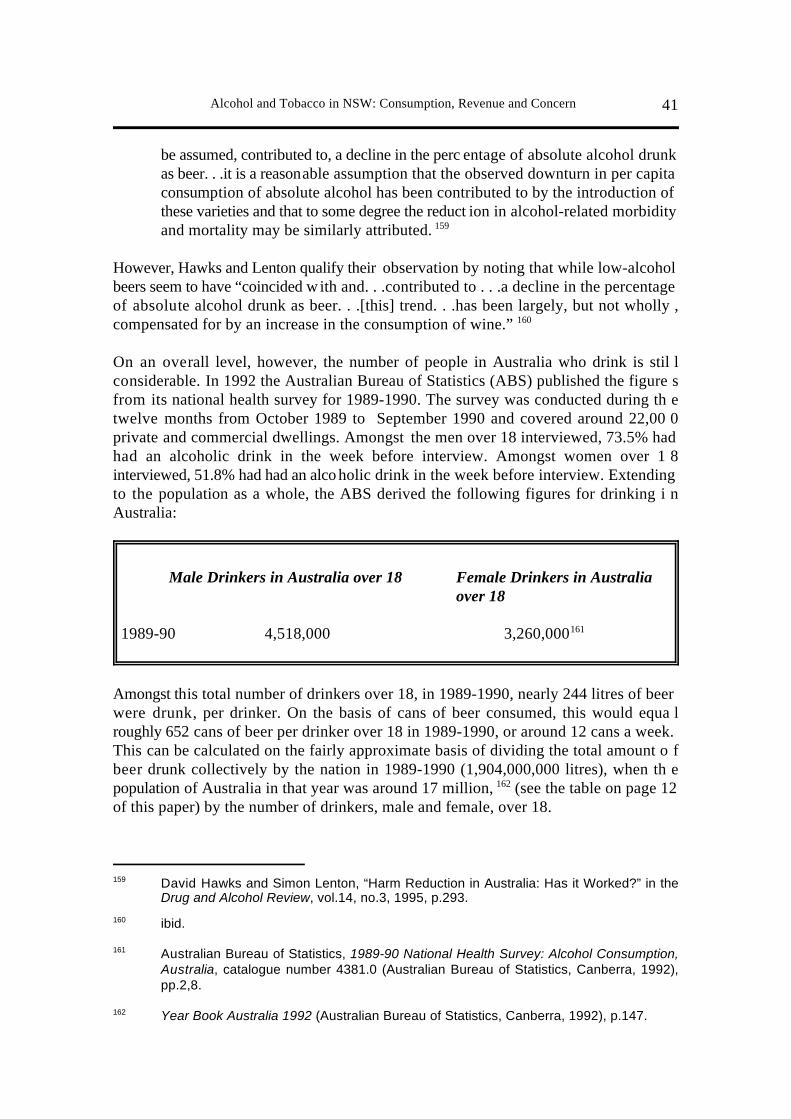
Alcohol and Tobacco in NSW: Consumption, Revenue and Concern 41
David Hawks and Simon Lenton, “Harm Reduction in Australia: Has it Worked?” in the159
Drug and Alcohol Review, vol.14, no.3, 1995, p.293.
ibid.160
Australian Bureau of Statistics, 1989-90 National Health Survey: Alcohol Consumption,161
Australia, catalogue number 4381.0 (Australian Bureau of Statistics, Canberra, 1992),pp.2,8.
Year Book Australia 1992 (Australian Bureau of Statistics, Canberra, 1992), p.147. 162
be assumed, contributed to, a decline in the perc entage of absolute alcohol drunkas beer. . .it is a reasonable assumption that the observed downturn in per capitaconsumption of absolute alcohol has been contributed to by the introduction ofthese varieties and that to some degree the reduct ion in alcohol-related morbidityand mortality may be similarly attributed. 159
However, Hawks and Lenton qualify their observation by noting that while low-alcoholbeers seem to have “coincided with and. . .contributed to . . .a decline in the percentageof absolute alcohol drunk as beer. . .[this] trend. . .has been largely, but not wholly ,compensated for by an increase in the consumption of wine.” 160
On an overall level, however, the number of people in Australia who drink is stil lconsiderable. In 1992 the Australian Bureau of Statistics (ABS) published the figure sfrom its national health survey for 1989-1990. The survey was conducted during th etwelve months from October 1989 to September 1990 and covered around 22,00 0private and commercial dwellings. Amongst the men over 18 interviewed, 73.5% hadhad an alcoholic drink in the week before interview. Amongst women over 1 8interviewed, 51.8% had had an alcoholic drink in the week before interview. Extendingto the population as a whole, the ABS derived the following figures for drinking i nAustralia:
Male Drinkers in Australia over 18 Female Drinkers in Australiaover 18
1989-90 4,518,000 3,260,000161
Amongst this total number of drinkers over 18, in 1989-1990, nearly 244 litres of beerwere drunk, per drinker. On the basis of cans of beer consumed, this would equa lroughly 652 cans of beer per drinker over 18 in 1989-1990, or around 12 cans a week.This can be calculated on the fairly approximate basis of dividing the total amount o fbeer drunk collectively by the nation in 1989-1990 (1,904,000,000 litres), when th epopulation of Australia in that year was around 17 million, (see the table on page 12162
of this paper) by the number of drinkers, male and female, over 18.
Alcohol and Tobacco in NSW: Consumption, Revenue and Concern42
Walker, op.cit., p.34.163
ibid., p.38.164
ibid., pp.58,72.165
ibid., pp.72-73,142.166
(c) Tobacco
Concerns over tobacco consumption took longer to develop than those raised ove ralcohol, but when they did finally surface they gained a much greater prominence.
Questions over the possible harmful effects of tobacco consumption had been raised inthe 1800s. In Sydney, in 1840, a Scottish school teacher gave a series of lectures i nwhich he warned against the effects of tobacco. However, as Walker writes, he “wa svigorously refuted by the press.” Public concern first developed over the number of163
young people taking up smoking and, in 1896, Dr. Ross, a medical practitioner, firs tintroduced a bill, in the New South Wales Parliament, to restrict teenage smoking .Although unsuccessful at first, he persistently re-introduced the bill until, seven yearslater, Sir John See’s government secured its passage - becoming the Juvenile SmokingSuppression Act 1903. This Act, however, did not prohibit smoking in public b yjuveniles but simply prohibited the sale of tobacco to them. However, as Walker notes,
A number of retailers were fined but the Act was soon rendered ineffective bya judicial interpretation: it was no offence for a juvenile to act as a messenger foran adult. 164
Despite worries over the effects of smoking on juveniles, general opinion still held thatsmoking held no real concerns for adults. Robin Walker has recalled that, some thirtyyears later, “In the early 1930s, under the ae gis of the British Empire Cancer Campaign,tobacco tars had been injected into mice and the experimenters had concluded tha tsmoking played little or no part in the growth of cancer.” In Australia, during the 1930s,as Walker also recalls, although “the States were develop ing their departments of health.. .they showed little concern with tobacco. Smoking was not a matter for discussion inthe Medical Journal of Australia, the old belief that only ‘excessive’ smoking wa sharmful being generally held.” 165
It was during the 1950s that medical warnings first began to emerge about the dangersof cigarette smoking. In 1950, Richard Doll and Austin Hill published an article in theBritish Medical Journal entitled “Smoking and Carcinoma of the Lung: A PreliminaryReport”, which set out to establish a link between smoking and lung cancer. In 1954, inthe USA, Professor Alton Ochsner produced Smoking and Cancer: A Doctor’s Reportwhich, again, linked smoking and canc er. A year later, in Australia, Macfarlane Burnet,director of the Walter and Eliza Hall Institute in Melbourne, gave an address to th eAustralian and New Zealand Association for the Advancement of Science, in which herepeated the warnings about links between smoking and cancer. 166
Alcohol and Tobacco in NSW: Consumption, Revenue and Concern 43
ibid., pp.86-98.167
ibid,, p.111.168
ibid., 98,105-109.169
ibid., p.130.170
Winstanley, et.al., p.390.171
Terry Alchin, An Economic Assessment of the Role of Advertising in Cigarette172
Consumption, working paper no.WP92/01 (Department of Economics, University ofWestern Sydney, Nepean, 1992), p.2.
After these initial findings emerged, research intensified into the relationship betweensmoking and cancer. In 1957, in Australia, the Australian National Health and MedicalResearch Council called on the Federal Government to set up a body that would advisepeople on the risks of smoking, and it called on the States to carry out anti-smokin gcampaigns. Five years later, in 1962, th e Royal College of Physicians, in Britain, issueda report entitled Smoking and Health which warned of a correlation between smokin gand cancer. This was immediately endorsed, in Australia, by the Australian Medica lAssociation and the Anti-Cancer Cou ncil of Victoria (formed, by legislation, in 1936 topromote research into cancer). Subsequently, in 1964, in the USA, the America nSurgeon-General issued a report which simil arly drew a link between smoking and lungcancer. Six years later the World Health Organisation, at its 23rd assembly, approveda number of anti-smoking resolutions. 167
Calls for action, on the basis of these reports, increased during the late 1960s. In 1969,in Australia, the National Health and Medical Research Council recommended th eplacing of warnings on cigarette packets; restrictions on cigarette advertising; and anational program for alerting people to the dan gers of smoking. This was soon endorsedby a meeting of both Federal and State health ministers. The McMahon government, in1972, decided to spend $½million a year, for three years, to inform people in Australiaabout the health hazards of smoking. During the same year, in New South Wales, th eAskin government obtained passage of the Cigarettes (Labelling) Act 1972,complementing similar legislation passed in the other states. In 1973, the newly168
elected Whitlam government went much further and secured the passage of legislationwhich would phase out television advertising of tobacco products. During the 1980s169
the Hawke government began to ext end the range of restrictions on tobacco advertisingand consumption. Meanwhile, in New South Wales, in 1983, the Wran governmen tintroduced a ban on tobacco advertising on state transport. In 1988, the Hawke170
government implemented a ban on smoking on buses and coaches registered under theFederal Interstate Registration Scheme and, a year later, obtained passage of th eSmoking and Tobacco Products Advertisements (Prohibition) Act 1989 which bannedtobacco advertisements in the print media. Two years afterwards, the Greine r171
government, in New South Wales, obtained passage of the Tobacco AdvertisingProhibition Act 1991 which banned cigarette advertising on billboards, taxis and th elike.172

Alcohol and Tobacco in NSW: Consumption, Revenue and Concern44
The Tobacco Industry and the Costs of Tobacco-Related Illness, report of the Senate173
Committee on Community Affairs, December 1995, p.1.
Egger and Champion, op.cit., p.1.174
Peat Marwick Hungerfords, ibid.175
Bruce Andrews, Simon Chapman, Madeleine King, Peter Markham, Eizabeth McKay and176
Stephen Woodward, “Effects of Publicity and a Warning Letter on Illegal Cigarette Salesto Minors” in the Australian Journal of Public Health, vol.18, no.1, 1994, pp.39-40.
Donnelly et.al., p.55.177
On an overall level, smoking still remains a significant contributor to ill-health i nAustralia. In 1995 the Senate’s Community Affairs Committee conducted an inquir yinto the tobacco industry and the costs of tobacco-related illness. The committee noted,from the evidence put before it that, throughout Australia,
In 1992 there were an estimated 18,920 deaths from tobacco-rela ted disease. Thisfigure represented 15.3 per cent of all deaths from all causes in all age groups.. . there were an estimated 7,265 deaths due to tobacco-related cardiovascula rdisease, 6,644 deaths due to smoking induced cancers and 4,437 deaths fro mtobacco-related chronic obstructive pulmonary disease. 173
Under-age and teenage smoking, in particular, has attracted the attention of a numberof researchers. In 1978, Egger and Champion, in their report on adolescent drug use inNew South Wales during the early to mid-1970s, r emarked that “Use of. . .tobacco” had“increased significantly amongst fourth form (14-16 year old) children since 1973.” 174
Ten years later, in their report on young Australians and drugs, Peat Marwic kHungerfords commented that “tobacco is the second most significant drug used b yyoung people.”175
In 1991 the Greiner government obtained the passage of amendments to the PublicHealth Act 1990 which raised the legal age, at which cigarettes could be sold t oteenagers, from 16 years, previously, to 18 years. However, Bruce Andrews and hi scolleagues noted that in 1992, in a study of 299 shops in Sydney, 99 sold cigarettes tochildren aged between 12 and 13 years. 176
Despite the apparent continuing ease with which under-age teenagers can obtai ncigarettes, there seems to be a decline in the overall number of teenagers smoking. Ina survey of New South Wales secondary school students in the mid to late 1980s, NeilDonnelly and his colleagues were able to report that their results indicated “a consistentand sustained decline in the percentage of school students who smoke cigarettes”. 177
In New South Wales the Drug and Alcohol directorate of the NSW Department o fHealth has a responsibility for the implementation of a strategy directed against th eadverse effects of tobacco consumption. During the 1990s the director ate has been activein the following areas:

Alcohol and Tobacco in NSW: Consumption, Revenue and Concern 45
Drug and Alcohol Directorate, New South Wales Tobacco and Health Strategy 1995-1999178
(NSW Department of Health, Sydney, 1995), pp.12-29.
Hawks and Lenton, op.cit., p.292.179
Rob Sanson-Fisher, Chrisopher Doran and Moira Gordon, “A Cost-Benefit Analysis of the180
Average Smoker: A Government Perspective” in the Australian and New Zealand Journalof Public Health, vol.20, no.6, p.2.
addressing the impact of tobacco advertising
increasing public awareness of the adverse effects of smoking
conducting research into the harmful effects of smoking
ensuring the obeying of the law regarding access to cigarettes
assisting smokers to stop smoking 178
Anti-smoking campaigns do seem to have had an effect over the years. Hawks an dLenton have observed that, “smokers in Australia have declined from 37.2% of th epopulation to 28.4% in the period 1977 to 1990.” Professor Robert Sanson-Fisher and179
his colleagues point out, however, that the 28.4% statistic still tra nslates to, in 1989-1990figures,
3,531,000 people. . .aged 18 years and over. . . 180
If, in 1989-1990, there were around 1.8 billion packets of cigarettes (in packets of 20)produced throughout Australia, then each of these 3,531,000 smokers aged 18 or overcould have smoked around 509 packets of cigarettes throughout the year or about 1 0packets of cigarettes each week.
5 SOME COMMERCIAL AND REVENUE ASPECTS OF ALCOHOL AN DTOBACCO CONSUMPTION
(a) The Value of Tobacco and Alcohol Manufacturing in New South Wales
As outlined above, New South Wales has been the biggest centre of production i nAustralia for both tobacco and alcohol. In their study entitled The Economic Impact ofthe Australian Tobacco Industry, Roy Powell and Mark McGovern wrote that, durin g1983-1984,
The tobacco industry in NSW produced output valued at $1,280m [$1. 2billion]... Direct employment was 10,949 people with a further 17,017 bein gindirectly employed. In output terms the largest component is manufacturing .. .In flow-on terms, manufacturing is slightly smaller than wholesale/retail. ..Manufacturing provides 47 per cent of the income and 38 per cent of th e

Alcohol and Tobacco in NSW: Consumption, Revenue and Concern46
Powell and McGovern, op.cit., chapter 4. 181
Jobson’s Year Book of Public Companies 1996-97 (Dun and Bradstreet, Sydney, 1996),182
p.227.
ibid., pp.595-596.183
Bastable, op.cit., pp.462-463. 184
industry employment, while wholesale/retail activities contribute 50 and 58 percent respectively.181
As outlined above, New South Wales’ share of cigarette production in Australia seemsto have increased to around 60% of total national production, and the NSW share of thenational total value of cigarette sales appears to amount to around $3 billion.
Brewing, also, still remains significant in New South Wales. Carlton and Unite dBreweries, (taken over by Foster’s Brewing in 1983, itself essentially taken over b yBHP Finance in 1992) accounted, in 1995, for 60% of the NSW market for beer and for50% of the total Australian market for beer. Foste r’s revenue from core business, duringfinancial year 1994-1995, amounted to $4.4 billion on which it made an after-tax profitof $287 million. Lion Nathan Australia, (current owner of Toohey’s, Castlemaine and182
Swan), according to Jobson’s Year Book of Public Companies, “is the largest operatingdivision within Lion Nathan” and “contributed 7 6% of group earnings” of $1.69 billionin revenue and $202.1 million in after-tax profit. 183
(b) Strategies behind Alcohol and Tobacco Taxation
As shown above, revenue raising from alcohol and toba cco goes back hundreds of yearsand was relied upon consistently during Britain’s early years of settlement in Australia.
Some of the problems of raising revenue from these sources were pointed out at least ahundred years ago. Charles Bastable noted, in the case of alcohol, that
It is apparent therefore that the excise system of England, so far as it applies tocommodities, is almost exclusively a tax on alcoholic drinks, and is carried outby supervision of the brewing and distilling industries, which involves a ver ycomplete control of their operations. The modern tendency to concentrate th eproduction of both beer and spirits at a few centres makes this system les stroublesome, and the heavy taxation in turn favours the larger producers. . .Thewhole situation is a highly artificial one; by it the State draws very larg eresources from the taxation of what is an instrument of luxu ry, in many cases oneof vice.184
Keith Dunstan noted that, in Australia,

Alcohol and Tobacco in NSW: Consumption, Revenue and Concern 47
Dunstan, op.cit., pp.82-83.185
Michael Grossman, Jody Sindelar, John Mullahy and Richard Anderson, “Policy Watch:186
Alcohol and Cigarette Taxes” in the Journal of Economic Perspectives, vol.7, no.4, Fall1993, p.220 citing Frank Ramsey, “A Contribution to the Theory of Taxation” in theEconomic Journal, vol.37, no.1, March 1927.
Terry Alchin, Tobacco Taxation in Australia, working paper no.WP91/03 (Department of187
Economics, University of Western Sydney, Nepean, 1991), p.11.
The Victorian government first introduced [its own]. . .beer duty, rated 3d agallon, in 1892. The tax was collected ‘by obliging the brewer’ to buy bee rstamps which he had to fix to every barrel before delivery or to delivery docketsin the case of bottled beer. When the states federated in 1901. . .the new federalgovernment. . . adopted [this system]. . .Output and value of stamps had t obalance every day. . .in 1956. . the government agreed that in future duty couldbe paid on the total gallonage estimated to be delivered on the following day. 185
The continued possibilities of drawing revenue from alcohol and tobacco remained inthe consideration of policy makers in the twentieth century, especially since advancesin quantification, in economic research, appeared to make improvements in measuring,collectively, how those who drank and smoked would respond to an increase in price.In 1927 the British economist Frank Ramsey wrote an article in the Economic Journalin which he focused on the continued potential of revenue raising from these sources.Michael Grossman and his colleagues noted in 19 93 that, in the realm of public finance,
The conventional view is that alcohol and cigarettes are attractive targets. . .Asshown by Ramsey, under certain conditions the way to raise a fixed amount ofrevenue. . .is to tax inelastically demanded goods more heavily. 186
The notion of “elasticity” in economic me asurement has been outlined by Terry Alchin,in the case of cigarettes, as follows:
The basis for estimating the consumption effects of a change in excise tax ratesis really an analysis of the price elasticity of demand for cigarettes. Elasticity, ameasure of the degree of the responsiveness of demand. . .to change in price, iscommonly defined as the percentage change in the quantity of cigarette sdemanded divided by the percentage change in price which caused the demandchange. Thus price elasticity of -0.5, for example, means that a 10 per cen tincrease. . .in price would reduce. . .the quantity of ciga rettes demanded by 5 percent.187
An assumption that demand for alcohol and tobacco is “inelastic”, when governmentscontinue to increase their levies from them, assumes, as Alchin observes in the case ofcigarettes, that “the established older smokers will c ontinue to smoke and pay the higher

Alcohol and Tobacco in NSW: Consumption, Revenue and Concern48
Terry Alchin, The New 75 per cent Tobacco Tax in NSW, working paper no. WP92/04188
(Department of Economics, University of Western Sydney, Nepean, 1992), p.9.
Grossman, et.al., p.212.189
Harold Groves, Financing Government (Henry Holt and Company, New York, 1939),190
p.318.
taxes”. In the case of drinkers, such an assumption would rely on established drinkers188
continuing to drink and pay the higher tax on alcohol.
This assumption has not only been acted on in Australia - where alcohol, for instance,has, in the past, been focused on as a major source of revenue - but it has been acted onin a number of other countries. Michael Grossman a nd his colleagues have observed, onthe course of taxes on tobacco and alcohol in the USA, particularly under the Reaganand Bush administrations, that
The federal excise tax on cigarettes was fixed at 8 cents per pack betwee nNovember 1, 1951, and the end of 1982. It rose to 16 cents per pack effectiv eJanuary 1, 1983. . .The tax was increased further to 20 cents per pack effectiveJanuary 1, 1991, and to 24 cents per pack effective January 1, 1992. . .January1, 1991, marked the first increases in the federal excise tax rates on beer an dwine since November 1, 1951. In. . .1990, th e tax on beer doubled from 16 centsper six-pack to 32 cents, the tax on wine jumped from just over 3 cents per 750millilitre bottle to about 21 cents. . . 189
(c) The Impact of Alcohol and Tobacco Taxes
Who bears the most, through the imposition of levies on alcohol and tobacco, has beenthe subject of considerable conjecture . One the one hand, as Harold Groves observed in1939,
Consumption taxes are generally def ended on the ground that they are relativelypainless - ‘easy to take’, so to speak. The fact that such taxes are hidden in theprices of the goods purchased means that people are seldom conscious of them.How many people ever stopped to calculate their annual cigarette tax? 190
On the other hand, James Thorold Rogers, Professor of Political Economy at Oxfor dUniversity, wrote in 1888 (before Lloyd George’s Budget of 1909) that,
the British Parliament has reduced taxable objects to a very few articles. I tintends to distribute taxation. . .between those who earn less than £100 a year,and those who earn more than £100. . .The former are visited with the greate rpart of the indirect taxation, wi th by far the most of the excises and customs stilllevied. . .The latter pay the income tax, the greater part of the succession an dstamp duties, the assessed taxes, and much of such customs as are paid for thoseluxuries of foreign origin which can be purchased only by fairly well to d o

Alcohol and Tobacco in NSW: Consumption, Revenue and Concern 49
James Thorold Rogers, The Economic Interpretation of History (T. Fisher Unwin, London,191
1888), p.478.
In his first major financial speech in the British Parliament, in 1907, Snowden declared that192
“working people [are]. . .being required to pay for their own old age pensions throughindirect taxation. The right way to pay for them [is]. . .by a super-tax on incomes over£2,000". See Colin Cross, Philip Snowden (Barrie and Rockliff, London, 1966), pp.84-86.
Henry Simons, Personal Income Taxation, 1938, pp.39-40 cited in Groves, op.cit., p.320.193
persons. Of course, under these circumstances, the contribution of the poore rclasses will and must represent a greater sacrifice on their part. 191
As outlined above, those committed to social equity looked unfavourably on indirec ttaxation as weighing unfairly on those less well-off. Philip Snowden, the son of a weaverand the first Labour Party Treasurer in Britain - in Ramsay MacDonald’s governmentof 1924 - held this view. His biographer has written that, during the 1920s, Snowde n“wanted to change the balance of direct and indirect taxation. . .He wanted all taxationeventually to be direct”. 192
During the 1930s, Professor Henry Simons, of Chicago University , made a similar pointwhen he commented that, “The plain fact. . .is simply that taxes like the tobacco taxesare the most effective means available for draining government revenues from the verybottom of the income scale.” 193
Alan Moran has produced the following calculations for the present-day percentag eamount of expenditure, by low-income groups in Australia, on alcohol and tobacco:

Alcohol and Tobacco in NSW: Consumption, Revenue and Concern50
Alan Moran, Soaking the Poor: Discriminatory Taxation of Tobacco, Alcohol and Gambling194
(Institute of Public Affairs, Melbourne, 1996), p.6.
Enough to Make You Sick: How Income and Environment Affect Health, research paper195
no.1 (National Health Strategy, Canberra, 1992), p.31.
Australian Households with 1996 Weekly pre-Tax Income of$151.66
Weekly Expenditure on Alcohol - $11.72Weekly Expenditure on Tobacco - $10.46Weekly Percentage of Expenditure on Alcohol and Tobacco: 6.5%
Australian Households with 1996 Weekly pre-Tax Income of$353.91
Weekly Expenditure on Alcohol - $18.25Weekly Expenditure on Tobacco - $15.44Weekly Percentage of Expenditure on Alcohol andTobacco:10.5%194
Allied to the aspect of level of income is the aspect of level of education. On a generallevel, those on low incomes also tend to be those with less education. A report by theNational Health Strategy, in 1992, commented that,
Adult males and females. . .with the least education also display higher rates ofrisk factors. . .men who have received low levels of education are 85% mor elikely to smoke, and women who have rece ived low levels of education are 67%more likely to do so. . .men who have received low levels of education have a30% higher alcohol risk. . . 195
(d) Worth of Alcohol and Tobacco Consumption to the Community and to th eGovernment
Attempts have been made to evaluate the significance to government, and the worth tothe community, of alcohol and tobacco consumption.
In 1991, David Collins and Helen Lapsley produced a study which estimated th etangible economic costs of alcohol abuse in Australia as follows:

Alcohol and Tobacco in NSW: Consumption, Revenue and Concern 51
David Collins and Helen Lapsley, Estimating the Economic Costs of Drug Abuse in196
Australia (Department of Community Services and Health, Canberra, 1991), p.105. Collinsand Lapsley have recently produced some revised estimates for the early 1990s in theirstudy entitled The Social Costs of Drug Abuse in Australia in 1988 and 1992, National DrugStrategy monograph series no.30 (Commonwealth Department of Human Services andHealth, Canberra, 1996).
Tangible Economic Costs of Alcohol Abuse in Australia, 1988: HealthCare
Net Medical Services $139.9 millionNet Hospital Bed Days $388.2 millionNet Nursing Home Bed Days $52.9 millionTOTAL $581 million
Tangible Economic costs of Alcohol Abuse in Australia in 1988: RoadAccidents
Legal and Court Proceedings: $14 millionInsurance Administration $26.2 millionAccident Investigation $9.8 millionLosses to Others $2.9 millionVehicle Damage $138.5 millionTraffic Delay $20.8 millionTOTAL $212.2 million
Tangible Economic Costs of Alcohol Abuse in Australia, 1988:Production Costs Male Morbidity $138 millionFemale Morbidity $90.9 millionMale Mortality $1.43 billionFemale Mortality $386.7 millionMale Absenteeism not availableFemale Absenteeism not availableTOTAL $2.1 billion196
On the basis of the above figures, and on the basis of the figures for Commonwealt hexcise duty on beer and spirits (mentioned above), it might be possible to do a roug hcost-benefit analysis of the worth of a drinker in Australia - as outlined by Sanson -Fisher, for smokers, in the following part of this sub-section.
On the one hand, one could add drinkers’ total cost to government in health care ($581million), and drinkers’ total cost to government through road accidents ($212 million),and arrive at a total cost to government of $793 million for 1988. One could then divide

Alcohol and Tobacco in NSW: Consumption, Revenue and Concern52
Bastable, op.cit., p.463.197
Moran, op.cit., p.7 citing ACIL Economics, Smoking: Costs and Benefits for Australia198
(1994).
this by the estimated total number of drinkers i n Australia for 1989-90 - 7,778,000 - andwe arrive a figure of around $102 in cost to government per drinker in Australia (in theform of health care and road accidents).
On the other hand if, indeed, according to the ABS figur es, there were around 7,778,000drinkers in Australia in 1989-1990 - and if, in 1984-85 the Commonwealth excise frombeer was $1,176,736,000 and that from spirits was $119,776,000 - one could divide theamount of Commwealth excise from beer and spirits in 1984-85 by the total number ofdrinkers in Australia in 1989-90. If one were to do this, one would arrrive at a figure ofaround $160 per drinker provided to government in the form of excise duty in the late1980s. The total figure, in regard to returns to government from drinkers, could b ehigher if one were to include the value to the federal government of the wholesale salestax on wine, and the value to the NSW government, at least, of the revenue from it sliquor licences.
The issues inherent in this were already clear - at least by the 1890s. Charles Bastablecommented in 1892 that, in Britain,
The aim of reducing the national consumption of. . .[alcoholic ] drinks is naturallypostponed to that of maintaining. . .support of the public revenue. . . 197
In the area of cigarette smoking, where the states, as indicated above, derive aconsiderable amount of revenue, some analysts appear to argue that the same equationholds true: that people are worth more to government as smokers than as non-smokers.ACIL economics has described the main elements of the equation, and the conclusionwhich appears to emerge from it, accordingly:
tobacco taxation. . .($2.5 billion). . .[as against] more intensive use by smokersof subsidised health care ($0.4 billion). . .Thus contrary to popular belief, th elevel of taxation on tobacco products easily exc eeds claimed health care costs bysmokers on the community. . . 198
Robert Sanson-Fisher and his colleagues have recently compiled figures on the cost togovernment presented by smokers. They have calculated these costs accordingly:

Alcohol and Tobacco in NSW: Consumption, Revenue and Concern 53
Sanson-Fisher et.al., pp.2-3.199
ibid.200
ibid.201
Health Costs to Government of an AverageSmoker in Australia, 1989-1990
Hospital Care $227.73 millionMedical Care $46.41 millionPharmaceutical Care $60.54 millionAllied Professional Care $0.65 millionNursing Home Care $74.26 millionAnti-Smoking Campaigns $9.47 millionTOTAL $419.06 million
On the basis that there are an estimated 3,531,000 smokers aged 18 years and over, inAustralia, this would suggest that the cost to government of a smoker is about $118 ayear.199
On the other hand, Sanson-Fisher and his colleagues state the “Economic benefits to. .. government” are the “cigarette taxation revenue”. This they calculate accordingly:
Economic Benefits to Government of a Smoker in Australia, 1989-1990
Tax Proportion Accruing to Government $2.2 billion200
On the basis of an estimated 3,531,000 smokers in Australia this amounts to governmentrevenue of $620 per smoker per year. 201
Professor Sanson-Fisher and his colleagues have recently echoed the same sentimentsin regard to teenage smoking. In an article on smoking by adolescents they have writtenthat,
It is estimated that approximately 211,000 Australian children under the legal ageto purchase cigarettes consumed app roximtely 11.5 million packets of cigarettesin 1990. The total revenue from these sales was $35.06 million, with $5.7 8million of this going directly to retailers. Manufa cturers and distributors received$8.08 million and the tax revenues to the federal and state governments fro mthese sales amounted to $8.42 million and $12.78 million respectively. . .Thesedata indicate that across Australia, the average state revenue for 1990 was justover $60 per under-age smoker. This compares to an aver age of $0.11 per under-

Alcohol and Tobacco in NSW: Consumption, Revenue and Concern54
Rob Sanson-Fisher, Christopher Doran, Afaf Girgis and Raoul Walsh, “Smoking by202
Adolescents: Large Revenue but Little for Prevention” in the Australian Journal of PublicHealth, vol.19, no.1, February 1995, p.31.
Grossman, et.al., pp.212,215,220.203
Laixuthai and Chaloupka, op.cit., p.9.204
age smoker spent on anti-smoking campaigns in 1990. 202
(e) Policy in the Future
Recently a consensus has been emerging between those who continue to favour taxeswhich appear to impact heavily on those with low incomes, and those who hav ereservations about such an approach. The point of consensus is that of health. MichaelGrossman and his colleagues have written that, as far as the USA is concerned,
Politically, sin tax increases are increasingly acceptable, especially. . .fo rcigarettes . . .There is overwhelming evidence that smoking has detrimenta lhealth effects. . . the adverse effects of alcohol spring from overuse (cirrhosis ofthe liver) or misuse (drink driving crashes). . .the younger age group i sparticularly [important]. . . because motor vehicle accident mortality is th eleading cause of death of persons under the age of 35, and alcohol is involved inover half of these fatal accidents. . . The bulk of the evidence. . .does suppor thigher taxes on cigarettes and alcohol. 203
Support for Grossman’s view comes from other researchers such as Laixuthai an dChaloupka. They conclude, in their study on youth alcohol consumption in the USA inthe late 1980s, that, “increases in beer taxes will significantly reduce the frequency ofyouth drinking. . .higher taxes would also have reduced the probability of heav ydrinking”. 204
6 CONCLUSION
Alcohol and tobacco consumption, and the approach to revenue raising associated withthem, present some intricate issues.
In the area of revenue raising itself, there arises the question of on whom taxatio nimpinges. It could be argued from the observations of a number of writers, an dcommentators, in the field of public finance that there is an essential split betwee nindirect and direct taxation: indirect taxation impinges more on the less well-off, an ddirect taxation impinges more on the better -off. This was not only the view of observerssuch as James Thorold Rogers, writing in the nineteenth century, but continued to bethe perception of many participants in the area in the twentieth century, including th eearly founders of the labour parties.
Even amongst similar groups of participants in the financial debate, however, opinions

Alcohol and Tobacco in NSW: Consumption, Revenue and Concern 55
John Edwards, Keating: The Inside Story (Viking, Melbourne, 1996), p.268.205
Florence Chong, “Indirect Action” in The Australian, 16 April 1993, p.21. Deborah Mitchell206
has commented that, during the 1980s, in both Britain and Australia, “the bottom decile ofearners have increased their share of the tax burden”. See Deborah Mitchell, Taxation andIncome Redistribution: The ‘Tax Revolt’ of the 1980s Revisited, public policy programdiscussion paper no.36 (Graduate Program in Public Policy, Australian National University,Canberra, 1993), p.28.
See “The Budget” in the Sydney Morning Herald, 20 August 1986, special supplement,207
p.11.
change. Paul Keating, Treasurer during the 1980s in the ALP government led by BobHawke, returned to the previous approaches to taxation and, according to hi sbiographer, “in 1983. . .advocated the idea of a broad indirect tax to replace some of theincome tax.”205
Indeed, on both sides of politics, the focus has swu ng back to indirect taxation. FlorenceChong commented in The Australian, in 1993, that the Keating government “collected$9.1 billion from indirect taxes in 1991-92. . .T he amount collected from this source hasmore than doubled since 1983-84 when Labor came to office.” 206
In New South Wales, drinking and smoking retain a definite significance. NSW ha sbeen, and appears to remain, the largest market for beer in Australia and access t odrinking has been made easier and easier over the years. Sydney is a lso the largest centreof cigarette production in the country. Drinking, and the often accompanying activit yof smoking, not only sustains the hotel industry but sustains the much larger RSL andLeagues club industry with thei r associated large-scale gambling activity. Drinking andsmoking have also been significant past contributors to government revenue.
Today, on a state fiscal level, as the focus on indirect t axation has increased, alcohol andtobacco have returned as significant elements in state revenue. Ever since 1986, whenthe prices for Australian commodities fell dramaticall y, contributing to a crisis in federalgovernment revenue and the Hawke’s government’s decision to cut payments to th estates, New South Wales, like its counterparts in the federation, has sought out furthersources of finance. Barrie Unsworth, Premier of NSW at the time of the Hawk egovernment’s 1986 Budget, declared that, as a result of the Hawke government’ sreduction in payments to the sta tes, “We will have to review the NSW Budget and lookat our expenditure and have a look at our revenue rai sing capacity.” Increased indirect207
taxation - including increased taxation on alcohol and tobacco - has since become themeans to make up the difference between the funding the federal government ha swithdrawn and the state’s continuing requirements.
A dilemma which has developed in this strategy for revenue, however, is th econtradiction between the role of alco hol, and in the past tobacco, as (what some wouldsee) a small source of pleasure in the lives of those less well off, versus the issues o fhealth and social responsibility. These questions emerged when NSW was a colony ,

Alcohol and Tobacco in NSW: Consumption, Revenue and Concern56
Beresford, op.cit., pp.210-211.208
Cross, op.cit., p.94.209
See New South Wales Year Book 1995 (Australian Bureau of Statistics, Sydney, 1995),210
p.35 for NSW percentage of Australian population as a whole.
through the Intoxicating Drink Inquiry Commission, and continued after federation .Charles Wade, Attorney General in the Carruthers government, declared in 1906 tha tgambling, for example, encouraged “id le, thriftless, reckless and selfish” characteristicsamongst the citizens of his state and that “Such a class of man, in the course of time ,would be the downfall of New South Wales.” Snowden, the first Labour Part y208
Treasurer in Britain, wrote in 1909 that one “of the evils which curse our country today.. .[is] indulgence in drink”. Research in recent times not only continues to highlight209
the adverse effects of alcohol consumption on personal health but underlines its role inpublic assaults and in domestic violence.
On the surface, in regard to the adverse effects of drinking and smoking, there seems tobe some progress. Drinking of low-alcohol bee r has noticeably increased, and there hasbeen some decline in the number of people smoking. Orientating fiscal strategies on the basis of health appears to provide a resolution .Relatively high levies on alcohol and tobacco ought to both discourage unhealth yconsumption and materially assist the government finances.
On closer observation, however, the situation may be more involved. There woul dappear to be around 2½ million people who drink, and around 1 million people wh osmoke, in New South Wales (on the basis that about 34% of the Australian populationlive in NSW). It would seem to be the case that, for many, amongst this group ,210
drinking, and to a lesser extent, smoking will remain as minor pleasures in their lives -but under an ever increasing expense. It is also true that the o utlet for this minor pleasure- particularly the RSL and Leagues clubs - in turn sustains wha t has now become a muchmore significant element of NSW government revenue: g ambling. In this regard it couldbe also be argued that governments still attract more from people through their drinkingand smoking, in terms of revenue, than it costs those same governments in attending tothe ill-health that people acquire from their consumption of those same two substances.