albuquerque home statistics for may 2011
DESCRIPTION
Supply and Demand statistics for areas and price ranges in the Albuquerque metro areaTRANSCRIPT
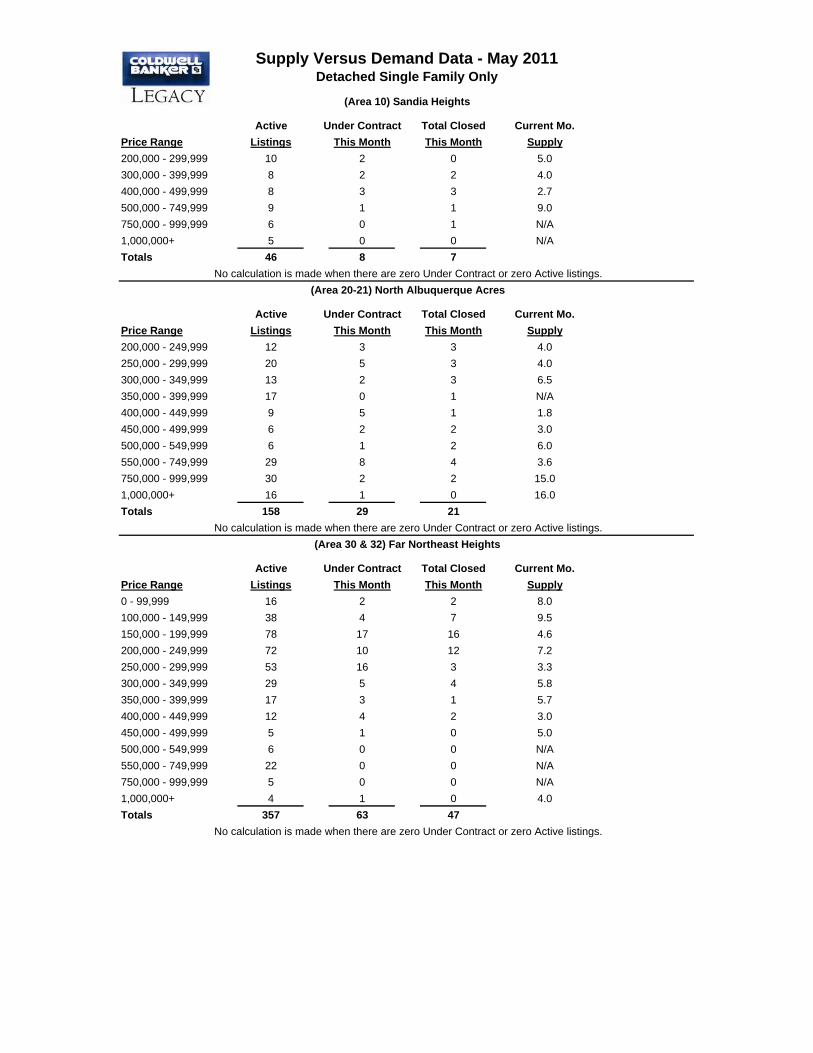
Active Under Contract Total Closed Current Mo.Price Range Listings This Month This Month Supply200,000 - 299,999 10 2 0 5.0300,000 - 399,999 8 2 2 4.0400,000 - 499,999 8 3 3 2.7500,000 - 749,999 9 1 1 9.0750,000 - 999,999 6 0 1 N/A1,000,000+ 5 0 0 N/ATotals 46 8 7
Active Under Contract Total Closed Current Mo.Price Range Listings This Month This Month Supply200,000 - 249,999 12 3 3 4.0250,000 - 299,999 20 5 3 4.0300,000 - 349,999 13 2 3 6.5350,000 - 399,999 17 0 1 N/A400,000 - 449,999 9 5 1 1.8450,000 - 499,999 6 2 2 3.0500,000 - 549,999 6 1 2 6.0550,000 - 749,999 29 8 4 3.6750,000 - 999,999 30 2 2 15.01,000,000+ 16 1 0 16.0Totals 158 29 21
Active Under Contract Total Closed Current Mo.Price Range Listings This Month This Month Supply0 - 99,999 16 2 2 8.0100,000 - 149,999 38 4 7 9.5150,000 - 199,999 78 17 16 4.6200,000 - 249,999 72 10 12 7.2250,000 - 299,999 53 16 3 3.3300,000 - 349,999 29 5 4 5.8350,000 - 399,999 17 3 1 5.7400,000 - 449,999 12 4 2 3.0450,000 - 499,999 5 1 0 5.0500,000 - 549,999 6 0 0 N/A550,000 - 749,999 22 0 0 N/A750,000 - 999,999 5 0 0 N/A1,000,000+ 4 1 0 4.0Totals 357 63 47
No calculation is made when there are zero Under Contract or zero Active listings.
(Area 30 & 32) Far Northeast Heights
Detached Single Family OnlySupply Versus Demand Data - May 2011
(Area 10) Sandia Heights
(Area 20-21) North Albuquerque Acres No calculation is made when there are zero Under Contract or zero Active listings.
No calculation is made when there are zero Under Contract or zero Active listings.

Active Under Contract Total Closed Current Mo.Price Range Listings This Month This Month Supply0 - 299,999 8 0 1 N/A300,000 - 349,999 4 1 0 4.0350,000 - 399,999 8 1 0 8.0400,000 - 449,999 6 0 1 N/A450,000 - 499,999 7 0 1 N/A500,000 - 549,999 6 1 1 6.0550,000 - 749,999 18 2 3 9.0750,000 - 999,999 9 1 0 9.01,000,000+ 15 0 0 N/ATotals 81 6 7
Active Under Contract Total Closed Current Mo.Price Range Listings This Month This Month Supply100,000 - 149,999 3 0 2 N/A150,000 - 199,999 16 2 4 8.0200,000 - 249,999 19 6 5 3.2250,000 - 299,999 18 5 1 3.6300,000 - 349,999 10 1 1 10.0350,000 - 399,999 9 1 1 9.0400,000 - 449,999 6 1 1 6.0450,000 - 499,999 11 1 0 11.0500,000 - 549,999 4 0 0 N/A550,000 - 749,999 6 1 0 6.0750,000 - 999,999 0 0 0 0.01,000,000+ 0 0 0 0.0Totals 102 18 15
Active Under Contract Total Closed Current Mo.Price Range Listings This Month This Month Supply0 - 149,999 38 5 11 7.6150,000 - 199,999 48 4 8 12.0200,000 - 249,999 24 1 2 24.0250,000 - 299,999 9 2 0 4.5300,000 - 399,999 3 2 0 1.5400,000 - 499,999 0 0 0 0.0>500,000 0 0 0 0.0Totals 122 14 21
No calculation is made when there are zero Under Contract or zero Active listings.
(Area 41) Uptown
Detached Single Family OnlySupply Versus Demand Data - May 2011
(Area 31) Foothills North
(Area 40) UNM No calculation is made when there are zero Under Contract or zero Active listings.
No calculation is made when there are zero Under Contract or zero Active listings.

Active Under Contract Total Closed Current Mo.Price Range Listings This Month This Month Supply0 - 149,999 21 4 4 5.3150,000 - 199,999 20 5 5 4.0200,000 - 249,999 17 0 4 N/A250,000 - 299,999 10 1 2 10.0300,000 - 399,999 17 1 2 17.0400,000 - 499,999 6 1 0 6.0500,000 - 749,999 2 0 0 N/A>750,000 0 0 0 0.0Totals 93 12 17
Active Under Contract Total Closed Current Mo.Price Range Listings This Month This Month Supply0 - 149,999 111 22 30 5.0150,000 - 199,999 120 26 15 4.6200,000 - 249,999 63 4 10 15.8250,000 - 299,999 11 2 4 5.5300,000 - 349,999 5 0 0 N/A350,000 - 399,999 1 0 0 N/A400,000 - 499,999 2 0 0 N/A500,000 - 999,999 1 0 0 N/A1,000,000+ 0 0 0 0.0Totals 314 54 59
Active Under Contract Total Closed Current Mo.Price Range Listings This Month This Month Supply0 - 99,999 0 0 0 0.0100,000 - 149,999 5 3 2 1.7150,000 - 199,999 16 1 1 16.0200,000 - 249,999 11 2 2 5.5250,000 - 299,999 13 1 3 13.0300,000 - 349,999 9 1 2 9.0350,000 - 399,999 11 1 0 11.0400,000 - 449,999 3 0 0 N/A450,000 - 499,999 7 0 0 N/A500,000 - 549,999 2 0 0 N/A550,000 - 749,999 3 0 0 N/A750,000 - 999,999 2 0 0 N/A1,000,000+ 1 0 0 N/ATotals 83 9 10
No calculation is made when there are zero Under Contract or zero Active listings.
(Area 51) Foothills South
Detached Single Family OnlySupply Versus Demand Data - May 2011
(Area 42) UNM South
(Area 50) Northeast Heights No calculation is made when there are zero Under Contract or zero Active listings.
No calculation is made when there are zero Under Contract or zero Active listings.

Active Under Contract Total Closed Current Mo.Price Range Listings This Month This Month Supply0 - 149,999 0 0 0 0.0150,000 - 199,999 7 1 2 7.0200,000 - 249,999 12 1 0 12.0250,000 - 299,999 7 0 2 N/A300,000 - 349,999 6 2 1 3.0350,000 - 399,999 5 0 0 N/A400,000 - 449,999 3 0 0 N/A450,000 - 499,999 4 0 0 N/A500,000 - 749,999 3 0 0 N/A750,000 - 999,999 1 0 0 N/A1,000,000+ 2 0 0 N/ATotals 50 4 5
Active Under Contract Total Closed Current Mo.Price Range Listings This Month This Month Supply0 - 149,999 22 6 2 3.7150,000 - 199,999 17 4 4 4.3200,000 - 249,999 3 1 1 3.0250,000 - 299,999 3 1 0 3.0300,000 - 399,999 2 1 0 2.0400,000 - 449,999 0 0 0 0.0450,000 - 499,999 0 0 0 0.0>500,000 0 0 0 0.0Totals 47 13 7
Active Under Contract Total Closed Current Mo.Price Range Listings This Month This Month Supply0 - 149,999 46 6 6 7.7150,000 - 199,999 17 4 2 4.3200,000 - 249,999 17 1 1 17.0250,000 - 299,999 16 1 0 16.0300,000 - 399,999 5 1 1 5.0400,000 - 449,999 0 0 0 0.0450,000 - 499,999 2 0 0 N/A>500,000 0 0 0 0.0Totals 103 13 10
No calculation is made when there are zero Under Contract or zero Active listings.
(Area 71) Southeast Heights
Detached Single Family OnlySupply Versus Demand Data - May 2011
(Area 60) Four Hills Village
(Area 70) Fairgrounds No calculation is made when there are zero Under Contract or zero Active listings.
No calculation is made when there are zero Under Contract or zero Active listings.

Active Under Contract Total Closed Current Mo.Price Range Listings This Month This Month Supply0 - 99,999 19 1 4 19.0100,000 - 149,999 51 4 3 12.8150,000 - 199,999 33 5 4 6.6200,000 - 249,999 17 0 3 N/A250,000 - 299,999 19 0 0 N/A300,000 - 349,999 11 0 0 N/A350,000 - 399,999 7 2 1 3.5400,000 - 499,999 5 2 0 2.5500,000 - 749,999 5 0 1 N/A750,000 - 999,999 2 0 0 N/A1,000,000+ 1 0 0 N/ATotals 170 14 16
Active Under Contract Total Closed Current Mo.Price Range Listings This Month This Month Supply0 - 99,999 88 29 24 3.0100,000 - 149,999 219 43 33 5.1150,000 - 199,999 90 6 5 15.0200,000 - 249,999 10 1 0 10.0250,000 - 299,999 13 1 0 13.0300,000 - 349,999 6 0 0 N/A350,000 - 399,999 2 0 0 N/A400,000 - 499,999 7 0 0 N/A500,000 - 749,999 8 0 0 N/A750,000 - 999,999 0 0 0 0.01,000,000+ 0 0 0 0.0Totals 443 80 62
Active Under Contract Total Closed Current Mo.Price Range Listings This Month This Month Supply0 - 149,999 62 9 12 6.9150,000 - 199,999 30 6 10 5.0200,000 - 249,999 38 5 2 7.6250,000 - 299,999 28 2 5 14.0300,000 - 349,999 13 2 2 6.5350,000 - 399,999 17 2 1 8.5400,000 - 449,999 13 4 1 3.3450,000 - 499,999 9 3 0 3.0500,000 - 549,999 10 0 1 N/A550,000 - 749,999 23 0 1 N/A750,000 - 999,999 18 2 2 9.01,000,000+ 33 0 0 N/ATotals 294 35 37
No calculation is made when there are zero Under Contract or zero Active listings.
(Area 100-102) North Valley
Detached Single Family OnlySupply Versus Demand Data - May 2011
(Area 80) Downtown
(Area 90-93) South Valley No calculation is made when there are zero Under Contract or zero Active listings.
No calculation is made when there are zero Under Contract or zero Active listings.

Active Under Contract Closed Current Mo.Price Range Listings This Month This Month Supply0 - 99,999 28 8 8 3.5100,000 - 149,999 126 32 21 3.9150,000 - 199,999 151 25 30 6.0200,000 - 249,999 56 7 8 8.0250,000 - 299,999 39 7 6 5.6300,000 - 349,999 21 4 2 5.3350,000 - 399,999 9 1 1 9.0400,000 - 499,999 12 2 1 6.0500,000 - 749,999 14 0 0 N/A750,000 - 999,999 6 0 0 N/A1,000,000+ 2 0 0 N/ATotals 464 86 77
Active Under Contract Total Closed Current Mo.Price Range Listings This Month This Month Supply0 - 99,999 2 3 0 0.7100,000 - 149,999 71 17 23 4.2150,000 - 199,999 130 35 24 3.7200,000 - 249,999 94 17 13 5.5250,000 - 299,999 46 3 5 15.3300,000 - 349,999 11 1 0 11.0350,000 - 399,999 20 0 0 N/A400,000 - 499,999 4 0 1 N/A500,000 - 749,999 5 0 0 N/A750,000 - 999,999 0 0 0 0.01,000,000+ 0 0 0 0.0Totals 383 76 66
Active Under Contract Total Closed Current Mo.Price Range Listings This Month This Month Supply0 - 399,999 35 3 3 11.7400,000 - 499,999 12 3 1 4.0500,000 - 599,999 17 1 0 17.0600,000 - 699,999 9 0 0 N/A700,000 - 799,999 5 0 0 N/A800,000 - 899,999 6 1 0 6.0900,000 - 999,999 5 0 0 N/A1,000,000+ 14 0 0 N/ATotals 103 8 4
Supply Versus Demand Data - May 2011
(Area 103, 110-111) Northwest Heights
No calculation is made when there are zero Under Contract or zero Active listings.
No calculation is made when there are zero Under Contract or zero Active listings.
No calculation is made when there are zero Under Contract or zero Active listings.
(Area 130) Corrales
(Area 120 - 121) Paradise Hills
Detached Single Family Only

Active Under Contract Total Closed Current Mo.Price Range Listings This Month This Month Supply0 - 99,999 6 0 2 N/A100,000 - 149,999 13 2 4 6.5150,000 - 199,999 22 14 5 1.6200,000 - 249,999 24 8 3 3.0250,000 - 299,999 21 3 0 7.0300,000 - 349,999 2 0 0 N/A350,000 - 399,999 6 1 0 6.0400,000 - 449,999 2 0 0 N/A450,000 - 499,999 3 0 0 N/A500,000 - 549,999 0 0 0 0.0550,000 - 749,999 1 0 0 N/A750,000 - 999,999 0 0 0 0.01,000,000+ 0 0 0 0.0Totals 100 28 14
Active Under Contract Total Closed Current Mo.Price Range Listings This Month This Month Supply0 - 99,999 28 11 15 2.5100,000 - 149,999 95 26 26 3.7150,000 - 199,999 88 11 15 8.0200,000 - 249,999 62 10 6 6.2250,000 - 299,999 42 5 10 8.4300,000 - 349,999 28 3 4 9.3350,000 - 399,999 26 5 2 5.2400,000 - 449,999 13 1 1 13.0450,000 - 499,999 15 0 0 N/A500,000 - 549,999 3 1 0 3.0550,000 - 749,999 8 0 1 N/A750,000 - 999,999 1 0 0 N/A1,000,000+ 1 0 0 N/ATotals 410 73 80
Active Under Contract Total Closed Current Mo.Price Range Listings This Month This Month Supply0 - 99,999 10 2 5 5.0100,000 - 149,999 66 21 20 3.1150,000 - 199,999 72 10 13 7.2200,000 - 249,999 42 3 3 14.0250,000 - 299,999 19 1 0 19.0300,000 - 349,999 10 0 2 N/A350,000 - 399,999 13 0 1 N/A400,000 - 449,999 3 0 0 N/A450,000 - 499,999 6 0 0 N/A500,000 - 549,999 3 0 0 N/A550,000 - 749,999 4 0 0 N/A750,000 - 999,999 1 0 0 N/A1,000,000+ 1 0 0 N/ATotals 250 37 44
No calculation is made when there are zero Under Contract or zero Active listings.
(Area 160-162) Rio Rancho North
Detached Single Family OnlySupply Versus Demand Data - May 2011
(Area 140-141) Rio Rancho South
(Area 150-152) Rio Rancho Mid No calculation is made when there are zero Under Contract or zero Active listings.
No calculation is made when there are zero Under Contract or zero Active listings.

Active Under Contract Total Closed Current Mo.Price Range Listings This Month This Month Supply0 - 99,999 6 1 2 6.0100,000 - 149,999 7 0 2 N/A150,000 - 199,999 8 3 0 2.7200,000 - 249,999 15 0 2 N/A250,000 - 299,999 3 2 3 1.5300,000 - 349,999 4 0 0 N/A350,000 - 399,999 4 0 1 N/A400,000 - 449,999 2 0 0 N/A450,000 - 499,999 3 0 0 N/A500,000 - 549,999 2 0 0 N/A550,000 - 749,999 5 0 0 N/A750,000 - 999,999 3 0 0 N/A1,000,000+ 4 0 0 N/ATotals 66 6 10
Active Under Contract Total Closed Current Mo.Price Range Listings This Month This Month Supply0 - 399,999 33 2 3 16.5400,000 - 499,999 32 1 3 32.0500,000 - 599,999 11 0 1 N/A600,000 - 699,999 12 1 0 12.0700,000 - 799,999 8 0 0 N/A800,000 - 899,999 2 0 0 N/A900,000 - 999,999 2 0 0 N/A1,000,000+ 6 0 0 N/ATotals 106 4 7
Active Under Contract Total Closed Current Mo.Price Range Listings This Month This Month Supply0 - 99,999 28 5 7 5.6100,000 - 149,999 32 5 2 6.4150,000 - 199,999 59 6 6 9.8200,000 - 249,999 54 3 3 18.0250,000 - 299,999 66 5 2 13.2300,000 - 349,999 35 3 1 11.7350,000 - 399,999 33 0 1 N/A400,000 - 449,999 23 1 1 23.0450,000 - 499,999 20 0 3 N/A500,000 - 549,999 6 0 0 N/A550,000 - 749,999 47 1 0 47.0750,000 - 999,999 12 2 0 6.01,000,000+ 8 1 0 8.0Totals 423 32 26
Supply Versus Demand Data - May 2011
(Area 170) Bernalillo/Algodones
No calculation is made when there are zero Under Contract or zero Active listings.
No calculation is made when there are zero Under Contract or zero Active listings.
No calculation is made when there are zero Under Contract or zero Active listings.
(Area 210-293) East Mountains
(Area 180) Placitas
Detached Single Family Only
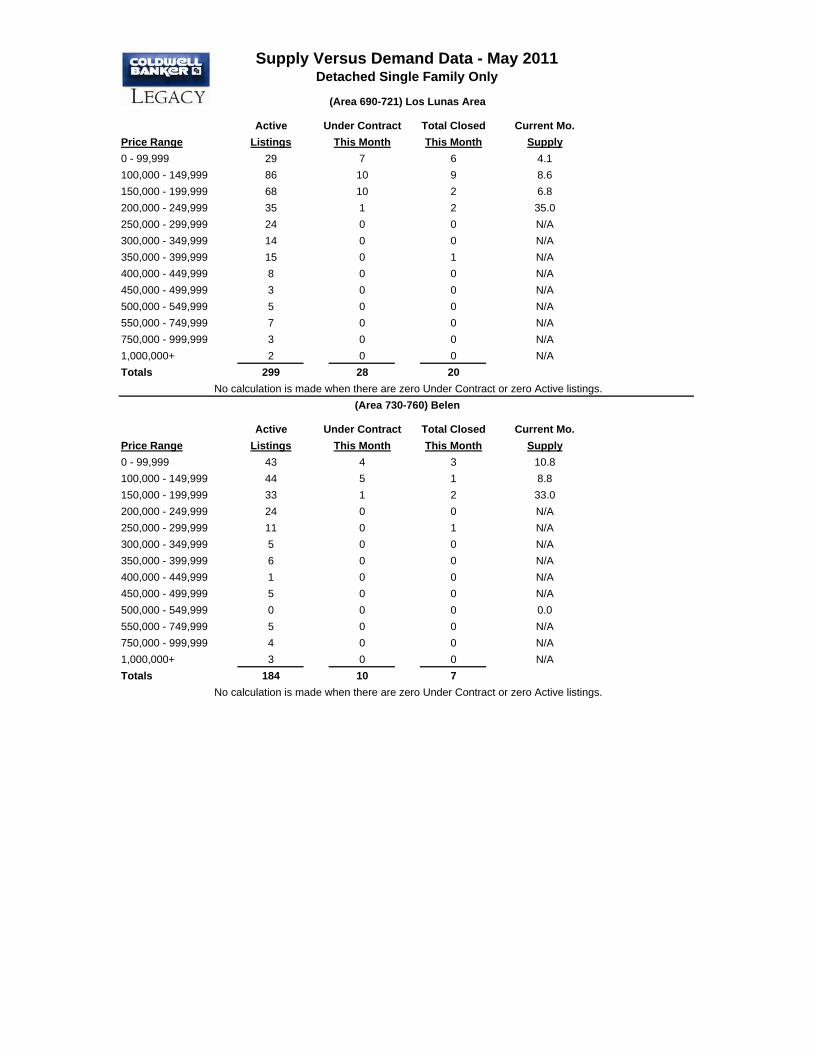
Active Under Contract Total Closed Current Mo.Price Range Listings This Month This Month Supply0 - 99,999 29 7 6 4.1100,000 - 149,999 86 10 9 8.6150,000 - 199,999 68 10 2 6.8200,000 - 249,999 35 1 2 35.0250,000 - 299,999 24 0 0 N/A300,000 - 349,999 14 0 0 N/A350,000 - 399,999 15 0 1 N/A400,000 - 449,999 8 0 0 N/A450,000 - 499,999 3 0 0 N/A500,000 - 549,999 5 0 0 N/A550,000 - 749,999 7 0 0 N/A750,000 - 999,999 3 0 0 N/A1,000,000+ 2 0 0 N/ATotals 299 28 20
Active Under Contract Total Closed Current Mo.Price Range Listings This Month This Month Supply0 - 99,999 43 4 3 10.8100,000 - 149,999 44 5 1 8.8150,000 - 199,999 33 1 2 33.0200,000 - 249,999 24 0 0 N/A250,000 - 299,999 11 0 1 N/A300,000 - 349,999 5 0 0 N/A350,000 - 399,999 6 0 0 N/A400,000 - 449,999 1 0 0 N/A450,000 - 499,999 5 0 0 N/A500,000 - 549,999 0 0 0 0.0550,000 - 749,999 5 0 0 N/A750,000 - 999,999 4 0 0 N/A1,000,000+ 3 0 0 N/ATotals 184 10 7
Supply Versus Demand Data - May 2011
No calculation is made when there are zero Under Contract or zero Active listings.
No calculation is made when there are zero Under Contract or zero Active listings.
(Area 730-760) Belen
(Area 690-721) Los Lunas Area
Detached Single Family Only