alaska fisheries science center theme i part i€¦ · alaska fisheries science center noaa...
TRANSCRIPT

Stock assessment models atAlaska Fisheries Science Center
Theme I – Part I
Alaska Fisheries
Science Center
Dana Hanselman
Auke Bay Laboratories
Alaska Fisheries Science Center
NOAA Fisheries

Theme I, Part 1 Outline
• Tier system, targets and non-targets
• Approaches for data-limited stocks
– Tier 6 example: Sharks
– Tier 5 example: Shortraker rockfish
– Tier 4 (crab) example:
• Control rules, uncertainty
• Retrospective working group

Definitions• MSY: Maximum Sustainable Yield
– Largest long-term average catch or yield that can be taken from a stock or stock complex under prevailing ecological and environmental conditions
• ABC: Acceptable Biological Catch– Scientific advice on what the maximum quota should be.
• OFL: Overfishing Level– The level of catch when fishing at FMSY/OFL
• FABC / FOFL: Fishing mortality rate used to set ABC / OFL– Either from estimated MSY (Tier 1) or proxy (other tiers)
• TAC: Total Allowable Catch– Species-specific annually determined catch, based on MSY, OY

How do we choose our level of harvest/risk
• Target fisheries:
– Some stocks we have high data quality and low
uncertainty
– Harvest rates are based on the productivity of the
stock
• Incidental catch fisheries:
– We know less, so targeted fishing is not allowed
– Limits are still imposed, and are sometimes linked
to stock productivity

Groundfish tier system• Tier 1: Bering Sea Pollock
– Reliable stock recruitment relationship
– Quota is buffered from OFL by sci. uncertainty
• Tier 2: Pacific ocean perch pre-1996
• Tier 3: Pacific Cod, Sablefish, Rockfish– Reliable estimates of spawners, age-structured model
– Quota is buffered from OFL and control rule
• Tier 4: Some Flatfish, GOA Sharpchin
• Tier 5: Shortraker rockfish– OFL based on survey biomass estimates and natural
mortality, 25% buffer
• Tier 6: Sharks, other species– OFL usually based on historical catch
Dat
a qual
ity

Crab tier system

Current Crab Management Tier system
Snow crabBristol Bay Red king crab
Tanner CrabSt. Matthew Blue King CrabPribilof Islands Red King CrabPribilof Islands Blue King CrabNorton Sound Red King Crab
Aleutian Islands Golden King CrabPribilof Islands Golden King CrabAdak Red King Crab
STOCKS

Different data, different models
• Goal: If it’s important and possible, age-structured
model
• Challenges: Crab, Pacific cod, shortraker rockfish,
thornyhead rockfish
• Non-targeted, or low abundance stocks, could
probably be elevated in tier, but aren’t because:
– Aging capacity
– Assessment scientist capacity
• Data-limited approaches used


Data-limited in Alaska
• Data-limited is a relative term
• Species that are transient and semi-pelagic
(spiny dogfish) or cryptic (octopus)
• We have 2 surveys, a stock assessment, and
estimates of ABC and OFL for an
ecosystem component (grenadiers)!

Approaches
• Catch-only (Tier 6)
• Survey biomass based (Tier 5)
– “Reliable” estimates of B and M
• Hybrid (mixture of T6 and T5 methods)
• Ecosystem Tier 5 (octopus)
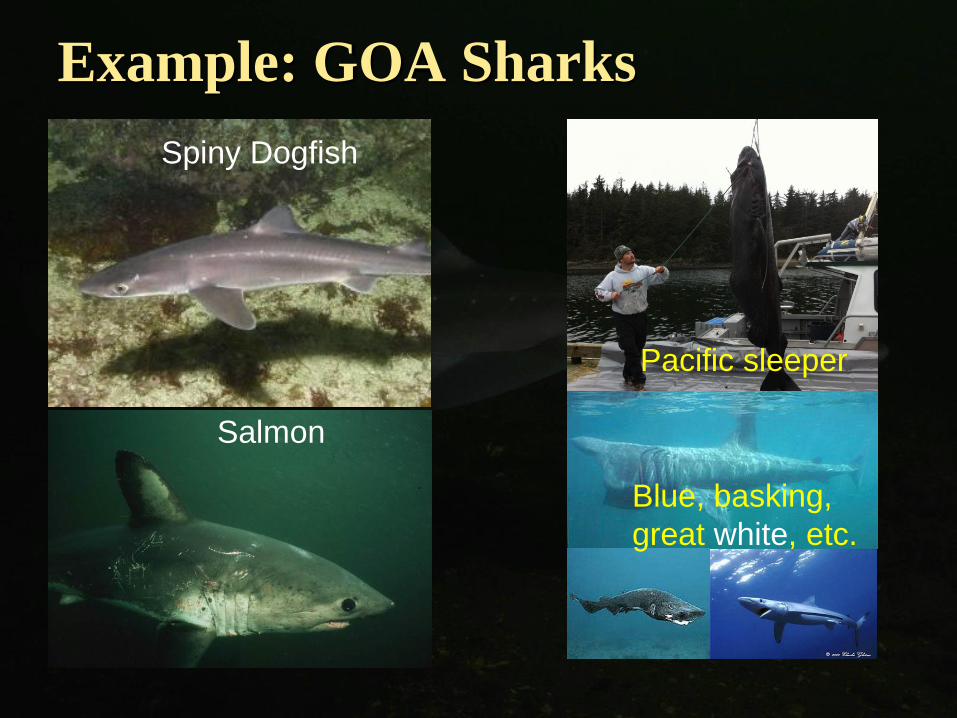
Example: GOA Sharks
Spiny Dogfish
Salmon
Pacific sleeper
Blue, basking,
great white, etc.

Data Sources Commercial catch
Historical catch (1997 – 2007) used for:
Pacific sleeper shark
Salmon shark
Other/unidentified sharks
GOA Biennial Trawl Survey
Used for spiny dogfish ABC/OFL
Other data sources
AFSC longline survey
IPHC longline survey

GOA Shark Catch
0
400
800
1200
1600
2003 2004 2005 2006 2007 2008 2009 2010 2011 2012 2013Year
Ca
tch
(t)
Species
Spiny Dogfish
Pacific Sleeper Shark
Salmon Shark
Other Sharks
Shark Complex Catch
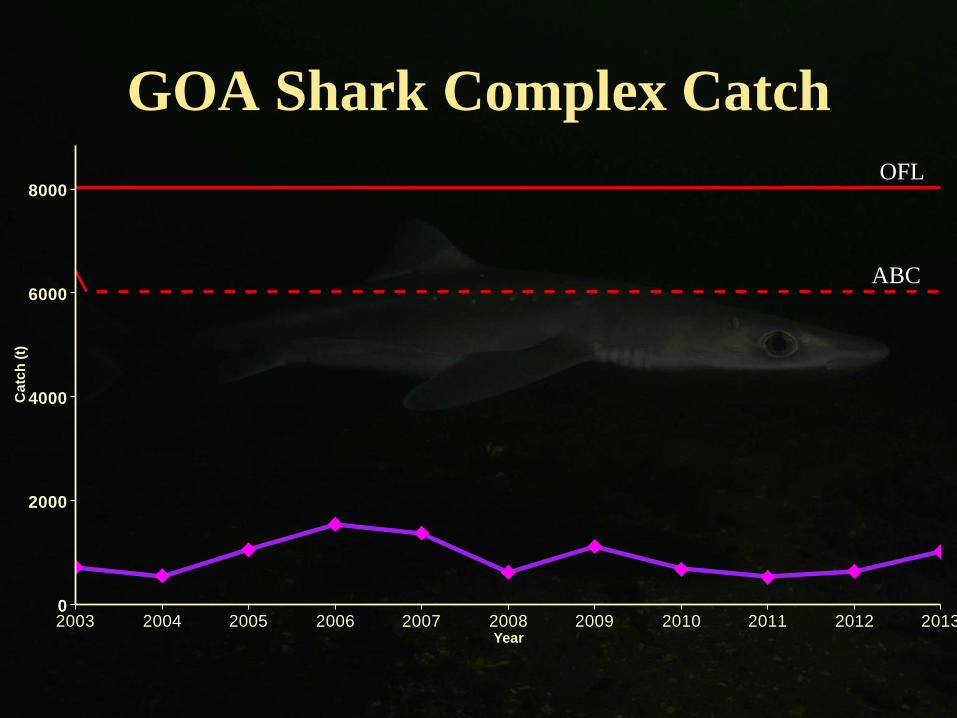
GOA Shark Complex Catch
0
2000
4000
6000
8000
2003 2004 2005 2006 2007 2008 2009 2010 2011 2012 2013Year
Ca
tch
(t)
ABC
OFL

GOA Bottom Trawl Biomass
Biomass is not estimated for
other or unidentified sharks
0
10,000
20,000
30,000
1990 2000 2010Year
Bio
ma
ss
(t)
Salmon Shark
0
20,000
40,000
60,000
80,000
1990 2000 2010Year
Bio
ma
ss
(t)
Pacific Sleeper Shark
0
100,000
200,000
1990 2000 2010Year
Bio
ma
ss
(t)
Spiny Dogfish

OFL calculation
Spiny dogfish component is calculated using
an average trawl survey biomass, multiplied by
natural mortality
The rest of the complex uses tier 6 methods of
the average catch over a fixed period
These are added together for the complex and
ABC = 0.75 * OFL

GOA Shortraker Rockfish

GOA Shortraker Rockfish
Tier 5 species
Large, (probably) old, and valuable
Attempts have been made to production age
Lots of data, multiple surveys
No little ones (estimating recruitment and
length-based would be difficult)

Shortraker Trawl Survey Biomass
0
20
40
60
80
100
120
1984 1990 1996 2001 2005 2009 2013
Bio
mas
s (k
t)

1,907 kg

Fitting Total Trawl Survey Biomass
via Random Effects Model
-
20
40
60
80
100
120
1983 1988 1993 1998 2003 2008 2013
Bio
mas
s (k
t)
Estimated biomass
UCI/LCI
Observed survey biomass
Status quo biomass

Crab example
Pribolof Island Red King Crab (Tier 4)

Crab example
Pribolof Island Red King Crab (Tier 4)
3-year average of mature male survey
biomass
Fmsy = M = 0.18
P* = 0.49 with survey uncertainty of last
year survey of 0.62 and background
uncertainty of 0.40

Criticisms of lower tiers
Assumption of survey biomass being an
estimate of “absolute exploitable biomass”
Assumption that M is a good proxy for Fmsy
Size of buffer between ABC and OFL
should be stock-specific, for example
>0.75 for a gadid
<0.75 for a shark
Approaches are evolving

Single species management
Catch < TAC< ACL=ABC < OFL
OFL ~ Catch at FMSY

Buffers/Control rules
Groundfish data limited stocks have a fixed buffer at 0.75 x OFL
Crab stocks use a probability-only approach with a P* of 0.49
Buffers have been set at about 10%
Tier 3 stocks have a buffer that is the difference between F35 and F40
Tiers 3 and higher have a control rule that lowers the harvest rate when below our target reference point

Stock status (How are we doing?)
U.S. Department of Commerce | National Oceanic and Atmospheric Administration | NOAA Fisheries | Page 28
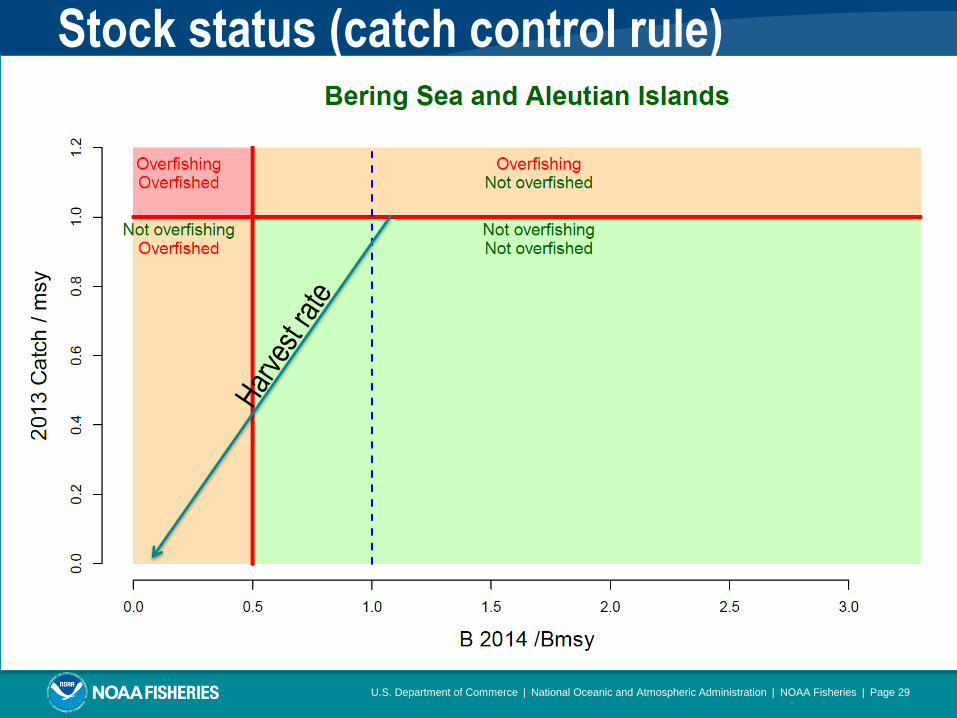
Stock status (catch control rule)
U.S. Department of Commerce | National Oceanic and Atmospheric Administration | NOAA Fisheries | Page 29

Stock status (catch control rule)
U.S. Department of Commerce | National Oceanic and Atmospheric Administration | NOAA Fisheries | Page 30
0
0.2
0.4
0.6
0.8
1
1.2
1.4
1.6
0 0.2 0.4 0.6 0.8 1 1.2 1.4 1.6 1.8 2
Fis
hing
mor
tali
ty re
lati
ve to
F35
%
Spawning biomass relative to B35%
Groundfish OFL
Groundfish ABC
F_OFL
Crab OFL
B_OFL

Are ACLs determined with
scientific uncertainty? Yes!
Quantitatively in some cases (Tier 1 and
crab)
Qualitatively in other (everything else)
Tier 1 specifically addresses uncertainty
in MSY
What about “everything else?”

P* approach = Probability ACL>OFL
ACL
P*

Implied buffers in other tiers (AK Groundfish)
Uncertainty (CV)
Lower tier – buffer ~25%
Tier 3 – buffer ~17%

Buffers/uncertaintyTier ABC Buffer Direct link to
uncertainty
Average
buffer
1 (groundfish) Harmonic mean
of MSY
Yes ~5%
3 and 4
(groundfish)
Ratio of F40/F35 x
OFL
No ~17%
5 and 6
(groundfish)
0.75 * OFL No 25%
Crab (Tiers 3-4) P* = 0.49 +
SSC/DFG
Yes ~10%
Crab (Tier 5) <=0.9 x OFL No 10%

Report of the Retrospective
Investigations GroupRound 2: The compilation
Dana Hanselman, Bill Clark, and Mike Sigler
Groundfish Plan Team meetingSeattle, WA September 2013

Introduction I
A retrospective pattern is a systematic inconsistency among a series of estimates of population size … based on increasing periods of data (Mohn 1999).
GOA_PCOD
SABLE
0.00
0.25
0.50
0.75
0.0
0.1
0.2
0 10 20 30
Year
Re
lative
re
tro
sp
ective
ch
an
ge
to
te
rmin
al ye
ar
Model_Year
2011
2010
2009
2008
2007
2006
2005
2004
2003

Introduction II
2012:
Discussed retrospectives, showed examples, requested retrospectives from all authors
2013:
Compiled retrospectives of SSB for 20 AFSC stocks
Computed statistics, plotted, compared, examined potential causes
Recommendations for future work

The contestants
Stock ID Common name
Mean
Survey
CV
Survey
Time
Series CV M
Recruit.
CV
Average
F
GOA_NR GOA Northern rockfish 0.426 0.638 0.060 0.974 0.027
BSAI_POP BSAI Pacific ocean perch 0.250 0.538 0.062 0.655 0.031
GOA_ATF GOA Arrowtooth flounder 0.089 0.286 0.275 0.333 0.009
BSAI_GT BSAI Greenland turbot 0.181 0.437 0.112 1.844 0.124
GOA_REBS GOA RE/BS rockfish 0.176 0.146 0.030 0.668 0.024
GOA_DUSKY GOA Dusky rockfish 0.397 0.538 0.070 0.924 0.053
BSAI_PCOD BSAI Pacific cod 0.085 0.330 0.340 0.669 0.191
GOA_PCOD GOA Pacific cod 0.177 0.364 0.340 0.430 0.228
BSAI_ATKA BSAI Atka mackerel 0.249 0.375 0.300 0.609 0.167
GOA_POP GOA Pacific ocean perch 0.250 0.432 0.060 0.680 0.102
BSAI_YFS BSAI Yellowfin sole 0.089 0.202 0.120 0.502 0.079
BSAI_NRS BSAI Northern rock sole 0.090 0.481 0.150 0.553 0.022
BSAI_NR BSAI Northern rockfish 0.302 0.327 0.041 0.648 0.086
AI_POLL AI Walleye pollock 0.345 0.767 0.180 2.130 0.076
BSAI_POLL EBS walleye pollock 0.110 0.342 0.300 0.629 0.211
BSAI_BSRE BSAI BS/RE rockfish 0.278 0.898 0.033 1.419 0.047
SABLE Alaska sablefish 0.131 0.090 0.100 1.031 0.080
GOA_POLL GOA Walleye pollock 0.176 0.973 0.300 1.212 0.141
BSAI_FHS BSAI Flathead sole 0.111 0.276 0.200 0.516 0.066
BSAI_APL BSAI Alaska plaice 0.114 0.160 0.130 0.418 0.045

The stats: Mohn’s revised ρGOA_PCOD
SABLE
0.00
0.25
0.50
0.75
0.0
0.1
0.2
0 10 20 30
Year
Re
lative
re
tro
sp
ective
ch
an
ge
to
te
rmin
al ye
ar
Model_Year
2011
2010
2009
2008
2007
2006
2005
2004
2003
The average of the relative deviations of the terminal year to the reference model as data is removed.
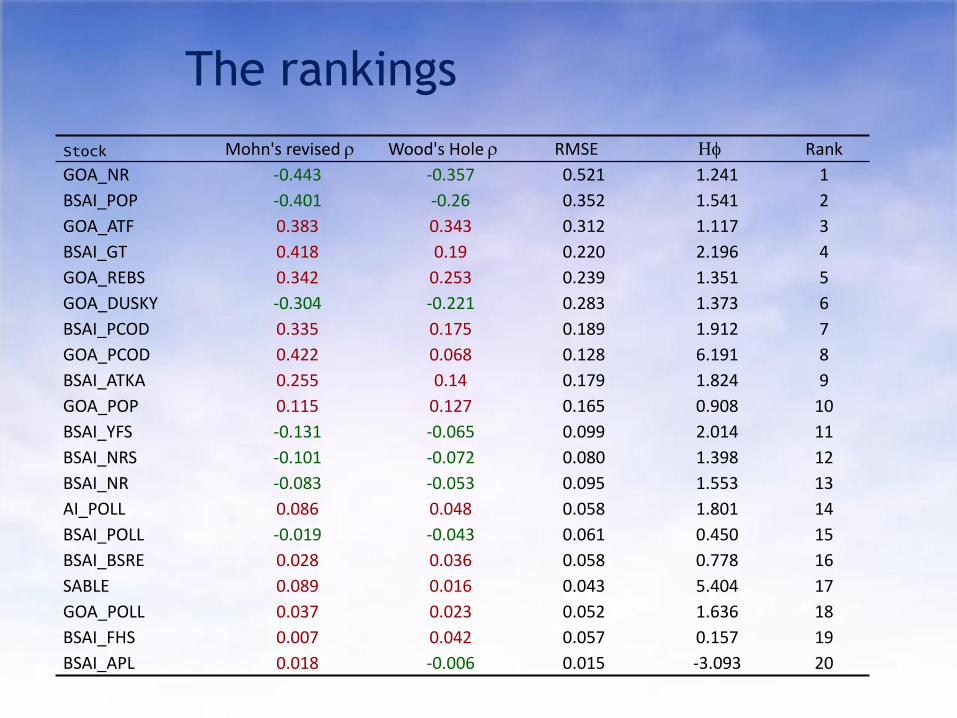
The rankings
Stock Mohn's revised r Wood's Hole r RMSE Hf Rank
GOA_NR -0.443 -0.357 0.521 1.241 1
BSAI_POP -0.401 -0.26 0.352 1.541 2
GOA_ATF 0.383 0.343 0.312 1.117 3
BSAI_GT 0.418 0.19 0.220 2.196 4
GOA_REBS 0.342 0.253 0.239 1.351 5
GOA_DUSKY -0.304 -0.221 0.283 1.373 6
BSAI_PCOD 0.335 0.175 0.189 1.912 7
GOA_PCOD 0.422 0.068 0.128 6.191 8
BSAI_ATKA 0.255 0.14 0.179 1.824 9
GOA_POP 0.115 0.127 0.165 0.908 10
BSAI_YFS -0.131 -0.065 0.099 2.014 11
BSAI_NRS -0.101 -0.072 0.080 1.398 12
BSAI_NR -0.083 -0.053 0.095 1.553 13
AI_POLL 0.086 0.048 0.058 1.801 14
BSAI_POLL -0.019 -0.043 0.061 0.450 15
BSAI_BSRE 0.028 0.036 0.058 0.778 16
SABLE 0.089 0.016 0.043 5.404 17
GOA_POLL 0.037 0.023 0.052 1.636 18
BSAI_FHS 0.007 0.042 0.057 0.157 19
BSAI_APL 0.018 -0.006 0.015 -3.093 20

No retro/good retroBSAI_NRS
BSAI_POLL
-0.125
-0.100
-0.075
-0.050
-0.025
-0.2
-0.1
0.0
0.1
0 10 20 30
Year
Re
lative
re
tro
sp
ective
ch
an
ge
to
te
rmin
al ye
ar
Model_Year
2011
2010
2009
2008
2007
2006
2005
2004
2003

Denied Optimal Harvest stocksBSAI_POP
GOA_NR
-0.5
-0.4
-0.3
-0.2
-0.1
-0.6
-0.4
-0.2
0 10 20 30
Year
Re
lative
re
tro
sp
ective
ch
an
ge
to
te
rmin
al ye
ar
Model_Year
2011
2010
2009
2008
2007
2006
2005
2004
2003
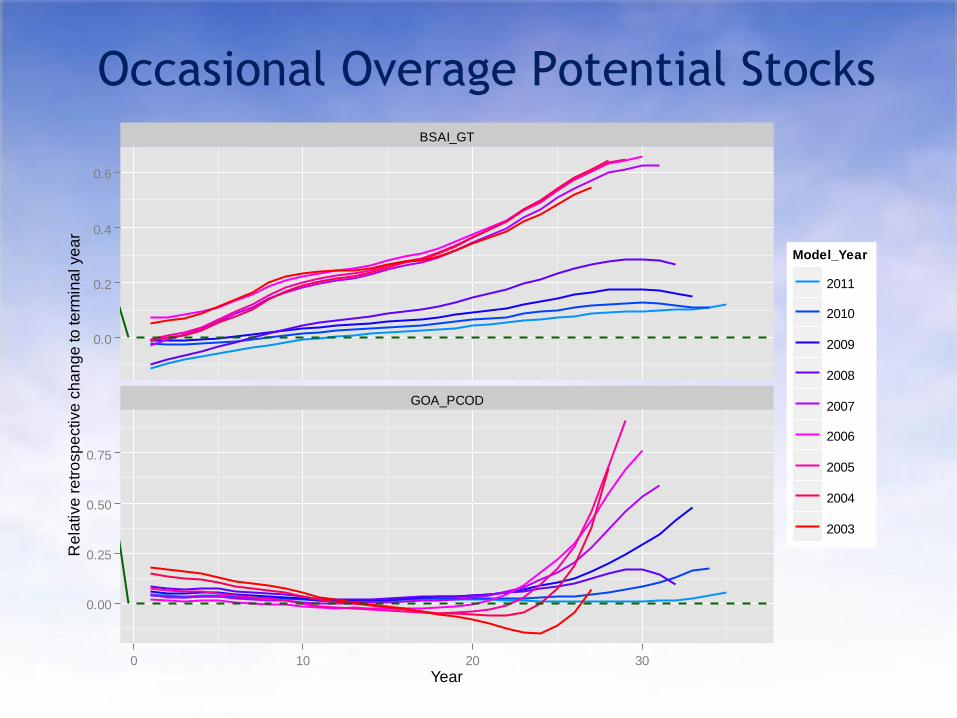
Occasional Overage Potential StocksBSAI_GT
GOA_PCOD
0.0
0.2
0.4
0.6
0.00
0.25
0.50
0.75
0 10 20 30
Year
Re
lative
re
tro
sp
ective
ch
an
ge
to
te
rmin
al ye
ar
Model_Year
2011
2010
2009
2008
2007
2006
2005
2004
2003

DOH and OOPS
Denied Optimal Harvest (DOH) Occasional Overage Potential Stock (OOPS)
Stock GOA_NR BSAI_POP G_DUSKY G_PCOD BSAI_GT GOA_ATF G_REBS BS_PCOD
Mohn's rev. r -0.44 -0.40 -0.30 0.42 0.42 0.38 0.34 0.33
Wood's Hole r -0.36 -0.26 -0.22 0.07 0.19 0.34 0.25 0.18
RMSE 0.52 0.35 0.28 0.13 0.22 0.31 0.24 0.19
Hf 1.24 1.54 1.37 6.19 2.20 1.12 1.35 1.91
Rank 1 2 6 8 4 3 5 7
Survey Selex Asymp. Asymp. Asymp. Dome Dome Asymp. Dome Dome
Software AMAK AMAK AMAK SS SS AMAK AMAK SS
Parameters 145 143 99 239 129 138 139 184
F_devs 51 53 35 - - 51 35 -
Rec_devs 81 50 51 48 72 63 56 38
Eff. Param. 13 40 13 191 57 24 48 146
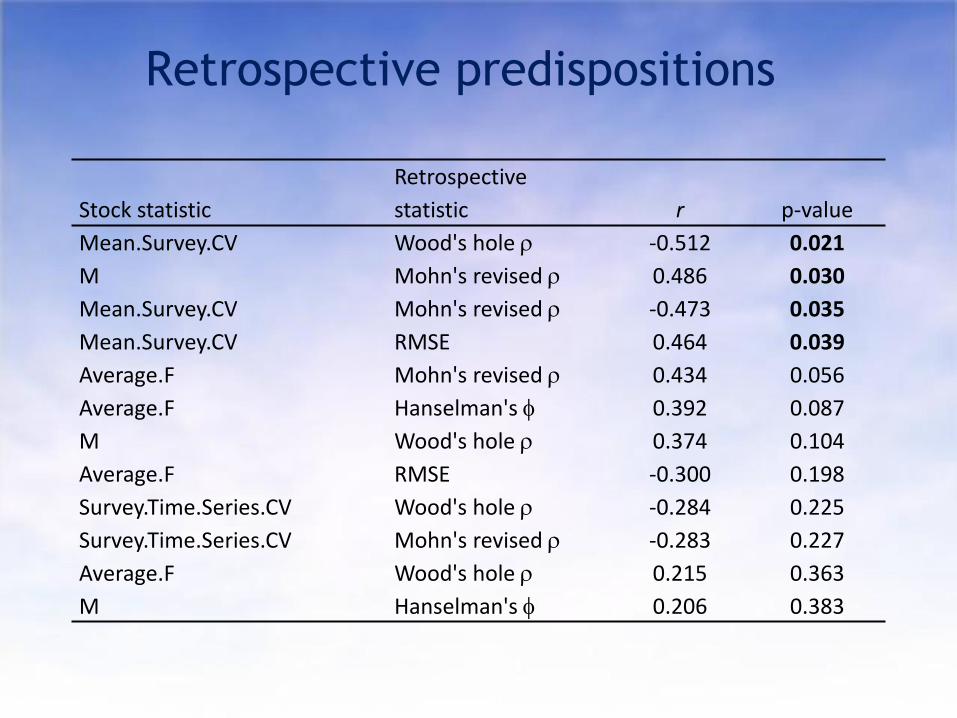
Retrospective predispositions
Stock statistic
Retrospective
statistic r p-value
Mean.Survey.CV Wood's hole r -0.512 0.021
M Mohn's revised r 0.486 0.030
Mean.Survey.CV Mohn's revised r -0.473 0.035
Mean.Survey.CV RMSE 0.464 0.039
Average.F Mohn's revised r 0.434 0.056
Average.F Hanselman's f 0.392 0.087
M Wood's hole r 0.374 0.104
Average.F RMSE -0.300 0.198
Survey.Time.Series.CV Wood's hole r -0.284 0.225
Survey.Time.Series.CV Mohn's revised r -0.283 0.227
Average.F Wood's hole r 0.215 0.363
M Hanselman's f 0.206 0.383

Conclusions
• Retrospective patterns are most likely related to:
• Survey CV
• Natural mortality
• Bias may be related to:
• Selectivity shape
• Model complexity
• Other things to examine:
• Catchability and M estimation
• Influence of prior distributions
• Ratio of F/FABC
• Number of peels, length of model time series
• MSE/Sims to look at applying corrections, e.g., 1/(1+ρ)

Recommendations I
• Always check for the presence of a retrospective pattern
• If a model exhibits a retrospective pattern, explore why
• Communicate this source of uncertainty
• There is currently not an accepted level beyond which an assessment is deemed to exhibit an importantretrospective pattern.
• A strong retrospective might be used as a reason to choose one model over another, or a recommend an ABC higher or lower than would have otherwise been

Summary
• Data-limited methods could be improved
– But we have data and we are at least dealing
with lesser stocks
– Capacity limits detailed attention to every
stock/complex
• Link to scientific uncertainty could be
improved
• Retrospective working group identifying
“assessments of concern”
Stock assessment models atAlaska Fisheries Science Center
Theme I – Part II
Alaska Fisheries
Science Center
Jim Ianelli
Alaska Fisheries Science Center
NOAA Fisheries