alamance alliance annual report 2013
DESCRIPTION
Alamance Alliance for Children and Families Annual Report for 2013TRANSCRIPT

Alamance Alliance
Final Annual Report
October 2013
Christina Christopoulos, Katie Rosanbalm & Sonya Fischer
Bridging the gap between research and public policy to improve the lives of children and families

1 www.alamancesoc.org October, 2013
Contents
I. OVERVIEW .......................................................................................................................................................... 3
II. ALAMANCE ALLIANCE FAMILIES: DEMOGRAPHIC AND DESCRIPTIVE DATA ........................................................ 3
CHILD CHARACTERISTICS .................................................................................................................................................. 4
REFERRAL SOURCE .......................................................................................................................................................... 5
AGENCY INVOLVEMENT AT INITIAL INTERVIEW (INTAKE) ......................................................................................................... 6
CHILDREN’S PRESENTING PROBLEMS .................................................................................................................................. 8
CHILDREN’S DIAGNOSES .................................................................................................................................................. 9
CUSTODY STATUS ......................................................................................................................................................... 10
CHILDREN’S LIFE EXPERIENCES ........................................................................................................................................ 11
CAREGIVER DEMOGRAPHICS ........................................................................................................................................... 13
III. CHILD AND PARENT OUTCOMES ..................................................................................................................... 14
STRENGTH-BASED ASSESSMENTS .................................................................................................................................... 14
Behavioral and Emotional Rating Scales (BERS and PreBERS) ............................................................................ 14
Devereux Early Childhood Assessment (DECA) .................................................................................................... 17
RISK-BASED ASSESSMENTS ............................................................................................................................................. 18
Child Behavioral Checklist (CBCL ages 1 ½-5) ...................................................................................................... 18
Devereux Early Childhood Assessment Behavioral Concern Subscale (DECA) ..................................................... 21
Parental Stress Index (PSI-short form) ................................................................................................................ 21
Caregiver Strain Questionnaire ........................................................................................................................... 23
EDUCATION ................................................................................................................................................................. 25
LOCATION AND TYPES OF SERVICES RECEIVED .................................................................................................................... 27
IV. GRANT-FUNDED ACTIVITIES ............................................................................................................................ 30
WORKFORCE DEVELOPMENT AND COMMUNITY EDUCATION ................................................................................................ 30
INCREDIBLE YEARS CLASSES ............................................................................................................................................ 30
CULTURAL AND LINGUISTIC COMPETENCE (CLC) ................................................................................................................ 35
FAMILY VOICE ............................................................................................................................................................. 35
SOCIAL MARKETING ...................................................................................................................................................... 36
FLEXIBLE FUNDS ........................................................................................................................................................... 37
V. CONTINUOUS QUALITY CONTROL (CQI) TO INFORM CHANGE AT THE LOCAL LEVEL ........................................ 38
MONTHLY STATUS REPORT ............................................................................................................................................ 38
QUARTERLY REPORT ..................................................................................................................................................... 38
AGENCY COLLABORATION SURVEY ................................................................................................................................... 39
How we assessed agency collaboration .............................................................................................................. 39
Results ................................................................................................................................................................. 40
Agency Directors ................................................................................................................................................. 40
Front-line staff/Supervisors ................................................................................................................................. 41
FAMILY SATISFACTION WITH SERVICES .............................................................................................................................. 42
CULTURAL COMPETENCE ............................................................................................................................................... 44
CAREGIVER SATISFACTION WITH FAMILY PARTNERS............................................................................................................. 47

2 www.alamancesoc.org October, 2013
FAMILY PARTNERS AS CASE MANAGERS ............................................................................................................................ 49
Futures Mapping ................................................................................................................................................. 49
Child and Family Team Meetings (CFTs) ............................................................................................................. 49
Other Case Management Services ...................................................................................................................... 50
Conclusions and Recommendations .................................................................................................................... 50
VI. LEVERAGING CHANGE AND SUSTAINABILITY EFFORTS IN THE PAST YEAR ...................................................... 51
VII. CONCLUDING THOUGHTS .............................................................................................................................. 52
VII. APPENDIX A ................................................................................................................................................... 55
Agency Collaboration Survey Results for Agency Directors ................................................................................ 55
IX. APPENDIX B .................................................................................................................................................... 62
Agency Collaboration Survey Results for Frontline Staff and Supervisors ........................................................... 62
X. APPENDIX C ..................................................................................................................................................... 66
Quarterly Report ................................................................................................................................................. 66

3 www.alamancesoc.org October, 2013
I. Overview
The Alamance Alliance for Children and Families is completing its fifth year. As a System
of Care for families with children birth through five, the Alliance is an integrated network of
community services and resources that work together with families and their children to
address families’ comprehensive needs. The evaluation team of the Alliance asks all enrolled
families to participate in a longitudinal study to assess whether the program is reaching its
goals. Participants in the longitudinal study are interviewed 5 times over the course of 2 years.
Using data gathered through the longitudinal study and other sources, the evaluation team
provides the Alliance governing bodies with information that helps them review services and
programs to identify what works and make improvements as needed. Armed with this
information, the Alliance leaders can then decide where to focus sustainability efforts to
continue services beyond the life of the grant.
This Annual Report is an updated version of the 2012 Annual Report. It is similar in
scope, but includes data through August 2013. It highlights demographic characteristics and
descriptive information about all of the families who have enrolled in the longitudinal study and
participated in the first interview by August 2013. It further presents child and parent outcomes
for the subset of families who have completed follow-up interviews up to 18 or 24 months after
enrollment. Finally, it describes additional programs and services funded by the grant along
with all local continuous quality improvement efforts as well as plans for sustainability.
II. Alamance Alliance Families: Demographic and Descriptive Data
Alamance County is centrally located in North Carolina with a total population of
153,920, over 11,000 of whom are children between the ages of 0 and 5. The county is
composed of urban and rural settings with a majority white population (67%) along with
significant numbers of black or African American (19%) and Latino (11%) minorities1. Consistent
with the entire state, Alamance County is experiencing a significant increase in Latino
populations. In terms of mental health, conservative projections based on national percentages
of preschool children with a clinical diagnosis related to emotional and/or behavior problems
indicate that between 1,113 and 1,699 preschool children in Alamance County have serious
mental health needs.
The following sections highlight data on children who have received services through
September 2013. The referral process officially started in September 2009. Since then:
561 children have been referred for a diagnostic evaluation
409 have had a diagnostic evaluation; 118 declined or could not be reached for an
evaluation; 20 did not meet Alliance criteria and were referred to appropriate
portals for further evaluation; 14 were pending evaluation
1 Data based on United States Census Bureau data for 2012.

4 www.alamancesoc.org October, 2013
309 children were found to be eligible for Alliance services; 100 were not eligible
because they did not get a diagnosis—these families were referred to other
services
283 children were enrolled in the Alliance; 25 declined; 1 was pending enrollment
251 were assigned a mental health provider; 32 families declined a mental health
provider, but received other services
224 families were assigned a Family Partner; 56 declined; 3 were still unsure
whether they want a family partner
Child Characteristics
Of the 283 children enrolled in the Alliance, 218 of them and their families also enrolled
in the Longitudinal Study. Table 1 shows the demographic characteristics of the children in the
Longitudinal Study during their first interview. The majority of children were male (62%) with
an average age of 3.4 years. These percentages have remained fairly consistent over the years;
however there has been an increase in the number of very young children who qualify for
services through the Alamance Alliance in the last year. The race and ethnicity of children
enrolled in the Alliance has remained consistent throughout the entire study.
Table 1
Child Characteristics (n=218)
Average Age
3.4 years old
Gender
Male 62%
Female 39%
Ages
<1 year 1%
1 year 3%
2 year 19%
3 year 26%
4 year 32%
5 year 19%
Race/Ethnicity
American Indian 1%
Black or African American
29%
Hispanic/Latino 17%
Multi-racial 7%
White 46%

5 www.alamancesoc.org October, 2013
Referral Source
Figure 1 portrays the agencies that referred the children to the Alamance Alliance over
all the years of the grant. The largest groups of children were referred by the child welfare
system, followed by physical health agencies and the school district. 2 The percentage of
families referred by different agencies or individuals has not changed in the past year. In 2012
we saw an increase in the percentage of physician and child welfare referrals, but these
percentages have remained stable this year.
Figure 1
2 Child Protective Services policy dictates that any child in foster care is automatically referred to the community
portals for an evaluation. Additionally, children in families who have a substantiated child welfare report, are in the assessment process of a report, or for whom there is documented history of child welfare involvement, domestic violence, parental substance abuse, or parent mental illness or cognitive impairment are automatically screened for social/emotional concerns using the Ages and Stages Questionnaire – Social/Emotional (ASQ-SE). Children who receive clinically significant scores on the ASQ-SE or whose social workers deem it necessary are then referred to the community portals for a diagnostic assessment.
3%
1%
1%
7%
7%
13%
13%
14%
15%
25%
0% 20% 40% 60% 80% 100%
Other
Early Care
Head Start
Preschool Special Ed
Caregiver
Early Intervention
Mental Health
School
Physical Health
Public Child Welfare
Percent of Families Referred by Each Agency
Referring Agency (n=218)

6 www.alamancesoc.org October, 2013
Agency Involvement at Initial Interview (Intake)
Figure 2 shows agencies with which the children were involved at the time of their
referral to the Alliance. Most families had a connection to a physical health care provider and
over half of the families were involved with school or preschool. Close to a third of the families
had some involvement with child welfare. Some of those families were in the midst of an
assessment or investigation that was found to be unsubstantiated, but most families involved
with child welfare were receiving services of some kind from child welfare.
Figure 2
88%
51%
32% 29%
21% 16%
8%
0%
20%
40%
60%
80%
100%
PhysicalHealth
School orPreschool
Public ChildWelfare
MentalHealth
Early Care EarlyIntervention
Other
Per
cen
t o
f C
hild
ren
Invo
lved
w
ith
Eac
h A
gen
cy
Agency Involvement at Intake (n=218)

7 www.alamancesoc.org October, 2013
Fifty-five families were directly involved with child welfare services at the time of the
Intake interview. Figure 3 shows the percent of families involved in each of 3 types of child
welfare services. This list is not inclusive of all of the types of services provided by child welfare;
it represents the types of services the children in this study were receiving. The largest group of
children was receiving court-ordered in-home services or the children were in kinship care.
Figure 3
42% 40%
16%
0%
20%
40%
60%
80%
100%
Court-ordered in-home services Court-ordered kinship careplacement
Court-ordered foster careplacement
Perc
ent
of
Fam
ilie
s In
volv
ed
in E
ach
Typ
e o
f Se
rvic
e
Types of Welfare Involvement for Children Receiving Services from Child Protective Services at Intake
(n=55)

8 www.alamancesoc.org October, 2013
Children’s Presenting Problems
Figure 4 lists the children’s presenting problems identified in the initial diagnostic
evaluation based on caregiver report and evaluator observation (only problems identified in at
least 25% of the children are included here). Over three quarters of the children were reported
to have disruptive behaviors such as aggression, severe defiance, acting out, impulsivity, and
recklessness, and almost half displayed hyperactive and attention-related problems. Eighty-four
percent of the caregivers reported “other” problems such as a family history of mental health
challenges or witnessing domestic violence, but due to the variety of those responses, they are
not included in the chart. Other challenges such as developmental disabilities, adjustment-
related problems or depression-related problems had lower occurrences and were not included
in this chart. These percentages have remained consistent over the past few years.
Figure 4
25%
31%
33%
37%
41%
48%
77%
0% 20% 40% 60% 80% 100%
Anxiety-Related Problems
Excessive Crying/Tantrums
Maltreatment
Persistent Noncompliance
Sleeping Problems
Hyperactive and Attention-Related Problems
Disruptive Behaviors in Young Children
Percent of Children
Children's Presenting Problem (n=218)

9 www.alamancesoc.org October, 2013
Children’s Diagnoses
Many of these children’s challenges are severe enough to warrant a mental health
diagnosis by a mental health professional based on the criteria laid out in the DSM-IV. Seventy-
five percent of all of the children evaluated were given a DSM-IV diagnosis. Table 2 outlines the
diagnoses the children enrolled in the longitudinal study received. Consistent with last year’s
report, about half of the children were diagnosed with Disruptive Behavior Disorder NOS (not
otherwise specified). Thirty-seven percent of the children were diagnosed with an adjustment
disorder. Note that some children have more than one diagnosis.
Table 2
Diagnosis (n=218) Percent
Disruptive Behavior Disorder NOS 53%
Adjustment Disorder (all types) 37%
ADHD 6%
Pica 5%
Anxiety Disorder 3%
Posttraumatic Stress Disorder 3%
Asperger’s Disorder, Pervasive Developmental Disorder NOS, Rett’s Disorder 2%
Learning Disorder NOS 1%
Oppositional Defiant Disorder 1%
Parent-Child Relational Problem 1%
Separation Anxiety Disorder 1%
Conduct Disorder, Childhood-Onset Type 1%
Impulse-Control Disorder NOS 1%
Physical abuse of child 1%
Transient Tic Disorder 1%

10 www.alamancesoc.org October, 2013
Custody Status
Figure 5 highlights the children’s legal custody status at Intake. Forty-four percent of the
children were in the custody of their biological mother only, while over a third of the children
were in the custody of both parents. The Department of Social Services had custody of 11% of
the children, a slight increase from last year’s report.
Figure 5
1%
2%
3%
3%
4%
11%
33%
43%
0% 20% 40% 60% 80% 100%
Friend (adult friend)
Aunt and/or Uncle
Adoptive Parent(s)
Grandparent(s)
Biological Father Only
Ward of the State
Two Parents
Biological Mother Only
Custody Status at Intake (n=218)

11 www.alamancesoc.org October, 2013
Children’s Life Experiences
Figures 6, 7, and 8 show caregiver responses to questions about the child’s living
situations and assault history. As in past reports, over 70% of the children have lived with
someone who was depressed. Approximately half of the children have recently lived with and
been cared for by someone who was depressed, and over a third of the children lived with
someone who had either a substance abuse problem, was convicted of a crime, or had a mental
illness other than depression. Over forty percent of the children have witnessed domestic
violence and 26% have experienced or witnessed physical assault.
Figure 6
72%
51% 47%
0%
20%
40%
60%
80%
100%
Ever lived with someone whowas depressed?
Lived with someone who wasdepressed in the last 6 months?
Been cared for by someone whowas depressed?
Perc
ent
of
Ch
ildre
n
Has the child...?
Children Living with and Cared for by People with Depression
(n=218)

12 www.alamancesoc.org October, 2013
Figure 7
Figure 8
35% 34% 34%
0%
20%
40%
60%
80%
100%
Lived with someone whohad a mental illness other
than depression?
Lived with someone whohad a substance abuse
problem?
Lived with someone whowas convicted of a crime?
Perc
ent
of
Ch
ildre
n
Has the child...?
Children's Living Situations to Date (n=218 )
43%
26%
9%
0%
20%
40%
60%
80%
100%
Ever witnessed domesticviolence?
Ever experienced orwitnessed physical
assault?
Ever experienced orwitnessed sexual assault?
Perc
ent
of
Ch
ildre
n
Has the child…?
Percent of Children who have Ever Witnessed or Experienced Assault (n=218)

13 www.alamancesoc.org October, 2013
Caregiver Demographics
Table 3 and Figure 9 show demographic and income data for the children’s caregivers.
The majority of the primary caregivers were female with an average age of 34. Over half of the
caregivers were white, 28% were black or African American and 13% were Hispanic or Latino.
Twenty-four percent of the caregivers never completed High School and 41% have either
attended college or have an advanced degree. Three quarters of the families have incomes less
than $25,000 a year.
Figure 9
Just under half of the caregivers reported working during the 6 months prior to the
initial interview. The main barriers to working cited by caregivers who were not working were
childcare problems, caregiver’s health problems or disability and inability to find work at the
desired salary. Thirty-six percent of the caregivers who were employed reported missing at
least one day due to their child’s emotional and behavioral problems. Twenty-five percent of
caregivers who reported missing work missed 10 days or more.
75%
17%
8%
Family/Household Income
Less Than$24,999
$25,000-$49,999
$50,000 andover
Caregiver Characteristics (n=218)
Average Age 34 years old Gender
Male 7%
Female 93%
Race/Ethnicity
Black or African American
29%
Hispanic/Latino 12%
Multi-racial 3%
White 55%
Education Level
Below High School 24%
High School or GED 35%
Some college or Associates Degree
31%
College Degree (e.g., BA, MA, PhD)
10%
Table 3

14 www.alamancesoc.org October, 2013
III. Child and Parent Outcomes
After families enroll in the Alliance they are offered individualized services and
treatment options based on what they want and need. By providing treatment to families while
their children are young, we hope to reduce or eliminate many of the behaviors and difficulties
that are contributing to stress or disharmony in the family. Caregivers are interviewed every six
months beginning at the time of their enrollment (Intake) and continuing every six months
thereafter for up to 2 years. Data from these interviews allow us to assess and analyze changes
in the child and families over time. Analyses have been run on the results of these data and
changes that are statistically significant from scores at intake (i.e., changes that are unlikely to
have occurred due to chance) are indicated by asterisks on the graphs. Because of the small
number of families who have completed assessments through 24-month follow-up, most
outcomes were assessed only through 18 months post-service initiation.
Strength-Based Assessments
Behavioral and Emotional Rating Scales (BERS and PreBERS)
The PreBERS (for preschool age) and BERS (for school age) questionnaires assess the
emotional and behavioral strengths of children. Caregivers are given the PreBERS or BERS
depending on the age of their child. For example, a caregiver may be given the PreBERS at
Intake and the BERS at 6 and 12 months once their child has reached school age. Still another
caregiver may be given the same assessment for all 5 time frames. We can only compare scores
if the caregiver has received the same assessment at all interviews because the PreBERS and
BERS have different scales. Therefore, even though 74 caregivers completed the BERS at the 18-
month interview, only 17 were given the BERS at all four interviews and could be included in
Figure 11 below. Only 2 caregivers were given then PreBERS at all four interviews; Figure 10
thus includes only information on the larger number of caregivers (n = 22) who received the
PreBERS at Intake, 6 and 12 months.
Pre-Behavioral and Emotional Rating Scale (PreBERS)
The PreBERS is a 42-item caregiver questionnaire for children ages 3 to 4 years, 11
months. It uses 4 subscales: Emotional Regulation, School Readiness, Social Confidence, and
Family Involvement. Emotional Regulation measures a child’s ability to control his or her
behavior or emotions in social situations (e.g., controls anger towards others, handles
frustration with challenging tasks). School Readiness measures skills like attention and language
that are critical for entry to a preschool environment (e.g., understands the meaning of words
similar to same-age peers, persists with tasks until completed). Social Confidence focuses on a
child’s ability to develop and maintain positive relationships with others (e.g., acknowledges
painful feelings, stands up for self). Finally, Family Involvement measures a child’s relationship
and involvement with his or her family (e.g., demonstrates a sense of belonging to family,

15 www.alamancesoc.org October, 2013
maintains positive family relationships). Higher scores indicate greater overall strengths, based
on parental perceptions.
Figure 10 shows the percent of children who scored in the average range or higher on
the PreBERS at Intake, 6 and 12 months. According to their parents, preschool children
improved significantly on emotional regulation, with smaller (non-significant) improvements on
school readiness, family involvement, and social confidence.
Figure 10
Behavioral and Emotional Rating Scale (BERS)
For children 5 and older, the 57-item BERS measures strengths in six areas:
Interpersonal Strength, Family Involvement, Intrapersonal Strength, School Functioning,
Affective Strength and Career Strength. Interpersonal Strength focuses on a child’s ability to
control his or her behavior and emotions in social situations (e.g., loses a game gracefully,
reacts to disappointment in a calm manner). Family Involvement assesses a child’s relationship
and involvement with his or her family (e.g., demonstrates a sense of belonging to family,
maintains positive family relationships). Intrapersonal Strength measures a child’s view of his or
her competence and accomplishments (e.g., is enthusiastic about life, talks about positive
aspects of life). School Functioning focuses on a child’s competence at school (e.g., pays
attention in class, attends school regularly). Finally, Affective Strength evaluates a child’s ability
to express feelings and accept affection from others (e.g., expresses affection for others, shows
36%
73% 77%
82%
68%*
77%
86%
95%
68%*
82%
91% 91%
0%
20%
40%
60%
80%
100%
EmotionalRegulation
FamilyInvolvement
School Readiness Social Confidence
Percent of Children Scoring in the Average or Above Range on the PreBERS at Intake, 6 and 12 months
(n=22)
Intake
6 month
12 month

16 www.alamancesoc.org October, 2013
concern for the feelings of others). As with the PreBERS, higher scores indicate greater
strengths.
Figure 11 shows the percent of children who scored in the average range or higher on
the BERS at Intake, 6, 12, and 18 months. Scores in all categories except School Functioning
increased between Intake and 18 months, though there is some variability in between. The
largest increases were in Interpersonal and Intrapersonal Strength. Interpersonal Strength
measures the extent to which a child can control his or her emotions and Intrapersonal
Strength measures the way a child views him or herself, so it is nice to see these increases. The
percent of children scoring in the average or above range on the School Functioning scale
decreased. This is likely due to the fact that these children have just started attending school,
so caregivers develop more realistic perceptions of their child’s school functioning and areas of
concern as the school year progresses and expectations increase.3
Figure 11
3 The n for School Functioning is 6 because 11 children were not yet in school at the time of first interview.
18%
71%
53%
83%
59%
53%*
76%
82%* 83%
76%
41%*
59%
65% 67%
88%*
59%*
76% 76%
50%
71%
0%
20%
40%
60%
80%
100%
InterpersonalStrength
FamilyInvolvement
IntrapersonalStrength
School Functioning Affective Strength
Percent of Children Scoring in the Average or Above Range on the BERS
(n=17)
Intake
6 month
12 month
18 month

17 www.alamancesoc.org October, 2013
Devereux Early Childhood Assessment (DECA)
The DECA is an early childhood assessment instrument for ages 2-5 years that measures
a child’s behavioral characteristics that act as protective factors. It consists of 3 subscales:
Attachment, Initiative, and Self-Control. The Attachment subscale measures the strength of the
attachment between the child and significant adults (i.e., the extent to which it is mutual,
strong, and long-lasting). Examples of items in the Attachment subscale are: responds positively
to adult comforting when upset, trusts familiar adults and believes what they say. The Initiative
subscale measures the child’s ability to use independent thought and actions to meet his or her
own needs (e.g., does things for himself/herself, chooses to do a task that is challenging for
him/her), and the Self-Control subscale measures the child’s ability to experience a range of
emotions and express those feelings in a socially acceptable manner (e.g., controls his/her
anger, handles frustration well). As a child gains skills, strengths and coping strategies, the
subscales scores should increase. Low scores on the Attachment, Initiative, and Self-Control
scales would be considered at risk.
Figure 12 shows the percent of children whose DECA scores were in the Average or
Above Average range on the 3 DECA subscales at the Intake and Follow-up interviews.
Statistically significant increases in the percent of children scoring in the average or above
range can be seen in the Initiative and Self-Control scales. This is very positive as it shows that
the children are becoming more independent and also expressing their emotions in more
socially acceptable ways. The decrease in the Attachment scores is somewhat concerning and
can be interpreted many ways. It is possible that as a child’s self-control and initiative increase
the child seems less attached because the child is relying less on significant adults. Another
possibility is that the caregivers presented an overly positive view of their child’s attachment
relationships with significant adults at the beginning, and as they got more informed about
child development, their view of those relationships became more realistic. Finally, it is also
possible that the DECA is not an accurate measure of attachment for this particular population.
Notably, this pattern of decreasing scores on the attachment scale was also evident in other
2008 grantees when we examined just their birth through five populations.

18 www.alamancesoc.org October, 2013
Figure 12
Risk-Based Assessments
Child Behavioral Checklist (CBCL ages 1 ½-5)
The CBCL is a 100-question interview administered to the caregiver that measures
behavioral and emotional difficulties in children ages 1 ½ through 5 years. Caregivers rate
statements on a 3-point scale indicating the extent to which a statement is very true, somewhat
true, or not true. The results can be grouped into two broad categories, Internalizing and
Externalizing Behaviors, and into 7 subscales. The Internalizing Behavior scale measures
concerns such as anxiety, depression, social withdrawal, somatic symptoms and emotional
reactivity. Examples of questions include “headaches without medical cause,” “clings to adults
or too dependent” and “doesn’t answer when people talk to him.” The Externalizing Behavior
scale measures behaviors that are more visible such as aggression and attention problems.
Examples of questions include “gets in many fights,” “angry moods,” and “can’t concentrate.”
Scores above a certain criterion in each scale are considered to be in the clinical range.
44% 48%
26%
48%
63%
52%* 48%
70%*
56%*
33%
70%*
63%*
0%
20%
40%
60%
80%
100%
Attachment Initiative Self-Control
Percent of Children Displaying Average or Above Average DECA Scores at Intake and Follow-up Interviews
(n=27)
Intake
6 month
12 month
18 month
19 www.alamancesoc.org October, 2013
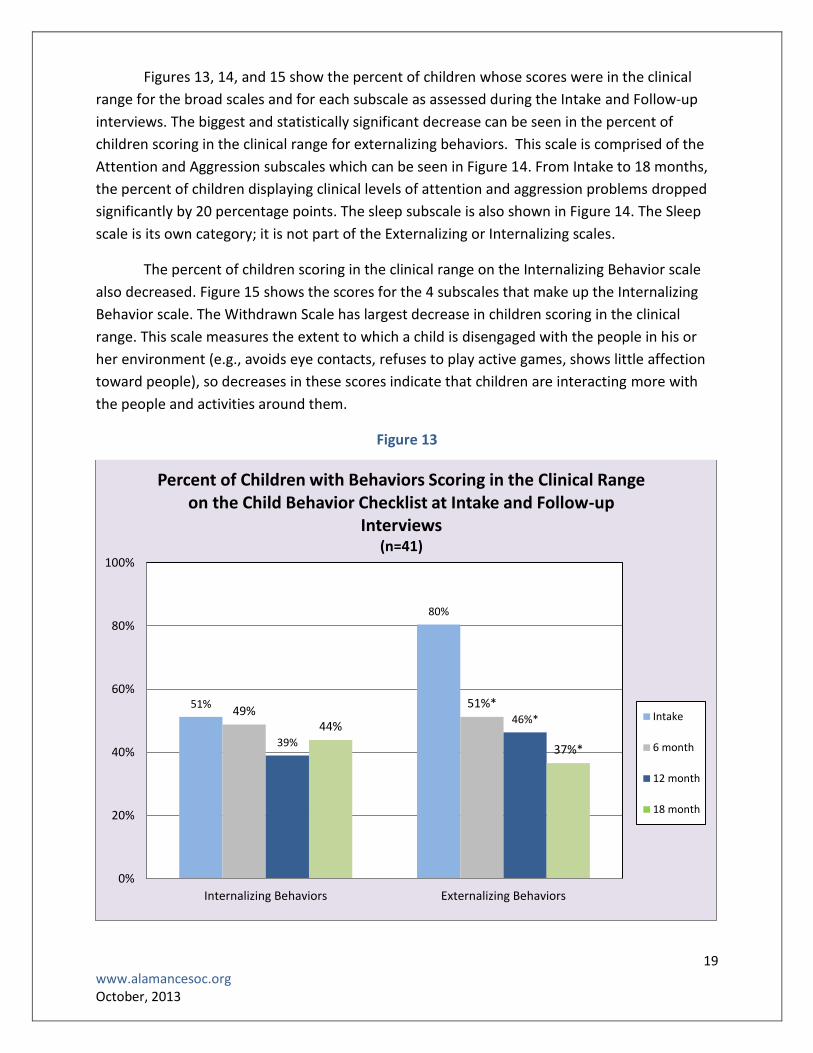
Figures 13, 14, and 15 show the percent of children whose scores were in the clinical
range for the broad scales and for each subscale as assessed during the Intake and Follow-up
interviews. The biggest and statistically significant decrease can be seen in the percent of
children scoring in the clinical range for externalizing behaviors. This scale is comprised of the
Attention and Aggression subscales which can be seen in Figure 14. From Intake to 18 months,
the percent of children displaying clinical levels of attention and aggression problems dropped
significantly by 20 percentage points. The sleep subscale is also shown in Figure 14. The Sleep
scale is its own category; it is not part of the Externalizing or Internalizing scales.
The percent of children scoring in the clinical range on the Internalizing Behavior scale
also decreased. Figure 15 shows the scores for the 4 subscales that make up the Internalizing
Behavior scale. The Withdrawn Scale has largest decrease in children scoring in the clinical
range. This scale measures the extent to which a child is disengaged with the people in his or
her environment (e.g., avoids eye contacts, refuses to play active games, shows little affection
toward people), so decreases in these scores indicate that children are interacting more with
the people and activities around them.
Figure 13
51%
80%
49% 51%*
39%
46%* 44%
37%*
0%
20%
40%
60%
80%
100%
Internalizing Behaviors Externalizing Behaviors
Percent of Children with Behaviors Scoring in the Clinical Range on the Child Behavior Checklist at Intake and Follow-up
Interviews (n=41)
Intake
6 month
12 month
18 month

20 www.alamancesoc.org October, 2013
Figure 14
Figure 15
37% 37%
49%
20%* 22%* 27%*
15%* 17%*
32%*
22% 17%*
29%*
0%
20%
40%
60%
80%
100%
Sleep Problems Attention Problems Aggression Problems
Percent of Children Scoring in the Clinical Range on the Externalizing Behavior and Sleep Subscales
(n=41)
Intake
6 month
12 month
18 month
24%
15% 12%
37%
29%
12% 17%
32%
22%
12%
5%
22%* 20%
10% 15%
27%
0%
20%
40%
60%
80%
100%
Emotionally Reactive Anxious/Depressed Somatic Complaints Withdrawn
Percent of Children Scoring in the Clinical Range on the Internalizing Behavior Subscales
(n=41)
Intake
6 month
12 month
18 month

21 www.alamancesoc.org October, 2013
Devereux Early Childhood Assessment Behavioral Concern Subscale (DECA)
In addition to the 3 strength-based subscales discussed earlier, the DECA also has a
Behavioral Concern subscale that indicates the degree to which a child is displaying challenging
behaviors (e.g., has temper tantrums, has a short attention span). A higher Behavioral Concern
score indicates that the child is exhibiting more troubling behaviors than a child with a lower
score. Thus, as a child gains skills, strengths, and coping strategies, the Behavioral Concern
score should decrease. At Intake, 96% of the children received above-average Behavioral
Concern scores, whereas at the 18-month interview, 85% of the children displayed above-
average Behavioral Concern scores. We hope to see this decrease continue.
Parental Stress Index ( PSI-short form)
The Parental Stress Index (PSI/SF) is a 36-item caregiver questionnaire designed to
measure areas of stress in the parent-child system. Results are given in terms of 3 subscale
scores (Parental Distress, Parent-Child Dysfunctional Interaction, Difficult Child) that indicate
which parent or child characteristics contribute to stress in the family. The Parental Distress
scale measures how the parent feels as a function of personal factors directly related to
parenting, including depression (e.g., having a child has caused more problems than I expected
in my relationship with my spouse, I don’t enjoy things as I used to). The Parent-Child
Dysfunctional Interaction scale measures the strength of the relationship between the parent
and child (e.g., my child rarely does things for me that make me feel good, my child is not able
to do as much as I expected). It identifies the extent to which the parent perceives that the
child is meeting his or her expectations and whether the interactions between the child and
parent are positive or strained. High scores on this scale indicate that the parent-child bond has
not been adequately established or is threatened. The Difficult Child scale measure child
characteristics such as being overly demanding, impatient or moody that make them easier or
more difficult to manage (e.g., my child generally wakes up in a bad mood, there are some
things my child does that bother me a lot). Higher scores on this scale indicate that the child’s
temperament is more challenging than a child with a lower score.
Figure 16 compares the percentage of caregivers who reported clinically significant
stress levels at Intake and Follow-up interviews. Results are given in terms of 3 subscale scores
that indicate which parent or child characteristics contribute to stress in the family. Decreases
in the percent of caregivers reporting clinically significant stress levels at Intake and 18 months
later were seen in each subscale, with a significant decrease in the Difficult Child subscale. The
Difficult Child scale measures child characteristics that contribute to stress in the parent-child
relationship, so decreases in this scale are likely due to changes in the child’s behavior or in
parental expectations for age-appropriate behavior. There was a slight decrease in the Parent-
Child Dysfunctional Interactions subscale, suggesting that the parent-child relationship may be
getting stronger. Finally, the Parental Distress scale slightly decreased. This particular subscale
had not improved in the previous years, a finding that was not particularly surprising given that
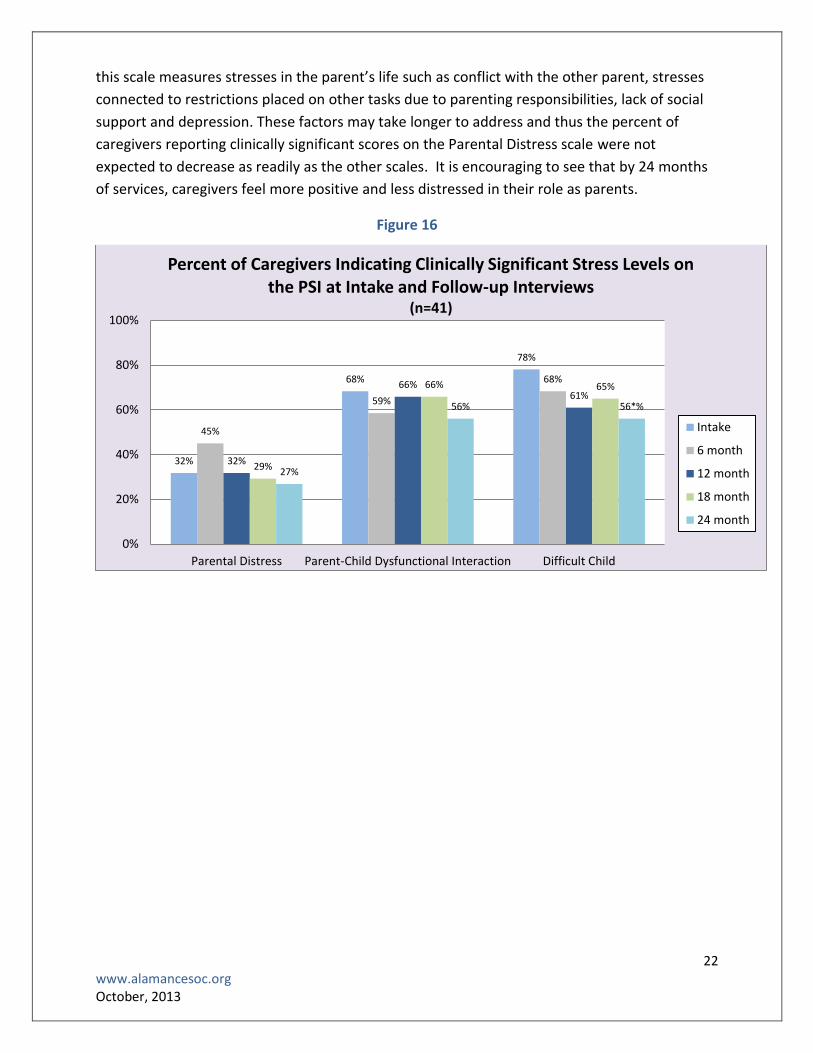
22 www.alamancesoc.org October, 2013
this scale measures stresses in the parent’s life such as conflict with the other parent, stresses
connected to restrictions placed on other tasks due to parenting responsibilities, lack of social
support and depression. These factors may take longer to address and thus the percent of
caregivers reporting clinically significant scores on the Parental Distress scale were not
expected to decrease as readily as the other scales. It is encouraging to see that by 24 months
of services, caregivers feel more positive and less distressed in their role as parents.
Figure 16
32%
68%
78%
45%
59%
68%
32%
66% 61%
29%
66% 65%
27%
56% 56*%
0%
20%
40%
60%
80%
100%
Parental Distress Parent-Child Dysfunctional Interaction Difficult Child
Percent of Caregivers Indicating Clinically Significant Stress Levels on the PSI at Intake and Follow-up Interviews
(n=41)
Intake
6 month
12 month
18 month
24 month

23 www.alamancesoc.org October, 2013
Caregiver Strain Questionnaire
The Caregiver Strain Questionnaire (CGSQ) is a 21-item survey designed to assess the
extent to which the stress of raising a child with social and emotional difficulties is affecting the
caregiver. The CGSQ is comprised of 3 subscales (Objective Strain, Subjective Externalized
Strain, and Subjective Internalized Strain) with mean scores in each ranging from 0-5. Objective
Strain measures observable disruptions in family and community life such as lost work time,
financial strain or interruption of personal time. Examples of questions include: “How much of a
problem was missing work due to your child’s emotional or behavioral problems?” and “How
much of a problem was disruption of your family’s social activities resulting from your child’s
emotional or behavioral problem?” Subjective Externalized Strain measures negative feelings
such as anger, embarrassment or resentment. Examples of questions include: “How angry did
you feel toward your child?” and “How embarrassed did you feel about your child’s emotional
or behavioral problems?” Subjective Internalized Strain measures negative feelings the
caregiver may have such as worry, guilt or fatigue. Examples of these types of questions
include: “How worried did you feel about your child’s future?” and “How sad or unhappy did
you feel as a result of your child’s emotional or behavioral problems?”

24 www.alamancesoc.org October, 2013
Figure 17 shows the mean caregiver scores on the 3 CGSQ subscales during the Intake
and Follow-up interviews. Caregiver stress levels decreased across all subscales with the largest
decrease in Subjective Internalized Strain. Overall, these results support those seen on the PSI,
all of which indicate a steady decrease in parental stress. However, it is worth noting that the
lowest score on the Subjective Internalized scale is still higher than the highest scores on the
other 2 scales. This is consistent with past reports and suggests that the stress of worrying or
feeling guilty about a child can cause more strain than other factors such as anger towards the
child or disruption of family life due to a child’s behavior.
Figure 17
2.0 2.0
3.0
1.8 1.9
2.7*
1.7* 1.7*
2.6*
1.8 1.8
2.5*
1.7* 1.6*
2.2*
0.0
1.0
2.0
3.0
4.0
5.0
Objective Strain Subjective Externalized Strain Subjective Internalized Strain
Mean Scores on the Caregiver Strain Questionnaire at Intake and Follow-up Interviews
(n=41)
Intake
6 month
12 month
18 month
24 month

25 www.alamancesoc.org October, 2013
Education
Educational placements for the children who were in school at the time of each
interview are shown in Table 4. In the 6 months prior to Intake, over half of the children
attending school were in preschool and almost a quarter of the children were in a Head Start
program. As would be expected, as the children got older, the percentage of children attending
regular public school increased and the percentage of children in preschool decreased.
Table 4
Educational Placements for Children
Placement Intake (n=91)
6 Months (n=106)
12 Months (n=93)
18 Months (n=63)
24 Months (n=44)
Preschool 51% 37% 24% 14% 11%
Regular Public Day School 28% 43% 63% 75% 75%
Head Start 24% 18% 8% 6% 9%
Regular Private Day/Boarding School 2% 2% 4% 2% 5%
Home School 0% 0% 2% 2% 0%
Alternative/Special Day School 0% 0% 0% 2% 0%
Table 5 shows the percent of children suspended or expelled in the 6 months prior to
the Intake and Follow-up interviews. This table represents all of the children who were
attending school (including any of the educational placements listed in Table 4) at each time
point. Prior to the Intake interview, 20% of the children attending school had been suspended,
expelled or both. Prior to the 24-month interview, 7% of the children attending school had
been suspended and none had been expelled.
Table 5
Percent of Children with Disciplinary Actions Disciplinary Action Intake
(n=88)
6 Months (n=103)
12 Months (n=92)
18 Months (n=62)
24 Months (n=43)
Suspended 10% 7% 4% 10% 7%
Expelled 5% 1% 0% 0% 0%
Suspended AND expelled 5% 0% 1% 2% 0%
In the 6 months prior to the Intake and Follow-up interviews, between 18 and 30
children were reported to have Individual Education Plans (IEP). Table 6 shows the primary

26 www.alamancesoc.org October, 2013
reasons these children had IEPs and the percent of children in each category. The majority of
children had IEPs for behavioral/emotional difficulties, followed by speech impairments,
developmental disabilities, and learning disabilities.
Table 6
Reasons for Individualized Education Plan Reason Intake
(n=23)
6 Months (n=30)
12 Months (n=28)
18 Months (n=20)
24 Months (n=18)
Behavioral and/or Emotional Problems
39% 37% 36% 55% 56%
Speech impairment 30% 23% 18% 5% 6%
Developmental Disability
17% 20% 21% 25% 11%
Learning Disability 9% 17% 21% 15% 11%
Vision and/or Hearing Impairment
4% 0% 0% 0% 11%
Physical Disability 0% 3% 4% 0% 6%

27 www.alamancesoc.org October, 2013
Location and Types of Services Received
Families were asked about the types and locations of services they received. Figures 18-
20 compare information about services received in the 6 months prior to the Intake and Follow-
up interviews. Figure 18 shows the location where 15% or more families reported receiving
services in the 6 months prior to each interview. The percentage of children who received
services at home decreased while the percentage of children who received services at school
increased. This may reflect a transition from receiving intense mental health services at home
to receiving less intensive services such as speech therapy or occupational therapy at school.
The percentage of families receiving services in a mental health clinic or private practice
decreased slightly.
Figure 18
59%
22%
83%
51%
34%
71%
51%
44%
68%
56%
49%
41% 46% 44%
29%
0%
20%
40%
60%
80%
100%
Mental Health Clinic orPrivate Practice
School Home
Perc
ent
of
Fam
ilie
s R
ecei
vin
g Se
rvic
es
in E
ach
Lo
cati
on
Where Families Received Services (n=41)
Intake
6 month
12 month
18 month
24 month

28 www.alamancesoc.org October, 2013
Figures 19 and 20 show the types of therapeutic and support services the families
received in the 6 months prior to each interview. The percent of families receiving most types
of support decreased between the Intake and 24-month interview. These results are not
surprising because therapy is meant to be short-term. However, the percent of families
receiving school-based support, afterschool services and medication monitoring increased.
Many children are identified as needing school-related services once they officially enter the
school system, so this increase is to be expected. The percentage of children receiving
medication monitoring may have increased because more children are identified as needing
medication as they get older and begin school. It is also worth noting the decrease in informal
support. Ideally as their children’s behavior improves, families learn to rely more on informal
supports and less on therapists or Family Partners, but the data indicate that informal support
is decreasing along with therapeutic support. This may reflect less need for any kind of
assistance because the children are easier to manage and also because they are in school and
caregivers require less hands-on support than when the children were younger.
Figure 19
95%
5%
66%
12%
32%
15%
78%
15%
22%
71%
7%
37% 34%
56%
2%
39% 37%
46%
5%
0%
20%
40%
60%
80%
100%
Assessment/Evaluation
MedicationMonitoring
Individual Therapy Family Therapy
Per
cen
t o
f Fa
mili
es R
ecei
vin
g E
ach
Typ
e o
f Se
rvic
e
Type of Therapeutic Service Received (n=41)
Intake
6 month
12 month
18 month
24 month

29 www.alamancesoc.org October, 2013
Figure 20
20%
59%
12%
5%
73%
29%
2%
56%
22%
5%
37% 41%
0%
20%
40%
60%
80%
100%
Case Management Family Support AfterschoolPrograms
Flexible Funds Informal Support School-based
Per
cen
t o
f Fa
mili
es R
ecei
vin
g E
ach
Typ
e o
f Se
rvic
e
Types of Support Services Received (n=41)
Intake
6 month
12 month
18 month
24 month

30 www.alamancesoc.org October, 2013
IV. Grant-funded Activities
Workforce Development and Community Education
Workforce development trainings continued in the fifth year of the grant, including basic
system of care training and the effects of trauma on brain development for new staff in all
child-serving agencies, as well as more in depth seminars. Examples of the trainings offered are
listed below:
Introduction to Alamance Alliance 101
System of Care Modules 1 & 2
What’s Up with Domestic Violence?
Early Childhood Mental Health: Brain Development, Child Development, and the Effects
of Trauma on Both
How to Use Family Strengths in the Child and Family Team Plan
Serving Latinos
Fetal Alcohol Spectrum Syndrome
Developing and Using Natural Supports
Child and Family Team 1
Additionally, through the training efforts of the Alliance and Project LAUNCH, Alamance
County currently has clinicians trained in the following five evidence-based practices: Child
Parent Psychotherapy (CPP), Parent-Child Interaction Therapy (PCIT), Trauma-Focused Cognitive
Behavioral Therapy (TF-CBT), Triple P Levels 3 and 4, and Attachment and Biobehavioral Catch-
Up (ABC). The Attachment and Biobehavioral Catch-Up (ABC) Learning Collaborative, financed
by Project LAUNCH, has supported training for 6 providers who will be ready to serve families in
Alamance County by the end of October 2013. ABC provides a critical service for very young
children (6 to 24 months) who have suffered as a result of attachment disruptions from their
caregivers.
Incredible Years Classes
The Alamance Alliance has been providing financial support to the Alamance
Partnership for Children (APC) so that the APC can deliver Incredible Years (IY) classes for
members of the Alamance community. The IY program is an evidence-based series of weekly
parenting skills classes for caregivers of high-risk children ages birth through 5 years old. As of
May 2013, the APC has conducted 17 Incredible Years parenting classes supported by the
Alliance. Two IY classes were specifically for caregivers of infants and toddlers, four classes
were conducted in Spanish for caregivers of preschool-aged children, one class for caregivers of
preschool-aged children was conducted in Spanish and English, and the remaining classes were
conducted in English for caregivers of children ages 3-5 years old. A total of 159 families have
enrolled in these Incredible Years classes and filled out the Enrollment and Demographic

31 www.alamancesoc.org October, 2013
Information Form that provided us with the information presented below. In many cases more
than one caregiver per family participated in the class, but we only counted one member per
family.
Table 8 highlights some demographic information about the caregivers’ children. The
average age of the children is 3.3 years old, although the percent of 0- to 2-year-olds increased
this year. This is due to the addition of a second class specifically for caregivers of very young
children.
Table 8
Demographics (n=159) Gender Percent
Male 61%
Female 39%
Average age 3.3 years old
Age Group
0-yr 3%
1-yr 6%
2-yr 15%
3-yr 32%
4-yr 25%
5-yr 19%
6-yr 1%
Race/Ethnicity Asian 1%
Black or African American 20%
Hispanic/Latino 35%
Multi-Racial 8%
White 36%
Figure 28 shows the concerns or problems that caregivers reported at the start of the IY
classes. This table represents the problems reported in over 10% of the children, and these
percentages are very similar to those presented in the 2012 report. Note that one child can
present with more than one difficulty or challenge. Almost half of the caregivers reported
difficulties with disruptive behaviors in their child, 30% reported problems with excessive crying
and tantrums or hyperactivity and attention difficulties. Close to half of the caregivers checked
“other” as a reason they were interested in the IY classes. Of those families, 42 were seeking
more information about child development, parenting strategies, and behavior management
and 13 reported that their child had experienced a traumatic event such as witnessing domestic
violence or the incarceration of a parent.

32 www.alamancesoc.org October, 2013
Figure 28
Forty-four caregivers involved in IY classes reported that their child had received a
formal mental health diagnosis. Twenty-nine of these children received their diagnoses from a
child psychologist, 10 from a licensed mental health practitioner, 2 from a primary care
provider, 1 from a child psychiatrist, 1 from a licensed physical health practitioner and one
person left that answer blank. Table 9 shows the diagnoses the children received and the
percent of children who received each diagnosis. Note that these percentages are based on the
44 children who had received a diagnosis and that 4 children have more than one diagnosis. In
the June 2011 report, 15% of the children had diagnoses, compared to 26% in 2012 and 28%
this year. This increase occurred because more families already enrolled in the Alliance with
established child diagnoses were referred to and participated in IY classes, as compared to
previous years.
49%
12%
14%
25%
30%
30%
44%
0% 20% 40% 60% 80% 100%
Other
Anxiety-Related Problems
Sleeping Problems
Persistent Noncompliance
Hyperactive and Attention-Related Problems
Excessive Crying/Tantrums
Disruptive Behaviors in Young Children
Children's Presenting Problems (n=159)

33 www.alamancesoc.org October, 2013
Table 9
Diagnosis (n=44) Percent
Disruptive Behavior Disorder Not Otherwise Specified (NOS) 48%
Adjustment Disorder (all types) 30%
Attention Deficit/Hyperactivity Disorder 7%
Autistic Disorder 5%
Posttraumatic Stress Disorder 5%
Pica 2%
Unknown 14%
Figure 29 shows the agencies or people that referred the families to the IY classes. The
largest number of referrals came from the child’s school or daycare, followed by the caregiver
and Alamance Partnership for Children. Nine percent of the caregivers found out about IY
classes through “other” means. Among those, 8 people were referred by community agencies
or service providers, four people saw flyers in local establishments, and 2 were referred by
friends.
Figure 29
9%
1%
2%
7%
5%
10%
15%
15%
28%
0% 20% 40% 60% 80% 100%
Other
Probation
Mental Health
Early Intervention Program
Physical Health
Public Child Welfare
Alamance Partnership
Caregiver
School or Daycare
Referring Agency (n=159)
34 www.alamancesoc.org October, 2013
Other Important Characteristics of these Children and their Families
Many of the caregivers reported that their child had been involved with various
educational, social, mental or physical health agencies at the time of the IY classes. (Please note
that these are based on answers provided directly by the caregivers.)
55% had physical health care4
65% of the children attended daycare, preschool or regular school 5
14% received early intervention or preschool special educational services
8% had mental health care
71% were on Medicaid
3% received SSI benefits
2% were on Temporary Assistance for Needy Families (TANF)
24% had private insurance
11% were involved with child welfare services, half of these children were in court-
ordered kinship care.
Summary
In the last 4 years that the Alamance Partnership for Children has received financial
support from the Alamance Alliance to conduct IY classes, 17 classes have been completed
successfully. Families served by the APC represent a broad spectrum in terms of age, race, living
situations, and income. Community awareness of IY classes through the APC continues to
increase and more referrals are coming from a variety of sources. In fact, 15% of referrals came
from the caregivers themselves, suggesting that word of mouth about IY classes is also
increasing. In the past year, the Alamance Partnership secured funding for IY Parent classes
through another source which reduced the funds that the APC needed from the Alliance to
provide IY Parents. The Alliance was then able to allocate more funding to the Alamance
Partnership’s Parents as Teacher program, which allowed them to hire another Parents as
Teacher provider. Parents as Teachers is a promising practice that provides education and
support for parents of children birth to kindergarten through home visiting by certified parent
educators. Incredible Years - Teacher classes, which were previously funded by the Alliance,
were not funded this year because the class is now offered by the Alamance Community
College.
4 Questions on physical health care are based on a caregiver-completed questionnaire. We suspect these numbers
would be higher if the questions were asked in an interview format. 5 This is a 5% decrease from last year and is most likely due to the addition of a second Infant/Toddler class.

35 www.alamancesoc.org October, 2013
Cultural and Linguistic Competence (CLC)
The Cultural and Linguistic Competence Committee continued to play a central role in
the Alamance Alliance System of Care in its fifth year. The CLC trained an additional 277
individuals in a variety of topics, including:
Communication and the Cultural Lens
It's My Story and I’m Sticking To It!
Diversity: Why is it Complex?
Working with Difficult Parents No Matter What
Cultural Competence: Using Family Strengths
The Alliance also continued support of a Cultural Broker who serves as a liaison with the Latino
community. The Cultural Broker has provided outreach services through the faith-based
community and has facilitated a Hispanic Women’s Support Group, covering topics like breast
and cervical cancer, gang prevention and child development topics. She also facilitated school
registration of Latino children to an Alamance County elementary school that serves a
substantial number of this population. In November of 2012, a Professional Learning
Community called the AlaScene was created. Its members are professionals from a variety of
child-serving agencies. The purpose of the group is to allow the members to learn about
culturally competent service delivery, with the ultimate goal of providing workforce
development opportunities and support around culturally competent services in their own
organizations. Finally, the Cultural and Linguistic Competence Committee has created two
online cultural competence training modules that will soon be available to the entire state.
Family Voice
Family Partners have played a significant role in the Alliance since its inception. The
North Carolina Families United Executive Director (the state agency providing TA around family
voice to the Alliance) and the Lead Family Partner Coordinator both sit on the NC State
Collaborative, and the Lead Family Partner Coordinator also sits on both governing bodies of
the Alliance: the Children’s Executive Oversight Committee and the Local Interagency
Coordinating Council. Furthermore, Family Partners continue to sit on all the subcommittees of
the Alliance. Sustainability for Family Partners continues to be an issue and discussions have
been under way with Cardinal Innovations (our local Managed Care Organization) to explore
possible options for funding Family Partners.
The Family Involvement Committee was created to help families get to know and
support each other. The Family Involvement Committee has organized Family Cafés, gatherings

36 www.alamancesoc.org October, 2013
where families can meet, attend discussion/support groups on a variety of parenting topics,
and children can have an opportunity to play and socialize with each other. This past year the
Family Involvement Committee organized the Cookies with Santa Family Café with 18 adults
and 34 children participating and a Spring Café which attracted 34 adults and 62 children.
Furthermore, Family Partners are regular co-trainers in early childhood mental health
seminars, system of care and child and family team trainings, and two of them are nationally
certified parent support providers. They have co-presented at national conferences such as the
School-Based Mental Health Conference held in Utah this past year, and many local venues as
well. A new bilingual Family Partner was hired this year to provide further support to our
Hispanic families.
Social Marketing
This year the Alliance broadened its efforts in awareness and outreach to the larger
community by:
merging social marketing and outreach with the Alamance Partnership for Children,
planning different activities in which the community could participate for Children’s
Mental Health Awareness Week,
broadly disseminating comprehensive information about early childhood mental
health and Alliance work, and
premiering the documentary Behind the Seen, a film about four Alamance County
families struggling with their young children’s social emotional issues, on May 9th,
Children’s Mental Health Awareness Day.
The Alamance Alliance for Children and Families merged its newsletter with that of the
Alamance Partnership for Children in the fall of 2012, thereby increasing the distribution of its
newsletter fourfold. This enhanced the opportunities for outreach events, collaborations,
access to other mailing lists, etc. All of the events that the Partnership was involved in became
an opportunity to share information about the Alliance as well.
Children’s Mental Health Awareness Week events included a Flash Mob and a giant
Chutes and Ladders game focused on the first 2000 days of a child’s life and the state of young
children in North Carolina. In collaboration with Project LAUNCH, an eight-page newspaper
insert, “Give Your Child the Best Beginning,” discussing very young children’s social-emotional
health was circulated to 25,000 people. Finally, the Behind the Seen documentary premiered in
May. Behind the Seen was the culmination of a project that focused on the experiences of four
Alamance County families as seen through the eyes of sixteen artists that worked with them
over a period of time. The resulting art show traveled around the state this year to more than
five venues sharing the message of trauma and how it affects young children.
37 www.alamancesoc.org October, 2013
The Alliance is continuing to use web- and email-based marketing to reach more people.
iContact messages about child development, community trainings, breaking early childhood
news, etc., were sent bimonthly and the contact list more than doubled from last year. The
Alliance website (http://www.alamancesoc.org) continues to be a focal place where community
members can learn about the Alamance County System of Care.
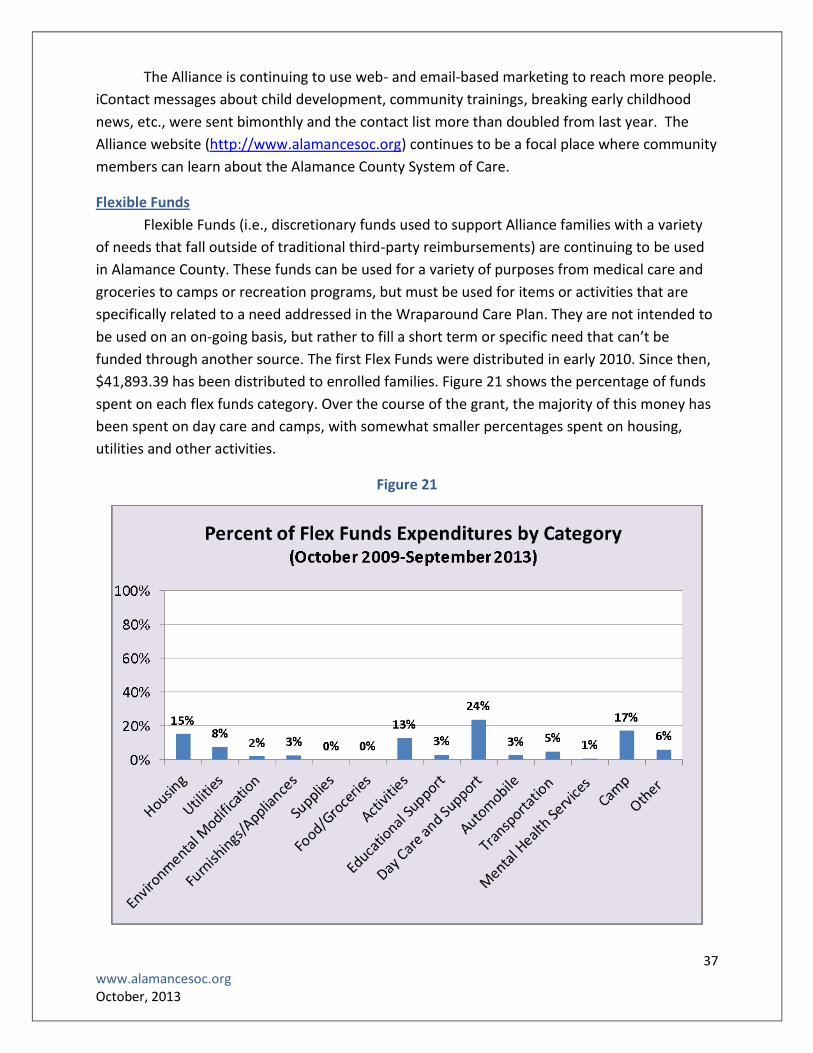
Flexible Funds
Flexible Funds (i.e., discretionary funds used to support Alliance families with a variety
of needs that fall outside of traditional third-party reimbursements) are continuing to be used
in Alamance County. These funds can be used for a variety of purposes from medical care and
groceries to camps or recreation programs, but must be used for items or activities that are
specifically related to a need addressed in the Wraparound Care Plan. They are not intended to
be used on an on-going basis, but rather to fill a short term or specific need that can’t be
funded through another source. The first Flex Funds were distributed in early 2010. Since then,
$41,893.39 has been distributed to enrolled families. Figure 21 shows the percentage of funds
spent on each flex funds category. Over the course of the grant, the majority of this money has
been spent on day care and camps, with somewhat smaller percentages spent on housing,
utilities and other activities.
Figure 21
38 www.alamancesoc.org October, 2013
V. Continuous Quality Control (CQI) to Inform Change at the Local Level
In an effort to provide feedback for quality improvement purposes, our local evaluation
focused on multiple components: 1) a monthly status report, 2) Quarterly Report, 3) an agency
collaboration survey, 4) information about family partner services, cultural competence of and
satisfaction with services, and 5) a review of Family Partner charts to examine their efforts to
assume care coordination for the families with whom they worked.
Monthly Status Report
The monthly status report is a 2-page summary describing Alliance activities in terms of
children served. The report provides the Project team with a monthly cumulative picture of:
a. Cumulative numbers of completed, ineligible, pending, and declined referrals, diagnostic
evaluations, enrollments, children assigned mental health providers and children assigned
family partners
b. Month by month information on number of DSS referrals, completed diagnostic
evaluations, and number of enrollments
c. Number of disenrolled families and reasons thereof
d. Number and percent of intake, 6-month, 12-month, 18-month and 24-month interviews
completed for the Longitudinal Study
e. Demographic and descriptive information of all children ever enrolled or ineligible
f. A breakdown of the number of children and families served with each support provider in
the System of Care
The monthly report gives the Alliance staff members an opportunity to review their
progress from a larger perspective. It is often hard to see the big picture when one is dealing
with the day to day activities of a project. The monthly report gives the staff members a chance
to analyze the numbers to spot trends, see where there might be problems or concerns, and
make sure everything is progressing as planned. For example, based on the monthly status
report we decided to stay vigilant about the number of diagnostic evaluations that are still
pending in case we needed to add another provider to do diagnostic evaluations.
Quarterly Report
The Quarterly Report was added to the CQI process as a way to track in a single
document specific indicators across all Alliance subcommittees: Training, Social Marketing,
Services and Supports, and Evaluation. Examples of items tracked include the number of
trainings that have occurred, the number of people or agencies attending those trainings, the
number and type of social marketing events and publications, the number of hits on specific

39 www.alamancesoc.org October, 2013
pages of the Alamance Alliance website, and the referral sources of children referred to the
Alliance for an evaluation. The report is reviewed by the Evaluation Committee so everyone can
evaluate trends, discuss concerns and propose new targets or changes in process as needed. An
example of the Quarterly Report can be found in Appendix C.
Agency Collaboration Survey
One of the major tenets of Systems of Care is interagency collaboration. Collaboration
focuses on efficient and effective coordination of services provided by all agencies that serve
families and children whose needs cross multiple agencies. The goal of interagency
collaboration is to overcome silos, discrete or duplicative services, categorical funding and
individual agencies’ unique mandates in an attempt to create a safety net of well-coordinated
services for each family. Given its importance in a System of Care, we decided to examine the
collaboration of child-serving agencies as part of our Continuous Quality Improvement Plan. We
assessed agency collaboration in 2010 and again in 2012. We hoped to see changes in
collaboration over time. The 2012 Annual Report described the 2010 Agency Collaboration
report in detail. This report will compare the results of the 2010 survey with the results of the
2012 survey.
How we assessed agency collaboration
In 2010 and 2012, we sent an electronic survey to each of the Directors and frontline
staff and supervisors of 14 family-serving agencies. Respondents were asked to report on
several collaborative activities with each of the other agencies included in the survey.
Specifically, with regard to each other agency listed, frontline staff and supervisors were asked
whether they:
Send and receive referrals
Talk and problem solve about shared cases
Jointly develop plans of care
Jointly participate in Child and Family Teams (CFTs)
Use parental consent to share information
Co-locate services
Coordinate/combine training events
Serve on community nonprofit partner boards together
The Directors were asked about four additional types of collaboration more likely to
occur at a higher management level. These additional items were:
Have a signed Memorandum of Understanding (MOU)
Have a signed data sharing agreement
Blend funds

40 www.alamancesoc.org October, 2013
Have developed common policies that align with SOC
The results of the 2010 and 2012 surveys were analyzed to examine changes in
collaboration in each of the above areas. Summarized scores were based on answers other
agencies gave about each agency (e.g., the DSS scores are based on what all other agencies said
about collaboration with DSS). 6 The survey administered to the frontline staff and supervisor
was slightly different from the survey administered to the CEOs, so we analyzed these results
separately.
Results
Front-line staff and supervisors from 8 of 14 agencies and Directors from 10 of 14
agencies responded to the 2012 survey, resulting in a lower participation rate than in the 2010
survey (where respondents included front-line staff/supervisors from 10 and Directors from 13
agencies). The attrition was most notable for front-line staff and supervisors. In 2010, 83 staff
responded to the survey, whereas in 2012 only 36 completed it. In discussing the results below,
the lower participation rate and following points need to be kept in mind:
Some agencies are more likely to collaborate with one another because of their focus and
target populations. For example, the Department of Social Services (ACDSS) would be
expected to work closely with Crossroads (working with victims of sexual abuse), Alamance
Family Center (working on prevention and treatment of child abuse) and Horizons (serving
women with substance abuse issues), but would be less likely to work with agencies that
do not specifically focus on children who have experienced or are at risk for maltreatment,
such as the Alamance Regional Medical Center.
Some types of collaboration may be more feasible than others. For example, a domestic
violence shelter cannot co-locate with any other agency given the nature of the services it
provides; however, it can facilitate the streamlining of services for its residents through
participation in CFTs and service plan development.
Because this was an electronic survey and not a face-to-face interview, respondents may
have interpreted the descriptions of collaboration types differently.
The major results of the survey are described below; graphs depicting the results can be
found in Appendices A and B.
Agency Directors
1. Agency Directors reported higher levels of collaboration in 2012 than in 2010 across all
types of collaboration. Directors reported that more Memoranda of Understanding have
been put in place, that agencies are more likely to share financial or in-kind resources, they
blend funds more, and have more common policies that align with SOC. These results likely
6 In-depth details about the methodology used to analyze the survey results can be provided upon request.

41 www.alamancesoc.org October, 2013
reflect, in part, the activities of the Children’s Executive Oversight Committee (CEOC). In the
past two years, the CEOC has been purposefully working to create a more collaborative
System of Care for all children in Alamance County. It is also true, however, that smaller
agencies that are not part of the CEOC, like Crossroads, Family Abuse Services, Alamance
Family Center and Horizons, are reported to have improved in most of those areas. This
finding is very encouraging, especially because in 2010 smaller agencies felt they were less
well known and not ‘in the radar’ of the bigger and public family-serving agencies. These
findings suggest that big strides have been made towards collaboration at the management
level.
2. In addition, agency Directors reported large increases in collaboration among their staff in
sending and receiving referrals, talking about shared cases, jointly developing plans of care,
jointly participating in CFTs, combining trainings and serving on community nonprofit
partner boards together.
3. The only area with somewhat smaller gains is the area of co-locating services, which is not
surprising because co-location requires not only the will to collaborate, but also additional
financial resources for office space and other such issues. Regardless, increased co-location
was reported.
Front-line staff/Supervisors
1. Front-line staff and supervisors reported overall more moderate increases in collaboration
across all types of collaboration. This may reflect differences in how much of the
collaboration they can see in their day-to-day work, but it may also mean that the top-level
collaboration has not yet filtered down to impact change in work at the front lines.
2. Two agencies stood out among front-line staff and super visor reports of collaboration. The
Alamance Burlington School System (ABSS) and Crossroads.
a. ABSS was voted by all participating staff as improved in all but ‘jointly developing plans
of care’, which is understandable because of the different requirements imposed on
the school system for their version of a plan of care, the Individualized Educational
Plan. This spike in the school collaborative efforts is likely due to two reasons: a) the
work of the preschool social worker, who has been working closely with families of
preschool children and addressing their needs through referrals to appropriate
agencies, and b) the work of the school social worker supervisor, who has been
participating in numerous collaborative efforts. It is very exciting to see the increase in
ABSS’s efforts because school systems are typically very difficult to engage in initiatives
that have a focus that is broader than education.
b. Crossroads had lower overall levels of collaboration than did ABSS (due to its more
narrow focus), but was consistently voted by staff to have increased their collaborative
efforts in all types of collaboration.
3. In terms of front-line/supervisor report of types of collaboration, the most consistent
improvement across agencies was in jointly participating in CFTs. Smaller agencies like

42 www.alamancesoc.org October, 2013
Crossroads, Family Abuse Services, Horizons and the Partnership for Children showed the
biggest gains, along with ABSS and the Department of Social Services.
Overall, the 2010 and 2012 agency collaboration surveys show that collaborative efforts have
paid off over the past two years. Under the leadership of the CEOC, the public family-serving
agencies have steadily worked towards creating a better System of Care for all children in
Alamance County. At the same time, the smaller family-serving agencies have diligently worked
to make themselves known in Alamance County in order to provide better and more
coordinated services to all the families they serve.
Family Satisfaction with Services
As part of the longitudinal study, caregivers were given a questionnaire designed to
assess caregiver satisfaction with the services their family received. This survey measures
caregiver satisfaction across a variety of domains, six of which are presented in this report.
Access to Services measures how convenient the location and times of services were.
Participation in Treatment reflects how involved the caregiver was in the development and
planning of the child’s treatment plan. Cultural Sensitivity measures whether the caregiver
believed that the treatment staff interacted with the family in a culturally sensitive manner.
Satisfaction with Services is assessed by questions relating to the caregiver’s overall perception
of services received (e.g., the extent to which the family received the help they wanted, felt
that the people helping them would stick by them no matter what happened, and that their
child had someone who he or she could talk to when needed). The Outcomes domain
measures the caregiver’s assessment of how well the child is functioning at school and home.
Finally, Social Connectedness refers to how well the caregiver seeks out and accepts support
from people other than service providers.
Figure 22 shows the percent of caregivers who reported feeling satisfied or very
satisfied in response to questions related to each of the above-mentioned domains. These
questions are only asked of caregivers whose families have received services in the preceding 6
months. The categories with the highest satisfaction scores are Cultural Sensitivity and Access
to Services. Satisfaction scores for Outcomes and Social Connectedness are lower than the
other categories, but satisfaction with both categories increases over time. This could be
because families who stay involved with services longer have better outcomes and have more
opportunities to expand their social support networks or because people who feel good about
the outcomes they are seeing tend to stay involved in services longer. Either way, it is nice to
see that a higher percentage of caregivers are feeling positive about the services they are
receiving.

43 www.alamancesoc.org October, 2013
Figure 22
79% 83%
88%
63%
50% 47%
89% 87%
100% 97%
71% 66%
0%
20%
40%
60%
80%
100%
Access to Services Participation inTreatment
CulturalSensitivity
Satisfaction withServices
Outcomes SocialConnectedness
Per
cen
t o
f ca
regi
vers
fee
ling
"sa
tisf
ied
" o
r "v
ery
sati
sfie
d"
Caregiver Satisfaction with Services Received
6 month(n=152)
12 month(n=100)
18 month(n=59)
24 month(n=38)

44 www.alamancesoc.org October, 2013
Cultural Competence
Families were also asked about the importance of cultural competence in their service
providers (i.e., the degree to which support providers respect and are sensitive to cultural
traditions and beliefs and/or are of the same racial or ethnic group as the child). These
questions are first asked at the 6 month interview after the families have had time to get
involved with service providers and have a sense of what they feel is important in a provider.
Figure 23 shows the percent of caregivers who responded that specific items were important or
very important to them. Caregivers’ beliefs remain fairly consistent across all time frames.
Approximately half of caregivers reported that having a service provider who understands the
customs, beliefs and practices of their cultural heritage was important. Fewer than half thought
that these customs and practices should be included in the service plan and fewer than 15% of
caregivers felt that their service provider should have the same cultural heritage as their child.
Figure 23
Moreover, as seen in Figure 24, the majority of families feel that their service providers
are sensitive to their culture, beliefs and background and that the providers are comfortable
interacting with their child. Fewer caregivers report that their provider asks about their
traditions, beliefs and values when planning services. The perceived cultural competence of
service providers increased over time, which may reflect the training provided by the Cultural
and Linguistic Competence committee. Alternately, it may be that families who perceived
providers as sensitive to their cultural beliefs were more likely to remain in services over the
long-run.
53% 45%
12%
52%
40%
10%
50% 47%
8%
51%
40%
13%
0%
20%
40%
60%
80%
100%
You and your child have a serviceprovider who understands the
customs, practices, and traditions ofyour child's cultural heritage?
The beliefs, traditions, and practicesof your child's cultural heritage beincluded in service planning and
provision?
The person you and your child haveseen most often is the same cultural
heritage as your child?
Pe
rce
nt
of
care
give
rs w
ho
sai
d t
hat
st
ate
me
nt
was
imp
ort
ant
or
very
imp
ort
ant
How important is it that…?
Importance of Cultural Competence in Service Providers
6 month(n=182)
12 month(n=121)
18 month(n=76)
24 month(n=47)

45 www.alamancesoc.org October, 2013
As seen in Figure 25, most caregivers feel comfortable discussing alternative therapies
or other ways of working with their child with their providers, and very few caregivers believe
that other children have access to better services than do their children. The majority of
caregivers feel that the materials and services they received were easy to understand, but it
would be better if all caregivers reported that the materials they receive about services are
easy to understand.
Figure 24
45%
78%
95%
47%
64%
90%
61%
94% 97%
67%
89%
97%
0%
20%
40%
60%
80%
100%
Is the same racialor ethnic group as
my child
Understands myfamily's beliefsabout mental
health
Speaks the samelanguage that I ormy child speaks
Asks about myfamily's
traditions, beliefs,and values when
planning orproviding services
Attends to myand my child'scultural needs
Is comfortableinteracting withme and my child
Perc
ent
of
care
give
rs w
ho
rep
on
ded
m
ost
of
the
tim
e o
r al
way
s
My child's provider…
Cultural Competence of Service Providers
6 month(n=182)
12 month(n=121)
18 mnth(n=76)
24 month(n=47)

46 www.alamancesoc.org October, 2013
Figure 25
82%
11%
80% 86%
6%
77%
91%
7%
86% 94%
14%
89%
0%
20%
40%
60%
80%
100%
Comfortable discussing with mychild's provider alternative
therapies or other ways to workwith my child
Like other children have access tobetter services than my child
That the materials and servicesgiven to me about the program are
easy to understand
Per
cen
t o
f ca
regi
vers
wh
o r
esp
on
ded
m
ost
of
the
tim
e o
r al
way
s
I feel…
Cultural Competence of Service Providers
6 month(n=182)
12 month(n=121)
18 month(n=76)
24 month(n=47)

47 www.alamancesoc.org October, 2013
Caregiver Satisfaction with Family Partners
During the Follow-up interviews, caregivers were asked a variety of questions about the
relationship they share with their family partners. These included questions about how often
the caregiver met with the family partner, the types of assistance given to them by the family
partner, how well the partner responded to the caregiver’s concerns, and whether the
caregiver felt that the family partner was available to the caregiver. Figure 26 shows caregiver
responses to questions about their family partner at all Follow-up interviews. Only caregivers
who responded that they had a family partner were included in this analysis. The majority of
caregivers felt that their family partner addressed their issues and was available when needed.
This percentage increases steadily from the 6-month interview to the 24-month interview. This
is expected because the caregivers who continue with their family partners long-term are likely
quite satisfied.
Figure 26
64% 61%
66% 72%
80% 80%
88% 85%
0%
20%
40%
60%
80%
100%
How well did your Family Partner address issuesbrought to her attention?
How available was your Family Partner when youneeded her?
Pe
rce
nt
of
care
give
rs w
ho
re
spo
nd
ed
po
siti
vely
Caregiver Report of Family Partner
6 month (n=131)12 month (n=74)18 month (n=45)24 month (n=26)
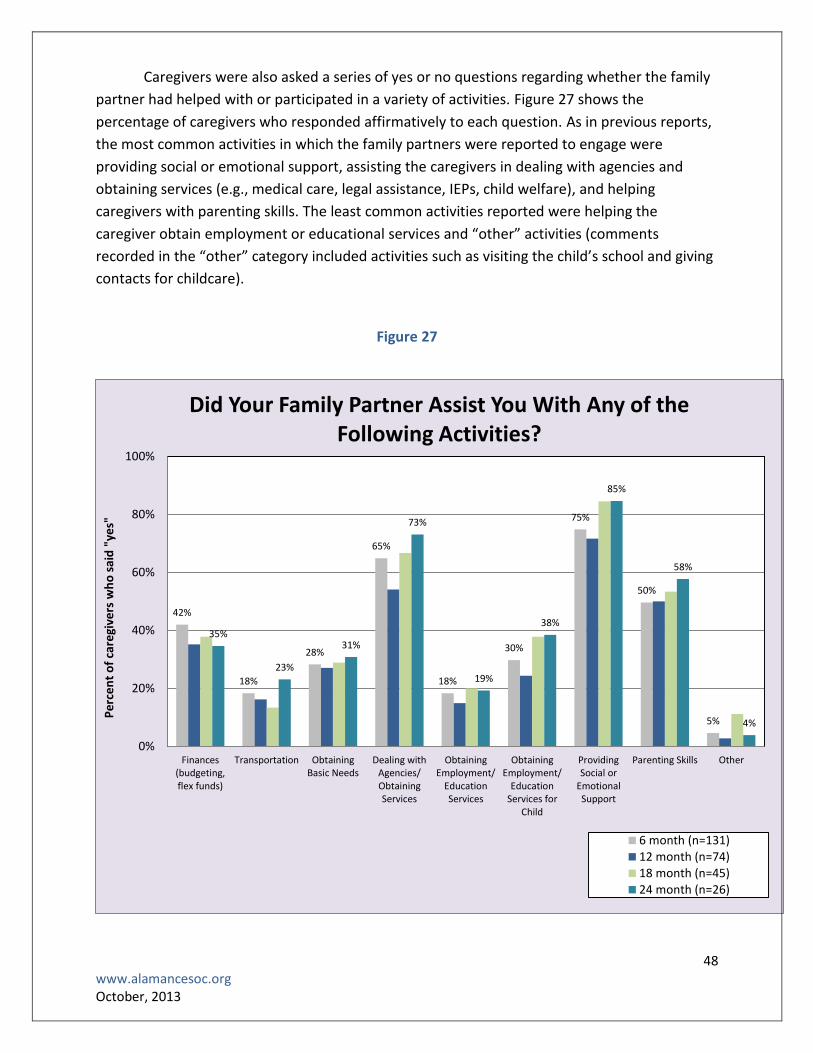
48 www.alamancesoc.org October, 2013
Caregivers were also asked a series of yes or no questions regarding whether the family
partner had helped with or participated in a variety of activities. Figure 27 shows the
percentage of caregivers who responded affirmatively to each question. As in previous reports,
the most common activities in which the family partners were reported to engage were
providing social or emotional support, assisting the caregivers in dealing with agencies and
obtaining services (e.g., medical care, legal assistance, IEPs, child welfare), and helping
caregivers with parenting skills. The least common activities reported were helping the
caregiver obtain employment or educational services and “other” activities (comments
recorded in the “other” category included activities such as visiting the child’s school and giving
contacts for childcare).
Figure 27
42%
18%
28%
65%
18%
30%
75%
50%
5%
35%
23%
31%
73%
19%
38%
85%
58%
4%
0%
20%
40%
60%
80%
100%
Finances(budgeting,flex funds)
Transportation ObtainingBasic Needs
Dealing withAgencies/ObtainingServices
ObtainingEmployment/
EducationServices
ObtainingEmployment/
EducationServices for
Child
ProvidingSocial or
EmotionalSupport
Parenting Skills Other
Pe
rce
nt
of
care
give
rs w
ho
sai
d "
yes"
Did Your Family Partner Assist You With Any of the Following Activities?
6 month (n=131)12 month (n=74)18 month (n=45)24 month (n=26)

49 www.alamancesoc.org October, 2013
Family Partners as Case Managers
In the last three years, North Carolina has witnessed drastic cuts in case management
services. Families whose children qualify for intensive in-home services receive case
management services from their mental health providers. However, families whose children
receive outpatient mental health services do not qualify for case management services. Thus
there are many high need families who do not qualify for case management services, but could
certainly benefit from having a care coordinator. In 2012, the Alamance Alliance decided to try
a new case management model in which family partners were trained to act as case managers.
Two Family Partners were trained in care coordination and case management techniques,
documentation and support. These Family Partners were assigned to act as case managers for
high need families who would not otherwise qualify for this service. This report presents the
results of a chart and log review of case management services provided by the family partners
to 27 families.
In the context of the Alliance and this report, case management includes the following:
1. Futures Mapping—working with the family to create a document that describes and
documents the family’s support system, their strengths and challenges, and their hopes for
the future;
2. Child and Family Team Meetings—organizing and facilitating Child and Family Team
meetings (CFTs), during which creation of the service plan and subsequent progress
monitoring occurs;
3. Other support services such as linking families to resources; assisting families in navigating
the system; attending meetings with families; and advocating for families while teaching
them how to advocate for themselves.
The results of the chart review are described below.
Futures Mapping
19 of the 27 charts (70%) included a Futures Mapping document
Six charts included the date the Futures Mapping document was created. Of those, the
average number of days from enrollment to creation of the Futures Mapping was 64.
Child and Family Team Meetings (CFTs)
Child and Family Team meetings are expected to occur once a month so that progress
can be reviewed and documented and goals can be adjusted, if necessary.
Five of the 27 charts (19%) had documented Child and Family Team meetings
One of the five charts had five documented CFTs and a second one had two. The remaining
three charts had one documented CFT each.

50 www.alamancesoc.org October, 2013
In addition to the number of CFTs, we also looked at whether the documentation
included the previously decided-upon goals that need to be reviewed, future goals and who
would be responsible, and the date of the next CFT meeting.
Of the 10 documented CFTs:
Three (30%)had the goals from the previous meeting recorded
Six (60%) had at least some documentation of future goals
Four (40%) had at least some documentation of who would be responsible for each goal
Two (20%) had the date for the next CFT documented
Other Case Management Services
Family Partners are asked to document the time they spend with each family and
categorize the purpose of each contact. The following categories are used to describe case
management activities: Emotional Support, Linking to Services, Attending Meetings, Creating
Futures Mapping, Advocacy and Navigating the System.
The two Family Partners documented the content of their visits quite differently, which
may reflect lack of clarity around their role or the definitions of the different categories. Table 7
shows the percent of time each partner documented in each activity.
Table 7
Contact Purpose Family Partner 1 Family Partner 2
Emotional Support 71% 37%
Linking to Services 8% 22%
Attending Meetings 5% 2%
Creating Futures Mapping 1% 3%
Advocacy 8% 23%
Navigating the System 7% 10%
Conclusions and Recommendations
The review of the documentation of case management services revealed that case
management activities by Family Partners occurred to a limited degree. Even though the
majority of families had a Futures Mapping, a small minority had documented Child and Family
Team Meetings. The available documentation included limited future goals and responsible
parties for each goal. The small number of documented CFTs and the lack of clear
documentation of goals, progress on each and measureable outcomes is concerning. Moreover,
there appears to be lack of clarity either around the role Family Partners are supposed to play
as case managers, the documentation of those roles (i.e., they may be acting as case managers,

51 www.alamancesoc.org October, 2013
but the documentation of their activities make it appear as if they are acting more like
traditional Family Partners), or the definitions of each of the activities they are supposed to
undertake.
Family Partners play a significant role supporting families of children with serious social
and emotional challenges. As case managers, they are not only supposed to provide emotional
support, but also be knowledgeable and well-trained to assume more complicated
responsibilities. Assisting families in linking to services, navigating complicated and siloed
systems, problem-solving, advocating for families and facilitating CFTs are skills that can be
learned by Family Partners, but require time and frequent supervision. The Alliance Family
Partners have made an admirable attempt to provide families with most-needed case
management that they cannot receive anywhere else. The chart review suggests more
resources, supports and training need to be in place to allow Family Partners to play that role in
an effective manner.
VI. Leveraging Change and Sustainability Efforts in the Past Year
During its fifth year, the Alliance continued to work towards sustainability and leverage
change through the creation or expansion of numerous positions to support other agencies in
their efforts to provide services to children ages birth through five and their families. Below is a
summary of those activities:
The Alliance Clinical Services Director has provided several ASQ-SE screening and referral
trainings to multiple agencies in the community in an attempt to increase workforce
knowledge and capacity in all family-serving agencies in Alamance County. She has further
created a Facebook page called the “Alamance County MH Clinicians." Twenty-nine
clinicians have been using this page on a regular basis to post information about resources,
upcoming events or groups, consult with and support one another, and exchange
information about billing as they are implementing evidence-based services with the
Alliance families.
A sub-committee of Alliance staff completed the development of core competencies for
individuals/professionals working with young children in Alamance County. In early
December, this document will be presented to the Local Interagency Coordinating Council,
one of the governing bodies of the Alliance, and will be utilized for staff development across
all agencies participating in the council.
The Alliance website has now available a list of all the mental health professionals in the
county with areas of expertise, evidence-based models practiced and insurance accepted, a
very useful addition for all families in the county.
The Alliance has been closely involved in the planning, development, and implementation of
strategies that support infant and young child mental health statewide. Alliance leaders

52 www.alamancesoc.org October, 2013
provided support for and directly participated in the North Carolina Institute of Medicine
(NCIOM) Study on early childhood mental health. They further played a key role in the
establishment in 2012 of the North Carolina Infant Mental Health Association (NCIMHA).
NCIMHA has been tasked by NCIOM with statewide workforce development. Within its first
year it reached a membership of 150 early childhood professionals, organized its first
successful conference with an attendance of more than 200 professionals and organized 9
regional meetings across the state to roll out the NCIOM recommendations. NCIMHA has
received a grant to provide an early childhood mental health train-the-trainer series focused
on early intervention.
Project LAUNCH, which was recently awarded to Alamance County, has been collaborating
with the Alliance to provide prevention services to children birth to 8 years of age and their
families. Realizing that the two projects are natural complements of each other, the
leadership of both projects has blended funds to create new positions. A half-time Early
Childhood Community Mental Health (ECMH) Specialist was hired in the spring of 2013 to
work in local child care centers to provide services to children and families with behavioral
difficulties. The ECMH Specialist does screenings and provides consultation to child care
providers about specific children and also works with caregivers to incorporate Triple P
positive parenting concepts to foster change in parenting behaviors. Since she began in
April, she has received 14 referrals and has made 52 visits to child care facilities, working
closely with child care teachers and caregivers to effect positive behavior change in young
children at home and at child care. The two projects further collaborated on social
marketing efforts to inform the community of the combined resources the two projects
have made available to the Alamance community. In addition, and depending on the need,
the two projects make regular efforts to refer families to each other and their leaders
attend one another’s governing body meetings. Finally, Project LAUNCH has trained
multiple family service providers in ABC and Triple P 3 and 4, expanding the capacity for
evidence-based practices that the Alliance has brought to Alamance County.
VII. Concluding Thoughts
The Alamance Alliance System of Care is currently starting its 6th and final year. This year
will bring changes to the Alliance as funding winds down and we start to see processes
implemented without the overarching support of the grant. However, the Alliance has always
kept sustainability at the forefront of all decisions and we expect that the processes and
programs implemented through the grant will continue even after grant funds are gone.
With notable forethought, referral portals were set up through well-known public
agencies. The Children’s Development Services Agency (CDSA) will remain the referral portal for
children birth to three and the Alamance Burlington School System (ABSS) will remain the

53 www.alamancesoc.org October, 2013
referral portal for older children. Agencies already familiar with this referral process should be
able to continue referring young children in exactly the same way as before.
Moreover, regular and repeated trainings on the social and emotional needs of very
young children, the effects of trauma on brain development, System of Care primers, Child and
Family Team trainings, screening and assessment seminars, and trainings in state-of-the art
evidence-based practices have increased Alamance County’s capacity to provide services to its
youngest citizens. Childcare providers, pediatricians, teachers, social workers, even police
officers, are ready to identify, refer and serve young children with social or emotional
challenges immediately and decrease the likelihood they will need more intense and expensive
services when they are older.
Furthermore, significant sustainability activities have occurred this past year in
Alamance and the state. First, the Early Childhood Core Competencies document that was
developed to increase early childhood providers’ knowledge, attitudes and skills has been
completed and will be utilized for staff development purposes across all early childhood
agencies in Alamance County.
Second, Alamance County mental health providers, and especially ones trained in
evidence-based practices through the Alliance and Project LAUNCH, have, through the
Alamance County Mental Health Clinicians Facebook page, a way of supporting each other and
working to sustain these practices in Alamance County. The addition on the Alliance webpage
of a list of mental health clinicians with the evidence-based practices in which they are trained
will also make these practices and clinicians more widely known to the Alamance community.
Third, the Children’s Executive Oversight Committee (CEOC) has taken on a more active
role in improving services for young children and their families in Alamance County. Through
the efforts of the Alliance and Project LAUNCH, the CEOC has expanded its membership to
include institutions of higher education and faith-based groups, has put in place more cross-
agency Memoranda of Understanding and has become a much stronger advocate for the
Alamance county families. Furthermore, the CEOC will develop its first strategic plan and is in
the process of creating a cross-system Alamance County Child Health Report Card that will be
endorsed by the entire group. As the agency collaboration survey showed, the CEOC leaders as
well as the leaders of the smaller nonprofit agencies in the County have stepped up their
collaborative efforts and will hopefully infuse their energy throughout their agencies.
At the state level, the Alliance supported the North Carolina Institute of Medicine Study
(NCIOM) and the establishment of the North Carolina Infant Mental Health Association
(NCIMHA). The Association has taken on the task of statewide workforce development and has
organized 9 regional meetings to facilitate the rolling out of the NCIOM recommendations. It is
also sponsoring a train-the-trainer series of early childhood mental health.

54 www.alamancesoc.org October, 2013
This year was also the last year of the longitudinal evaluation of the early childhood
System of Care. Two-hundred and twenty families were enrolled in the longitudinal evaluation
and follow-up interviews were conducted until September 30, 2013. The results of this study
show that the children who participated in the Alamance Alliance show significant
improvements in their behavior and their parents are feeling less stressed. It is our hope that
these children will continue to improve, be able to do well in school and eventually become
productive adults. The Alliance has made great efforts to create a strong foundation for the
young children of Alamance County that we hope will continue beyond the end of the grant.

VII. Appendix A
Agency Collaboration Survey Results for Agency Directors
0
10
20
30
40
50
60
70
80
90
100
Pe
rce
nt
of
Dir
ect
ors
wh
o E
nd
ors
ed
C
olla
bo
rati
on
wit
h E
ach
Age
ncy
Agency
Memorandum of Understanding
2010
2012
0
10
20
30
40
50
60
70
80
90
100
Pe
rce
nt
of
Dir
ect
ors
wh
o E
nd
ors
ed
C
olla
bo
rati
on
wit
h E
ach
Age
ncy
Agency
Shared Resources
2010
2012

56 www.alamancesoc.org October, 2013
0
10
20
30
40
50
60
70
80
90
100P
erc
en
t o
f D
ire
cto
rs w
ho
En
do
rse
d
Co
llab
ora
tio
n w
ith
Eac
h A
gen
cy
Agency
Data Sharing
2010
2012
0
10
20
30
40
50
60
70
80
90
100
Pe
rce
nt
of
Dir
ect
ors
wh
o E
nd
ors
ed
C
olla
bo
rati
on
wit
h E
ach
Age
ncy
Agency
Blended Funds
2010
2012

57 www.alamancesoc.org October, 2013
0
10
20
30
40
50
60
70
80
90
100P
erc
en
t o
f D
ire
cto
rs w
ho
En
do
rse
d
Co
llab
ora
tio
n w
ith
Eac
h A
gen
cy
Agency
Common Policies
2010
2012
0
10
20
30
40
50
60
70
80
90
100
Pe
rce
nt
of
Dir
ect
ors
wh
o E
nd
ors
ed
C
olla
bo
rati
on
wit
h E
ach
Age
ncy
Agency
Send and Receive Referrals
2010
2012

58 www.alamancesoc.org October, 2013
0
10
20
30
40
50
60
70
80
90
100P
erc
en
t o
f D
ire
cto
rs w
ho
En
do
rse
d
Co
llab
ora
tio
n w
ith
Eac
h A
gen
cy
Agency
Talk about Shared Cases
2010
2012
0
10
20
30
40
50
60
70
80
90
100
Pe
rce
nt
of
Dir
ect
ors
wh
o E
nd
ors
ed
C
olla
bo
rati
on
wit
h E
ach
Age
ncy
Agency
Jointly Develop Plans of Care
2010
2012

59 www.alamancesoc.org October, 2013
0
10
20
30
40
50
60
70
80
90
100P
erc
en
t o
f D
ire
cto
rs w
ho
En
do
rse
d
Co
llab
ora
tio
n w
ith
Eac
h A
gen
cy
Agency
Jointly Participate in CFTs
2010
2012
0
10
20
30
40
50
60
70
80
90
100
Pe
rce
nt
of
Dir
ect
ors
wh
o E
nd
ors
ed
C
olla
bo
rati
on
wit
h E
ach
Age
ncy
Agency
Use Consent to Share Info
2010
2012

60 www.alamancesoc.org October, 2013
0
10
20
30
40
50
60
70
80
90
100P
erc
en
t o
f D
ire
cto
rs w
ho
En
do
rse
d
Co
llab
ora
tio
n w
ith
Eac
h A
gen
cy
Agency
Co-locate Services
2010
2012
0
10
20
30
40
50
60
70
80
90
100
Pe
rce
nt
of
Dir
ect
ors
wh
o E
nd
ors
ed
C
olla
bo
rati
on
wit
h E
ach
Age
ncy
Agency
Combine Trainings
2010
2012

61 www.alamancesoc.org October, 2013
0
10
20
30
40
50
60
70
80
90
100P
erc
en
t o
f D
ire
cto
rs w
ho
En
do
rse
d
Co
llab
ora
tio
n w
ith
Eac
h A
gen
cy
Agency
Serve on Boards Together
2010
2012

62 www.alamancesoc.org October, 2013
IX. Appendix B
Agency Collaboration Survey Results for Frontline Staff and Supervisors
0
10
20
30
40
50
60
70
80
90
100
Pe
rce
nt
of
Sta
ff a
nd
Su
pe
rvis
ors
wh
o
En
do
rse
d C
olla
bo
rati
on
wit
h E
ach
Age
ncy
Agency
Send and Receive Referrals
2010
2012
0
10
20
30
40
50
60
70
80
90
100
Pe
rce
nt
of
Sta
ff a
nd
Su
pe
rvis
ors
wh
o
End
ors
ed
Co
llab
ora
tio
n w
ith
Ee
ach
Age
ncy
Agency
Talk about Shared Cases
2010
2012
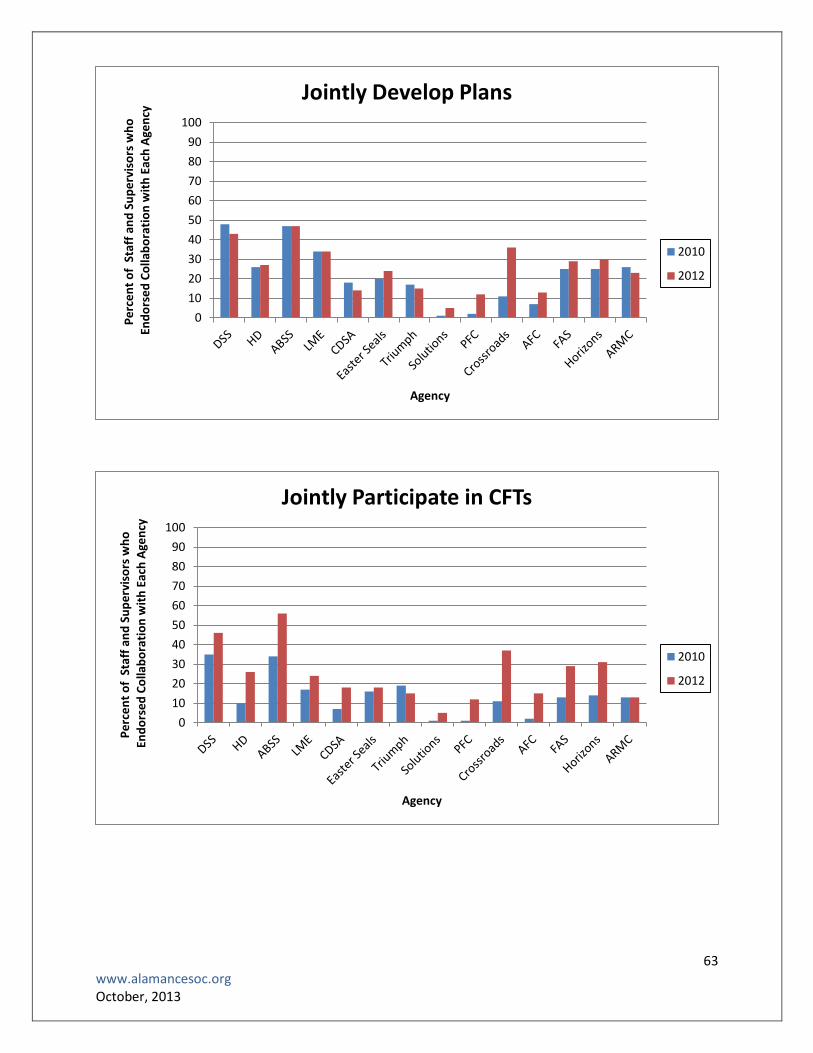
63 www.alamancesoc.org October, 2013
0
10
20
30
40
50
60
70
80
90
100P
erc
en
t o
f S
taff
an
d S
up
erv
iso
rs w
ho
E
nd
ors
ed
Co
llab
ora
tio
n w
ith
Eac
h A
gen
cy
Agency
Jointly Develop Plans
2010
2012
0
10
20
30
40
50
60
70
80
90
100
Pe
rce
nt
of
Sta
ff a
nd
Su
pe
rvis
ors
wh
o
En
do
rse
d C
olla
bo
rati
on
wit
h E
ach
Age
ncy
Agency
Jointly Participate in CFTs
2010
2012

64 www.alamancesoc.org October, 2013
0
10
20
30
40
50
60
70
80
90
100P
erc
en
t o
f S
taff
an
d S
up
erv
iso
rs w
ho
En
do
rse
d C
olla
bo
rati
on
wit
h E
eac
h A
gen
cy
Agency
Use Consent to Share Info
2010
2012
0
10
20
30
40
50
60
70
80
90
100
Pe
rce
nt
of
Staf
f an
d S
up
erv
iso
rs w
ho
E
nd
ors
ed
Co
llab
ora
tio
n w
ith
Ee
ach
Age
ncy
Agency
Co-locate Services
2010
2012

65 www.alamancesoc.org October, 2013
0
10
20
30
40
50
60
70
80
90
100P
erc
en
t o
f St
aff
and
Su
pe
rvis
ors
wh
o
En
do
rse
d C
olla
bo
rati
on
wit
h E
eac
h A
gen
cy
Agency
Combine Trainings
2010
2012
0
10
20
30
40
50
60
70
80
90
100
Pe
rce
nt
of
Sta
ff a
nd
Su
pe
rvis
ors
wh
o
En
do
rse
d C
olla
bo
rati
on
wit
h E
eac
h A
gen
cy
Agency
Serve on Boards Together
2010
2012

X. Appendix C
Quarterly Report
Type of Training Third Quarter 2012 (July-Sept, 2012)
Fourth Quarter 2012 (Oct-Dec, 2012)
First Quarter 2013 (Jan-Mar, 2013)
Second Quarter 2013 (April-June, 2013)
Third Quarter 2013 (July-Sept, 2013)
Services and Supports
number of people completing an EBP training
0 0 0 0 10 (6 who can serve Alamance County)
Training
number of training events held 14 14 10 5 8
total number of individuals at all training events combined
397 392 150 148 84
Family Involvement
number of family members participating in FIC meetings (does not include FPs)
2 0 NA (no longer having FIC meetings)
NA (no longer having FIC meetings)
NA (no longer having FIC meetings)
number of cafes held 1 1 0 1 0
number of participants in each café 144 50 (18 adults, 32 kids) 0 96 (34 adults, 62 kids, 25 total families)
0
Cultural and Linguistic Competence
number of CLC trainings held 5 9 4 0 4
number of agencies receiving cultural competence training
4 (plus those attending a State
Conference)
25 18 0 8
total number of participants in all trainings combined
71 241 39 0 107

67 www.alamancesoc.org October, 2013
Type of Activity Third Quarter 2012 (July-Sept, 2012)
Fourth Quarter 2012
(Oct-Dec, 2012)
First Quarter 2013 (Jan-Mar, 2013)
Second Quarter 2013 (April-June, 2013)
Third Quarter 2013 (July-Sept, 2013)
Social Marketing: Events &Publications
number of public awareness events held
2 6 8 10 11
number of articles published for the general public
1 1 1 10 1
number of messages sent on the professional list serve
5 0 15 28 5
number of messages sent on the family/consumer list serve
7 0 3 0 5
average number of people subscribed to the professional list serve
89 89 94 100 200
average number of people subscribed to the family/consumer list serve
70 70 72 74 132
Social Marketing: Website Cumulative # of Hits(# of Hits this
Quarter)
About 2203 (215) 2494 (291) 2803 (309) 3064 (261) 3273 (209)
Services 2143 (198) 2439 (296) 2724 (285) 2972 (248) 3163 (191)
News 1838 (184) 2033 (195) 2226 (193) 2431 (205) 2653 (222)
Resources 1950 (153) 2226 (276) 2481 (255) 2712 (231) 2945 (233)
FAQs 1827 (237) 2233 (406) 2532 (299) 2771 (239) 2950 (176)
Links 1022 (98) 1221 (199) 1448 (227) 1616 (168) 1813 (197)
Families 1122 (109) 1307 (185) 1474 (167) 1609 (135) 1716 (107)
En Español 728 (62) 869 (141) 1021 (152) 1121 (100) 1216 (95)
Social Marketing: Facebook Page Number of members
70 69 74 77 91

Type of Activity Third Quarter 2012 (July-Sept, 2012)
Fourth Quarter 2012 (Oct-Dec, 2012)
First Quarter 2013 (Jan-Mar, 2013)
Second Quarter 2013 (April-June, 2013)
Third Quarter 2013 (July-Sept, 2013)
Infrastructure number and description of
organizational changes introduced by the Alliance
1 Total:
Addition of annual ECMH training curriculum for community agencies
2 Total:
Elimination of Asst. PD position
1st Annual State ECMH conference
1 Total:
Established process for universal ASQ-SE screening in one organization
0 Total 3 Total:
Creation of Clinical/Trauma Specialist position in CWS
Elimination of 1 FTE FP position
Reduction in CLC position to .5 FTE
Evaluation referral source:
# from ABSS 12 11 19 15 12
ABSS:2
Caregiver:1
Doctor:2
DSS:5
FAS:2
APC:1
ABSS:2
Caregiver:4
Doctor:3
DSS:1 *12 additional children were referred, but screening showed they needed services other than MH
Caregiver: 1
Crisis Center: 1
Doctor: 1
DSS: 8
Head Start: 4
HD: 4
ABSS:2
APC: 1
Caregiver:5
Doctor: 3
DSS:1
HD: 3
ABSS: 4
Caregiver: 1
Doctor: 2
DSS: 3
Centro La Communidad: 2 *5 are re-referrals; children who have already been evaluated, but were ineligible or declined services at the time of the evaluation
# from CDSA 18 8 21 8 14
Caregiver:2
CDSA:4
CC4C:2
Doctor:2
DSS:7
HD:1
Caregiver:1
CDSA:1
Doctor:2 DSS:4
Caregiver:2
CC4C:2
CDSA:6
DSS: 11
CDSA:1
DSS: 3
HD: 3
PFC: 1
ARMC-OT: 1
Caregiver: 1
CC4C: 1
CDSA: 1
Doctor: 2
DSS: 7
PFC: 1
#of completed diagnostic evaluations
30 21 27 14 30
#of families enrolled 20 17 21 7 13
# disenrolled because parent initiated disenrollment
5 8 10 5 12
# disenrolled because family never engaged
2 4 1 0 0