2016 fractracker alliance annual report
TRANSCRIPT

FracTracker Alliance studies, maps, and communicates the risks of oil and gas development to protect our planet and support the renewable energy transformation.
[email protected] www.fractracker.org
FRACTRACKER ALLIANCE
ANNUAL REPORT 2016

2 3Annual Report 2016 Annual Report 2016
Table of Contents Message from the Director
Dear Friends, The year 2016 proved to be a tumultuous time in politics and in the battle to protect our planet from fossil fuel harms. While the rhetoric turned heated, hydrocarbon emissions made the world hotter than ever – and ever more precarious.
FracTracker Alliance responded with a polishing of our mission and a sharpening of our programmatic tools. Our services powered a collection of partner-driven projects from coast to coast, where our mapping and data analysis elevated awareness, invigorated advocacy, and catalyzed better policies.
Our work in communities aided local groups with information critical to their fights. We examined impacts, and risks related to gas and oil wells, injection wells, pipelines, sand mines, landfills, refineries, and other infrastructure. The issues – and the concerns – remain endless. The growth of the Community Sentinel Award program, fortified by four national partners, celebrated the heroes on the front lines in their communities.
Meanwhile, hundreds of maps, photos, and digital stories were added to our website week by week. Journalists and new donors recognized our value as an indispensable resource on energy matters, and prior supporters entrusted us with continued investments in our activities. We’re exceedingly grateful.
These days it’s hard not to be despondent, but knowing that our insights empower action – as our new tagline says – makes my heart a little lighter. Working hard and working smart with an army of collaborators, we move forward despite the times.
In September, FracTracker finished development of the PA Clean Energy Jobs Map for E2. It proved that renewable energy and energy efficiency are enriching our land in every conceivable way. There is no stopping the inertia, no matter what backward policies try to stand in the way. FracTracker and its allies demand a clean energy future. Together, we shall prevail.
Introduction
Programmatic
Management
Message from the Director 03
2016 Highlights 04Featured Articles 06Our Collaborators 08Outreach & Events 10Featured Publications 12Mapping How To’s 13Future Work 14
Growth Statistics 16Meet the Staff 18Intern Support 19Financial Report 20Board of Directors 21
Brook LenkerEXECUTIVE DIRECTOR
Brook Lenker, Washington, DC

4 5Annual Report 2016 Annual Report 2016
FracTracker Alliance studies, maps, and communicates the risks of oil and gas development to protect our planet and support the renewable energy transformation.Whether you are learning about FracTracker for the first time or are a regular consumer of our work, we hope our maps, data, stories, and photos are informative, insightful, and inspiring. If you’re one of the many organizations and institutions collaborating with us to expose harms, we hope our services and partnership have been of great value in your advocacy or research aims. Here are some organizational highlights from 2016:
2016 Highlights
Earthquake Mapping
“Induced seismicity” refers to earthquakes triggered by human activity - and in this case disposing of oil and gas waste in Class II injection wells. Oklahoma and Kansas felt a series of three major induced earthquakes in late 2016, ranging in magnitude from 4.5 to 5.8.
The September 3, 2016, magnitude 5.8 earthquake in Pawnee, Oklahoma, is the most violent example of induced seismicity in U.S. history, causing the OK governor to declare a state of emergency.
Given the significant increase in seismic activity across the U.S. Great Plains, along with the potential environmental, public health, and economic risks at stake, we thought it was time to compile an inventory of Class II injection well volumes. Our initial analysis focused on Oklahoma and Kansas, but will be expanded as resources permit. Learn more: fractracker.org/oklahoma-kansas-injection-wells
Children at Risk in Bella Romero
Weld County, Colorado, is one of the top producing shale oil and gas regions in the United States, boasting more than 12,000 active horizontal or directional wells, which account for 50% of all horizontal or directional wells in the state.
At the center of Weld County is the city of Greeley, population 92,889. Greeley has experienced dramatic changes in the past decade as extraction companies compete to acquire oil and gas mineral rights. A number of massive well pads are proposed within or on the border of city limits.
In the summer of 2016, we worked with Our Longmont and Coloradans Against Fracking to illuminate a proposal to drill within 1,300 feet of a public elementary school: Bella Romero. The maps and information we compiled were used at a public meeting on this issue.
Learn more: fractracker.org/bella-romero-children-risk-greeley-co
Oil and Gas Threat Map
A most noteworthy project was a close collaboration with Earthworks and Clean Air Task Force in the creation of the Oil and Gas Threat Map, an online tool to make the public and decision makers aware that
methane and associated air toxics are a ubiquitous health threat that should be addressed with strong government standards. Improvements and updates to this tool are planned in 2017. This project assimilated some of the FLIR imagery that we mapped in yet another project
for Earthworks. A related project involved collaboration with the Wilderness Society to add a public lands dimension to the issues addressed in the Threat Map. Explore the Oil and Gas Threat Map: oilandgasthreatmap.com
FracTracker works with a variety of partners. While we can sometimes undertake
smaller, collaborative projects pro bono, we offer an affordable fee-for-service
structure for larger projects. Learn more: fractracker.org/fee-for-service
Oil and Gas Threat Map showing populations within a half-mile of drilling activity in
the continental United States.

6 7Annual Report 2016 Annual Report 2016
Left to Right: A surveyor symbol discussed in our article “Surveyor Symbols and Signs” by Bill Hughes;
and a map of the Sabal Trail Pipeline by Karen Edelstein
Left to Right: Map developed by Kirk Jalbert and Matt Kelso as part of our Allegheny County Lease
Mapping project; and a photo by Pete Stern showing a rig operating in Loyalsock State Forest, PA
Featured Articles
Surveyor Signs & SymbolsThroughout an active shale gas field, the first signs of pending expansions are the simple markings of stakes, flags, and pins. Quite frequently these simple markings are undecipherable by themselves, especially by non-professionals, so we put together a visual guide to surveyor signs and symbols with the help of WV Community Liaison, Bill Hughes. Learn more: fractracker.org/surveyor-symbols-signs
The Sabal Trail PipelineConstruction is underway for a $3.2 billion, 515-mile-long interstate gas pipeline, running from central Alabama, through southwestern Georgia, and deep into Central Florida. Despite the various economic claims being made by its developers, many groups of people are concerned about the serious cost to communities and the environment. Learn more: fractracker.org/sabal-trail-pipeline
Oil & Gas 101Another extremely popular resource on FracTracker.org is our oil and gas drilling 101 section. Bolstered by links to published research and photos by FracTracker staff and other contributors, this section provides an overview of unconventional oil and gas extraction, several virtual tours, and definitions for common fracking terms.Learn more: fractracker.org/resources/oil-and-gas-101
Allegheny County Lease Mapping ProjectRegardless of one’s perspective on oil and gas development, we believe it is important for communities to be able to make informed decisions about their future. Municipalities may wish to identify areas where drilling would be particularly burdensome for their residents and limit development through zoning ordinances. Others may wish to enter into dialogue with drilling companies before expensive permitting processes commence. Proactive planning can be difficult with existing tools, however.
This project hopes to fill the void by identifying where leases have been signed for oil and gas development in Allegheny County, Pennsylvania (to start). More than a simple list, this project and map serve as interactive tools for municipalities, land trusts, and community leaders to utilize when considering their relationships with the oil and gas industry. Learn more and explore the map: fractracker.org/lease-mapping
A key way that people discover FracTracker and learn about our work is through our website, FracTracker.org, where we share information about energy issues via hundreds of articles, maps, analyses, and photos. In 2016 alone, we published 69 hard-hitting analyses and launched several data-driven projects, such as the Allegheny Lease Mapping Project:

8 9Annual Report 2016 Annual Report 2016
Our Collaborators
Still in the Pits ReportIn 2016, we worked with Clean Water Action to map an update to last year’s report on the use of unlined, above ground oil and gas waste disposal pits, also known as sumps, in California. The new report identifies additional oil field wastewater pits and details how CA regulators continue to allow these facilities to degrade groundwater, surface waters, and air quality. tinyurl.com/stillinthepits
Mississippi National Forest MappingThe Center for Biological Diversity reached out to have FracTracker map red-cockaded woodpecker habitat in Mississippi imperilled by oil and gas activity. tinyurl.com/oilgas-woodpecker
O&G Zoning in Southwest PennsylvaniaIn PA, we worked with Mountain Watershed Association to map zoning as a tool to limit or preclude oil and gas drilling. fractracker.org/oil-gas-zoning-southwestern-pa
Easement to IndustryChesapeake Commons and partners mapped and highlighted issues associated with the proposed Atlantic Sunrise pipeline project in the Chesapeake Bay watershed. In collaboration, FracTracker provided some of the mappable data. tinyurl.com/pipeline-easements
Dangerous and Close Report In nine of the most heavily drilled states in the U.S. –Arkansas, California, Colorado, New Mexico, North Dakota, Ohio, Pennsylvania, Texas and West Virginia– FracTracker helped Environment America study sensitive receptors near fracked oil and gas wells. tinyurl.com/dangerous-close
NPCA Mesa Verde ProjectWe helped National Parks Conservation Association document oil and gas threats and the special attributes at risk around Mesa Verde National Park in Colorado. A comprehensive story map was developed to present those issues to regulators.tinyurl.com/mesaverde-drilling
Great Lakes Water MetricsWe helped River Network study energy and other infrastructure impacts to a variety of water metrics in the Great Lakes. tinyurl.com/greatlakes-rn
You Are Here MapFracTracker worked closely with Sane Energy to improve their interactive “You Are Here” map. Now a storymap, this project explores fracking infrastructure, the communities affected by the industry, and what they are doing to push back against it in New York and now Pennsylvania. fractracker.org/you-are-here
FracTracker is honored to work with a number of incredible organizations and grassroots groups to highlight the impacts from oil and gas drilling that are of concern to them and their constituents. A selection of our collaborative projects is found on this page and the next. A complete list can be found here: fractracker.org/projects
Thank you for such an informative and great article about our area, and the maps you have created. This is a great tool for informing the public about the industries along the refinery corridor. - Email correspondence from a California reader regarding our refinery corridor map: fractracker.org/north-coast-refinery-corridor
PA Clean Energy MapIn a new type of project for us, we constructed the “Our Energy Renewal: A Pennsylvania Clean Energy Map” for E2 - an affiliate of Natural Resources Defense Council. This map, shown above, identifies where clean energy businesses across the state are located, as well as sites where renewable energy is generated. e2.org/pamap
Ohio Shale Country Listening ProjectLed by Communities United for Responsible Energy, with support from us, the OH Environmental Council, and the Laborers Local 809 of Steubenville, this project was an effort to solicit, summarize, and share the perspectives and observations of those directly experiencing the shale gas boom in eastern OH. fractracker.org/oh-listening-project-part-1
Mariner II Pipeline Maps & AnalysesWe collaborated with the Clean Air Council and Mountain Watershed Association to explore the stream and watershed impacts of the Mariner II pipeline. fractracker.org/mariner-east-2-water-risks
Frac Sand Mining in WisconsinAs part of our ongoing work mapping frac sand mining impacts in the Midwest, we conducted a variety of analyses and presentations in Wisconsin in 2016. In collaboration with the Society for Conservation Biology, Midwest Environmental Advocates, Save the Hills Alliance, and Public Lab, we demonstrated the scale and destruction of frac sand mining in the region and how residents can get involved in protecting their treasured spaces. fractracker.org/earth-week-wisconsin
Clean Energy Map - Project of E2

10 11Annual Report 2016 Annual Report 2016
Outreach & Events
Despite our digital beginnings, FracTracker also shares our findings in person through a variety of different venues across the country. In 2016, FracTracker staff presented or participated in 61 meetings, conferences, and events. In total, we have directly reached 2,400 people through these activities, and many more through the online distribution of event videos and live streaming. The events ranged from local or regional talks at churches and colleges, to field tours, to major presentations at national environmental, public health, and academic conferences. Overall, this work was spread out across 10 states, the District of Columbia, and British Columbia.
Second Annual Community Sentinel Award for Environmental Stewardship
Out of 20 nominees, 3 community advocates were selected to receive the Community Sentinel Award for Environmental Stewardship, presented in September 2016 by Americans Against Fracking, Earthworks, FracTracker Alliance, Halt The Harm Network, and Stop the Frack Attack - sponsored by the Park Foundation and the 11th Hour Project. Award recipients were honored by peers for their efforts to document and address the harmful effects of oil and gas development in the U.S.
This year’s Community Sentinel Award winners were:• Alma Hasse – Citizens Allied for Integrity and Accountability, Fruitland, ID• Alex Lotorto – Energy Justice Network, Milford, PA• Vera Scroggins – Citizens for Clean Water, Brackney, PA
Learn more: fractracker.org/sentinel-award
Field Tours in West Virginia and Michigan
In 2016, both Bill Hughes and Ted Auch helped to educate visitors to the shale gas drilling towns and sand mining regions of West Virginia and Michigan, respectfully. Bill’s insights helped visitors develop a sense of what it feels like to live with this industrial activity in their community, and Ted’s work helped to document sensitive ecosystems at risk from the expansion of frac sand mining. Seeing the impacts first-hand has enlightened hundreds of researchers, reporters, students, and collaborators since we began these tours.
You Are Here workshop energy posters
Ted Auch speaking in Eau Claire, Wisconsin
Bill Hughes conducting a shale gas field tour
2016 Community Sentinel Award Winners (left to right): Alma Hasse, Alex Lotorto, and Vera Scroggins in Washington, DC

12 13Annual Report 2016 Annual Report 2016
• Arnold G, Nguyen Long LA, Gottlieb M. Social Networks and Policy Entrepreneurship: How Relationships Shape Municipal Decision Making about High-Volume Hydraulic Fracturing, PSJ
• Boslett AJ. Valuation of Unconventional Oil and Gas Development. University of Rhode Island, Dissertation
• Clarke CE, et al. How geographic distance and political ideology interact to influence public perception of unconventional oil/natural gas development. Energy Policy
• Clough E, Bell D. Just fracking: a distributive environmental justice analysis of unconventional gas development in Pennsylvania, USA. Environmental Research Letters
• Guo M et al. Prospects for shale gas production in China: Implications for water demand, Renewable and Sustainable Energy Reviews
• Khyade VB. Hydraulic Fracturing; Environmental Issue. World Scientific News• Lambert HAB. Whose Water Is It? American Journal of Economics and Sociology• Oil Change International et al. A Bridge Too Far. How Appalachian Basin Gas Pipeline Expansion Will
Undermine U.S. Climate Goals, report• Ridlington E, Norman K, Richardson R. Fracking by the Numbers. Environment America report• Singla S, et al. Growth and Yield of Guar (Cyamopsis tetragonoloba L.) Genotypes under Different
Planting Dates in the Semi-Arid Southern High Plains. American Journal of Plant Sciences• Steinzor N. Community Air Monitoring of Oil and Gas Pollution: A survey of issues and technologies.
Earthworks report• Xu J, Nyerges TL. A framework for user-generated geographic content acquisition in an age of
crowdsourcing. Cartography and Geographic Information Science
View all citations here: fractracker.org/about-us/kudos
Featured Publications
FracTracker’s online analyses, photos, and maps were featured in 23 studies and
peer-reviewed publications in 2016, the most citations we have received to-date.
Here is a selection of those reports from 2016:
Mapping How To’sWe understand not everyone shares the same passion that we do for mapping oil and gas data, but we want to make sure you can get the most out of the maps we create. Explore this short tutorial on working with our online, dynamic maps:
Top Toolbar (Left to Right):1. Details – Use this section to learn about the map and its data.2. Legend – Discover what the various symbols on the map mean. (On the PA map above, you can see
violations, drilled wells, permits, compressor stations, pits, and counties).3. Print – Export the map as seen on the screen in a variety of file types, such as JPG and PDF files, and
different resolutions.4. Layers – Toggle layers off to hide them from view.5. Basemap – Change the background image behind the data, such as Street View or Topographic.6. Measure – Quantify an area or distance, or determine the latitude and longitude of a specific point. 7. Bookmarks – Save a spot on the map to refer to later.8. Share – Post a map on social media, or share via email.9. Search box – Find an area on the map, such as an address.Learn more about how to work with our maps here: fractracker.org/resources/how-fractracker-works
DID YOU KNOW?Based on data from 2014-2015, 34 states saw drilling activity, amounting to ~1.2 million active
facilities across the U.S. Learn more: fractracker.org/34-states-active-drilling-2016

14 15Annual Report 2016 Annual Report 2016
Major Update to the FracTracker Mobile App
The oil and gas industry - from its wells to pipelines to refineries - has a variety of ways of impacting the communities and environment that surround its infrastructure. Given the scope of the industry, it’s almost impossible to cumulatively see how oil and gas affects people and for them to share their experiences with others. Until now. FracTracker is excited to announce that in May 2017 we will be releasing a completely rebuilt and significantly improved frack-tracking mobile app. This app can serve as a documenting and tracking tool for reporters, residents, researchers, and groups concerned about oil and gas and its impacts. In addition to an improved oil and gas map with pipelines, we will be adding an activity feed of recent submissions and a profile feature. Learn more: fractracker.org/apps
Future Work
Despite the pro-drilling stance of the new administration in Washington, we are energized to be a force for good in 2017. Here’s what we plan to do:
FracTracker mobile app update due out May 2017
The New Year opened with a jolt felt around the world as the new American president wasted no time in beginning a full assault on institutions and regulations that protect human and environmental health. While daunting and disturbing, we know we can help resist these unscrupulous actions with action of our own. In concert with allied organizations, activists, and researchers, we’re resisting by assisting with critical maps, data, and information.
In 2017, FracTracker will expose planned pipelines and infrastructure and the community pushback against these deleterious projects. We will shed more light on the renewable energy revolution underway and do more unveiling of the realities of injection wells, earthquakes and the growing stream of
fracking waste. The risks to ecosystems, air quality, water sources, food supplies, and human health shall receive additional investigation by our staff. Our collaborative work will continue to empower partners, and our upgraded mobile app will unleash their power like never before.
To sustain our pivotal work, we aim to grow our community of individual donors and strengthen and expand relationships with private foundations. We hope to multiply receipt of fees for services to mission-aligned groups with projects requiring substantial technical input. Our annual fund goal will also increase - all to assure that FracTracker has necessary resources to meet financial obligations, today and tomorrow.
Activity Feed Map with Pipelines User Profile

16 17Annual Report 2016 Annual Report 2016
Growth Statistics
FracTracker.org
As of December 2016, FracTracker.org has hosted ~666,500 sessions (or visits) surpassing our goal of 650,000 cumulative visitors since we first began tracking this metric using Google Analytics in December 2011. Of these visits, 491,000 have been unique visitors.
The majority of visitors originate from the United States (88%), with smaller amounts in decreasing order from Canada, the UK, Germany, India, and Australia. Within the U.S., visitors originate primarily from Pennsylvania (17%), then New York (10%), Texas (9%), California (8.6%), Ohio (7%), and Colorado (4%).
We also have analytic data on the Oil and Gas Threat Map project that we co-launched with Earthworks in June 2016 (oilandgasthreatmap.com). In total, this website has already seen ~49,400 sessions (40,700 unique users). Examining these two sites’ metrics in aggregate increases FracTracker’s total web visitors to 715,900 sessions and 531,700 unique visitors.
715,900CUMULATIVE SESSIONS
531,700UNIQUE VISITORS
88%UNITED STATES
Social Media Reach
In 2016, FracTracker’s Facebook page saw a net increase of 424 likes (from 1,710 to 2,134) On average per month without paid advertising, our posts reach ~13,000 people, and engage almost 1,400 people. We have experimented with paid advertising or promotions, but have not found this method to be extremely helpful in increasing page likes or engagement. We will continue to explore this option in the future based on our organization’s needs and content produced.
Our Twitter account (@FracTracker) has also seen a moderate increase in net followers this year, from 2,189 to 2,476 (increase of 287 followers).
2,134FRIENDS
2,476FOLLOWERS
In the News
In the last year we have seen a substantial increase in FracTracker’s ability to reach out to news media, and in their utilization of our work and resources. We were mentioned 146 times by media outlets across the globe, amounting to a total circulation of 265,600,000. Our media coverage ranged from local newspapers such as the Pittsburgh Post-Gazette, to popular press outlets such as Grist, to international news outlets like Bloomberg and The Guardian.
Read more about where FracTracker appears in the news by visiting our website: fractracker.org/about-us/in-the-news

18 19Annual Report 2016 Annual Report 2016
Meet the Staff
2016 Interns Academic Institution FracTracker Position Office
Michael BilskiGrand Valley State University, Natural Resources Management
Spring Data and GIS Intern Cleveland, OH
Wen-ting (Wendy) Fan
The George Washington University, Milken Institute School of Public Health, Environmental Health Science and Policy
Spring Communications Intern
Washington, DC
Ashlee FlemingHumboldt State University, Department of Geography
Spring Data and GIS Intern Pittsburgh, PA
Leann LeiterNorthern Arizona University, School of Social and Behavioral Sciences
2016-17 Environmental Health Fellow with SWPA Environmental Health Project
Pittsburgh, PA
Daniel MenzaUniversity of California Berkeley, Environmental Science
Fall Data and GIS Intern Oakland, CA
Nathan OnThe Ohio State University, Geographic Information Systems
Fall Data and GIS Intern Cleveland, OH
Sierra ShamerUniversity of Maryland, Geography and Environmental Systems
Spring and Summer Visiting Scholar (GIS)
Remote
Susan Volz Drexel University, M.S. Public Policy '17Fall Social and Community Issues Research Intern
Pittsburgh, PA
FracTracker’s interns worked on a number of research topics with us in 2016, from pipeline buildouts to populations affected by refinery emissions. Thank you very much to the following diligent interns for contributing your time and energy to these important issues:
Internships with FracTracker offer students invaluable resume-building work
experience and networking opportunities. Not only do interns work closely with
members of our team, but they also have the opportunity to learn about and
contribute to many aspects of our work. Learn more about our paid and unpaid
internship opportunities: fractracker.org/about-us/internships
Intern Support
Karen Edelstein, MPSEastern Program Coordinator Ithaca, NY
FracTracker Alliance has some very dedicated and passionate staff. Get to know them! View their biographies and recent articles online: fractracker.org/about-us/staffbios
Bill HughesWest Virginia Community Liaison Wetzel County, WV
Ted Auch, PhDGreat Lakes Program Coordinator Cleveland, OH
Kyle Ferrar, MPHWestern Program Coordinator Oakland, CA
Kirk Jalbert, PhD, MFAManager of Community-Based Research & Engagement Pittsburgh, PA
Matt KelsoManager of Data & Technology Pittsburgh, PA
Brook Lenker, MAExecutive Director Camp Hill, PA
Rebecca Vollmer, PhDManager of Development Camp Hill, PA
Gwen Lehman, AHSManager of Operations Camp Hill, PA
Sam Rubright, DrPH, CPHManager of Communications & Partnerships Washington, DC
20 21Annual Report 2016 Annual Report 2016
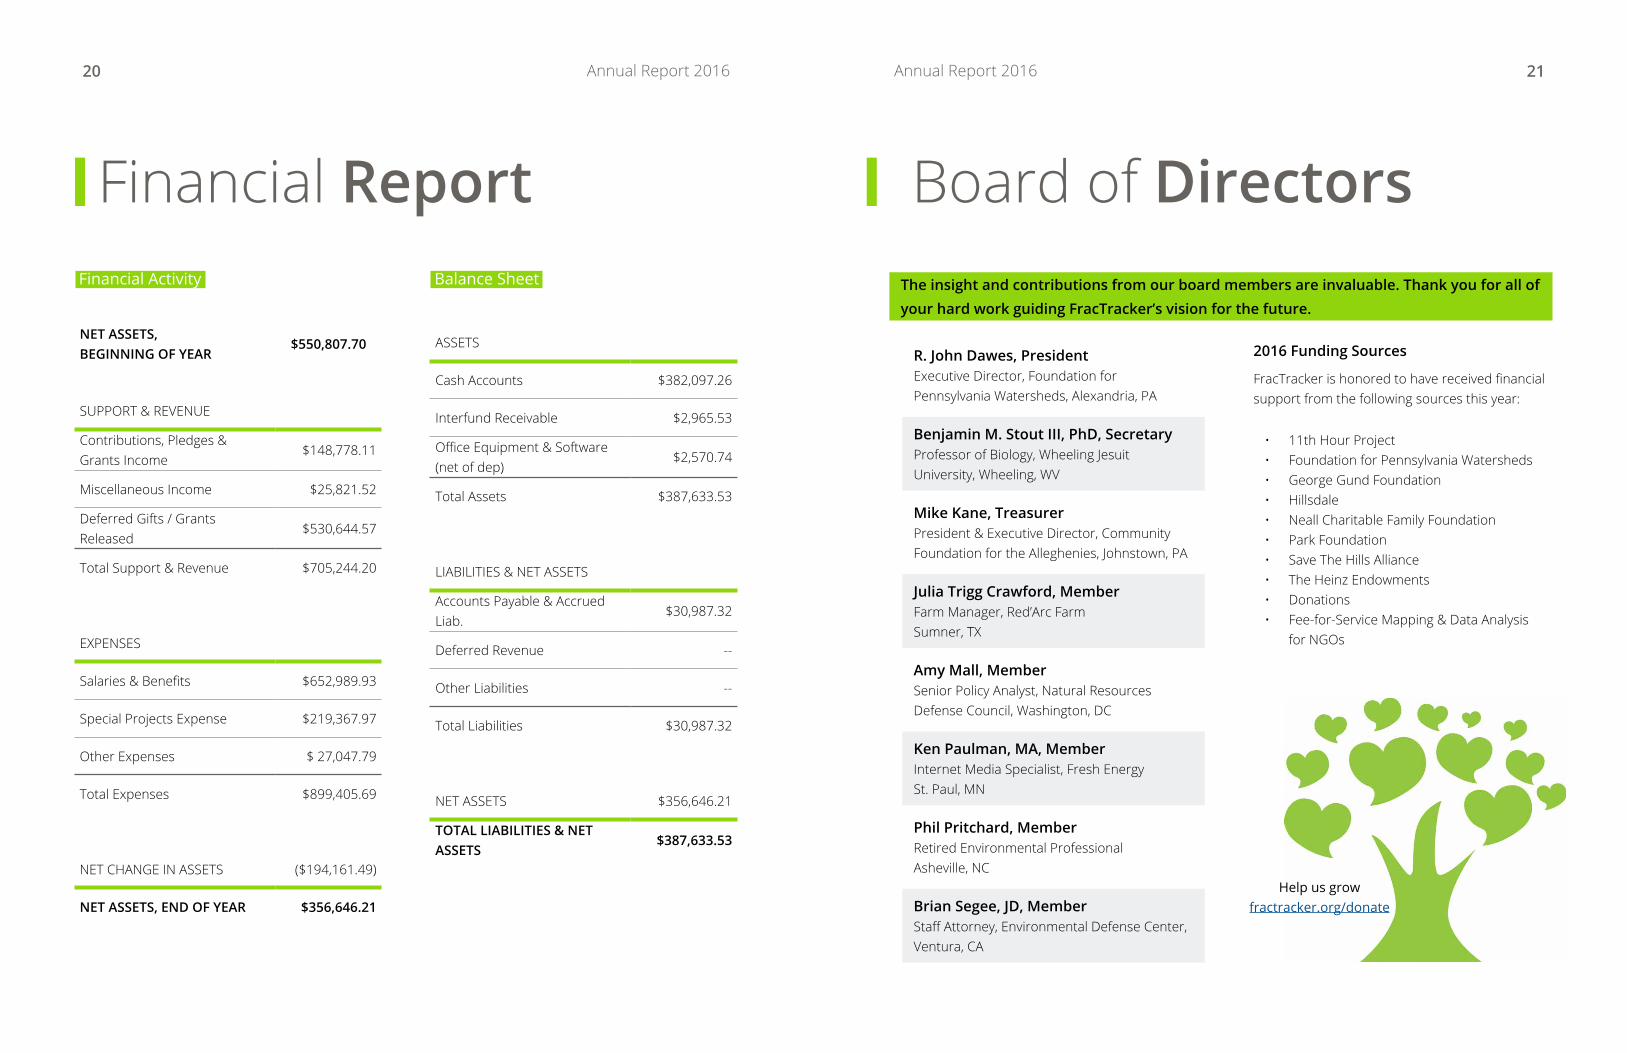
Financial Report
2016 Funding Sources
Help us grow fractracker.org/donate
Board of Directors
Mike Kane, TreasurerPresident & Executive Director, Community Foundation for the Alleghenies, Johnstown, PA
Julia Trigg Crawford, MemberFarm Manager, Red’Arc FarmSumner, TX
Amy Mall, Member Senior Policy Analyst, Natural Resources Defense Council, Washington, DC
Ken Paulman, MA, MemberInternet Media Specialist, Fresh EnergySt. Paul, MN
The insight and contributions from our board members are invaluable. Thank you for all of your hard work guiding FracTracker’s vision for the future.
R. John Dawes, PresidentExecutive Director, Foundation for Pennsylvania Watersheds, Alexandria, PA
Benjamin M. Stout III, PhD, SecretaryProfessor of Biology, Wheeling Jesuit University, Wheeling, WV
Phil Pritchard, MemberRetired Environmental ProfessionalAsheville, NC
Brian Segee, JD, MemberStaff Attorney, Environmental Defense Center, Ventura, CA
NET ASSETS, BEGINNING OF YEAR
$550,807.70
SUPPORT & REVENUE
Contributions, Pledges & Grants Income
$148,778.11
Miscellaneous Income $25,821.52
Deferred Gifts / Grants Released
$530,644.57
Total Support & Revenue $705,244.20
EXPENSES
Salaries & Benefits $652,989.93
Special Projects Expense $219,367.97
Other Expenses $ 27,047.79
Total Expenses $899,405.69
NET CHANGE IN ASSETS ($194,161.49)
NET ASSETS, END OF YEAR $356,646.21
Financial Activity
• 11th Hour Project• Foundation for Pennsylvania Watersheds• George Gund Foundation• Hillsdale• Neall Charitable Family Foundation• Park Foundation• Save The Hills Alliance• The Heinz Endowments• Donations• Fee-for-Service Mapping & Data Analysis
for NGOs
FracTracker is honored to have received financial support from the following sources this year:
ASSETS
Cash Accounts $382,097.26
Interfund Receivable $2,965.53
Office Equipment & Software (net of dep)
$2,570.74
Total Assets $387,633.53
LIABILITIES & NET ASSETS
Accounts Payable & Accrued Liab.
$30,987.32
Deferred Revenue --
Other Liabilities --
Total Liabilities $30,987.32
NET ASSETS $356,646.21
TOTAL LIABILITIES & NET ASSETS
$387,633.53
Balance Sheet

FracTracker Alliance 2016 Annual Report
1845 Market St, Ste 204 Camp Hill, PA 17011
+1 717 303 [email protected] www.fractracker.org Printed on recycled paper
Above: Stringing out pipe and pipe being laid into the previously dug trench in WV. Photo by Bill Hughes, Ohio Valley Environmental Coalition, June 2016
Cover: Frac sand mine in LaSalle County, IL. Photo by Ted Auch. Aerial assistance provided by the non-profit pilot collaborative, LightHawk: lighthawk.org
We appreciate the many brave people and bold organizations fighting for a better energy future. They need your support, and so does FracTracker. Please consider making a donation to our Annual Fund! To sustain our meaningful, empowering work, we need you! fractracker.org/about-us/donate