alaama’s report ard prototypes - alsde.edu technical guide january 2018.… · letter grade page...
TRANSCRIPT

ALABAMA’S REPORT CARD PROTOTYPES
2016-2017 SCHOOL YEAR DATA TECHNICAL GUIDE
RELEASED JANUARY 2018

I
Table of Contents
To Our Stakeholders __________________________________________________________________________________ 1
Alabama’s Report Card Law
Our Goal
Indicators for January 2018 ___________________________________________________________________________ 2
Schools Without a Grade 12
Schools With a Grade 12
Systems
State
Letter Grade _____________________________________________________________________________________________ 3
Schools Without a Grade 12
Schools With a Grade 12
Systems
State
Alabama's Report Card Grading Scale _______________________________________________________________ 5
Indicator Descriptors __________________________________________________________________________________ 6
Academic Achievement
Academic Growth
Graduation Rate
College and Career Readiness
Chronic Absenteeism
Full Academic Year (FAY) Students ___________________________________________________________________ 8
Indicator Calculations __________________________________________________________________________________ 9
Academic Achievement (Schools Without a Grade 12 & Schools With a Grade 12)
Academic Growth (Schools Without a Grade 12 & Schools With a Grade 12)
Graduation Rate (Schools With a Grade 12)
College and Career Readiness (CCR) (Schools With a Grade 12)
Chronic Absenteesim (Schools Without a Grade 12 & Schools With a Grade 12)
II
Alabama State Department of Education, Accountability Section _____________________________ 12
Appendix A _____________________________________________________________________________________________ 13
Schools Without a Grade 12 Report Card
Schools With a Grade 12 Report Card
Appendix B _____________________________________________________________________________________________ 15
Indicator Percentages
Glossary ________________________________________________________________________________________________ 16

TO OUR STAKEHOLDERS
Page 1 of 18
To Our Stakeholders
ALABAMA’S REPORT CARD LAW
Alabama Act No. 2012-402, requires the State Superintendent of Education to develop a school grading system
reflective of school and district performance.
This law requires the state to use state-authorized assessments and other key performance indicators that give a total
profile of the school or school system, or both. A school’s grade, at a minimum shall be based on a combination of
Academic Achievement, Academic Growth, Graduation Rate (for schools with a grade 12), College and Career
Readiness (for schools with a grade 12), and Chronic Absenteeism.
The letter grade, given in January 2018, is based on the total points earned for each indicator. Additional data has
been added based on student engagement however, this data is not used in the calculation of the actual letter grade.
OUR GOAL
The goal of the Alabama State Department of Education Accountability Section is to present to stakeholders the data
required by the Alabama Report Card Law in an easily accessed and transparent manner.

INDICATORS FOR JANUARY 2018
Page 2 of 18
Indicators for January 2018
For January 2018, the Alabama Report Card will consist of the following indicators:
SCHOOLS WITHOUT A GRADE 12
Academic Achievement (Weighted)
Academic Growth (Weighted)
Chronic Absenteeism
SCHOOLS WITH A GRADE 12
Academic Achievement (Weighted)
Academic Growth (Weighted)
Graduation Rate
College and Career Readiness
Chronic Absenteeism
SYSTEMS
Academic Achievement (Weighted)
Academic Growth (Weighted)
Graduation Rate
College and Career Readiness
Chronic Absenteeism
STATE
Academic Achievement (Weighted)
Academic Growth (Weighted)
Graduation Rate
College and Career Readiness
Chronic Absenteeism
*Student Engagement is self-reported and is displayed for schools, systems and the state.
*Financial data is displayed for schools, systems and the state.

LETTER GRADE
Page 3 of 18
Letter Grade
The letter grade will be comprised of the individual Indicator Scores that compose the Alabama Report Card. The
letter grade will be calculated as follows:
SCHOOLS WITHOUT A GRADE 12
The letter grade will be calculated based on the following “Percent of Scores”:
INDICATOR(S) PERCENT OF SCORE
Academic Achievement (Weighted) 40%
Academic Growth (Weighted) 50%
Chronic Absenteeism 10%
Each Indicator Score will be multiplied by the indicated “Percent of Score”. The products will then be summed in
order to obtain a numerical score. The numerical score will be matched to a grading scale and the resulting letter
grade will be displayed on the Alabama Report Card.
SCHOOLS WITH A GRADE 12
The letter grade will be calculated based on the following “Percent of Scores”:
INDICATOR(S) PERCENT OF SCORE
Academic Achievement (Weighted) 20%
Academic Growth (Weighted) 30%
Graduation Rate 30%
College and Career Readiness 10%
Chronic Absenteeism 10%
Each Indicator Score will be multiplied by the indicated “Percent of Score”. The products will then be summed in
order to obtain a numerical score. The numerical score will be matched to a grading scale and the resulting letter
grade will be displayed on the Alabama Report Card.
I. If a school or system does not have a graduating class, the percent for Graduation Rate and CCR will be evenly divided between Academic
Achievement and Academic Growth, making Achievement 40% and Growth 50%.
II. If a school does not have a 5-year Cohort Graduation Rate, the entire Graduation Rate Indicator Score will be from the 4-year Cohort.
III. Indicator Scores are capped at 100.

LETTER GRADE
Page 4 of 18
SYSTEMS
The letter grade will be calculated based on the following “Percent of Scores”:
INDICATOR(S) PERCENT OF SCORE
Academic Achievement (Weighted) 20%
Academic Growth (Weighted) 30%
Graduation Rate 30%
College and Career Readiness 10%
Chronic Absenteeism 10%
Each Indicator Score will be multiplied by the indicated “Percent of Score”. The products will then be summed in order
to obtain a numerical score. The numerical score will be matched to a grading scale and the resulting letter grade will
be displayed on the Alabama Report Card.
STATE
The letter grade will be calculated based on the following “Percent of Scores”:
INDICATOR(S) PERCENT OF SCORE
Academic Achievement (Weighted) 20%
Academic Growth (Weighted) 30%
Graduation Rate 30%
College and Career Readiness 10%
Chronic Absenteeism 10%
Each Indicator Score will be multiplied by the indicated “Percent of Score”. The products will then be summed in order
to obtain a numerical score. The numerical score will be matched to a grading scale and the resulting letter grade will
be displayed on the Alabama Report Card.
ALABAMA’S REPORT CARD PROTOTYPE GRADING SCALE
Page 5 of 18
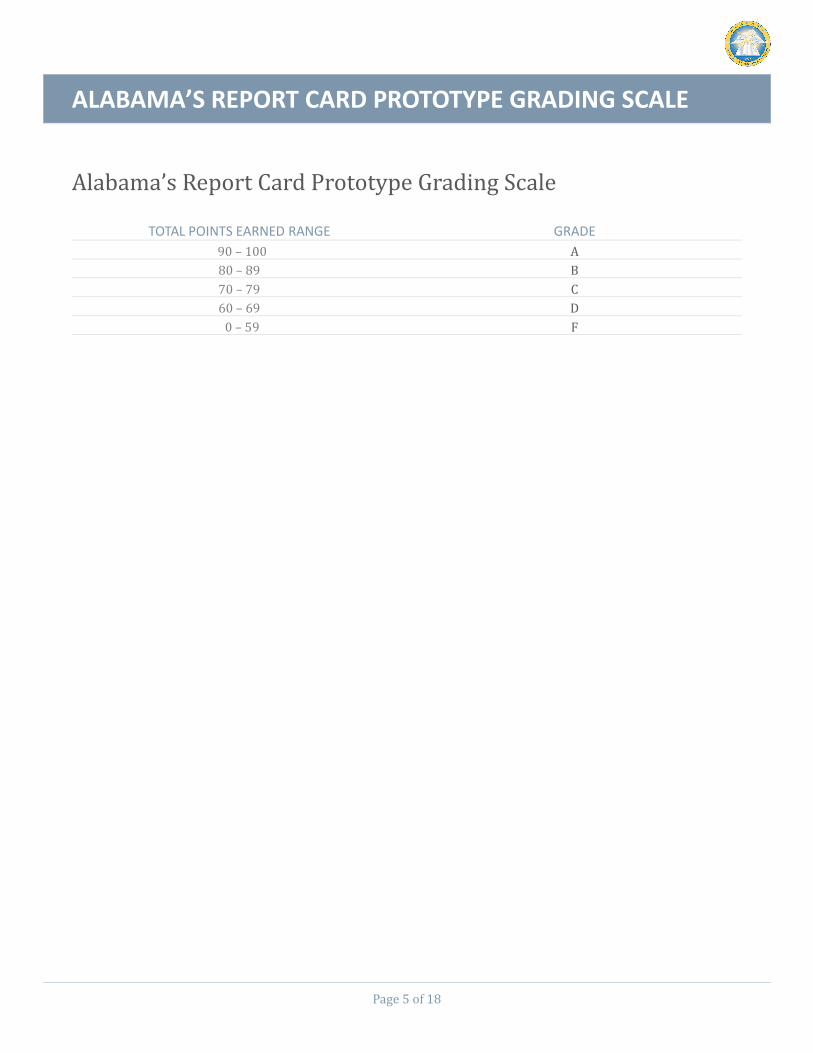
Alabama’s Report Card Prototype Grading Scale
TOTAL POINTS EARNED RANGE GRADE
90 – 100 A
80 – 89 B
70 – 79 C
60 – 69 D
0 – 59 F

INDICATOR DESCRIPTORS
Page 6 of 18
Indicator Descriptors
ACADEMIC ACHIEVEMENT
Determined based on the percentage of proficient students in the areas of reading and math utilizing assessments in
tested grades.
The Academic Achievement Indicator Score is based on weighted achievement levels in reading and math as outlined
in the table below.
ACHIEVEMENT LEVEL WEIGHT
Level I 0
Level II 0.50
Level III 1.00
Level IV 1.25
Academic Achievement scores reported in January 2018 are based on 2016-2017 data for students in grades 3-8 and
10 from the ACT Aspire, the Alabama Alternate Assessment (AAA), and Scantron (for Florence City Schools).
ACADEMIC GROWTH
Determined based on individual students who demonstrate improvement in reading and math from one year to the
next using multiple years of data.
The Academic Growth Indicator Score is based on the weighted growth categories outlined in the table below.
GROWTH CATEGORY WEIGHT
Low (L) 0
Average (A) 1.00
High (H) 1.50
Academic Growth scores reported in January 2018 are based on 2016-2017 data for students in grades 4-8 and 10
from the ACT Aspire and Scantron (for Florence City Schools).

INDICATOR DESCRIPTORS
Page 7 of 18
GRADUATION RATE
Determined based on the percentage of high school students who graduated within 4 or 5 years of first entering the 9th
grade.
COHORT PERCENTAGE
4-Year 80%
5-Year 20%
The 4-Year Graduation Cohort for the January 2018 report card is calculated 1 year in arrears. The 5-Year Graduation
Cohort for the January 2018 report card is calculated 2 years in arrears.
COLLEGE AND CAREER READINESS
Determined based on the percentage of students in the 4-year cohort who met at least one of the College and Career
Readiness Indicators.
The College and Career Readiness Indicators are:
Benchmark on any ACT Subtest
Qualifying Score on AP or IB Exam
Military Enlistment
Approved Transcript College or Postsecondary Credit While in High School
Silver Level or Higher on the ACT WorkKeys
Approved Industry Credentials
CHRONIC ABSENTEEISM
Determined based on the percent of students who missed 15 or more days (both excused and unexcused). Chronic Absenteeism points are based on students present (by subtracting the Chronic Absenteeism Indicator Score from 100 before multiplying by the Chronic Absenteeism weight).

FULL ACADEMIC YEAR (FAY) STUDENTS
Page 8 of 18
Full Academic Year (FAY) Students
Only those students who are considered FAY are used to calculate the indicator scores for Academic
Achievement and Academic Growth.
o Students are considered FAY for a school if they are listed on both the Fall Attendance Extract and the
9th Month Attendance Extract for a school without a break in enrollment at any time between the two
extracts.
o Students are considered FAY for system calculations if they remain in a school within the system the
entire year or if they transfer between schools within their system only.
o The State of Alabama uses all students enrolled for calculating Academic Achievement and Academic
Growth at the state level.
INDICATOR CALCULATIONS FOR THE JANUARY 2018 REPORT CARD PROTOTYPE
Page 9 of 18
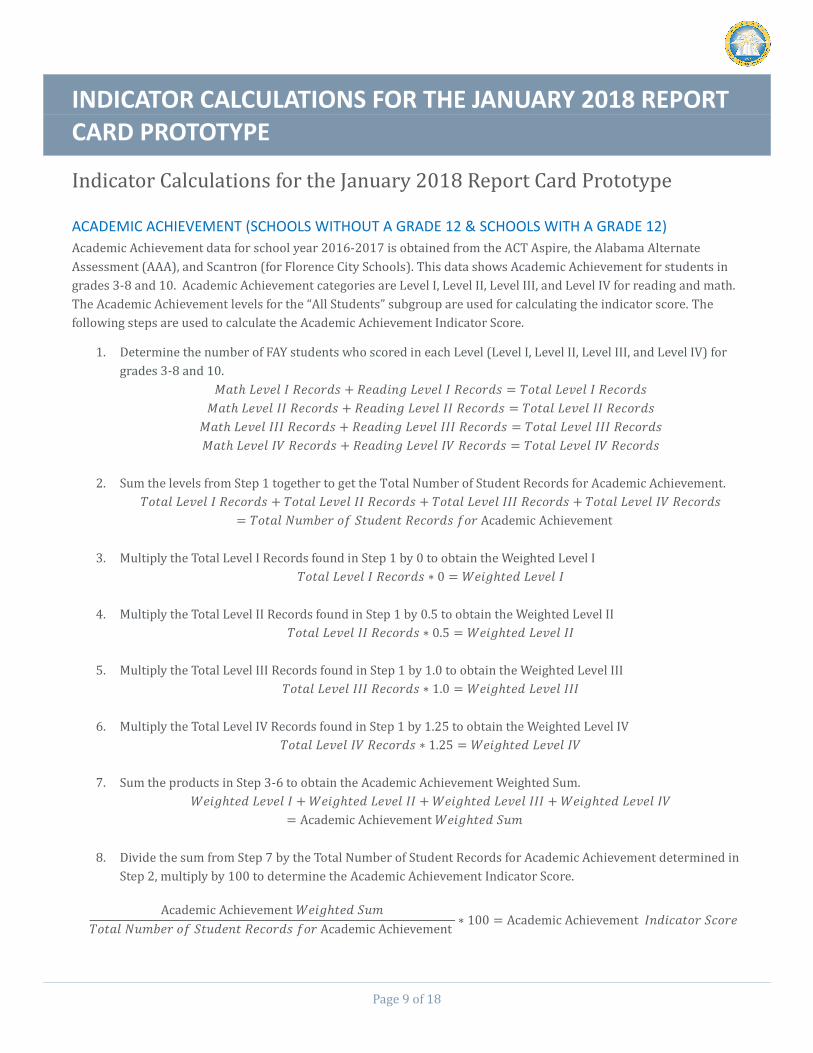
Indicator Calculations for the January 2018 Report Card Prototype
ACADEMIC ACHIEVEMENT (SCHOOLS WITHOUT A GRADE 12 & SCHOOLS WITH A GRADE 12)
Academic Achievement data for school year 2016-2017 is obtained from the ACT Aspire, the Alabama Alternate
Assessment (AAA), and Scantron (for Florence City Schools). This data shows Academic Achievement for students in
grades 3-8 and 10. Academic Achievement categories are Level I, Level II, Level III, and Level IV for reading and math.
The Academic Achievement levels for the “All Students” subgroup are used for calculating the indicator score. The
following steps are used to calculate the Academic Achievement Indicator Score.
1. Determine the number of FAY students who scored in each Level (Level I, Level II, Level III, and Level IV) for
grades 3-8 and 10.
𝑀𝑎𝑡ℎ 𝐿𝑒𝑣𝑒𝑙 𝐼 𝑅𝑒𝑐𝑜𝑟𝑑𝑠 + 𝑅𝑒𝑎𝑑𝑖𝑛𝑔 𝐿𝑒𝑣𝑒𝑙 𝐼 𝑅𝑒𝑐𝑜𝑟𝑑𝑠 = 𝑇𝑜𝑡𝑎𝑙 𝐿𝑒𝑣𝑒𝑙 𝐼 𝑅𝑒𝑐𝑜𝑟𝑑𝑠
𝑀𝑎𝑡ℎ 𝐿𝑒𝑣𝑒𝑙 𝐼𝐼 𝑅𝑒𝑐𝑜𝑟𝑑𝑠 + 𝑅𝑒𝑎𝑑𝑖𝑛𝑔 𝐿𝑒𝑣𝑒𝑙 𝐼𝐼 𝑅𝑒𝑐𝑜𝑟𝑑𝑠 = 𝑇𝑜𝑡𝑎𝑙 𝐿𝑒𝑣𝑒𝑙 𝐼𝐼 𝑅𝑒𝑐𝑜𝑟𝑑𝑠
𝑀𝑎𝑡ℎ 𝐿𝑒𝑣𝑒𝑙 𝐼𝐼𝐼 𝑅𝑒𝑐𝑜𝑟𝑑𝑠 + 𝑅𝑒𝑎𝑑𝑖𝑛𝑔 𝐿𝑒𝑣𝑒𝑙 𝐼𝐼𝐼 𝑅𝑒𝑐𝑜𝑟𝑑𝑠 = 𝑇𝑜𝑡𝑎𝑙 𝐿𝑒𝑣𝑒𝑙 𝐼𝐼𝐼 𝑅𝑒𝑐𝑜𝑟𝑑𝑠
𝑀𝑎𝑡ℎ 𝐿𝑒𝑣𝑒𝑙 𝐼𝑉 𝑅𝑒𝑐𝑜𝑟𝑑𝑠 + 𝑅𝑒𝑎𝑑𝑖𝑛𝑔 𝐿𝑒𝑣𝑒𝑙 𝐼𝑉 𝑅𝑒𝑐𝑜𝑟𝑑𝑠 = 𝑇𝑜𝑡𝑎𝑙 𝐿𝑒𝑣𝑒𝑙 𝐼𝑉 𝑅𝑒𝑐𝑜𝑟𝑑𝑠
2. Sum the levels from Step 1 together to get the Total Number of Student Records for Academic Achievement.
𝑇𝑜𝑡𝑎𝑙 𝐿𝑒𝑣𝑒𝑙 𝐼 𝑅𝑒𝑐𝑜𝑟𝑑𝑠 + 𝑇𝑜𝑡𝑎𝑙 𝐿𝑒𝑣𝑒𝑙 𝐼𝐼 𝑅𝑒𝑐𝑜𝑟𝑑𝑠 + 𝑇𝑜𝑡𝑎𝑙 𝐿𝑒𝑣𝑒𝑙 𝐼𝐼𝐼 𝑅𝑒𝑐𝑜𝑟𝑑𝑠 + 𝑇𝑜𝑡𝑎𝑙 𝐿𝑒𝑣𝑒𝑙 𝐼𝑉 𝑅𝑒𝑐𝑜𝑟𝑑𝑠
= 𝑇𝑜𝑡𝑎𝑙 𝑁𝑢𝑚𝑏𝑒𝑟 𝑜𝑓 𝑆𝑡𝑢𝑑𝑒𝑛𝑡 𝑅𝑒𝑐𝑜𝑟𝑑𝑠 𝑓𝑜𝑟 Academic Achievement
3. Multiply the Total Level I Records found in Step 1 by 0 to obtain the Weighted Level I
𝑇𝑜𝑡𝑎𝑙 𝐿𝑒𝑣𝑒𝑙 𝐼 𝑅𝑒𝑐𝑜𝑟𝑑𝑠 ∗ 0 = 𝑊𝑒𝑖𝑔ℎ𝑡𝑒𝑑 𝐿𝑒𝑣𝑒𝑙 𝐼
4. Multiply the Total Level II Records found in Step 1 by 0.5 to obtain the Weighted Level II
𝑇𝑜𝑡𝑎𝑙 𝐿𝑒𝑣𝑒𝑙 𝐼𝐼 𝑅𝑒𝑐𝑜𝑟𝑑𝑠 ∗ 0.5 = 𝑊𝑒𝑖𝑔ℎ𝑡𝑒𝑑 𝐿𝑒𝑣𝑒𝑙 𝐼𝐼
5. Multiply the Total Level III Records found in Step 1 by 1.0 to obtain the Weighted Level III
𝑇𝑜𝑡𝑎𝑙 𝐿𝑒𝑣𝑒𝑙 𝐼𝐼𝐼 𝑅𝑒𝑐𝑜𝑟𝑑𝑠 ∗ 1.0 = 𝑊𝑒𝑖𝑔ℎ𝑡𝑒𝑑 𝐿𝑒𝑣𝑒𝑙 𝐼𝐼𝐼
6. Multiply the Total Level IV Records found in Step 1 by 1.25 to obtain the Weighted Level IV
𝑇𝑜𝑡𝑎𝑙 𝐿𝑒𝑣𝑒𝑙 𝐼𝑉 𝑅𝑒𝑐𝑜𝑟𝑑𝑠 ∗ 1.25 = 𝑊𝑒𝑖𝑔ℎ𝑡𝑒𝑑 𝐿𝑒𝑣𝑒𝑙 𝐼𝑉
7. Sum the products in Step 3-6 to obtain the Academic Achievement Weighted Sum.
𝑊𝑒𝑖𝑔ℎ𝑡𝑒𝑑 𝐿𝑒𝑣𝑒𝑙 𝐼 + 𝑊𝑒𝑖𝑔ℎ𝑡𝑒𝑑 𝐿𝑒𝑣𝑒𝑙 𝐼𝐼 + 𝑊𝑒𝑖𝑔ℎ𝑡𝑒𝑑 𝐿𝑒𝑣𝑒𝑙 𝐼𝐼𝐼 + 𝑊𝑒𝑖𝑔ℎ𝑡𝑒𝑑 𝐿𝑒𝑣𝑒𝑙 𝐼𝑉
= Academic Achievement 𝑊𝑒𝑖𝑔ℎ𝑡𝑒𝑑 𝑆𝑢𝑚
8. Divide the sum from Step 7 by the Total Number of Student Records for Academic Achievement determined in
Step 2, multiply by 100 to determine the Academic Achievement Indicator Score.
Academic Achievement 𝑊𝑒𝑖𝑔ℎ𝑡𝑒𝑑 𝑆𝑢𝑚
𝑇𝑜𝑡𝑎𝑙 𝑁𝑢𝑚𝑏𝑒𝑟 𝑜𝑓 𝑆𝑡𝑢𝑑𝑒𝑛𝑡 𝑅𝑒𝑐𝑜𝑟𝑑𝑠 𝑓𝑜𝑟 Academic Achievement ∗ 100 = Academic Achievement 𝐼𝑛𝑑𝑖𝑐𝑎𝑡𝑜𝑟 𝑆𝑐𝑜𝑟𝑒

INDICATOR CALCULATIONS FOR THE JANUARY 2018 REPORT CARD PROTOTYPE
Page 10 of 18
ACADEMIC GROWTH (SCHOOLS WITHOUT A GRADE 12 & SCHOOLS WITH A GRADE 12)
Academic Growth data for the school year 2016-2017 is obtained from the ACT Aspire and Scantron (for Florence City
Schools). This data shows Academic Growth for students in grades 4-8 and 10. The growth categories are Low (L),
Average (A), and High (H) for reading and math. The Academic Growth categories for the “All Students” subgroup are
used for calculating the indicator score. The following steps are used to calculate the Academic Growth Indicator
Score.
1. Determine the number of FAY records in each category Low (L), Average (A), and High (H) for grades 4-8 and
10.
𝑀𝑎𝑡ℎ 𝐿 𝑅𝑒𝑐𝑜𝑟𝑑𝑠 + 𝑅𝑒𝑎𝑑𝑖𝑛𝑔 𝐿 𝑅𝑒𝑐𝑜𝑟𝑑𝑠 = 𝑇𝑜𝑡𝑎𝑙 𝐿 𝑅𝑒𝑐𝑜𝑟𝑑𝑠
𝑀𝑎𝑡ℎ 𝐴 𝑅𝑒𝑐𝑜𝑟𝑑𝑠 + 𝑅𝑒𝑎𝑑𝑖𝑛𝑔 𝐴 𝑅𝑒𝑐𝑜𝑟𝑑𝑠 = 𝑇𝑜𝑡𝑎𝑙 𝐴 𝑅𝑒𝑐𝑜𝑟𝑑𝑠
𝑀𝑎𝑡ℎ 𝐻 𝑅𝑒𝑐𝑜𝑟𝑑𝑠 + 𝑅𝑒𝑎𝑑𝑖𝑛𝑔 𝐻 𝑅𝑒𝑐𝑜𝑟𝑑𝑠 = 𝑇𝑜𝑡𝑎𝑙 𝐻 𝑅𝑒𝑐𝑜𝑟𝑑𝑠
2. Sum the categories from Step 1 together to get the Total Number of Student Records With an Academic
Growth Category.
𝑇𝑜𝑡𝑎𝑙 𝐿 𝑅𝑒𝑐𝑜𝑟𝑑𝑠 + 𝑇𝑜𝑡𝑎𝑙 𝐴 𝑅𝑒𝑐𝑜𝑟𝑑𝑠 + 𝑇𝑜𝑡𝑎𝑙 𝐻 𝑅𝑒𝑐𝑜𝑟𝑑𝑠
= 𝑇𝑜𝑡𝑎𝑙 𝑁𝑢𝑚𝑏𝑒𝑟 𝑜𝑓 𝑆𝑡𝑢𝑑𝑒𝑛𝑡 𝑅𝑒𝑐𝑜𝑟𝑑𝑠 𝑊𝑖𝑡ℎ 𝑎𝑛 Academic 𝐺𝑟𝑜𝑤𝑡ℎ 𝐶𝑎𝑡𝑒𝑔𝑜𝑟𝑦
3. Multiply the Total L Records found in Step 1 by 0 to obtain the Weighted L Category.
𝑇𝑜𝑡𝑎𝑙 𝐿 𝑅𝑒𝑐𝑜𝑟𝑑𝑠 ∗ 0 = 𝑊𝑒𝑖𝑔ℎ𝑡𝑒𝑑 𝐿
4. Multiply the Total A Records found in Step 1 by 1.0 to obtain the Weighted A Category.
𝑇𝑜𝑡𝑎𝑙 𝐴 𝑅𝑒𝑐𝑜𝑟𝑑𝑠 ∗ 1.0 = 𝑊𝑒𝑖𝑔ℎ𝑡𝑒𝑑 𝐴
5. Multiply the Total H Records found in Step 1 by 1.5 to obtain the Weighted H Category.
𝑇𝑜𝑡𝑎𝑙 𝐻 𝑅𝑒𝑐𝑜𝑟𝑑𝑠 ∗ 1.5 = 𝑊𝑒𝑖𝑔ℎ𝑡𝑒𝑑 𝐻
6. Sum the products in Step 3-5 to obtain the Academic Growth Weighted Sum.
𝑊𝑒𝑖𝑔ℎ𝑡𝑒𝑑 𝐿 + 𝑊𝑒𝑖𝑔ℎ𝑡𝑒𝑑 𝐴 + 𝑊𝑒𝑖𝑔ℎ𝑡𝑒𝑑 𝐻 = Academic 𝐺𝑟𝑜𝑤𝑡ℎ 𝑊𝑒𝑖𝑔ℎ𝑡𝑒𝑑 𝑆𝑢𝑚
7. Divide the sum from Step 6 by the Total Number of Student Records With an Academic 𝐺𝑟𝑜𝑤𝑡ℎ Category
determined in Step 2, multiply by 100 to determine the Academic Growth Indicator Score.
Academic 𝐺𝑟𝑜𝑤𝑡ℎ 𝑊𝑒𝑖𝑔ℎ𝑡𝑒𝑑 𝑆𝑢𝑚
𝑇𝑜𝑡𝑎𝑙 𝑁𝑢𝑚𝑏𝑒𝑟 𝑜𝑓 𝑆𝑡𝑢𝑑𝑒𝑛𝑡 𝑅𝑒𝑐𝑜𝑟𝑑𝑠 𝑊𝑖𝑡ℎ 𝑎 𝐴𝑐𝑎𝑑𝑒𝑚𝑖𝑐 𝐺𝑟𝑜𝑤𝑡ℎ 𝐶𝑎𝑡𝑒𝑔𝑜𝑟𝑦 ∗ 100 = Academic 𝐺𝑟𝑜𝑤𝑡ℎ 𝐼𝑛𝑑𝑖𝑐𝑎𝑡𝑜𝑟 𝑆𝑐𝑜𝑟𝑒

INDICATOR CALCULATIONS FOR THE JANUARY 2018 REPORT CARD PROTOTYPE
Page 11 of 18
GRADUATION RATE (SCHOOLS WITH A GRADE 12)
Graduation Rates are retrieved from the Graduation Rate Portal. The 4 −Year Cohort graduation rate and the 5− Year
Cohort graduation rate for the “All Students” subgroup are used for calculating the indicator score.
1. Multiply the 4-Year Graduation Rate by 80%.
4 − 𝑌𝑒𝑎𝑟 𝐶𝑜ℎ𝑜𝑟𝑡 𝐺𝑟𝑎𝑑𝑢𝑎𝑡𝑖𝑜𝑛 𝑅𝑎𝑡𝑒 ∗ .80 = 4 − 𝑌𝑒𝑎𝑟 𝐶𝑜ℎ𝑜𝑟𝑡
2. Multiply the 5-Year Cohort Graduation Rate by 20%.
5 − 𝑌𝑒𝑎𝑟 𝐶𝑜ℎ𝑜𝑟𝑡 𝐺𝑟𝑎𝑑𝑢𝑎𝑡𝑖𝑜𝑛 𝑅𝑎𝑡𝑒 ∗ .20 = 5 − 𝑌𝑒𝑎𝑟 𝐶𝑜ℎ𝑜𝑟𝑡
3. Sum the products from Steps 1 and 2, to determine the Graduation Rate Indicator Score.
4 − 𝑌𝑒𝑎𝑟 𝐶𝑜ℎ𝑜𝑟𝑡 + 5 − 𝑌𝑒𝑎𝑟 𝐶𝑜ℎ𝑜𝑟𝑡 = 𝐺𝑟𝑎𝑑𝑢𝑎𝑡𝑖𝑜𝑛 𝑅𝑎𝑡𝑒 𝐼𝑛𝑑𝑖𝑐𝑎𝑡𝑜𝑟 𝑆𝑐𝑜𝑟𝑒
COLLEGE AND CAREER READINESS (CCR) (SCHOOLS WITH A GRADE 12)
The CCR rate for the “All Students” subgroup is used for calculating the indicator score.
1. Retrieve the students in the 4−Year Graduation Rate Cohort from the College and Career Readiness Portal.
2. Divide the number of students in the 4−Year Graduation Rate Cohort who have met at least one College and
Career Readiness indicators by the number of students in the 4−Year Graduation Rate Cohort, multiply by
100 to determine the College and Career Readiness Indicator Score.
𝑁𝑢𝑚𝑏𝑒𝑟 𝑜𝑓 𝑆𝑡𝑢𝑑𝑒𝑛𝑡𝑠 𝑖𝑛 𝑡ℎ𝑒 4 − 𝑌𝑒𝑎𝑟 𝐶𝑜ℎ𝑜𝑟𝑡 𝑊ℎ𝑜 𝑀𝑒𝑡 𝑎 𝐶𝐶𝑅 𝐼𝑛𝑑𝑖𝑐𝑎𝑡𝑜𝑟
𝑁𝑢𝑚𝑏𝑒𝑟 𝑜𝑓 𝑆𝑡𝑢𝑑𝑒𝑛𝑡𝑠 𝑖𝑛 𝑡ℎ𝑒 4 − 𝑌𝑒𝑎𝑟 𝐶𝑜ℎ𝑜𝑟𝑡∗ 100 = 𝐶𝐶𝑅 𝐼𝑛𝑑𝑖𝑐𝑎𝑡𝑜𝑟 𝑆𝑐𝑜𝑟𝑒
CHRONIC ABSENTEESIM
Chronic Absenteeism is calculated by dividing the number of students on the 9th month attendance report with 15 or more absences (both excused and unexcused) by the number of students on the 9th month attendance student export (all student data file) and multiply the quotient by 100 to determine the Chronic Absenteeism Indicator Score. The Chronic Absenteeism rate for the “All Students” subgroup is used to calculate the indicator score.
*Chronic Absenteeism points are determined by subtracting the percent of chronically absent students from 100 before applying the Chronic Absenteeism Indicator Weight.
𝑵𝒖𝒎𝒃𝒆𝒓 𝒐𝒇 𝑺𝒕𝒖𝒅𝒆𝒏𝒕𝒔 𝒐𝒏 𝒕𝒉𝒆 𝟗𝒕𝒉 𝑴𝒐𝒏𝒕𝒉 𝑨𝒕𝒕𝒆𝒏𝒅𝒂𝒏𝒄𝒆 𝑹𝒆𝒑𝒐𝒓𝒕 𝒘𝒊𝒕𝒉 𝟏𝟓 𝒐𝒓 𝒎𝒐𝒓𝒆 𝑨𝒃𝒔𝒆𝒏𝒄𝒆𝒔
𝑻𝒐𝒕𝒂𝒍 𝑵𝒖𝒎𝒃𝒆𝒓 𝒐𝒇 𝑺𝒕𝒖𝒅𝒆𝒏𝒕𝒔 𝒐𝒏 𝒕𝒉𝒆 𝟗𝒕𝒉 𝑴𝒐𝒏𝒕𝒉 𝑨𝒕𝒕𝒆𝒏𝒅𝒂𝒏𝒄𝒆 𝑺𝒕𝒖𝒅𝒆𝒏𝒕 𝑬𝒙𝒑𝒐𝒓𝒕 ∗ 𝟏𝟎𝟎 = 𝑪𝒉𝒓𝒐𝒏𝒊𝒄 𝑨𝒃𝒔𝒆𝒏𝒕𝒆𝒆𝒊𝒔𝒎 𝑰𝒏𝒅𝒊𝒄𝒂𝒕𝒐𝒓 𝑺𝒄𝒐𝒓𝒆
ALABAMA STATE DEPARTMENT OF EDUCATION, ACCOUNTABILITY SECTION
Page 12 of 18
Alabama State Department of Education, Accountability Section
Alabama State Department of Education, Accountability
5315 Gordon Persons Building
P.O. Box 302101
Montgomery, AL 36130-2101
Tel 331-353-4285
Fax 334.353-4737
www.alsde.edu
APPENDIX A
Page 13 of 18
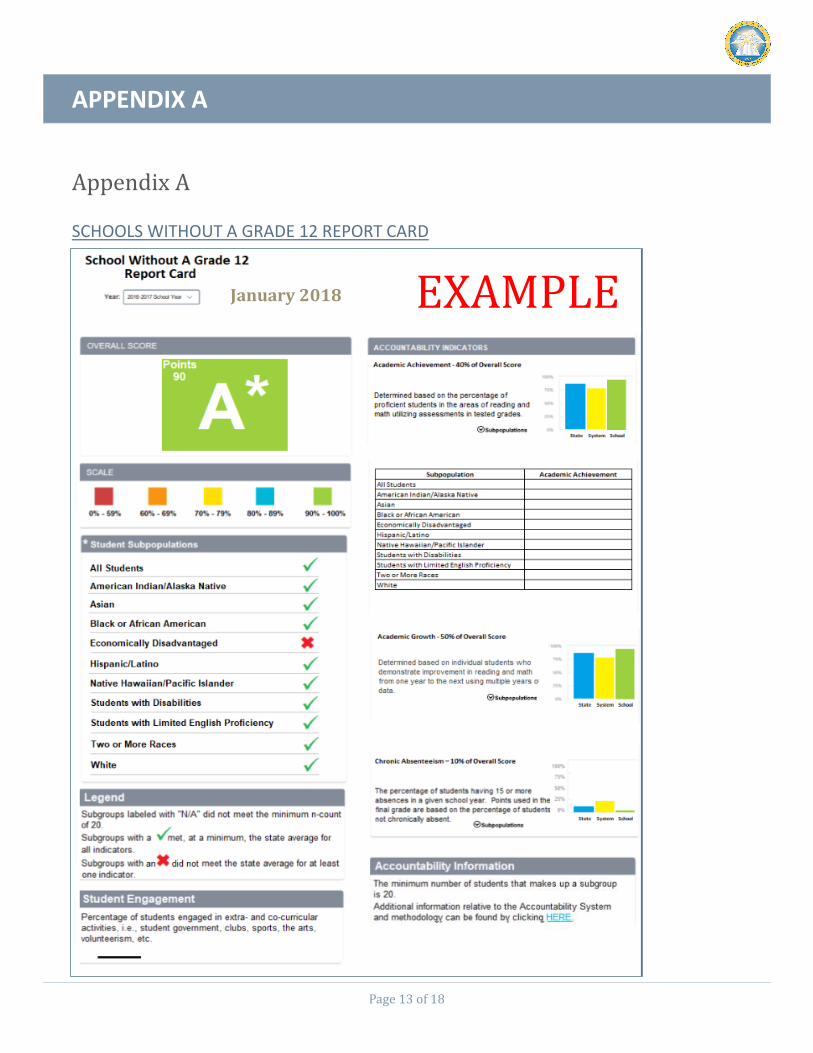
Appendix A
SCHOOLS WITHOUT A GRADE 12 REPORT CARD
January 2018 EXAMPLE
APPENDIX A
Page 14 of 18
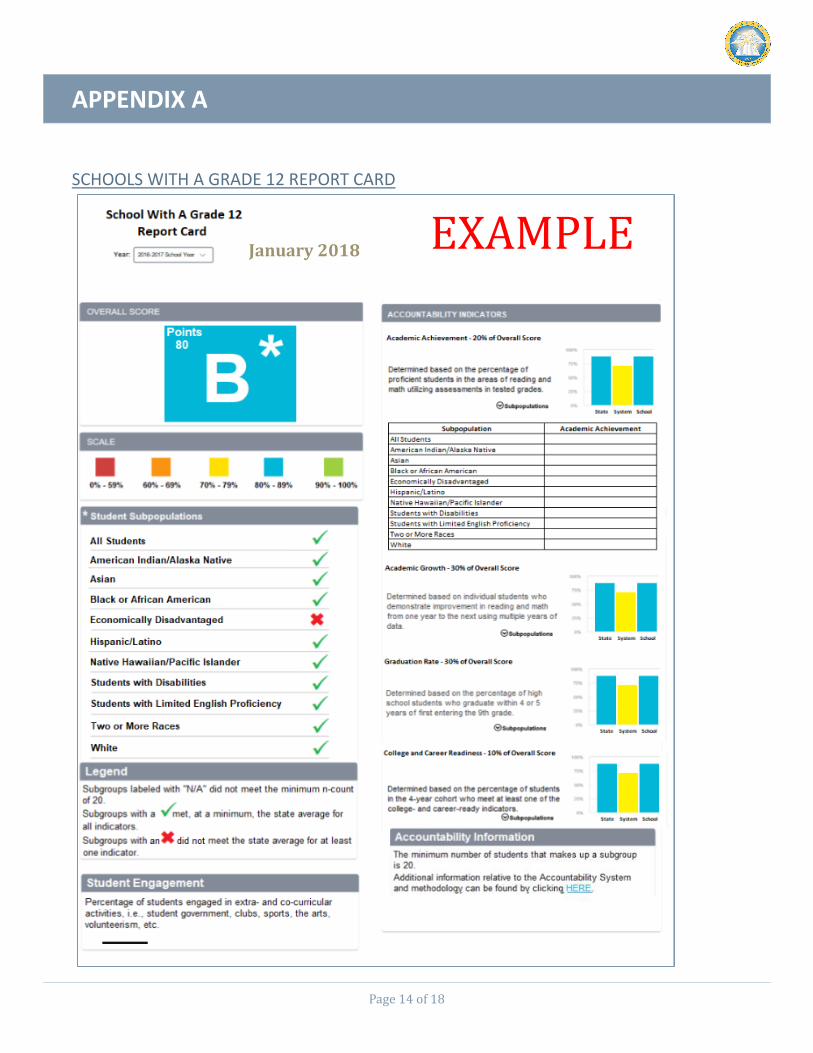
SCHOOLS WITH A GRADE 12 REPORT CARD
January 2018 EXAMPLE

APPENDIX B
Page 15 of 18
Appendix B
INDICATOR PERCENTAGES
Schools Without Grade 12
Academic Achievement (Weighted) 40%
Academic Growth (Weighted) 50%
Chronic Absenteeism 10%
Schools With Grade 12
Academic Achievement (Weighted) 20%
Academic Growth (Weighted) 30%
Graduation Rate 30%
College and Career Readiness 10%
Chronic Absenteeism 10%
Systems
Academic Achievement (Weighted) 20%
Academic Growth (Weighted) 30%
Graduation Rate 30%
College and Career Readiness 10%
Chronic Absenteeism 10%
The State of Alabama
Academic Achievement (Weighted) 20%
Academic Growth (Weighted) 30%
Graduation Rate 30%
College and Career Readiness 10%
Chronic Absenteeism 10%

GLOSSARY
Page 16 of 18
Glossary
Academic Achievement – A report card indicator determined based on the percentage of proficient students in the
areas of reading and math utilizing assessments in tested grades 3-8 and 10.
Academic Growth – A report card indicator determined based on individual students who demonstrate improvement
in reading and math from one year to the next using multiple years of data.
Letter Grade – The alphabetic letter assigned to a school, district or the state that correlates to a grading scale in
order to give a summative indication of the school, district or the state.
Alabama Act No. 2012-402 – Alabama law (commonly referred to as the “Alabama’s Report Card Law) that requires
the State Superintendent of Education to develop a school grading system reflective of school and district
performance.
Chronic Absenteeism – Percent of students who missed a total of 15 or more days (excused or unexcused) of the
school year. Points are based on students present.
College and Career Readiness (CCR) – A report card indicator determined based on the percentage of students in
the 4-year Cohort who met at least one of the CCR indicators.
Full Academic Year (FAY) Students – Those students who are used in the calculation of Academic Achievement and
Academic Growth.
Graduation Rate – A report card indicator determined based on the percentage of high school students who
graduated within 4 or 5 years of first entering the 9th grade.
School Master – The listing of open schools that will receive a report card.