akistan energy crisis breaking the vicious cycle1zhao.rutgers.edu/pakistan-energy-case...
TRANSCRIPT

1
RUTGERS BUSINESS SCHOOL – NEWARK & NEW BRUNSWICK
Pakistan Energy Crisis – Breaking the Vicious Cycle1
“Pakistan has one of world’s biggest untapped coal reserves, …, Pakistan to tap coal riches to avert
energy crisis.” – Reuters, April 13, 2012
1. STARTING STORY
Ali is a plant manager in a large textile firm in Lahore, Punjab province, Pakistan. The textile industry, the back
bone of Pakistan’s economy, had a total export of 5.2 Billion USD in 2010. Ali was educated as a textile engineer
and has ten years of industrial experience. Till 2007, Ali was very satisfied with his career and the industrial
growth in the textile sector. But now things have changed drastically – the textile industry is facing severe
problems due to the power shortages. There are 8-12 hours of electricity load shedding on a daily basis in major
cities and industrial sectors of the county. The textile industry is unable to meet the export targets as the daily
production is disrupted by long hours of electricity shortage. About 28 million people (38% of the total labor
force) associated with the textile sector are facing unemployment due to the power outrage. [1]
The overall economic condition of the country is even worse and it is becoming increasingly difficult for Ali to
cover the expenses of his family of two children. Even with 8-12 hours of electricity load shedding, the electricity
bill has risen to 25% of his monthly salary. The inflation rate has risen to 17% (2010 est.) and the prices for food
items have increased by 33% over a period of two years. Official figures indicate that there is a 20% increase in
crime rate due to the increase in unemployment (15% in 2010, est.). [2]
“Is it better to leave the country as everything seems to be in a mess?” Ali says. “There is no job security even in
one of the key industrial sectors of the country; expenses are too high and standard of living is deteriorating every
day. I see neither a promising career for myself nor a bright future for my family in this country,” he laments.
2. ECONOMIC BACKGROUND
The economy of Pakistan is the 47th largest in the world in nominal terms (GDP-$174.8 billion-2010) and 27th
(GDP $464 billion-2009) largest in the world in terms of purchasing power parity (PPP). Pakistan has a semi-
1 Copyright @ 2011, Raza Rafique and Yao Zhao, All Rights Reserved. This case was prepared by Raza Rafique and Professor Yao Zhao
as the basis for the class discussion rather than to illustrate either effective or ineffective handling of an administrative situation. Data in
the case either comes from publically available sources or is based on estimates. No part of this case study may be reproduced without
permission; direct all inquiries to [email protected]

2
industrialized economy, which mainly encompasses textiles, chemicals, food processing and agriculture industries.
Pakistan is classified as a developing country with the sixth largest population in the world and a population
growth rate of 1.573% (2011 est.).[2] Pakistan was a very poor country at the time of independence in 1947 and
dependent highly on its agricultural sector. Although it has been growing ever since, the Pakistan economy has
been characterized as unstable, low growth and very vulnerable to external as well as internal factors. From 2005-
2007, there was a steady economic growth at a rate from 6.1%-6.6%. Unfortunately, this unexpected growth was
the beginning of an energy crisis era because the government was unprepared for the rising demand of the energy.
The result was that in the following years, Pakistan's manufacturing sector faced a double digit cut in its growth
rate due to the energy shortage. According to the World Bank, 40% of Pakistan’s population is living below the
poverty line (2010 est.), and more people were pushed below the poverty line as the unemployment rate jumped
up to 15% (2010 est.). The debt of the country have amounted to 58 Billion USD (2010 est.) – about 1/3 of GDP
in 2010. [3] Recent population growth rate, unemployment rate and GDP growth rate are listed in the Exhibit 2.1.
Exhibit 2.1: Population growth rate, unemployment rate and GDP growth rate in Pakistan
Pakistan’s sixty-four years of political history is quite volatile and revolves around Indo-Pak wars and overthrow
of the civil governments by the military rule. Factors that adversely affected the economy of Pakistan are the
Asian financial crisis and 9/11 military action in Afghanistan, political war between parties, the 2005 earthquake,
the floods in 2010-11, and on-going war against terrorism which resulted in 34,000 deaths and damage of USD 60
Billon. The overall economic condition of Pakistan is summarized in Exhibit 2.2, page 31.

3
Major Economic Power Houses
Pakistan has four provinces: Punjab, Sindh, KPK (formerly known as NWFP) and Balochistan, as well as some
parts of Kashmir valley. The growth poles of Pakistan’s economy are situated along the Indus River, where
diversified economies of Sindh and Punjab’s urban centers coexist with lesser developed areas.
Exhibit 2.3: Mainstay of Economy by Region

4
Exhibit 2.4: Industrial, Mining & Power Sectors Map of Pakistan

5
PUNJAB
Punjab province has 56% of the national population
(170 million) and is the hub of the industrial and
agriculture sectors. Punjab is the most
industrialized province of Pakistan; its
manufacturing industries produce textiles, sporting
goods, heavy machinery, electrical appliances,
surgical instruments, cement, vehicles, auto parts,
metals, rickshaws, floor coverings, and processed
foods. The major industrial cities are Lahore,
Faisalabad, Gujranwala, Gujrat, Sialkot,
Sheikhupura and Multan. The province
manufactures approximately 90% of the paper and
paper boards, 71% of fertilizers, 69% of sugar and 40% of cement in Pakistan. Punjab contributes about 76% to
annual food grain production in the country. Punjab also has more than 68,000 industrial units, including 39,033
small and cottage industrial units, and 14,820 textile units. The cities of Lahore, Faisalabad and Gujranwala have
the largest concentration of small light engineering units. Faisalabad has a strong textile industrial base. The
textile industry of Faisalabad constitutes more than 20% of the textile export of Pakistan. This makes Faisalabad’s
share of the total exports from Pakistan more than 15%. The district of Sialkot excels in sporting goods, surgical
instruments and cutlery goods. Punjab has always contributed the most to the national economy of Pakistan. Its
share of Pakistan's GDP was 59% as of 2010. It is especially dominant in the Service & Agriculture sectors of the
Pakistan Economy. With its contribution ranging from 52.1% to 64.5% in the Service Sector and 56.1% to 61.5%
in the Agriculture Sector, it is the major manpower contributor because it has the largest pool of professionals and
highly skilled (technically trained) manpower in Pakistan. It is also dominant in the Manufacturing sector with
historical contributions ranging from a low of 44% to a high of 52.6%. In 2010, Punjab achieved a growth rate of
6% against the total GDP growth of Pakistan at 4.3%.[4]
City *Distance (Miles) Population Energy Gap 2010(MW) Energy Gap 2015(MW)
Lahore 108 7,129,609 291 1019
Faisalabad 111 2,880,675 87 305
Rawalpindi 53 1,991,656 64 224
Multan 180 1,606,481 46 163
Gujranwala 48 1,569,090 46 163
Sargodha 67 600,501 30 110
Bahawalpur 230 543,929 30 100
Sialkot 74 510,863 30 100
Sheikhupura 64 426,980 28 90
Jhang 0 372,645 25 85
Exhibit 2.5: Major cities in Punjab and their energy gap (*distance from Salt Range – nearest coal fields in Punjab)

6
SINDH
Sindh has the second highest Human Development Index out of
Pakistan's four provinces at 0.628. Main cities are Karachi, Sukkur,
Mirpukhas, Nawabshah, Umerkot and Larkana. With an estimated
population of 15 million, Karachi is the most populous city in the
country. It is Pakistan's premier center of banking, industrial,
economic activity and trade. It is the home to Pakistan's largest
corporations, including those in textiles, shipping, automotive
industry, entertainment, arts, fashion, advertising, publishing,
software development and medical research. Karachi is the
financial and commercial capital of Pakistan. In line with its status
as a major port and the country's largest metropolis, it accounts for
a lion's share of Pakistan's economy. Karachi's contribution to
Pakistan's manufacturing sector is approximately 30%. A substantial part of Sindh’s gross domestic product (GDP)
is attributed to Karachi – the GDP of Sindh as a percentage of Pakistan’s total GDP has traditionally hovered
around 28%-30%, Karachi’s GDP is around 20% of the total GDP of Pakistan. A PricewaterhouseCoopers study
released in 2009, which surveyed the 2008 GDP of the top cities in the world, calculated Karachi’s GDP (PPP) to
be $78 billion (projected to be $193 billion in 2025 at a growth rate of 5.5%). Karachi's high GDP is based on its
mega-industrial base, with a high dependency on the financial sector. Textiles, cement, steel, heavy machinery,
chemicals, food, banking and insurance are also the major segments contributing to Karachi's GDP. In February
2007, the World Bank identified Karachi as the most business-friendly city in Pakistan. Karachi has several large
industrial zones. Its primary areas of industry are textiles, pharmaceuticals, steel, and automobiles. In addition,
Karachi has a vibrant cottage industry and there is a rapidly flourishing Free Zone with an annual growth rate of
nearly 6.5%. [5]
City *Distance (Miles) Population Energy Gap 2010 (MW) Energy Gap 2015 (MW)
Karachi 55 13,205,339 243 851
Hyderabad 50 1,578,367 30 103
Sukkur 216 493,438 25 100
Larkana 195 456,544 25 97
Nawabshah 108 272,598 20 85
Mirpur Khas 90 242,887 20 80
Jacobabad 243 200,815 17 70
Shikarpur 234 177,682 15 65
Dadu 18 146,179 15 60
Tando Adam 84 145,719 15 55
Exhibit 2.6: Major cities in Sindh and their energy gaps (*distance from Sonda – nearest coal field in Sindh)
7
3. THE ENERGY CRISIS
Current Status
Pakistan's energy sector is in crisis. Electricity shortages in the summer of 2011 have peaked at approximately
5,500-6,000 megawatts (MW)2. Many rural areas have no electricity for up to 20 hours a day. Urban areas are
experiencing outages of 10 to 12 hours per day. The growing energy shortages have made life difficult for
Pakistanis across the board, stunted economic growth and limited employment opportunities. The scale of the
present crisis is formidable and requires persistent structural reforms in the sector by the government, and
expanded investments from both the government and the international community.
Previously, electricity demand was growing by 3%-4% annually until 2003-04. The growth rate increased in the
subsequent years up to 10% in 2007-08 due to higher economic growth. The growth in demand was predicted 5
years ago3 but was not handled appropriately by planners due to the lack of institutional capacity to undertake
effective, integrated planning, policy development, and implementation in the energy sector, as well as
insufficient resources. Therefore, the capacity fell significantly behind demand in 2010 which resulted in the
current large-scale power outage. The two primary energy ministries (Ministry of Water & Power, Ministry of
Petroleum and Natural Resources) are not fully coordinated. For example, despite the fact that insufficient gas is
available for electricity generation, subsidized gas continues to be provided to fertilizer companies, and new gas
connections are promised in areas not yet connected to piped gas.
The energy shortages not only block the economic growth but also push more of the population into poverty that
breeds extremism and violence in society at a time when the country is fighting a war against terrorism. The
deterioration in security conditions has compounded the problems in the energy sector. Private investment in the
energy sector has dwindled. Public investment has fallen as development spending is substituted by increasing
military spending to finance the war against terrorism.
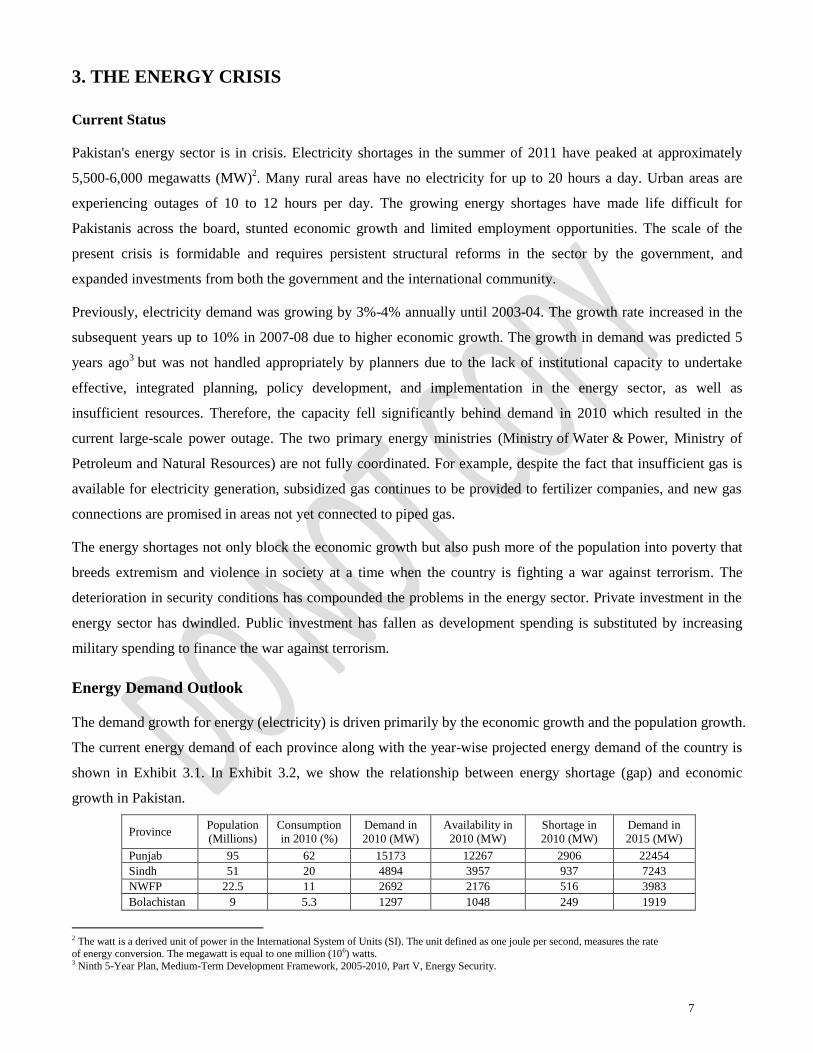
Energy Demand Outlook
The demand growth for energy (electricity) is driven primarily by the economic growth and the population growth.
The current energy demand of each province along with the year-wise projected energy demand of the country is
shown in Exhibit 3.1. In Exhibit 3.2, we show the relationship between energy shortage (gap) and economic
growth in Pakistan.
Province Population
(Millions)
Consumption
in 2010 (%)
Demand in
2010 (MW)
Availability in
2010 (MW)
Shortage in
2010 (MW)
Demand in
2015 (MW)
Punjab 95 62 15173 12267 2906 22454
Sindh 51 20 4894 3957 937 7243
NWFP 22.5 11 2692 2176 516 3983
Bolachistan 9 5.3 1297 1048 249 1919
2 The watt is a derived unit of power in the International System of Units (SI). The unit defined as one joule per second, measures the rate
of energy conversion. The megawatt is equal to one million (106) watts. 3 Ninth 5-Year Plan, Medium-Term Development Framework, 2005-2010, Part V, Energy Security.

8
Exhibit 3.1: Current and Projected Energy Demand
Exhibit 3.2: Energy Gap vs. GDP growth rate (%)
Pakistan Energy Mix
In 2010, Pakistan’s electricity generating capacity was 20,922 MW. Pakistan’s electricity generation is highly
dependent on oil (37.8%) and natural gas (29.4%) and hydro (29.4%). There is only a minor contribution of
Nuclear (3.3%) and Coal (0.1%), see Exhibit 3.3.
Exhibit 3.3: Pakistan Energy Mix
-5.0
0.0
5.0
10.0
15.0
20.0
25.0
2001 2002 2003 2004 2005 2006 2007 2008 2009 2010
Energy Gap % ~ GDP
Energy Gap%
GDP%
Installed Capacity (MW) Projected Total Demand Total Shortage (Energy Gap) (MW)
20,922
YEAR (MW)
2010 26,350 5,428
2015 36,217 15,295
2020 54,359 33,437
2025 80,566 59,644
2030 113,695 92,773

9
Pakistan's electricity generation has a growing reliance on gas and imported fuel oil. There is insufficient
diversification, as compared to, for example, countries like United States, China and India, which have a much
more diversified energy mix relative to Pakistan. Imported energy is in the range of 30% of Pakistan total energy
generation and has increased each year for the past 5 years.
The main reason for this increased reliance on imported fuel is the scarcity of the available resources of water and
gas. In early 1980s, the energy generation of Pakistan was chiefly dependent on water resources (40-45%). The
gradual decline of water bed in Pakistan along with the seasonality factor (the availability of hydro resource varies
from 10% to 30% in a year) resulted in a shift from hydro to natural gas. Natural gas resource, found in 1952, was
established as a major contributor for electricity ever since. But in recent years, the natural gas resources are
depleting and thus cannot meet the increasing demand of the country. For instance, the current capacity utilization
of the existing gas-based power generating facilities is about 75%-85%. Compressed natural gas stations are
facing weekly closures due to the scarcity of gas. Along with the electricity load shedding, residents also face gas
load shedding in the winter months. The scarcity of natural gas has led to an increasing reliance on fossil fuels to
generate electricity. [6]
Pakistan has limited recoverable oil reserves, which stand
at a total of 314 million barrels. Currently, Pakistan’s
internal crude oil production is around 6.57 million barrels
per year. At this production level, the reserves will run out
in 47 years. In recent years, over 75% of the crude oil
supply was met by imports. Pakistan has five main oil
refineries with an installed capacity of 13 million
tons/year (270 KBBL/day). These refineries cover only
half of the domestic demands; the rest is covered by
imports. In 2008-2009, imports of crude oil and oil products (18.4 MTOE) accounted for 83% of oil supplies
consumed in Pakistan. Pakistan’s fostered dependency on expensive imported oil has placed considerable strain
on the economy by raising the external current account deficit and worsening the country's balance of payments
position. [7]
4. PAKISTAN POWER RESOURCES
The major electricity sources in Pakistan are discussed in detail below.
4.1 HYDROELECTRIC SECTOR
The seasonal variations of reservoir levels and consequent fluctuation in power output of storage type hydel dams
in Pakistan are very pronounced. For example, Tarbela Dam has a maximum head of 450 feet and experiences a
variation of 230 feet; Mangla Dam has a maximum head of 360 feet and experiences a variation of 162 feet.
Exhibit 3.4: Electricity Installed Capacity By Type

10
During the lean flow (low head) period of Tarbela Dam from November to June, the power output reduces to as
low as 1,350 MW against the maximum output of 3,692 MW during the heavy flow (high head) period from
August to September (15% permissible overloading on Units 1~10). Lean flow period of Mangla Dam is from
October to March when the minimum generating capability is 500 MW. The capability rises to as high as 1,150
MW during high head period (15% permissible overloading). In summary, WAPDA's (Water and Power
Development Authority) hydel generating capability varies between the two extremes of 2,414 MW and 6,746.0
MW over the cycle of a year.[8] Another problem in the utilization of this resource is the geographical location of
the Pakistani rivers – most of them flow from disputed territory of Indian Kashmir. The construction of dams on
these rivers by India has resulted in decreased flow of water into the Pakistan territory. Another problem is the
significant capital investment required and the lengthy construction time. For example, the planned Kalabagh
Dam (2400 to 3600 MWs) would require $15 Billion USD and estimated 8 to 10 years to complete. Keeping in
mind the scarcity of the water resources, the poor economic condition of Pakistan and the immediate need for
electricity, this resource does not seem to be a viable option to meet the immediate energy requirements of
Pakistan.
4.2 NATURAL GAS SECTOR
The bulk of Pakistan’s power generation comes from thermal power plants burning natural gas and oil. [9] The
total installed capacity of thermal power plants in the country is 13296 MW. As per Energy Yearbook 2010, the
share of thermal power generation during 2009-2010 was 67 percent.
THERMAL ELECTRICITY GENERATION BY FUEL (Unit: MW)
Fuel 2004-05 2005-06 2006-07 2007-08 2008-09 2009-10 ACGR
COAL 2 1.5 1.6 1.6 1.3 1.3 -7.8%
OIL 154 213 314 352 370 413 21.8%
GAS 496 471 409 376 339 320 -8.4%
Total 652 685.5 724.6 729.6 710.3 734.3 2.4%
Annual Growth Rate 9.67% 5.46% 6.12% -0.15% -2.60% 3.47%
Exhibit 4.1: Thermal Electricity Generation in 2009-2010. Source: IPPs, KESC, WAPDA
Pakistan has a well-developed and integrated infrastructure for transmission and distribution of natural gas (one of
Pakistan's success stories). This sub-sector is generally open to the private sector. Pakistan's gas reserves are 282
trillion cubic feet and current production is 4 billion cubic feet per day. There are indications of additional
reserves of 35 trillion cubic feet in tight/difficult gas.

11
The medium term (by 2014-15) decline in production of the seven largest gas fields (that account for 65% of the
current total production) and their huge long-term decline (by 2019-20) represent a failure to attract more
investment in gas exploration and production. [10] As a result, it is difficult to maintain a production plateau
between 4,500 and 5,000 MMcfd of gas. Not much has been done to realize the tight gas potential and no real
incentives have been provided to exploration and production companies. With the current exploration cost of gas,
it is not economically feasible to burn this energy source to produce electricity. In addition, gas system losses are
increasing due to the aging network. On the other hand, gas demand is currently growing at an 8.5% annual rate.
Thus, the gas deficit is increasing as production falls significantly behind demand. Due to the increasing gas
shortages, there is rationing of piped gas in winter months.
4.3 OIL SECTOR
A summary of the oil sector of Pakistan is provided in the following table.
Pakistan's fuels sector leans heavily on two main fuels which account for 84% of consumption, i.e. high-speed
diesel (41%) mainly used for transportation and fuel oil (43%) primarily consumed in the power sector. [11]
Pakistani ports cannot receive the large vessels deployed by oil suppliers; therefore, freight costs for delivered
products and crude oil are high. Up country distribution is by road tankers, rail, and pipeline. Pakistan has a
pipeline network of over 2,000 km (PARCO Network) for the upcountry movement of crude oil and oil products
which is an economic means of transportation. [12] However, owing to limited capacity (1.2 million tons/yrs.),
considerable upcountry fuel oil movement takes place on road tankers (over 4 million tons/year, or 100,000 40-
ton trucks for long-distance hauls) which is the most expensive mode of oil transportation. There is no formal

12
policy on managing strategic oil stocks, and thus operational stocks sometimes fall to critically low levels. One
key impediment is the lack of institutional capacity for developing logistics infrastructure and linking it with oil
and energy development plans. The consumption of petroleum product by sector is shown in the chart. The major
issue in electricity generation with fuel is the fluctuating oil prices (Exhibit 4.2). [13] Due to the limited domestic
reserve, lack of transportation infrastructure (freight etc.) and price volatility in international oil markets, this
resource can hardly be used as a reliable and economically viable source of electricity.
4.4 NUCLEAR ENERGY
The current share of nuclear power in the total power generation capacity of Pakistan is 3.3 percent. At present,
only two nuclear power plants with a total capacity of 462 MW are functional. PAEC (Pakistan Atomic Energy
Commission) is the operator of the two nuclear power plants in Pakistan. Karachi Nuclear Power Plant
(KANUPP), the first nuclear power plant of the country, was commissioned in 1971 in Karachi through a turn-key
agreement with Canadian General Electric Company. The second Chashma Nuclear Power Plant-1 (CHASNUPP-
I), was commissioned in the year 2000, also through a turnkey agreement with China National Nuclear
Corporation. [14] After the successful experience of KANUPP and CHASNUPP-I, the Government of Pakistan
has entered into another contract with China for construction of a second unit CHASNUPP-II. The construction of
the unit is in progress and it is expected that the unit will be commissioned by the end of 2011. The capital
investment for a typical 1154 MW nuclear power plant is about 8 billion USD and the estimated construction
period is 6-8 years.
In March 2009 the Pakistan government announced that it was proceeding with design of CHASNUPP-III and IV,
with China. PAEC said Beijing was financing 85% of the US$ 1.6 billion project. Contracts for CHASNUPP-I
and II were signed in 1990 and 2000, before 2004 when China joined the Nuclear Suppliers Group (NSG), which
Break-up of Nuclear Generation Capacity(MW)
Power Stations Capacity(MW)
Karachi Nuclear Power Plant(KANUPP) 137
Chashma Nuclear Power Plant(CHASNUPP)-I 325
Total 462
CHASNUPP-II (Commercially Not Available) 325
Source: Pakistan Energy Book 2010(HDIP)
Exhibit 4.2: Crude Oil Prices

13
maintains an embargo on sales of nuclear equipment to Pakistan, but there are questions about China's supply of
Chasma-III & IV. On September 24, 2010, China informed the IAEA that it will implement an agreement with
Pakistan on the export of two nuclear reactors for Islamabad's Chashma nuclear complex. Beijing has said that the
reactor deal is part of a 2003 agreement between the two countries, a claim many have questioned, though
Germany has accepted. Still this issue is not finalized, and concerns continue about the lack of safety features
incorporated into the Chashma-III and Chashma-IV reactors, which are alleged to use a design which is not
considered safe enough to build in China along with the international pressure by NSG. [15] As a result the future
for this type of energy source is not promising as Chashma-III and Chashma-IV projects require clearance from
NGS.
4.5 ALTERNATIVE / RENEWABLE ENERGY
Pakistan has abundant and inexhaustible renewable energy (RE) resources, such as wind and solar power, which,
if tapped effectively, can play a considerable role in contributing towards energy security and energy
independence of the country. In May 2003, Alternative Energy Development Board – AEDB was established to
act as a central agency for development, promotion and facilitation of renewable energy technologies, formulation
of plans, policies and development of a technological base for manufacturing of renewable energy equipment in
Pakistan. The Government of Pakistan has tasked the AEDB to ensure that renewable energy technologies can
produce 5% of total national power generation capacity by year 2030. [16] At present, the total renewable energy
produced in the country is 40MW which accounts for about 0.21% of total installed generation capacity of all
sorts. The investment requirement for the renewable energy sector of the country from short to medium term is
over 16 billion USD. Keeping in mind the economic condition of Pakistan, it is a huge investment which is not
feasible under current financial circumstances.
5. PAKISTAN COAL RESOURCES
5.1 COAL RESERVES
Pakistan has approximately 186 billion tons of coal reserves, most of which remain untapped. [17] Pakistan's Coal
reservoirs are ranked seventh in the world which is equivalent to approximately 300 billion barrels of oil, which
exceeds the combined oil reserves of Saudi Arabia and Iran. 185 billion tons of coal reserves are worth USD 25
trillion. According to a study, 50,000 MW can be harnessed for 500 years with these coal reserves. It would not
only cater to the electricity requirements of the country for next several decades, but would also help reduce the
Renewable Energy Potential in Pakistan
Wind 0.346 Million MW
Solar 2.9 Million MW
Source: Alternative Energy Development Board(AEDB)

14
oil import bill by USD 4-4.50 billion annually and help FOREX reserves to swell. The coal power generation
would cost Pakistan 4PKR 4.0 per unit whereas the power generated by Independent Power Projects (Oil &
Natural Gas) costs PKR 9.27 per unit. Exhibit 5.1 provides a summary of the coal reserves in Pakistan.
Province Resources in Million Tons *How much is this Coal
Sindh 184,623 Worth of USD 25 trillion.
Exceeds the combined oil reserves of Saudi
Arabia and Iran.
50,000 MW of electricity for 500 years can
be produced,
or 100 Million Barrel diesel for 500 years.
Balochistan 217
Punjab 235
NWFP 91
AJK 9
Total 185,175*
Exhibit 5.1: Coal reserves of Pakistan
Exhibit 5.2: Coal Reserves of Pakistan
4 PKR=Pakistani Rupee (1 USD = 86 PKR)
Salt Range coal reserves are 213 million tons. 10,000 MW of
electricity can be produced from these reserves for 3 years.
Makerwal/Gullakhel coal reserves are 22 million tons. 1000
MW of electricity can be produced from these reserves for 3
years.
Punjab Coal Reserves
Thar Coal is 175 billion tons. 50,000 MW of electricity can be
produced from these reserves for 500 years or 100 Million
Barrel diesel for 500 years.
Sonda coal reserves are 7.112 billion tons. 10,000
MW of electricity can be produced from these
reserves for 108 years.
Lakhra: Availability of Coal in Lakhra is 1.328
billion tons. 10,000 MW of electricity can be
produced from these reserves for 20 years.
Sindh Coal Reserves

15
The current coal production and consumption by sector is shown in the following exhibits which show about 3.5-
4.5 million tons of coal are produced each year and about 1.5% of which is used for power generation.
Sindh Coal Fields Information (Thar, Soda and Lakhra)
Sindh has the largest reserves, 175 billion tons of lignite coal, located in the Thar Desert. All coal reserves in
Sindh are listed in the following table. The infrastructure refers to all constructions (road, building, power &
water supply) and equipment required to enable mining.
Coal Fields Information Lakhra Coal Field
Sonda Coal Field
Thar Coal Field
Distance from Karachi 193 km 100-150 km 410 km
Total Area 1,309 sq. km 1,822 sq. km 9000 sq. km
Coal Reserves 1.328 Billion Tons 7.112 Billion Tons 175 Billion Tons
Infrastructure Status for Mining No infrastructure Minor Development Minor Development
Infrastructure Development Time 1-2 Yrs 1-2 Yrs 4-5 Yrs
Punjab Coal Fields Information (Makerwal/Gullakhel, Salt Range)
Currently, no infrastructure exists to mine the Makerwal/Gullakher and Salt range coal reserves.
Coal Fields Information Makerwal/Gullakhel Coal Field
Salt Range Coal Field
Distance from Lahore 90 km 270 km
Coal Reserves 22 Million Tons 213 Million Tons
Infrastructure Status forMining No infrastructure No infrastructure
Infrastructure Development Time 1-2 Yrs 1-2 Yrs
5.2 COAL MINING COST ESTIMATION GUIDE*
The following types of costs are considered in estimating coal mining costs.
Mine and Prep Plant Cost Models: It includes costs for a broad range of sizes and types of theoretical
surface and underground mines and prep plants5.
5 A coal preparation plant (CPP) is a facility that washes coal of soil and rock, preparing it for transport to market. A CPP may also be called a "coal
handling and preparation plant" (CHPP), "prep plant," "tipple," or "wash plant".

16
Coal Production Data: It includes historical and current perspectives of coal production by coal rank and
geography. This data provides distribution, resources and technical data for coal producing areas.
Transportation: It includes truck, rail and pipeline (for slurry) shipping charges for coal, equipment and
supplies.
Mining Taxes: It includes federal, state and provincial taxes and how they apply to your proposed
project. All taxes are covered including income, sales, property and all other mining-specific taxes in all
of the coal producing states or provinces.
Mining Wages: Mining wages are considered along with wage scales, benefit plans and employment
taxes to help you estimate labor costs.
Utility Costs: Current industrial electric power and natural gas rate schedules as applied to mining are
considered to determine project's utility costs.
Mine and Processing Equipment: It includes estimates about processing equipment items, from 2 hp
pumps to 3,400 hp trucks, drills, locomotives, ventilation equipment, crushing and grinding equipment,
pumps, motors, continuous miners and more.
Mine, Processing, Safety and Reclamation Supply Costs: It includes every supply item in cost estimate,
including safety equipment, fuel, reagents, drill bits, tires, rock bolts, reclamation materials and much
more.
*Theoretical Example (For 5,000 Tons per Day Open Pit Cost Model): This mine is an open pit mine producing 5,000 tons
ore and 5,000 tons waste per day. The total resource to be mined is 18,715,000 tons. Ore is hauled 1,068 meters to an ore
stockpile. Waste is hauled 535 meters to a waste rock dump. Rock characteristics for both ore and waste are typical of those
of granite or porphyritic material. Operating conditions, wage scales, and unit prices are typical for western U.S. mining
operations. The key design criteria; operating schedule, equipment, personnel and supply requirements; and costs are listed
below in the table.
Capital Costs
Equipment $8,066,100
Haul Roads 1,095,600
Pre-production Stripping 393,500
Buildings 1,632,700
Electrical System 63,600
Working Capital 1,258,200
Engineering & Management 2,025,300
Contingency 1,453,500
Total Capital Costs $15,988,500
Total per Daily Tonne Ore & Waste $1,599

17
5.3 COAL TRANSPORTATION METHODS
Coal can be transported in the following ways from coal fields to
power plants:
a) Rail Network: The most cost effective method of coal
transportation is rail network. The initial cost is high but coal
can be transported over a long distance through a dedicated
network for the coal transportation.
b) Road Network: Coal can be transported through road network with large trucks within the range of 100-
120 km. For distances more than 120 km, cost of transportation increases substantially and is not
economically feasible.
c) Pipeline Network (In slurry form): Another method of coal transportation is converting the coal into
slurry (grounded coal mixed with water) and transporting that slurry through a pipeline network.
Examples of pipeline networks up to 430 km can be found for the transportation of coal in slurry form.
d) Waterways: Waterways can be used for transportation of the coal depending upon the location of the
demand points.
Railway Network in Pakistan
Rail services in Pakistan are provided by the state-run Pakistan Railways, under the supervision of the Ministry of
Railways. [18] Pakistan Railways provides an important mode of transportation in Pakistan, catering to the large-
scale movement of people and freight. The railway network has a total length of 8,163 km, of which 7,718 km are
1,676 mm (5 ft 6 in) broad gauge tracks, including 293 km of electrified track, and the remaining 445 km are
1,000 mm (3 ft 3 3⁄8 in) narrow gauge tracks. Earning from Passenger rail service comprise of approximately 50%
of the total revenue. Pakistan Railways carry 65
million passengers annually and daily operate 228
mails, express and passenger trains. Pakistan
Railways also operate special trains for various
occasions. The Freight Business Unit (FBU) with
12000 personnel operates over 200 freight stations on
the railway network. The FBU serves the Port of
Karachi and Port Qasim as well as various other
stations along the network and generates revenue
from the movement of agricultural, industrial and
imported products such as wheat, coal, fertilizer, cement, and sugar. About 39% of the revenue is generated from
the transportation of petroleum, 19% from imported wheat, fertilizer and rock phosphate. The remaining 42% is
earned from domestic traffic. The freight rates structure is based on market trends in road transport which is the

18
main competitor to rail transport. Rail-transported coal is typically moved in unit trains that operate in dedicated
shuttle service between a mine and a destination.
Cost of building a new railway track of 1km = $178 Million Approx.
Annual Maintenance Budget = 16,120 $/ km
The cost of transportation for one short ton of coal /km by Rail is approximately $5-8.
Time required to build 100 km of railway track = 1-2 Yrs
Cost-Time Estimates for Proposed New lines-Track Doubling
The table below shows the data for the type of railway project, location, length, cost and time estimates.
Road Network in Pakistan
Motorways of Pakistan: The construction of motorways began in the early 1990s with the idea of building a
world class road network and reducing the load off the heavily used national highways throughout the country.
National Highways: During the 1990s, Pakistan began an
ongoing project to rebuild all national highways throughout
the country specifically to important financial, cargo and
textile centers. [19] The National Highway Authority or NHA
is responsible for the maintenance of all national highways in
Pakistan. The right map shows the road network. Truck
transportation is used to move coal instead of a water or rail
carrier or for direct shipment to the customer. Trucks have
the advantage of routing flexibility and modest capital
requirements, but coal can be economically transported for at most about 120 km due to the high unit cost of
moving a low-value product in relatively small batches. Coal-carrying vehicles are typically end-dump trucks
with a carrying capacity of roughly 25 to 50 tons depending on local road conditions and safety regulations.
Cost of building a two lane highway road = 3.5 Million $/km approx. Annual Maintenance Cost = 14085 $/Km
The cost of road transportation for one short ton of coal per km is approximately $8-10.
Time required to build 100 km(120 km constraint) road network = 1-2 yrs
*(Cost of relocation of underground utility services, cost of demolitions required to widen the road, and mainly the cost of Land Acquisition are NOT included in this estimate. Similarly cost of major bridges, duct banks, culverts, overhead pedestrian bridges, etc. are NOT included.)
Type of Project Location Length Cost Time
New Line Gwadar and Quetta 700 km 1.25 billion USD 4 years
Track Doubling
Shahdara Bagh- Lalamusa 126 km 166 million USD 3 years
Khanewal – Raiwind 246 km 98 million USD 5 years
Shahdara Bagh – Faisalabad 135 km 123 million USD 3 years
Lalamusa – Chaklala 152 km 280 million USD 4 years
Golra Sharif - Peshawar Cantt 160 km 230 million USD 4 years

19
Pipeline Network in Pakistan
The pipeline network of Pakistan is comprised of two gas marketing
companies: Sui Northern Gas Pipeline Limited (SNGPL) and Sui
Southern Gas Company Limited (SSGCL), and one crude oil-cum-
product pipeline company (PARCO). The total natural gas
infrastructure network comprises 10,740 kilometers (km) of
transmission lines and 101,733 km of distribution lines with the
appropriate compression facilities designed to achieve system
efficiency. The cost of transportation for one short ton of coal slurry
per km by pipeline is $2-5.
SNGPL (Sui Northern Gas Pipeline Ltd.)
The SNGPL transmission system extends from Sui in Balochistan to Peshawar in the NWFP comprising over
7,016 km of transmission system (Main lines & Loop lines). SNGPL's transmission and distribution (T&D)
system extends from Sui in Baluchistan to Peshawar in Khyber-Pakhtunkw6 passing through Punjab, and accounts
for 1788 million cubic feet per day (MMcfd7), or 48% of total gas in the country. [20]
SSGC (Sui Southern Gas Company)
The SSGC transmission system is over 3,080 km including (Main lines & Loop lines). SSGCL operates in the
southern part of the country (Baluchistan and Sindh) and accounts for 1,157 MMcfd or 30% of total gas in the
country. [21] The rest (22%) of the gas supply is transported via independent systems.
PARCO (Pak Arab Refinery Ltd.)
Parco operates a network of crude oil-cum-product pipelines running over 2000 kilometers across the country.
Cost of building 36 inch diameter pipeline =540$/meter=540000$/km
Annual Maintenance Cost = 2 % of the setup/capital cost The cost of transportation for one short ton of coal slurry per km by pipeline is $2-5.
Time required to build 100 km of pipeline network = 1-2 yrs
Waterways
The waterway network in Pakistan is in its infancy with Karachi
being the only major city situated next to the Arabian Sea. Still
plans are being proposed for the development of the waterways
in the country along the Indus River and through the Punjab as it
would boost employment opportunities and the economic and
social development of Pakistan. But no project is currently
6 In the aftermath of the adoption of the 18th Amendment to the Constitution of Pakistan, the North Western Frontier Province was renamed Khyber-Pakhtunkhwa. 7 The cubic foot is an Imperial and US customary (non-metric) unit of volume, used in the United States and the United Kingdom. It is defined as the volume
of a cube with sides of one foot (0.3048 m) in length. MMCFD = For millions of cubic feet per day.

20
underway to use these waterways as an alternative mode of transportation. Following is a list of dry ports and sea
ports in Pakistan.
Port of Gwadar - Gwadar, Balochistan
Port of Karachi - Karachi (City Centre), Sindh
Port Qasim - East Karachi, Sindh
Port of Pasni - Pasni, Balochistan
Rivers: Among the Pakistan Rivers, the Indus is the most important river. Without Indus and its tributaries,
Pakistan would have been a dry barren land long ago. Apart from Indus, the other important rivers in Pakistan are
Sutlej, Chenab, Beas, Ravi and Jhelum. These rivers merge into the Indian rivers at the India-Pakistan border. The
cost of transportation for one short ton of coal /km by river is $5-8.
5.4 COAL-FIRED POWER PLANTS
There are two types of coal operated power plants in the market.
Conventional Coal Power Plant
Coal Gasification Power Plant
The cost of a conventional coal fired power plant of 500 MW is about 2 Billion USD and takes 24-36 months to
build. The coal gasification power plant of the same capacity requires a capital cost 25% more than the
conventional power plant. The typical costs associated with a coal power plant are:
Capital Cost
Operation & Maintenance Cost
Carbon Cost
Exhibit 5.3: Coal Power Generation Chain

21
Exhibit 5.4: Coal Fired Thermal Power Station
Exhibit 5.5 estimates the cost of a coal-fired power plant project for Thar coal field.
Exhibit 5.5: Cost of coal power plant project – A hypothetical frame work for 15,000 MW of electricity from Thar Coal
The coal requirement for an average size power plant (500 MW) is approximately is 5000-9000 metric tons daily.
The conventional transportation modes available are truck, rails, water-way as well as slurry (water + crushed
coal) through pipelines (see Section 5.3 for details).
6. CURRENT ENERGY SUPPLY CHAIN
The key players of Pakistan’s power sector are energy producers, transmitters, distributors, and Pakistani energy
administrations. The organizational infrastructure of Pakistan’s power sector with all key players is shown in
Exhibit 6.1.
For 2015-Electricity Gap = 15,000 MW approx. % of GDP = 36%
Cost of one Power Plant (500 MW) = 2 Billion $ Time required to establish this infrastructure:
To cover this gap of 15000 MW= 30 power plants For power plants = 24-36 months (if all started at once)
Cost of Power Plants = 30 x 2 = 60 billion $ For transmission network of 10,000 MW = 5-10 years
Cost of infrastructure for 10,000 MW electricity proposed at Thar = 1.74 Billion $ For additional 5000 MW= 5 years
(Including water, electricity, road network, railway links, effluent disposal costs) Time taken for building road/rail network to far distant places from
Thar= 5 years
Cost of infrastructure for an additional 5000 MW of electricity = 870 Million $ Costs (Not included):
Total cost = 60 + 1.74 + 0.87= 62.6 Billion $ O&M cost of power plants (annually)
GDP (2011) = 174.8 Billion USD O&M cost of road network (annually)
Sector-wise contribution in GDP: Agriculture: 20.8%, Industry: 24.3 %, Services: 54.9% O&M cost of rail network (annually)
Inflation rate (2011) = 16-17% O&M cost of electricity transmission network (annually)
Unemployment = 15% Extension of road/rail network (From Thar to outside network)
Standard Poor Rating = B- Transportation carriers (rail cars/trucks cost)

22
Exhibit 6.1: Organizational infrastructure of Pakistan power sector
6.1 MAIN ELECTRIC POWER PRODUCERS IN PAKISTAN
The main electric power producers in Pakistan are Water and Power Development Authority (WAPDA), Karachi
Electricity Supply Company (KESC) and Pakistan Atomic Energy Commission (PAEC, the operator of the two
nuclear power plants). Besides these three main power producers, a number of independent power producers
(IPPs) established since 1994 are also contributing significantly to the electricity sector of the country.
a. Water and Power Development Authority (WAPDA): WAPDA was created in 1958 as a semi-
autonomous body for the purpose of coordinating and providing a unified direction to the development
of the water and power sectors. [22] These sectors were previously managed by the respective electricity
and irrigation department of the provinces. Since October 2007, WAPDA has been bifurcated into two
distinct entities: WAPDA and Pakistan Electric Power Company (PEPCO). WAPDA is responsible for
water and hydropower development whereas PEPCO is responsible for the management of WAPDA’s
fourteen public limited companies in the areas of thermal power generation, transmission, distribution
and billing. These fourteen (14) corporate entities are:
Four (4) Thermal Power Generation Companies (GENCOs)
One (1) National Transmission & Power Dispatch Company (NTDC)
Nine (9) Distribution Companies (DISCOs)
b. Karachi Electric Supply Company (KESC): The company was privatized in November 2005 with the transfer
of 73% shares of the Government of Pakistan along with Management Control to the new owner KES Power &
others. Currently, the Ministry of Water and Power looks after the affairs of this company at the federal level.
KESC is principally engaged in generation, transmission and distribution of electric energy to industrial,
commercial, agricultural and residential consumers under the Electricity Act in 1910 as amended to date and

23
NEPRA Act 1997, to its licensed areas. [23] The company owns 1,756 MW of generation capacity (oil- and gas-
fired), of which 1,534 MW is operational. The demand for power in the city is at least 2300 MW. To meet the
supply-demand gap, KESC has to purchase power from WAPDA, Independent Power Producers (IPPs) and
KANUPP. Whenever any of these outside entities fail to provide power or there is a breakdown in KESC’s own
installed generation base, the company has to resort to load shedding.
c. Pakistan Atomic Energy Commission (PAEC): PAEC is the operator of the existing two nuclear power plants
in Pakistan. Karachi Nuclear Power Plant (KANUPP), the first nuclear power plant of the country, was
commissioned in 1971 in Karachi through a turn-key agreement with Canadian General Electric Company. The
second Nuclear Power Plant was commissioned in the year 2000 also through a turnkey agreement with China
National Nuclear Corporation.
d. Independent Power Producers (IPP): The gross power generation capacity of IPPs is 5,822 MW. KAPCO and
HUBCO are the two largest companies with a production of 1,466 MW and 1,292 MW respectively.
6.2 ELECTRICITY TRANSMISSION
In Pakistan, two companies are engaged in electric power transmission; they are National Transmission and
Dispatch Company (NTDC) and the Karachi Electric Supply Company Limited (KESC). NTDC is the national
grid company of Pakistan and is exclusively responsible for electric power transmission for the entire country
except the area covered by KESC.
Capital cost of electricity transmission line = $0.3 Million/km
Annual Maintenance cost = 2% of the setup/capital cost
Time Required to build 100 km of transmission line/1000 MW = 1-2 yrs
a. National Transmission and Dispatch Company (NTDC): NTDC is responsible for overall reliability,
planning and coordination of the electricity transmission in Pakistan except the area under KESC. NTDC is a
public sector company and came into existence as a result of restructuring of WAPDA in 1998 and obtained a
transmission license from National Electric Power Regulatory Authority (NEPRA) in 2002 to engage in the
exclusive transmission business for a term of thirty (30) years.
b. Karachi Electric Supply Company Limited (KESC): The second company engaged in electric power
transmission business in Pakistan is KESC. It has two separate licenses; electric generation and distribution, while
its application for a transmission license is currently under consideration by NEPRA.
6.3 ELECTRICITY DISTRIBUTION
As a result of restructuring and unbundling of the power of Water and Power Development Authority (WAPDA),
DISCOs are responsible for channeling electricity to the transmission substations. The end users are classified as
residential, commercial, industrial, agriculture and street lights etc. Overall, the distribution system, especially in
an urban area, is overstressed and needs to be upgraded, augmented and expanded. Besides these distribution

24
companies, Karachi Electric Supply Company (KESC) is a private limited company and is engaged in distribution
of electric power in the area of Karachi. In addition to one private and nine public distribution companies,
National Power Regulatory Authority (NEPRA) has so far granted seven distribution licenses to small power
producers (SPPs) for supply of electric power to designated bulk power consumers.
Losses in the transmission and distribution: One of the major problems in Pakistan’s electricity transmission
is the unsafe and unreliable transmission and distribution of electricity. Due to weak grid infrastructure and
significant theft of electricity, losses from the transmission and distribution network ranged from 20.6% to 21.6%
during 2009-10.
Electricity Consumption Sector Wise: Having consumption of 46.1% of electricity, the domestic sector is the
major consumer of electricity in Pakistan, followed by industrial 26.7%, agricultural 13% and commercial 7.5%
sectors.
7. ENERGY SUPPLY CHAIN ISSUES
Currently there are more than 20 organizations engaged in developing electric power projects, such as, WAPDA
Hydroelectric, Pakistan Electric Power Company (PEPCO), the unbundled ex-WAPDA entities, Private Power
and Infrastructure Board (PPIB), the Alternative Energy Development Board (AEDB), the Thar Coal and Energy
Board, the Infrastructure Project Development Facility (IPDF) and provincial power and irrigation departments
with the responsibility to develop small hydropower projects of under 50 MW and other off-grid renewable
energy projects. The issues are:
a. Stalled Privatization: Pakistan's investment needs in the energy sector cannot be met by the public sector
alone as private sector investment is crucial to address the energy gap. Private sector investment in energy is also
critical to tap offshore capital resources, to inject new technology and management expertise, to develop domestic
financial sector capabilities, and to generate greater efficiencies in the delivery of energy and services. The
entities earmarked for privatization (including exploration and production in the oil and gas sector) are Oil and
Gas Development Company Limited (OGDCL), Pakistan Petroleum Limited (PPL) and Pakistan State Oil (PSO).
The two big gas supply companies, SSGCL and SNGPL, along with key assets in the power sector including
selected electricity distribution companies and a power generation company, are also targeted for privatization.

25
b. Regulatory Challenges: There is a lack of uniform regulation in the energy sector that creates distortions
between the gas and electricity sectors. Inconsistent regulations between the National Electric Power Regulatory
Authority (NEPRA) responsible for the power sector and the Oil and Gas Regulatory Authority (OGRA)
responsible for the oil and gas sectors send confusing signals to investors and create disharmony in pricing
strategies between gas and electricity.
c. Inefficient and Below-Cost Recovery Tariff Structures: Previously, the government froze tariffs between
2003 and 2007 at a very low level. The subsequent tariff increase in the following years did not make up for the
shortfall while crude oil and gas prices were increasing globally. Even now the notified electricity tariffs by the
government are below the cost-recovery level. Between FY2004 and FY2008, the price of imported furnace oil,
which represents about one third of the fuel mix for power generation, increased by 76%. Gas prices have
increased by 78% over FY 2004-05 levels.
High technical and commercial losses of
DISCOs also led to the increased cost of
service. The government provides a tariff
differential subsidy (TDS) to DISCOs to
cover the gap between the cost of service
tariff as determined by NEPRA and the
notified uniform tariff. The government's
notified uniform tariff is for each customer class set at a rate that is lower than the lowest NEPRA-determined
tariffs of all eight DISCOs. The graph shows the size and growth of the cost of electricity subsidies and the
growing gap between the cost of service and the level of subsidy between FY2004-05 and FY2009-10.
d. Efficiency Losses: Pakistan's industry is energy inefficient. This is attributable to high energy losses, waste
throughout the energy supply chain, and inadequate investment in replacing obsolete infrastructure. For each
dollar of GDP, Pakistan uses 15% more energy than India and 25% more than the Philippines. The power sector
experiences transmission and distribution losses currently at about 21.9%; these losses are substantial and raise
the cost of electricity and contribute to shortages. Therefore there are potentially dramatic gains in supply from
improving energy efficiency. Pakistan's total energy savings potential is estimated at 11.16 MTOE. Savings from
energy efficiency could reach 18% of total energy consumed in the country. This corresponds to a 51% reduction
in net oil imports. According to the National Energy Conservation Centre (ENERCON), annual energy savings of
up to 25% are possible in all sectors which translate into approximately $3 billion in savings annually.
8. CURRENT STRATEGY OF COAL
According to estimates recently compiled by the National Electric Power Regulatory Authority (NEPRA), the
average cost of generating electricity from water resources stood at about 50 paisa per unit (0.0058¢) (1 USD=86
Rs. & 1 Rs. = 100 paisas), Rs 4.50 from gas, Rs 12 per unit from furnace oil and more than Rs 16 per unit from

26
diesel. Estimates also show that the electricity to be produced from block-5 of the Thar coal field would cost a
maximum of Rs 4 per unit. In addition, Pakistan could produce 10,000 MW of electricity for 30 years from only
one percent of the total Thar coal reserves.
Realizing the potential of coal, the Pakistan government is shifting its energy mix from imported oil and
dwindling gas reserves to coal. There has been a long history and many efforts of developing the Thar, Sonda and
Lakhra coal fields, but none of them were successful. The existing situation of the Sindh and Punjab coal fields is
described below.
SONDA Coal Field: The Sonda coal field is located 150 km northeast of Karachi. Supporting infrastructure, such
as railway, power transmission network, and road network is available in its proximity. Ever since its discovery in
1981 by the Geological Survey of Pakistan (GSP), the Sonda coalfield in the Thatta district has been investigated
in detail and a Chinese firm started underground hydrological surveys in Sindh as part of a coal-mining and power
generation project in January 2009. “China National Machinery Import and Export Corporation (CMC) has
entered concluding stages of evaluation process of its leased area of 57 sq km in the Sonda Jerruk coal field of
District Thatta,” a company official said. According to the company, Sonda-Jherruk coal mine and power plant
project was expected to generate around 405 MW of electricity using coal. The hydrological survey department
was assisting to ascertain the amount of underground water, essential for power generation purpose. Another 205
MW Integrated coal mining cum Power Project at Sonda-Jherruk by M/S Dadabhoy Hydrocarbon Energy Ltd.
was expected to start soon. Unfortunately both companies abandoned their projects due to disputed tariffs and the
lack of interest of the government in developing the required mining infrastructure.
LAKHRA Coal Field: The Lakhra coalfield is at a distance of 50 km off Hyderabad and 175 km from Karachi.
The Lakhra coalfield is connected by road through the Indus Highway, and a rail track is also available near
Khanot, which is also located on the Indus Highway. There is a well-established electricity transmission
infrastructure available in Hyderabad. After the first discovery of coal in Lakhra, many geological investigations
have been conducted in the Lakhra area by national and international organizations. Interests in large-scale
exploration of coal for power generation began to develop in the early 1960s when GSP performed a systematic
geological investigation of the area. GSP’s tests found Lakhra coal unsuited for hard coke production, but suitable
for power generation. In 1966, GSP engaged a Polish firm to undertake a mining and power generation feasibility
study on Lakhra coal. In 1978, GSP carried out additional technical, financial and economic feasibility studies. In
1981, GSP reported positive results and concluded that a 300 MW plant was technically feasible, but estimated
the coal production cost to be very high. The government of Pakistan asked USAID to review all studies on
Lakhra and make recommendations on the technical and economic feasibility of a coal-fired power station.
USAID completed its Lakhra feasibility study by 1986 and confirmed GSP’s appraisal, but proposed changes in
design of the plant, lowering the estimated cost. The USAID feasibility study concluded that a Lakhra coal mine,
supplying coal for a 2 x 250 MW units power plant, was technically sound and socially and environmentally
feasible. The government has invited EOIs for the development of a 450 MW integrated project of coal mine and

27
power plant in Lakhra through press advertisement but no further action was taken by the government office.
Lakhra coal fields have no established mining infrastructure available for the utilization of coal resources.
THAR Coal Field: The government has a plan to develop the Thar coal fields to solve the energy crisis once
and for all by building coal fired power plants at Thar. The power generated at Thar will be transmitted through a
transmission network to the rest of the country. The plan is primitive in terms of allocation of resources and the
development of infrastructure. From the government’s point of view, there are benefits to having several projects
in close proximity to Thar, as grid facilities could be shared by the different projects. Also the usage of ground
water by several projects will lower the water table in the region, making coal mining more easy and cost
effective. The possibility of using one mine service facility will be helpful for all mines and power plants and
common location/facilities for all power plants in the complex.
Thar coal fields are 410 km east of the city of Karachi. These fields are located in the desert without any
established infrastructure. The estimated infrastructure development cost to connect Thar coal field with the
outside networks is 1.74 billion USD, including water, electricity transmission, road network, railways link,
effluent disposal systems etc. The details for the development plan for Thar are as follows:
Construction of canal water carrier with capacity of 300 cusecs.
Construction of 50 cusecs drainage and wastewater effluent channel from mining area of Thar coal field.
Improvement and widening of road network from seaport Karachi to Thar coalfields (360 km).
Transmission line setup to Thar coalfields: National Transmission & Dispatch Company (NTDC), with
the support of ADB (Agricultural Development Bank) funding, has initiated a feasibility study for
constructing a 1300 km electricity transmission line from Thar coalfields to upcountry load centers for
dispersal of 2500-3000 MW power. The process/configuration of a transmission system (including
line/grid/switching station) will cater for the evacuation of at least 10,000 MW of power, and can be
replicated for an additional 10,000 MW. Total estimated funding required for the transmission line is
approximately 1 billion USD and the estimated construction period is 5-10 years.
Establishment of broad-gauge railway link to Thar coalfield areas.
SALT RANGE/ MAKERWAL Coal Fields: Salt Range and Makerwal coal fields are underdeveloped due to
the lack of interest of the Punjab government. The area is highly populated with a well-established road and rail
network. The coal belt in the Salt Range extends from 20 miles north of Khushab to 15 miles northeast of
Khewra, an area of about 100 sq. miles. The coal is high volatile bituminous with a high ash and sulphur content.
The Makarwal coal-mining area lies in the Trans-Indus Salt Range and extends from eight miles west of
Kalabagh to west of Makarwal. The coal is of slightly better quality than that of the Salt Range.
9. PAKISTAN ENERGY SECTOR FINANCING
28
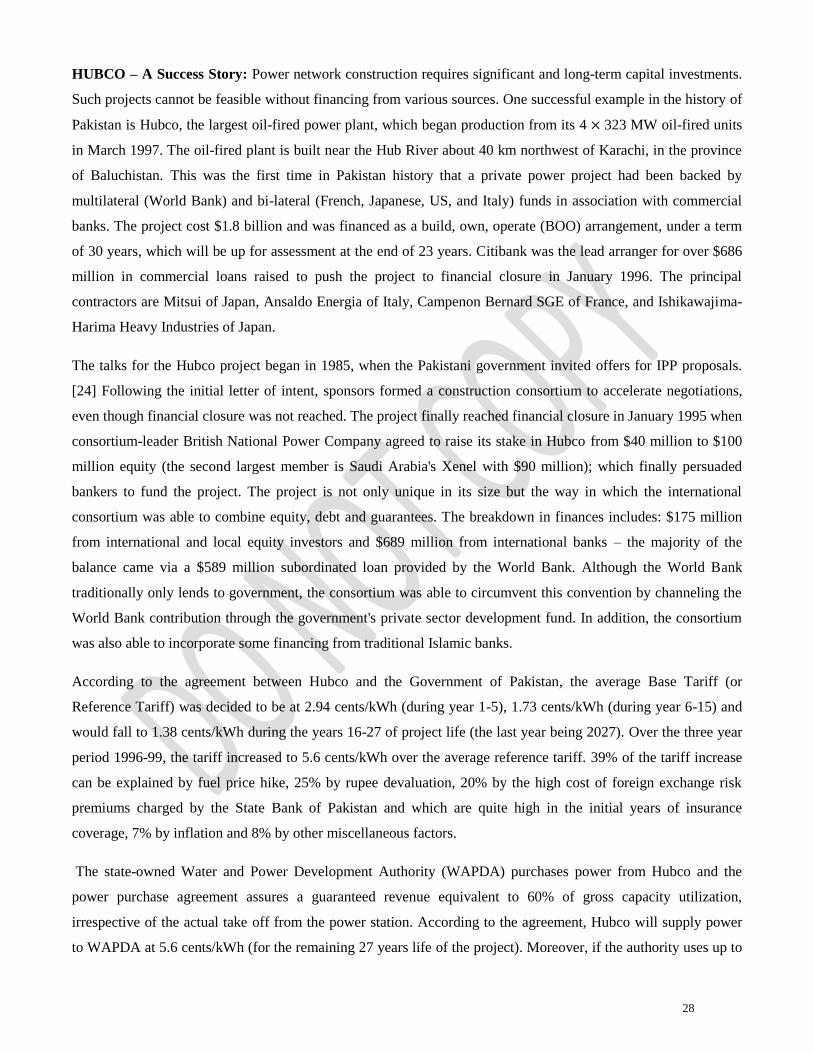
HUBCO – A Success Story: Power network construction requires significant and long-term capital investments.
Such projects cannot be feasible without financing from various sources. One successful example in the history of
Pakistan is Hubco, the largest oil-fired power plant, which began production from its 4 323 MW oil-fired units
in March 1997. The oil-fired plant is built near the Hub River about 40 km northwest of Karachi, in the province
of Baluchistan. This was the first time in Pakistan history that a private power project had been backed by
multilateral (World Bank) and bi-lateral (French, Japanese, US, and Italy) funds in association with commercial
banks. The project cost $1.8 billion and was financed as a build, own, operate (BOO) arrangement, under a term
of 30 years, which will be up for assessment at the end of 23 years. Citibank was the lead arranger for over $686
million in commercial loans raised to push the project to financial closure in January 1996. The principal
contractors are Mitsui of Japan, Ansaldo Energia of Italy, Campenon Bernard SGE of France, and Ishikawajima-
Harima Heavy Industries of Japan.
The talks for the Hubco project began in 1985, when the Pakistani government invited offers for IPP proposals.
[24] Following the initial letter of intent, sponsors formed a construction consortium to accelerate negotiations,
even though financial closure was not reached. The project finally reached financial closure in January 1995 when
consortium-leader British National Power Company agreed to raise its stake in Hubco from $40 million to $100
million equity (the second largest member is Saudi Arabia's Xenel with $90 million); which finally persuaded
bankers to fund the project. The project is not only unique in its size but the way in which the international
consortium was able to combine equity, debt and guarantees. The breakdown in finances includes: $175 million
from international and local equity investors and $689 million from international banks – the majority of the
balance came via a $589 million subordinated loan provided by the World Bank. Although the World Bank
traditionally only lends to government, the consortium was able to circumvent this convention by channeling the
World Bank contribution through the government's private sector development fund. In addition, the consortium
was also able to incorporate some financing from traditional Islamic banks.
According to the agreement between Hubco and the Government of Pakistan, the average Base Tariff (or
Reference Tariff) was decided to be at 2.94 cents/kWh (during year 1-5), 1.73 cents/kWh (during year 6-15) and
would fall to 1.38 cents/kWh during the years 16-27 of project life (the last year being 2027). Over the three year
period 1996-99, the tariff increased to 5.6 cents/kWh over the average reference tariff. 39% of the tariff increase
can be explained by fuel price hike, 25% by rupee devaluation, 20% by the high cost of foreign exchange risk
premiums charged by the State Bank of Pakistan and which are quite high in the initial years of insurance
coverage, 7% by inflation and 8% by other miscellaneous factors.
The state-owned Water and Power Development Authority (WAPDA) purchases power from Hubco and the
power purchase agreement assures a guaranteed revenue equivalent to 60% of gross capacity utilization,
irrespective of the actual take off from the power station. According to the agreement, Hubco will supply power
to WAPDA at 5.6 cents/kWh (for the remaining 27 years life of the project). Moreover, if the authority uses up to

29
64.4% of total production; in the case of higher usage, then the cost falls to 5 cents/kWh. By establishing a
standard agreement for power investment – especially in implementation, fuel supply, and power purchase
agreements – the national government ensured that all investors are treated equally in the negotiation process. One
major incentive was the government agreement to provide foreign exchange risk cover for the principal and
interest payments under the debt facilities.
PAKISTAN DEBTS & IMF (International Monetary Fund): Pakistan has relied on the IMF to prop up
its economy for a few years. Since 2008, the IMF has disbursed $7.27 billion, including the last release of $1.13
billion in May 2010. But reports suggest the Fund was dissatisfied with Islamabad's progress in dealing with its
chronic fiscal problems and promised structural reforms. “Economic growth has been negatively affected by the
last year floods (2010) and the high price of oil, inflation remains persistently high, and budgetary problems are
undermining macroeconomic stability,” reports said. The IMF also urged an increase in government spending on
health, education, and infrastructure, and stronger monitoring of the financial sector to ensure stability.
The IMF suspended its loan program in May 2010 due to the government's failure to implement tax reforms. The
suspension has pushed the country into a fiscal emergency. The government is forced to borrow from the central
bank to run its affairs, while the central bank is printing money to provide the government about 2 billion
Pakistani rupees (23.5 million USD) a day. As a result, Pakistan’s economy suffers high inflation and the value of
the Rupee has fallen from 60 to 1 USD to over 86 to 1 USD in a few months. Meanwhile Pakistan’s debts have
accumulated to 58 billion USD (2010 est) – about 1/3 of Pakistan’s GDP in 2010. Pakistan is on the verge of
bankruptcy as the trade deficit is increasing, tax collection is low and the industrial sector is crumbling with the
energy crisis. The government is trying to generate revenue by increasing oil prices and collecting a petroleum tax.
Also the security concerns stemming from the nation's role in the War on Terror have created great instability and
led to a decline in Foreign Direct Investment (FDI) from a height of approximately $8 billion to $3.5 billion for
fiscal year 2010.
Facing all these challenges, the national government, for the first time in years, has sought external funding as
Balance of Payments support. Consequently, S&P lowered Pakistan’s foreign currency debt rating from B to
CCC-plus, just notches above a level that indicates default. Pakistan’s local currency debt rating was lowered to
B-minus from BB-minus. [25] Credit agency Moody’s Investors Service cut its outlook on Pakistan’s debt from
stable to negative due to political instability, though it maintained the country’s rating at B2. The cost of
protection against a default in Pakistan’s sovereign debt trades at 1800 basis points, according to its five year
credit default swap, a level indicating that investors believe the country is already in or will soon be in default.
10. CALL FOR ACTIONS
Pakistan’s current energy mix is highly imbalanced which depends heavily on crude oil and natural gas. The
country is spending $10-12 billion a year to import crude oil and petroleum products. The deficit is gradually

30
increasing and such an energy mix is not sustainable and cannot meet the
increasing demand in the long run. The dilemma faced by the country is that
while Pakistan is bestowed with huge natural coal reserves labeled as “black
gold,” the country is in a deep financial and energy crisis, and thus unable to
finance projects to develop and utilize the resource. This vicious cycle is
shown more explicitly in the right figure: to develop the energy
infrastructure based on coal, Pakistan needs significant capital; however,
with the current debts and credit rating, it is hard for the government to borrow such funds and even if it is
possible, it will come with significant interest. To change the financial condition of the country, Pakistan must
grow the economy, however, without energy, it is just infeasible. Another serious concern is timing – the
industrial sector needs immediate energy to survive and is almost on the verge of collapse. The high inflation and
unemployment rate is pushing more people into poverty. As a result, the political and social infrastructure is
crumbling. In summary, for the future energy security and economic prosperity of Pakistan, the country must
come up with a creative plan to develop the energy supply chain around coal resources to address both the
immediate and long-term needs.
QUESTIONS
1. What do you think about the government’s plan of exploring Thar coal fields? How long will it take and
how much will it cost? Can the country afford it and wait for it under the current condition?
2. How to set realistic objectives for the country to meet its energy needs in the short and long-term to
prevent significant economic and social losses?
3. What would you recommend to build up an energy supply chain utilizing the coal resources to meet both
the immediate and long term objectives of the country?

31
Appendix
Rank 27th (PPP), 47th (Nominal) by (IMF)
Currency
1 Pakistani Rupee (PKR)
1 USD=86 PKR
1 Rs. = 100 Paisas
Fiscal year July 1–June 30
Trade organizations ECO, SAFTA, ASEAN, WIPO and WTO
Statistics
GDP $174.8 billion (nominal)(2010)
$464 billion (GDP-PPP) (2009)
GDP growth 2.7% (2011)
GDP per capita $2400 (2010)
GDP by sector agriculture: 19.6%, industry: 26.8%, services: 53.7% (2007)
Inflation (CPI) 16-17% (2009-2010)
Population below
poverty line 40% (2010)
Labor force 55.88 million (2009 est.)
Unemployment 15% (2011 est.)
Main industries
Textiles, chemicals, food processing, steel, transport
equipment,automobiles, telecommunications,machinery, beverages, construction,materials, clothing, paper
products
Ease of Doing Business
Rank 83rd
External
Exports $24 billion (2011 est.)
(67th)
Export goods textile goods (garments, bed linen, cotton cloths, and yarn), rice, leathergoods, sports goods, chemicals
manufactures, carpets and rugs
Main export partners United States 22.4%, UAE 8.3%, UK6%, China 15.4%, Germany 4.7% (2006 est.)
Imports $28.31 billion f.o.b. (2009 est.)
Import goods Petroleum, Petroleum products, Machinery, Plastics, Transportation equipment, Edible oils, Paper and
paperboard, Iron and steel, Tea
Main import partners China 14.7%, Saudi Arabia 10.1%,UAE 8.7%, Japan 6.5%, United
States5.3%, Germany 5%, Kuwait 4.9% (2006 est.)
Public finances
Public debt $58 billion (2010)
Revenues $23.21 billion (2009 est.)
Expenses $30.05 billion (2009 est.)
Credit rating
Standard & Poor's
B- (Domestic)
B- (Foreign)
B- (T&C Assessment), Outlook: Stable
Exhibit 2.2: Economy of Pakistan

32
References
[1] http://www.aptma.org.pk/Pak_Textile_Statistics/tec.ASP
[2] http://en.wikipedia.org/wiki/Economy_of_Pakistan
[3] http://data.worldbank.org/country/pakistan
[4] http://pportal.punjab.gov.pk/portal/
[5] http://www.sindh.gov.pk/
[6] Energy Crisis and Pakistan. (2007). Economic Review (05318955), 38(6/7), 16-18.
[7] http://www.scribd.com/doc/53512742/Pakistan-Energy-Yearbook-2010
[8] http://irrigation.punjab.gov.pk/
[9] http://www.mpnr.gov.pk/
[10] Natural Gas A Boon. (2011). Economic Review (05318955), 42(1), 27-28.
[11] http://en.wikipedia.org/wiki/Fuel_extraction_in_Pakistan
[12]http://www.parco.com.pk/index.php?option=com_content&view=article&id=162&Itemid=173
[13] http://www.oil-price.net/
[14] http://www.paec.gov.pk/paec-inst.htm
[15] http://www.nuclearsuppliersgroup.org/Leng/default.htm
[16] http://www.aedb.org/Main.htm
[17] http://www.sindhcoal.gos.pk/
[18] http://en.wikipedia.org/wiki/Pakistan_Railways
[19] http://en.wikipedia.org/wiki/National_Highways_of_Pakistan
[20] http://www.sngpl.com.pk/
[21] http://ssgc.com.pk/ssgc/
[22] http://www.wapda.gov.pk/
[23] http://www.kesc.com.pk/en/section/ourbusiness/
[24] http://www.hubpower.com/about-hubco.php
[25] http://www.imf.org/external/country/PAK/index.htm