ajsi vol. 4, issue 1 may, 2019 value chain analysis of
TRANSCRIPT

AJSI Vol. 4, Issue 1 May, 2019
23
Value chain Analysis of Coffee (coffee Arabica): the case of Arsi zone,
Oromiya National Regional State of Ethiopia
Samuel Weldeyohanis 1*
and Kedir Amare1
1 Department of Agribusiness and Value chain Management, College of
Agriculture and Environmental Science, Arsi University, Aslla, Ethiopia
Corresponding author: Samuel Weldeyohanis Email:
Abstract
This study aimed at value chains analysis of coffee in selected districts of
Arsi zone, Oromia, Ethiopia with specific objectives of identifying the major
coffee value chain actors, their roles and functions, identifying the existed
coffee marketing channels, analyzing the market performance of actors
(benefit distributions) and identifying the constraints and opportunities along
the coffee value chain. Descriptive statistics, value chain approaches, market
performance analysis were used to analyze the data. The value chain analysis
revealed that, input suppliers, producers, primary cooperatives, collectors,
wholesalers, exporters and consumers were the main coffee value chain
actors. The share of margin in coffee value chain revealed that, producers
(51.9%) take the line share followed by exporters (21.26%) and wholesalers
(10.31%) while primary cooperative and local collectors are poorly
positioned in the coffee value chain in the study area. Constraints like price
fluctuation, shortage of market information, higher input cost, limited
extension services, long distance to the market, diseases and pests, poor
linkage with value chain actors, using inappropriate drying methods and lack
of packaging materials are major challenges in coffee value chain in the

AJSI Vol. 4, Issue 1 May, 2019
24
study area. Thus, Policy aiming at increasing farmers‟ access to market
information, training on pre and post-harvest management developing and
improving infrastructure, facilitating extension services, improving
cooperative development and strengthening linkages of actors are
recommended to enhance the development of coffee value chain in the study
area.
Key words: Coffee (coffee Arabica), Value chain analysis, Market margin
1. Introduction
1.1. Background of the study
Coffee is one of the most important commodities in the world economy and
the production of this commodity varies across regions and Ethiopia‟s most
important cash crop, with more than 15 million people directly or indirectly
depending on it for their livelihoods and is deeply intertwined in the
country‟s social, cultural and historical identity (GAIN, 2014). Coffee is the
backbone of the Ethiopian economy and is the leading commodity in
generating foreign exchange for the country (Hassan, 2015; Mekonin, 2017).
Coffee is the most important crop in the national economy of Ethiopia and
the leading export commodity and is well known not only for being the home
of Arabica coffee, but also for it is very fine quality coffee acclaimed for its
aroma and flavor characteristics (Anwar,2010).
In developing countries in Africa, efforts have made to link production with
agribusiness for better growth in the agricultural sector, however the crops
value chain including coffee are affected by constraints such as poor
infrastructure; low value addition, lack of markets access; poorly functioning
input markets; difficulties accessing land, water, and finance; and inadequate
skills and technology (World Bank, 2015).

AJSI Vol. 4, Issue 1 May, 2019
25
Coffee in Ethiopia, despite its importance, the performance of its sector has
remained unsatisfactory and smallholder producers face a number of
challenges in the form of low productivity and quality, lack of access to
markets, little opportunities for value addition, lack of capital and access
to credit to invest in machineries and to pay for transport to sell
outputs (Seneshaw and Bart,2016). In Ethiopia, coffee is mainly produced in
Oromiya National Regional State and SNNPR of Ethiopia and these regions
shares 2.64% and 1.24% respectively from total of 4% coffee produced in
the country (CSA, 2016). Arsi Zone is one of the top ten coffee producing
areas in Oromiya region and nearly 70% of the districts (17 districts) of this
zone have suitable agro ecology for coffee production. From all grains
produced in this zone, coffee ranks 5th
and the second most important cash
crop next to oilseeds (CSA, 2016) where Gololcha (37.69%), Shenen Kolu
(33.35%), Chole (17.92%) Seru (3.81%), Amigna (2.18%), Aseko (1.67%)
and Sude (1.06%) districts takes the line share in coffee production of the
zone (Arsi Zone Coffee and Tea Authority, 2016).
The quality standards of Ethiopian coffee are classified according to their
origin of production. Among the best known coffee varieties in Ethiopia,
Harar, Wollega, Limu, Sidama and Yirga cheffee take the priority. The first,
Harar coffee is the highest premium coffee in Ethiopia and also in the world.
Harar coffee has medium size bean, with a greenish to yellowish color with
medium level of acidity and a distinctive mocha flavor (ECXA, 2008) as
cited in (Mekonnin, 2017).
For every cup of coffee we drink, there is a story from crop to cup. In a value
chain, coffee beans go through different process before they reach the hands
of a consumer (Kodigehalli, 2011). As a product moves from the producer to
the consumer, a number of transformations and transactions take place along

AJSI Vol. 4, Issue 1 May, 2019
26
a chain of interrelated activities, and value is added successively at each
stage of the chain. The term value chain is used to characterize the set of
interconnected and coordinated links and linkages that take place as a
product moves from the primary production unit to the 2 final consumers.
Kaplinsky and Morris (2001) define the chain as the full range of activities
that are required to bring a product from conception, through the
intermediary stages of transformation, delivery to final consumers, and final
disposal after use. Different researches conducted around the world have
identified the key advantage of value chain analysis. According to Fitter and
Kaplinksy (2001) the study of coffee value chain is described as being key to
analytical insights. A review on the potential of value chain for rural
economic development in Ethiopia by Gashaw (2016) concluded the benefit
obtained from value chain development interventions, carefully
implemented, weigh up by far than the unintended negative consequences to
generalize that no doubt is value chain relevant for rural economic
development in Ethiopia.
Even though, Ethiopia is a home for coffee production, there are different
constraints along its value chain. According to (Getu,2011), coffee
production and quality improvement face challenges in Ethiopia as result of
problems created social and natural factors such as: deforestation land
degradation, climate change, diseases, crop replacement, weak stakeholder
linkages, predominant traditional production failure of using appropriate
coffee technologies, little market promotion & incentive mechanism
challenges; inadequate services (credit, inputs, equipment‟), low price shares
& benefit (farmers), increasing costs of production, processing & marketing,
lack of sustainability & competitiveness in the coffee sector. As a
consequence, the need for improving performance of coffee value chain is

AJSI Vol. 4, Issue 1 May, 2019
27
not sufficiently addressed in Ethiopia regardless of some efforts from the
government to improve and support the sector.
Value chain analysis is a significant concept in strategies to reduce rural
poverty in developing countries which offer the farmer the possibility to
acquire new knowledge in production and all value chain actors (Humphrey
and Schmitz, 2000). However, little attention has been paid to the value
chains of commodities by which agricultural products reach final consumers
and to the intrinsic potential of such chains to generate value added and
employment opportunities (UNIDO, 2009).
The performance of coffee value chain is affected by numerous pertinent
issues downstream from supply utilization of inputs, the agricultural
practices, and trust between value chain actors, governance, marketing and
their interdependency (Girma, 2015). In general, the above mentioned
problems in the coffee value chain hinder the potential gains that could have
been attained from the existing potential opportunities due to poor linkage of
actors, mistrust among actors, lack of cooperation from exporters and
suppliers, limited financial services.
Value chain analysis is an interesting and mandatory task to identify the key
leverage points for upgrading strategies related with increasing performance
and efficiency of smallholder farmers. In this regard, value chain analysis is
essential to explain the connection between all the actors in a particular chain
of production and distribution as it shows who adds value and where, along
the chain and it helps to identify pressure points and make improvements in
weaker links where returns are low (Schmitz, 2005).
Coffee value chains are found at the core of high-impact and sustainable
initiatives focused on improving productivity, competitiveness,
entrepreneurship growth. It focuses the shifted from agricultural production

AJSI Vol. 4, Issue 1 May, 2019
28
to consumer demand, marketing and the coordination of product flows from
producers to consumers. The value chain concept acknowledges that
production must be linked to demand and the critical role of organizing the
flow from farmer to consumer opportunities (UNICAF, 2016). Even though
several scholars have tried to research on coffee value chain, still various
problems need scientific investigation to identify and address through
strategic value chain research. However, the existing studies on value
chain analysis the case of Arsi Zone were mainly focused on major grain
crops other than coffee which shows the study on the coffee value chain is
scanty and there is limited studies undertaken before and as a result empirical
evidence on coffee value chain which integrates the farmers to the regional
and national markets is lacking.
Regarding the information investigated by researchers about Arsi zone
coffee subsector, particularly districts like Gololcha the farmers are notable
in the country for their agricultural works like coffee farming. Here many
producers practice basic subsistence farming techniques and do not plan
ahead for improved crops in the future. But there are some farmers organized
under basic cooperatives and engaged to practice advanced concepts of using
improve production technology for the famous white honey, called coffee.
According to (Jima, et .al, 2017, Coffee Consulting 2014) report finding,
lack of improved coffee seedlings varieties, disease and pest incidence and
khat competition with coffee farming stated as hindrance to fully benefit
from coffee value chain opportunities. Despite coffee is economically
important commodity of small holder producers in Arsi zone, insufficient
regulation of the price of coffee where collectors and suppliers set their own
price usually below the market price, hurts the income of coffee farmers and
discourages their production and marketing directly and significantly
decreases the country‟s foreign exchange that should have been obtained

AJSI Vol. 4, Issue 1 May, 2019
29
from the commodity. Coffee supply chain works in an international way, the
direct link between producers and exporters are not present. Coffee is traded
down a complex line of intermediaries, ranging from local collectors and
primary farmers` cooperatives, who each capture a percentage of the retail
value of coffee. Analyzing why these intermediaries capture the enormous
share of profits is critical to understand in order to help farmers realize a
higher share of retail prices. While it changes hands, coffee undergoes a
complex transformation. Thus, examining the performance of actors along
the coffee value chain is fundamental to improve their efficiency in the value
chain development since value chain analysis has become a key tool for
exploring agriculture markets in developing economies as it enables to
understand power relationships between various actors in the chain and it has
the potential to identify interventions that would benefit the poorest, least
powerful actors (Kaplinsky and Morris 2001, Henricksen et al, 2010).
Therefore, in this paper, we analyze coffee value chain with the specific
objectives of identifying the major coffee value chain actors, their roles and
functions identifying the existed coffee marketing channels, analyzing the
market performance of actors (benefit distributions) along the value chain
and identifying the constraints and opportunities along the coffee value chain
in Arsi zone to design viable upgrading strategies for innervations.
2. Methodology
2.1. Description of the study area
The study was conducted in four potential coffee producer districts of Arsi
Zone in Oromia region those selected purposively on the basis of their actual
or potential in coffee production.
Gololcha district: is located at about 218 km from Addis Ababa and 206 km
from Asella. This district is bordered by aseko , amigna , daro lebu and
and chole districts in the north, south east and west respectively. It is

AJSI Vol. 4, Issue 1 May, 2019
30
found at an altitude ranging from 1400 and 2500 meter above sea level
.Major crops produced in the district are coffee, maize, sorghum, teff and
groundnut (Jima ,et al., 2017). Coffee plantation enterprise is also found in
the district. Gololcha is the 14th
from top 25 coffee producing districts in
Ethiopia and 7th
from top 18 coffee producing districts in Oromia
(James ,et al., 2015).
Chole district: Chole district is located at 219 km to the east of Addis Ababa
and 144 km from Asella which is bordered by Guna district in north
direction, Aminya and Sude districts in south direction, Gololcha district in
east direction and Sude district in west direction. The major crops produced
in the district were wheat, barley, maize, faba been, teff, sorghum, coffee and
chat (source: Jima et al., 2017).
Seru district: is one of the 26 districts of Arsi zone and found this town has
a latitude and longitude of 07°40′n 40°12′e with an elevation of 2302 meters
above sea level. It is bordered by Amigna district in the north and northwest,
robe district in west and southwest, bale zone in the south and southeast and
west Hararghe in the east (https://en.wikipedia.org/wiki/Seru).
Aseko is one of the woredas in Arsi zone of oromia region which is
bordered on the southwest by chole, on the northwest by merti, on the north
by the mirab (west) hararghe zone, and on the east by gololcha. The altitude
of this woreda ranges from 1000 to 2900 meters above sea level. Coffee,
khat, bananas and flax are important cash crops
(https://en.wikipedia.org/wiki/Aseko).
The following figure shows map of the study areas in Arsi Zone.

AJSI Vol. 4, Issue 1 May, 2019
31
Figure 1: Map of the study area
Source: Own sketch
2.2. Sources of data, type of data and methods data collection
In this study, both quantitative and qualitative data types were used and were
collected from both secondary and primary sources. Secondary data were
collected from published and unpublished documents, reports, from different
governmental offices found in the districts .i.e. from Agricultural and rural
development office, CSA, ECX, Trade and Market Development office and
zonal offices (Arsi zone Agriculture and rural development office, Coffee
and Tea Authority, trade and Market Development office, Road and
Transportation office, etc. ) whereas the primary data were collected from
coffee producers and intermediaries (cooperatives, collectors, wholesalers,
processors, exporters and consumers) through household survey methods
using tools like questionnaires, group discussion and key informant
interview. The household survey was focused on collecting quantitative data

AJSI Vol. 4, Issue 1 May, 2019
32
on production and marketing of farm produce, as well as socio economic
factors, resource ownership, and farm activities using questionnaire while the
qualitative fieldwork was done through focus group discussion and key
informant interview methods using the checklist prepared for the study. A
semi-structured questionnaire (a combination of both structured and
unstructured) was employed to collect primary data for the cropping season
of 20017/2018 from the sample respondents of the study area. Before
conducting the actual interview, the questionnaire was pre-tested and
overseen on few coffee producers (farmers) and traders who were not
included in the sample respondents. Pretesting of the questionnaire and
interview schedule was carried out by pilot testing & adjustments were made
depending on the obtained result. About 15 enumerators who have
experience in data collection was recruited and trained on the details of the
interviewing techniques and the contents of the questionnaire. The data
collection activities were held for four months (from December 1, 2018 to
March 30, 2019) with time schedule of the field work at different level of the
value chain actors with critical supervision of the researchers.
2.3. Sampling procedure and sample size
To select representative coffee producers from the study areas; three stages
sampling techniques were used. Firstly, four districts (Gololcha, Chole,
Aseko and Seru) were selected purposively based on their production
potential. Secondly, the existed kebeles from selected districts were stratified
into two strata based on the volume of coffee production as high, and
medium producer from selected districts and „11‟ kebeles from each stratum
were selected using stratified random sampling and Finally, 349 sample
coffee producers were selected proportional to the population size from
selected kebeles using Yamane (1967) sample size determination formula:

AJSI Vol. 4, Issue 1 May, 2019
33
.
Where = sample size, number of coffee producers, e = the acceptable
sampling error, hence 5% in this study; since the total coffee producers of the
selected kebele was 5498, the sample size was 349 using the formula give
above.
, . To reduce the sample size, adjusted sample size
method were use as follows;
,.
Table 1: Sample size distributions from selected woredas
No. Name of
selected
district
Name of kebeles Total
coffee
producers
Proportion
of each to
total popn.
Sample size
from each
kebele
1 Aseko Lencha Oda 378 0.065 23
Chefa Kuyo 264 0.048 17
Sub- total 642 0.123 40
2 Chole Magna lega Buna 554 0.100 35
Magna Oda Adi 612 0.111 39
Magna Derartu 602 0.109 38
Sub-total 1,768 0.316 112
3 Gololcha Gedo Seka 762 0.139 49
Mine Gora 795 0.145 51
Mine Tulu 402 0.073 25

AJSI Vol. 4, Issue 1 May, 2019
34
Haro Akiya 442 0.080 28
Sub-total 2,401 0.429 153
4 Seru Waje 308 0.056 20
Bubulkuche 379 0.069 24
Sub-total 687 0.131 44
Total 5498 1.000 349
Source: from each district of 2019
In addition to producers, samples were taken from 28 middlemen‟s
(collectors, wholesalers, and exporters) and cooperatives (both primary and
union) based on the response given by the farmers using snow ball sampling
method.
2.4. Data Analysis
Descriptive analysis: Descriptive statistics such as actor‟s performance
analysis and SWOT analysis were used to understand the coffee value chain.
The coffee value chain actors` functions and characteristics as well as its
market channel of the study area were identified and explained. Moreover,
the current coffee value chain map of the study area was mapped,.
Furthermore, marketing performance (margin and financial profit share) of
actors was computed and finally, chains which need upgrading were
identified and the intervention needed was suggested. Marketing margin of
actors was calculated by taking the difference between coffee producers‟
price and retail price. This can be calculated mathematically as, the ratio of
producers‟ price to consumers‟ price as expressed in Equ. 3:

AJSI Vol. 4, Issue 1 May, 2019
35
We also compute gross marketing margin (GMM), Total Gross Marketing
Margin (TGMM) and Net Marketing Margin (NMM).
Gross marketing margin is calculated as specified in Equ. 4:
Where GMM=Growth marketing Margin
Total gross marketing margin (TGMM) is important to analyze the other
margins and is given by the difference between producer‟s (farmer‟s) price
and consumer‟s price (price paid by final consumer) and is calculated as
given in Equ. 5
Gross Market Margin of individual actors (jth
): - To find the benefit share of
each actor the marketing margin was calculated at a given stage “j” and
given in Equ.6
)
Where, SPj is selling price at jth
stage and PPj is purchase price at jth
stage.
Net Marketing Margin (NMM): - is the percentage over the final price
earned by the intermediary by deducting the marketing costs and is
calculated as follows:

AJSI Vol. 4, Issue 1 May, 2019
36
3. Result and discussion
3.1. Demographic Characteristic of coffee Value Chain Respondents
We used descriptive analysis to summarize the demographic actors, the
value chain analysis, and the constraint analysis in this study. Table 1 blew
summarizes the demographic characteristics of producers and traders in
terms of sex, age, family size, experience, marital status and education those
which are actors in coffee value chain. The analysis illustrated that, about
94.85% of the sample producers were male headed while the rest 5.15%
were female headed households. Regarding sample coffee traders, about
75% of local collectors were male headed household while 25% of them
were female headed. Moreover, all of (100%) the traders` samples of
wholesalers and exporters were male headed households. These indicate that
both males and females are participant in production and trading as well as
consumption of coffee.
Table 1: Demographic characteristics of sample coffee value chain actors
Characteristics Statistical
measures
Producers
(N=349)
Collectors
(N=20)
Wholesalers
(N=6)
Exporters
(N=2)
Age Mean 44.15 42.93 44.67 38.67
Std.Dev 11.36 4.39 6.75 2.52
Max. 80.00 48.00 56.00 41.00
Min 24.00 33.00 37.00 36.00

AJSI Vol. 4, Issue 1 May, 2019
37
Family size Mean 7.28 4.20 7.00 4.67
Std.Dev 3.41 0.77 1.32 6.00
Max. 17.00 6.00 9.00 4.00
Min 1.00 3.00 5.00 3.00
Experience Mean 14.86 6.47 11.11 2.67
Std.Dev 6.09 1.96 3.02 2.08
Max. 30.00 9.00 14.00 5.00
Min 5.00 4.00 6.00 1.00
Sex Male Frequency 331 15 6 2
Percentage 94.85 75.00 100 100
Female Frequency 18 5 - -
Percentage 5.15 25.00 - -
Single Frequency 7 - - -
Percentage 2.01 - - -
Marital Married Frequency 333 20 6 2
Percentage 95.42 100.0 100 100
Widowed Frequency 7 - - -
Percentage 2.01 - -
Divorced Frequency 2 - - -
Percentage 0.57 - - -

AJSI Vol. 4, Issue 1 May, 2019
38
Literate Frequency 99 20 6 2
Educati
on
Percentage 28.37 100.00 100 100
Illiterate Frequency 250 - - -
Percentage 71.63 - - -
N=Number of respondents; Source: Own computation from survey result,
2018/19
From total of the respondents included in the producers` sample, about
28.37% of them had formal education (can read and write) while the
majority (71.63%) had not attend any formal education (cannot read and
write). However, the entire sample of coffee traders (local collectors,
wholesalers and exporters) had formal education in different grade level. The
average age of the sample producers, Local collectors, wholesalers
(processors) and Exporters were 44.15, 42.93, 44.67 and 38.67 years with
standard deviation of 8.33, 4.39, 6.75 and 2.52 years respectively. Farming
experience is taken to be the number of years that an individual was
continuously engaged in Coffee production and trading activities. The
average years of coffee farming experience of the farmers was found to be
14.86 years with 5 and 30 years of minimum and maximum respectively.
The collectors and wholesalers have an average of experience in coffee
trading 6.47 and 11.11 years ranging from 9 to 4 and 6 to 14 years
respectively while exporters have an average of experience in coffee
exporting 2.67 and 15.92 years ranging from 1 to 5 and 9 to 21 years
respectively. The average family size of the producers is 7.28 persons and
ranges from 1 to 17 persons while the collectors, wholesalers and Exporters
have average family size of 4.2, 7.0 and 4.67 persons ranging from 3 to 6, 5
to 9, and 3 to 4, 3 persons respectively.

AJSI Vol. 4, Issue 1 May, 2019
39
3.2. Coffee Value Chain Analysis in the study area
3.2.1. Coffee value chain Actors and their roles in the study area
Input Suppliers: In study areas, input dealers for coffee are a government
organization such as district agriculture office (DAO) and mechara research
center, Oromia Seed enterprise organization and model farmers, primary
cooperative and cooperative union supplies to the producers all agricultural
input such as fertilizers, chemical and packaging material. Besides, some
traders provide some input like the sisal sack and other for some model
farmers.
Coffee producers: In the study area, the small-scale producers of coffee
regarded as garden production system in the chain of coffee and the majority
of them are located in the rural areas where access to the market is very
difficult. These are the key actors who are directly involved in coffee
production activities and perform most of the value chain functions including
planting, Weeding, cultivating, pruning, thinning, pest/disease controlling,
harvesting and post-harvest handling (cleaning) , drying, storing, packing
and transporting their coffee bean. They engaged in producing and selling
their coffee in the form of red and dried cherry. The larger quantities of
coffee are sold after storing from two to four months after harvest to local
collectors, primary cooperatives, wholesalers, and consumers of the area.
Coffee producers in the study districts supply their product either to nearest
market (at kebele level) or woreda market using pack animal or traders come
to farm gate and buy from them. According to the study, 26.65% and 60.74%
of the producers sold their coffee at village market (kebele level) and woreda
market respectively whereas the remaining 12.61% sold at both village and
woreda market

AJSI Vol. 4, Issue 1 May, 2019
40
Table 3: Place of sale for coffee in the study area by coffee producers
Farmer`s response Type of market Frequency Percentage
Where do you sell your coffee
after harvest?
Village market 93 26.65
Woreda market 212 60.74
Both 44 12.61
Who are the actors involved as a
purchaser of your produce?
Actors Frequency Percentage
Local collectors 113 32.4
Wholesalers 244 69.9
Primary
cooperative
106 30.4
Cooperative
unions
70 20.1
Source: survey result of the study area, 2018/2019 production year
Local collectors (assemblers): Collectors (assemblers) are traders who take
contract for wholesalers to purchase from farmers and resale to wholesalers
by adding some value to each kilogram of coffee. Collectors are not legally
licensed, but they are an actor who purchases coffee from farmers in their
locality and remote areas and supply to traders. According to the interview
with traders key informant group and districts discussion with agricultural
and natural resource experts, collectors were often mix different qualities
having various moisture contents, and this would affect the whole stock

AJSI Vol. 4, Issue 1 May, 2019
41
because they purchase and sell either in red or dry cherry forms. Their
essential role is to bring coffee from very remote areas or village town to the
district market. They perform little value addition practices. They have no
warehouses of their own and therefore they immediately transfer the coffee
to legal traders called wholesalers or suppliers. They are the first actor that
links producers to other participating traders. The major market places where
coffee assemblers in and around the district undertake transactions are:
Chancho, Mine and Haro the case of Gololcha district; Aseko, Irrecha and
Lecha Oda the case of Aseko district; Derartu and Lega Buna the case of
Chole district; and Waji , Bubukulche, and Seru Abas the case of Seru
district. From all actors involved in coffee value chain, local collectors are
the most buyers of coffee from producers where about 45.7% of the coffee
produced by the farmers is sold to local collectors (table 3).
Primary Farmers` Cooperatives: Primary farmers` cooperatives are the
supplier of coffee to the cooperative unions mainly and to wholesalers in
small amount in Gololcha woreda which are organized and controlled by
district cooperative promotion office. The primary cooperative perform the
following functions; the first one is they collect coffee from members of the
primary cooperatives; second; they also purchase coffee in village town as a
group; third; they supply coffee to cooperative union called Arbagugu union
and to wholesalers in Gololcha district. They supply the collected coffee to
wholesalers directly without processing in order to reduce the processing
cost. However, they are involved in processing or hulling of coffee when
they are supplying to cooperative unions .primary cooperative of the district
have not any processing machine rather they processed coffee through
incurring costs to owners of processing machine at the district level mainly
to wholesalers those who have their own processing machine. They are act as

AJSI Vol. 4, Issue 1 May, 2019
42
a trader and collect coffee with the same price as collectors and sell with
similar price when they sell to both wholesaler and union.
Wholesalers (suppliers or processors): These were those participants of the
marketing system who are legally licensed market actors and buy coffee with
a larger volume than other actors. Wholesalers in the study area (found
Gololcha district) purchase coffee mainly from local collectors/small traders
and some part from individual farmers and primary cooperatives within the
district of both kebele level market (Haro and Mine) and woreda market
(Chancho). According to the survey result, they can collect coffee from only
legalized area of the districts by themselves or through their local agents and
supply usually to the central market through the ECX auction center to
exporters. Wholesales practices the value addition activity including drying,
sorting (grading), processing (pulping and hulling), packing by sisal bags and
storing in to their own warehouse in small amount in order to earn better
price. Wholesalers are found in Gololcha districts those who collect the
coffee cherry from both Chole and Gololcha districts. After hulling, for
value creation they clear and sort coffee beans by using hired daily labor
from defect berries, inert matter and small berries in order to get good quality
which get good grades that meet export standard before transporting to ECX
and auction center. Finally, the cleared coffee bean ware packed in the sisal
sack and transported to the Ethiopia Commodity Exchange warehouse of
Dire Dawa deliver center for inspection of quality, grading and bidding
which could be sold to exporters (standard export coffee) and wholesalers of
higher level those who are engaged in purchasing coffee from ECX that
could be re-sold to retailors for domestic consumption. Therefore, in the
coffee value chain two types of wholesales ; the first wholesalers are called
suppliers those who are collecting coffee from collectors or cooperative or
farmers , processing coffee by their won hulling machine and supplying to

AJSI Vol. 4, Issue 1 May, 2019
43
the exporters or Wholesalers through ECX. The other wholesales are those
who are registered and licensed in purchasing coffee for domestic
consumption that comes from suppliers. The second type wholesalers are not
have any contact with farmers or collectors ,even suppliers ,since coffee is
purchased through participating in bidding that accomplished by Ethiopian
commodity exchange. The second type wholesalers could be private or
cooperated as a form of cooperative that purchase coffee and sell to domestic
retailors that could be sold for domestic consumers in Ethiopia.
Cooperative Union: cooperative union is one of the actors involved in
coffee value chain in the study area. Even though there is a cooperative
union in Gololcha District they are not participating in coffee trading where
Arbagugu union was the major buyers of coffee from primary cooperative
and they are also exporter of coffee. They purchase coffee from primary
cooperative. They have not their own processing machine rather they pay for
owners of the machine and export coffee the same price with that of private
exporters. Thus, they add value such as storing, hulling/processing, clearing,
and sorting and takes to ECX for quality control and quality inspection and
sold to the exporter.
Exporters: Exporters are international traders who purchase standard coffee
from wholesalers (coffee suppliers) and sells to foreign countries. They
purchase coffee for export and domestic market at ECX trading floor through
the auction market from suppliers. According to the ECX marketing system,
both coffee buyers and sellers need to register as a member or agent to trade
through ECX. After the exporters purchase the coffee through their
respective agent in Dire Dawa, they transport it from the ECX warehouse of
Dire Dawa to their storehouse. They are often guided by the prices offered
by the ECX to make their purchases. Exporters add value to coffee by further
reprocessing, sorting, cleaning, and blending different quality coffee to

AJSI Vol. 4, Issue 1 May, 2019
44
increase quality, re-graded, and take samples back to Dire Dawa coffee
quality inspection center for re-inspecting and certifying for export
confirmation. Re-graded and export certified green bean (85%) coffee is
packed in sisal bags of 85 kg, labeled with coffee type, grade, date and
month of preparation for fulfilling traceability rule and transport to Djibouti
by long international truck and then after transfer coffee into containers and
ship to imported country mostly Saudi Arabian wholesalers.
Consumers: There are different types of consumers in the coffee chain.
They are the one who often gets the coffee from the domestic market and the
institutional consumers like different type of the coffee shop, hotel cafe,
university and high school that gets it from the retailers and sometimes from
wholesalers (exporter). On the other way, coffee exported to the international
market was sold to a different coffee shop and supermarket where the
consumer gets their coffee and consumer add value through roasting and
grinding.
3.2.2 Coffee value chain supporters and their Functions in the study
area
Agricultural Natural resource Office (ANRO): This is the government
organization who worked under Ministries of agriculture and natural
resource offices in closely with the farmers through the district. They prepare
the quality seeds and sow them on the nursery site, and when the seedling
reaches the transplanting stage, they distribute to the farmers. Besides, they
have a development agent worker who is living in each peasant association
with farmer and give advice for the farmer every time in his day-to-day
activities. Especially during coffee harvesting season, most employers of this
office are staying with the farmer in the village in order to control coffee
quality. Additionally, they are working on coffee marketing for controlling

AJSI Vol. 4, Issue 1 May, 2019
45
illegal collectors whom going to collect coffee from farmers without trade
license. They check quality, whether the coffees properly hulled, cleared and
sorted as well as they check from adulteration if another coffee type is mixed
during processing and packaging for certifying them with a letter of support
to transportation.
Mechara Agriculture Research Center (MARC): Mechara Agriculture
Research Center is a regional research institute that directly involves in
coffee research in West Hararge zone. The center provides support to the
farmers through improving agricultural technology, multiplication,
distribution of improved technology. The center is working closely with
Oromia seed enterprise on improving coffee variety in Gololcha districts.
Again the research center distributes for the District agricultural office and
the office planting on its nursery and distribute to the farmers.
Oromia Seed Enterprise Organization (OSEO): Previously this
organization is known by coffee farm state at the study area but now Oromia
seed enterprise purchase the farm from the federal government and owned
the organization. They are helping the surround farmers by preparing the
improved seed and distributing to them. They are closely works with district
agricultural and administration office calling them on the common agenda of
developing the capacity of the organization to improve the life of the
farmers. This organization is now focusing on multiplication of sorghum
seed rather than coffee seed by shifting coffee farm land to sorghum arm
land. But, farmers blaming this organization it is not good to degrade coffee
farming plant which is contributed to economic and keeping the balance of
global warm and it is helpful in working on coffee seed multiplication rather
than sorghum.

AJSI Vol. 4, Issue 1 May, 2019
46
Exported Coffee Quality Inspection Center (ECQIC): This is another
supporter participates in coffee quality controlling system. The main function
of the organization is to inspect exported coffee quality for meeting export
standard and provide traders with a certificate of exportation. They use
inspection standard criteria for checking the quality of the product given to
them by exporters by using this criterion all exporters prepare their coffee,
and re grade and give samples to the quality inspection center for
confirmation.
Woreda Trade office (TO): The woreda trade office has the mandate to all
agricultural marketing activities, especially in the licensing business actors.
They collect and pass all market information to the stakeholders. The
ministry has a direct relation with trader, exporter, ECX and until the
international market by collecting necessary information about domestic and
international market and pass this information between all actors.
Additionally, they have linked with National Bank of Ethiopia in controlling
currency rate.
Financial institution: Financial institutions have essential role in supporting
coffee value chain. They bring credit to the farmers as to buy seed and other
production input. It support the traders and other actors along value chain
through providing financial credit and saving as well as other related to
financial services.
3.2.3. Coffee Value Chain Map of the Study Area
The actual map of the input-output structure of the coffee value chain of Arsi
zone is presented in Figure 2 below and the functions performed by each
actor in the value chain are represented on a vertical axis. On the left-hand
side of the diagram, the main actors are represented using boxes with solid
lines at the middle, while the supporters are represented on the right-hand

AJSI Vol. 4, Issue 1 May, 2019
47
side. The downward arrow shows the exchange of money, the double arrow
shows the two-way information flow while the upward arrow shows the
product movement in the study area.
Source: own sketch
Figure 2: Value chain map for coffee in the study area

AJSI Vol. 4, Issue 1 May, 2019
48
3.3. Benefit share or Market Margin distributions of Actors in Coffee
Value Chain
Marketing margin of actors was calculated by taking the difference between
coffee producers‟ price and retail price in the study area in 2018/19
production year.
Table 4: Benefit share or Market Margin distributions of Actors in Coffee
Value Chain
Costs and
sales price
(birr/qt)
Produc
er/
farmer
Local
Collect
or
Primar
y
coopera
tive
Wholes
aler
Exporte
rs
(private
/Union)
Horizon
tal
Sum
Purchase price - 6,200.0
0
6,200.00 7,000.00 8,000.00 27,400.0
0
Production cost 1,161.85 - - - - - 1,161.85
Marketing cost 263.18 120 210 682.35 1,317.65 2,573.18
Total cost 1,425.03 6,220.0
0
6,460.00 7,682.35 9,317.65 31,105.0
3
Total cost (%) 4.58% 20.00% 20.77% 24.70% 29.96% 100.00%
Selling price 6,200.00 7,000.0
0
7,000.00 8,000.00 11,380.0
0
39,580.0
0

AJSI Vol. 4, Issue 1 May, 2019
49
Source: survey result from farmers and from key informant interview
Table 4 above shows the market margin analysis that is used to show the
distribution of the various actors as coffee move from farmers to different
value chain actors and was calculated by subtracting the purchase price from
sale price of the commodity in percentage in 2018/19 production and
marketing year in average. The relative size of various market participants‟
gross margins showed where in the marketing chain value is added and/or
profits are made (Tegegn, 2013). As it was shown on table 4; costs and sales
conducted by coffee producers and coffee traders (local collectors,
wholesalers and exporters) were the major actors in the marketing process of
coffee procured in Gololcha and Chole districts of Arsi Zone. The price of
coffee in these two districts are similar while the farmers sale their produce
to different buyers of coffee and thus it is the average cost and price is taken
in the table as it was collected from survey data during the time of the study.
As it was shown in table 7 above; coffee growers /farmers share the highest
marketing margin (51.94%) followed by coffee exporters (either private
exporters or unions) (21.26%) and wholesalers (suppliers) of the woreda
level (10.31%) of the study area whereas local collectors and primary
cooperative share the least market margin form the list in the study area
Market margin 5,038.15 800.00 800 1,000.00 2,062.35 9,700.50
Share of
margin
51.94% 8.25% 8.25% 10.31% 21.26% 100.00%
Profit margin 3,613.12 680.00 590 317.65 744.70 5,945.47
Share of profit 60.77% 11.44% 9.92% 5.34% 12.53% 100.00%
AJSI Vol. 4, Issue 1 May, 2019
50
during marketing year. Regarding share of profit (net profit) of actors in
coffee value chain , the same trend was repeated as that of margin
distribution in which coffee producers and coffee exporters shared the
highest net profit margins with respective value of (60.77%) and (12.53%)
respectively followed by local collectors (11.44%) and primary farmers`
cooperative (9.92%) while wholesales/ suppliers shared the least value
(5.34%) those who are poorly positioned as compared to the actors
participated in coffee value chain in the study area of the marketing year.
As, we can observe the result, local collectors are more benefited as
compared with that of wholesalers. This is due to the fact that , collectors
purchase coffee both lower quality and higher quality from the farmers with
lower price and sell to wholesalers as higher quality coffee by mixing up
these two types. In contrary to this, the wholesalers supply coffee to the
exporters which fulfill the standard coffee and incurred higher cost.
3.3.1. Coffee marketing channels of the study area
In order to identify the major types and major buyers of coffee, a question
which stated as “for whom did you sell your produce (coffee) in this
production year‟ was asked to the coffee growers during the investigation.
Accordingly, the coffee growers in Aseko districts sell their coffee cherry to
local collectors (44%) and to consumers (100%) both at village market
(Irrecha and Lencha Oda) and woreda market (Aseko) with average selling
price of 2955.19Birr whereas as coffee growers in Seru district also have
only to buyers of coffee ; consumers (83%) and local collectors (47.2%) like
that of Aseko woreda both at village and woreda market with average price
of 2955.19Birr; implied that an individual farmer has the alternative to sell
his produce both for consumers and local collectors simultaneously in Aseko
and Seru districts. However, coffee growers in Chole and Gololcha districts

AJSI Vol. 4, Issue 1 May, 2019
51
have three alternative buyers of coffee: these include: consumers, collectors
and wholesalers both at village and woreda market with varied amount.
Accordingly, 19.1%, 86.5% and 37.08% of the coffee producers in Chole
district sold their produce to consumers, local collectors and wholesalers
respectively with average selling price of 3038.43Birr whereas 14.8%,
71.9% and 40.1% of the producer in Gololcha woreda sold to their produce
consumers, local collectors and wholesalers respectively with average selling
price of 3138.65Birr. The percentage implies that one farmer has two
alternatives or market outlet and sells his produce both to consumers and
collectors the case of Aseko and Seru Districts whereas one producer in
Chole and Gololcha districts has three market outlets to sell his produce.
Table 5: Farmers` buyers of coffee in the study area
Name of
district
For whom did you sell your produce (coffee) in 2018/19 production year?
Consumers Local
collectors
Wholesalers Cooperative
Aseko
No
Freq
.
Percent Freq. Percent Freq. Percent Freq Percent
0 0.00 14 56.0 25 100 25 100
Ye
s
25 100 11 44.0 0 0.00 0 0.00
Chole No 72 80.9 12 13.5 56 62.92 89 100
Ye
s
17 19.1 77 86.5 33 37.08 0 0.00
Gololch
a
No 155 85.2 51 28.1 109 59.9 112 61.5
Ye
s
27 14.8 131 71.9 73 40.1 70 38.5

AJSI Vol. 4, Issue 1 May, 2019
52
Seru No 9 17.0 28 52.8 53 100 53 100
Ye
s
44 83.0 25 47.2 0 0.00 0 0.00
Total Yes
Do you sell your coffee to consumers? 113 (32.4%) = 21.2%
Do you sell your coffee to collectors? 244 (69.9%) = 45.7%
Do you sell your coffee to wholesalers? 106 (30.4%) = 19.9%
Do you sell your coffee to cooperatives? 70 (20.1%) = 13.2%
Source: own computation from survey result, 2018/19 of the study area
In the current study, marketing of coffee is carried at local market and
woreda market. Pricing is decided mainly by wholesalers which are ordered
by Ethiopian commodity Exchange (ECX) based on coffee quality. Some
times the price of coffee was also decided between traders and farmers based
on buyers‟ preferences to some extent based on grading through visual
estimation of the product. Marketing of coffee include different marketing
channels. Wholesalers and exporters mainly dominate in coffee value chain
in the study area. From the total volume of produced (2052.12 quintal) by
sample respondents in the study area, about 1472.7 quintal of coffee were
supplied by the farmers to different buyers of coffee (Figure 3).
From the total amount of coffee produced in the study area, about (21.2%) of
coffee was sold to the local consumers while the largest portion (45.7%) was
sold to coffee local collectors , (19.9%) was sold to wholesalers and the
small portion of coffee (13.2%) was sold to farmers` primary cooperatives
from the farmers or coffee growers during the production year at different
market place of selected districts where markets like Haro, Mine, Chancho ,

AJSI Vol. 4, Issue 1 May, 2019
53
Lega Buna and Derartu were the major market place of the transaction. All
portion of the coffee which is bought by local collectors from coffee
producers is directly sold to wholesalers which is sold to exporters and
domestic wholesalers which is used for domestic consumption in the country
after it is checked by ECX. The main buyers of coffee from producers are
local collector (45.7% or 673.02qt), wholesalers (19.9% or 293.07qt) and
consumers (21.2% 0r 312.2qt) respectively.
Figure 3: Marketing channels Map for coffee in the study area

AJSI Vol. 4, Issue 1 May, 2019
54
The main marketing channels identified from the point of production until
the product reaches the final consumer through different intermediaries were
depicted in figure 3 below from marketing channel map directed on Figure 3
which is the researchers own computation from the survey result in the study
area of 2018/19 production year. These are the following:
Channel 1: Producer Local Consumer
Channel 2: Producer Local Collectors Wholesalers Exporters
International Buyers
Channel 3: Producer Wholesaler Exporter International Buyers
Channel 4: Producer Primary Cooperative Wholesaler Exporter
International Buyers
Channel 5: Producer Primary Cooperative Union (woreda level)
Exporter International buyers
3.3. Performance of Coffee value chain actors along the marketing
channels.
Table 6: Performance of Coffee value chain actors along the marketing
channels
Items Gross and Net Marketing margin of actors along the Coffee
marketing channels (%)
I II III IV V
TGMM 0 46.5 44.6 46.5 46.4
GMMproducers 100 53.5 55.4 53.5 53.6
GMMcollectors -- 7.9 - - -
GMMcoop - - 7.9 7.90

AJSI Vol. 4, Issue 1 May, 2019
55
GMMwholesaler - 8.9 14.9 8.9 -
GMMunion - - - - 8.9
GMMexporter - 29.7 29.7 29.7 29.7
NMMcollectors - 6.00 - - -
NMMcoop - - - 5.2 5.2
NMMwholesal 2.8 8.9 8.9 -
NMMunion - - - - 8.9
NMMexporter - 18.12 18.12 18.12 18.12
Source: computation from survey result, 2018/19
The table 6 above showed that, channel I connects coffee producers directly
to local consumers of coffee in which all of the GMM (100%) is goes to
coffee producers since producers have not any purchase price and there is no
any intermediary between these two actors. In channel II, coffee is purchased
from producers and reached to exporters through local collectors and
wholesalers (suppliers) in the study area.
This channel is the longest channel where a number of actors participated
and about 46.5% of the total gross market margin (TGMM) is goes to
coffee traders such as; coffee collectors (7.9%) , wholesalers (8.9%) and
exporters (29.7%) in the study area and the largest 55.3% of the GMM is
goes to coffee producers. Since there are a number of intermediaries between
producers and the end buyer of the commodity, producers are not such
benefited along this channel as compared to other channels. In channel III,
about 44.6% of the TGMM is goes to coffee traders such as wholesalers
(14.9%) and exporters (29.7%) while the rest 55.4% of the GMM is goes to

AJSI Vol. 4, Issue 1 May, 2019
56
coffee producers. This result revealed that, establishing market linkage
directly with wholesalers is praiseworthy for producers and also for
wholesalers. Channel IV connects producers with wholesalers through
primary cooperatives in the study area where 46.5% of the TGMM is goes to
coffee purchasers such as primary cooperative (7.9%) wholesalers (8.9%)
and exporters (29.7%) whereas the rest 53.5% of the GMM is goes to
producers. Channel V joins coffee producers with producers through primary
cooperative and about 46.4% of the TGMM is goes to primary cooperatives
and Unions of the woreda level. Channel V and channel IV are is the second
and third most well-intentioned channels for coffee producers next to
channel III respectively.
Regarding the Net Marketing Margin (NMM), the highest value of NMM
was goes to coffee exporters (18.12%) along all coffee marketing channels
during marketing year. Coffee wholesalers or coffee suppliers gained about
2.8%, 8.9% and 8.9% profit (NMM) in channel II, III and IV respectively
whereas the NMM or profit of local collectors along channel II was about
6% which is 2.14 times higher than wholesalers` or coffee suppliers` net
marketing margin (NMM). This was due to the fact that, collectors
purchased coffee with lower price and sell to higher price and incur lower
marketing cost as compared to wholesalers or the local collectors purchase
both lower quality and higher quality coffee from producers and sell to
wholesaler by mixing these two types of coffee together and sell to
wholesalers with the same price (higher price). Moreover, primary
cooperatives were the gained least NMM (5.2%) and poorly positioned and
least benefited during the production year.

AJSI Vol. 4, Issue 1 May, 2019
57
3.4. Constraints and opportunities along coffee value chain of the study
area
3.4.1. Production constraints of coffee growers
Table 7: Coffee production constraints faced coffee growers in the study
area
Constraints Frequency Percentage Rank
Shortage of production land 63 18.05 2nd
Diseases and pest (CBD,CLR) 116 33.24 1st
Chemical shortage for disease and
pests
28 8.02 6th
Increase in price of inputs (high
input cost)
61 17.48 3rd
Limited extension services 35 10.03 5th
Climate change (drought) 46 13.18 4th
Total 349 100
Source: survey result, 2018/19 from the study area
Diseases and pests: A larger proportion of the respondents (33.24%)
reported that diseases and pets are the severe problem that farmers currently
faced in the study area followed by shortage of land scarcity since majority
of the farmers are currently shifted to chat production. According to key
informant interview with agricultural experts‟ Coffee berry disease (CBD),
coffee leaf rust (CLR) and dieback are the major disease which is highly
AJSI Vol. 4, Issue 1 May, 2019
58
reduces the production and moral defect to the farmers in the study area
currently. According to key informant interview pruning and better
management and decreasing of tree shade can decreases the effect of the
disease and insect.
Shortage of production Land: Land scarcity is the second challenge or
constraint faced by farmers of coffee producers and 18.05% of the farmers
raised there is the problem of land size in the study area. Land is an
important factor in producing the high quantity of coffee. According to
survey result shown on the table above, farmer holds 0.125 to 2.5 hectare of
coffee farm land with an average of 0.51 hectare per farmer. Accordingly,
interview with the key informant expert group discussion proper
management and use of enough input to their land holding is the only
solution to the farmers
Increase in price of inputs and limited access of inputs for coffee
production: The most important physical inputs for coffee production are
improved seeds, pesticide/herbicides pruning scissors, Sisal jute bags, and
mesh wire for drying and irrigation water. About 17.28% of the Farmers
replied increased price of inputs are the major problems faced by farmers in
the study area where are about 8% of them reported that limited access
(chemical shortage) and supply of inputs like improved seed as their
production problem which are the most limiting factor in quantity of coffee
supplied to the market. This is caused mainly due to the shortage of coffee
seed multiplying and distributing enterprise.
Limited access to extension services: Although institutional services are
present in the study area, the extension contact per year is limited or no such
frequent and it is general approach due to unbalanced proportion of
development agents and farmers in the study area. In other term, farmers

AJSI Vol. 4, Issue 1 May, 2019
59
need agricultural extension service and credit services. The respondents were
asked if they faced extension service problems and reported that about 10%
of the farmers reported that lack of extension service was the major limiting
factor for coffee production in the study area According to key informant and
farmer‟s interview replied, due to unsuitable agro ecological and no full
professional development agent and no active engagement of the financial
institution in supporting farmers and there is a shortage of the extension and
credit access services.
Climatic change: Climate change resulted to prolonged drought and
irregular rainfall is the most affecting variable in the study area. Due to an
increasing coming of the global warming there is a change cropping pattern
compared to previous decade years. Climate change was the 4th
limiting
factor for farmers in coffee production in which about 13.18 % of the
farmers reported as climate change is the production problem in the study
area. Due to an increasing of drought and lack of irrigation availability with
an irregular rainfall in the area, they are losing their product highly.
According to the interview with key informant group of the district expert,
due to an increasing coming of climatic change farmers are migrating to
other areas.
AJSI Vol. 4, Issue 1 May, 2019
60
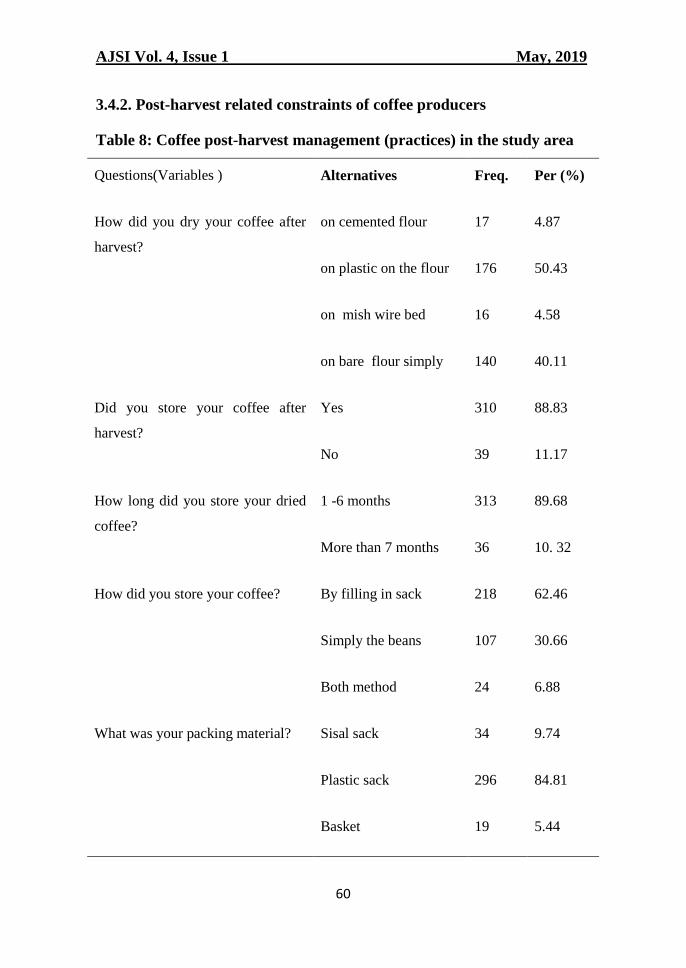
3.4.2. Post-harvest related constraints of coffee producers
Table 8: Coffee post-harvest management (practices) in the study area
Questions(Variables ) Alternatives Freq. Per (%)
How did you dry your coffee after
harvest?
on cemented flour 17 4.87
on plastic on the flour 176 50.43
on mish wire bed 16 4.58
on bare flour simply 140 40.11
Did you store your coffee after
harvest?
Yes 310 88.83
No 39 11.17
How long did you store your dried
coffee?
1 -6 months 313 89.68
More than 7 months 36 10. 32
How did you store your coffee? By filling in sack 218 62.46
Simply the beans 107 30.66
Both method 24 6.88
What was your packing material? Sisal sack 34 9.74
Plastic sack 296 84.81
Basket 19 5.44

AJSI Vol. 4, Issue 1 May, 2019
61
What was your reason behind
storing?
Expecting higher price 283 81.09
Lack of market demand 40 11.46
Saving purpose 26 7.45
Source: survey data from the study area in 2018
Coffee harvesting in the study area was conducted highly by collecting red,
unripe and dried cherries together once or twice in harvesting months. The
reason behind this is that, the selective picking harvesting technique requires
a lot of labor thereby increase of cost of production, also whether they
harvest by strip or selective the price of the product finally sell to traders are
the same thus, since there is no different price for differently handled coffee
for quality improvement they were using strip harvesting methods which was
save their time.
Coffee drying, packaging and storage: According to the survey result of
the investigation, the coffee growers have been using different drying
methods to dry their coffee in the study areas. Accordingly, they dry the
harvested coffee, on plastics (shera) (50.43%), on bare land (40.11%), on
cemented flour (4.87%) and on bed made from mish wire (4.58%)
respectively. Apart from harvesting and drying, packaging and storage place
are the other most important and essential factor required for maintaining
and improving quality of products in marketing functions maintain its
commercial value by preserving the integrity of the bean with all its
characteristics. The study result showed that, coffee growers were used
plastic sacks (84.81%), sisal sack or polypropylene bag (9.74%) and Baskets
(5.44%) respectively to pack the harvested coffee. The reason behind using

AJSI Vol. 4, Issue 1 May, 2019
62
plastic sacks by most coffee growers is that sisal sack or polypropylene bag
is highly scarce, costly and unaffordable by the farmers.
Following drying, and packaging, storage is the most important functions to
maintain the coffee quality and to earn higher price of coffee. In the study
area, majority of the coffee growers (88.83%) store their coffee after harvest
while the rest (11.17%) not participated in storing their coffee indicating that
they sold the red cherry immediately after harvest. The harvested and sun
dried coffee is stored in the storage house, by filling in the sack (62.46%) ,
coffee beans in the storage without using sack (30.66%) and (6.88%) of
them have used both methods ( using sisal sack and only the beans in storing
house). Majority of the farmers (89.68%) store their coffee for less than 6
while the smaller portions of the coffee growers (11.32%) store their coffee
for more than 7 months which may be the factors for volume of supply in the
study area. The main factor that made the farmers to store their coffee for
more than half a year includes expecting higher price (81.09%), lack of
market demand (11.45%) and for saving purpose (7.45%) respectively.
3.5. Opportunities in coffee value chain
There are many production and marketing opportunities in the study areas
identified during survey with key informants, respondents and from
observation of the area. High value organic nature of the coffee plant,
presence of experienced and interested farmers in production of coffee,
presence of governmental attention to coffee production, Presence of
Mechara agricultural research center and Oromia Seed Enterprise, the
presence of FTC and Kebele agricultural office, primary cooperatives which
can supply input and buy products even though they are not involved yet
were among the opportunities which can be exploited in production of
coffee. In addition to the above, being specialty coffee that fetch premium

AJSI Vol. 4, Issue 1 May, 2019
63
price, the newly opened market to an American country an addition to
Arabic country is other opportunity.
4. CONCLUSION AND RECOMMENDATION
4.1. Conclusion of the study
This study was aimed at analyzing coffee value chain of coffee in Arsi zone
of potential coffee producer districts of the zone as a representative
(Gololcha, Chole, Seru and Aseko) in Oromia national regional state of
Ethiopia. The major value chin actors of coffee identified includes input
supplier, producers, traders, primary cooperatives and union, exporter,
wholesaler/retailer/ and consumers. Local collectors are the most important
buyers of both sun dried and red cherry from producers, followed by
wholesalers those who are bulk suppliers to the private exporters.
Generally, the share of margin in coffee value chain revealed that, producers
(51.9%) take the line share followed by exporters (21.26%) and wholesalers
(10.31%) while primary cooperative and local collectors are poorly
positioned in the coffee value chain in the study area. Moreover, the profit
share of actors in coffee value chain showed that, coffee producers and
exporters shared the highest net profit margins with respective value of
(60.77%) and (12.53%) respectively followed by local collectors (11.44%)
and primary farmers` cooperative (9.92%) while wholesales/ suppliers
shared the least value (5.34%) those who are poorly positioned as compared
to the actors participated in coffee value chain in the study area of the
marketing year.
Producers in the study area have four main coffee marketing channels
(primary cooperative, local collector, wholesalers and consumers marketing
channels). However, the channel which joins producers directly with
consumers and wholesalers is the most worthy as compared to the other

AJSI Vol. 4, Issue 1 May, 2019
64
channels respectively. The performance of actors along the market channel
in coffee marketing indicated that, the Gross Market Margin (GMM) of
producers with marketing channel which joins producer to wholesaler is
more worthy as compared to the channel along local collectors and primary
cooperative indicating that creating a market linkage directly with coffee
wholesalers are better. Channel, III, channel V and channel IV are the most
well-intentioned channels for coffee producers respectively. The Net
Marketing Margin (NMM), the highest value of NMM is goes to coffee
exporters (18.12%) along all coffee marketing channels whereas wholesalers
in channel II (2.8%) and primary cooperative in channel IV and V (5.2%)
benefited with least value during the production year.
Local collectors do not give much attention for the coffee quality rather they
give attention to quantity, hence they buy defective coffee with lower price
and mix with better quality coffee to get the highest price even sometimes
they supply coffee with pebbles in order to increase weight. Therefore this is
greatly affected coffee quality as well as market share of actors legally
involved in the coffee business. However, some collectors are working
illegally in the village town by the name legal traders as an agent. Thus
government should have to make down on the ground the legal performance
that limit them form an engagement in the market.
Generally different constraints or challenges were faced the farmers which
affect the production pattern of coffee. Shortage of chemicals for emergency
disease occurrence, high price fluctuation, lack of market information about
coffee marketing , high cost of inputs, climatic change , limited access of
extension services, distance to the market , diseases and pests ( CBD, coffee
leaf rust, die back) , shortage of land due to the shift from coffee production
to khat production , Poor linkage with value chain actors, price fluctuation,
AJSI Vol. 4, Issue 1 May, 2019
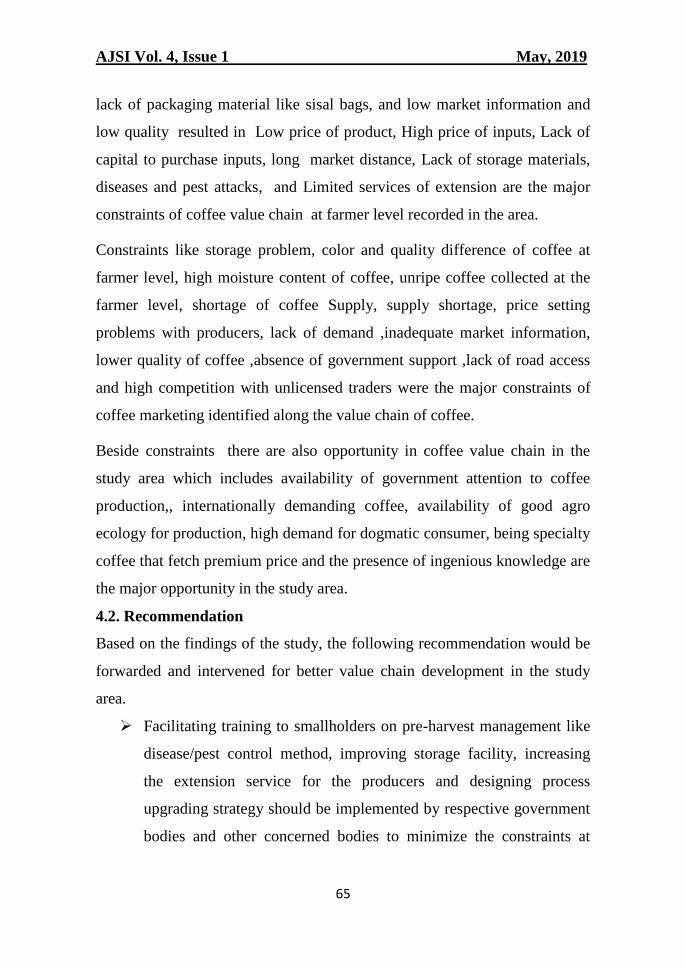
65
lack of packaging material like sisal bags, and low market information and
low quality resulted in Low price of product, High price of inputs, Lack of
capital to purchase inputs, long market distance, Lack of storage materials,
diseases and pest attacks, and Limited services of extension are the major
constraints of coffee value chain at farmer level recorded in the area.
Constraints like storage problem, color and quality difference of coffee at
farmer level, high moisture content of coffee, unripe coffee collected at the
farmer level, shortage of coffee Supply, supply shortage, price setting
problems with producers, lack of demand ,inadequate market information,
lower quality of coffee ,absence of government support ,lack of road access
and high competition with unlicensed traders were the major constraints of
coffee marketing identified along the value chain of coffee.
Beside constraints there are also opportunity in coffee value chain in the
study area which includes availability of government attention to coffee
production,, internationally demanding coffee, availability of good agro
ecology for production, high demand for dogmatic consumer, being specialty
coffee that fetch premium price and the presence of ingenious knowledge are
the major opportunity in the study area.
4.2. Recommendation
Based on the findings of the study, the following recommendation would be
forwarded and intervened for better value chain development in the study
area.
Facilitating training to smallholders on pre-harvest management like
disease/pest control method, improving storage facility, increasing
the extension service for the producers and designing process
upgrading strategy should be implemented by respective government
bodies and other concerned bodies to minimize the constraints at

AJSI Vol. 4, Issue 1 May, 2019
66
production stage to create the value chain development for coffee in
the study area.
Facilitating training on post-harvest management of coffee for
smallholder coffee growers in the study area since poor harvesting
practices, such as stripping and collecting dropped fruits from the
ground; improper post-harvest processing and handling practices
such as drying on bare ground and improper storage are highly
practicing in the study area which reduces quality and increases
losses by promoting uneven moisture levels, inducing fungus and
ferment, and introducing foreign matter.
Strengthening functions of farmer‟s cooperatives, Controlling
unlicensed traders; Increasing credibility and market linkages of
coffee value chain actors, improving farmers bargaining power by
supporting farmer‟s cooperatives and improving the information
dissemination about different marketing aspects of coffee should be
done at marketing stage by all responsible bodies to reduce the
constants and to create the value chain development of coffee at the
study area.
Improving harvest and postharvest handling will increase the quality
of coffee. Since some coffee farmers in the study area still use the
traditional method of coffee harvesting, drying on the bare ground,
packed with polyethylene bag, and stored in a residential home for a
long time, coffee quality is highly affected in the study area. Thus,
providing adequate trainings on a continuous basis to producers on
pre-and post-harvest management practices are vital. These will
further increase the quality; thereby increase the market value of the
coffee bean. As a result, increases volume of export coffee and the
number share of foreign exchange currency and finally add value to

AJSI Vol. 4, Issue 1 May, 2019
67
their crops. Therefore, the university under the thematic area,
research center and agriculture should take responsibility of
providing sustainable training with careful attention.
In order to get quality coffee ,coffee producers should harvest only
red cherry, improve drying techniques , improve packaging
materials (use only sisal sack) and store coffee after it dried well,
store at recommend warehouse only for a short period, unless sold
immediately after drying.
Primary market station should operate legally as it is legally priority
was given for legal traders should only enter in the market.
Government should stop the illegal collector who deteriorates the
quality as well as price of the coffee cherry. Every trader should have
to buy coffee within the primary market and equally treated in the
station.
Poor harvesting practices, such as stripping and collecting dropped
fruits from the ground; improper post-harvest processing and
handling practices such as drying on bare ground and improper
storage reduces quality and increases losses by promoting uneven
moisture levels, inducing fungus and ferment, and introducing
foreign matter.

AJSI Vol. 4, Issue 1 May, 2019
68
Reference
Anwar Abasanbi Abadiga, (2010). Assessment of coffee quality and its
related problems in Jimma zone of oromia regional
CSA, (2016). Agricultural Sample Survey 2012/2013 (2005 E.C.). Report on
Area and Production of Major Crops. Central Statistical Agency,
Addis Ababa.
ECXA (Ethiopian Commodity Exchange Authority), (2008). Analysis of
coffee supply, production, utilization and marketing issues and
challenges in Ethiopia. Addis Ababa, Ethiopia.
GAIN (Global Agricultural Information Network), (2014). Coffee annual
report, ET 1402
Gashaw, B.A., A review on the potential of value chain for rural economic
development in Ethiopia.
Getu Bekele G, (2011). National Coffee Research Project Coordinator and
Researcher 8th Eastern African Fine Coffees Association
Conference and Exhibition19th February Arusha, Tanzania
Ngurdoto Lodge, Victoria Hall
Girma B, (2017). ANALYSIS OF DETERMINANTS OF COFFEE VALUE
CHAIN PERFORMANCE IN ETHIOPIA: A Thesis submitted to
the Addis Ababa University, School of Commerce in Partial
fulfillment of The Degree of Masters of Arts in Logistics and Supply
Chain Management
Hassen Beshir H, (2015). Determinants of Coffee Export Supply in Ethiopia:
Error Correction Modeling Approach Journal of Economics and
Sustainable Development

AJSI Vol. 4, Issue 1 May, 2019
69
Henricksen L F, Riisgard L, Ponte S, Hartwich F, Kormawa, P. (2010).
Agro-Food Chain Interventions in Asia. A review and analysis of
case studies. Working Paper, December 2010. UNIDO/IFAD
Humphrey J, Schmitz, H, (2000). Governance and upgrading: linking
industrial cluster and global value chain research (Vol. 120).
Brighton: Institute of Development Studies.
James, W. Tim, S. and Leulsegged, K. (2015). Woreda level crop production
ranking in Ethiopia. International Food Policy Research Institute
(IFPRI) Addis Ababa, Ethiopia.
Jima D, Tadesse M, Birhanu A, Gosa A, Asfaw Z, Mohammedsani A,
(2017). Constraints and Opportunities of Coffee Production in Arsi
Zone:The Case of Chole and Gololcha Districts ; Vol.9, No.10,
Kodigehalli, B.V., (2011). Value Chain Analysis for Coffee in Karnataka,
India
Kaplinsky R and Morris M. (2001). A Handbook for value chain research.
Report prepared for IDRC. IDS, Sussex, Brighton.
Karthikeyan, (2015). Effectiveness of Cooperatives in Coffee Value Chain:
An Analysis in Sasiga District of Oromia Region, Ethiopia: National
Conference on Cooperative Development in Ethiopia
Mekonin Abera N, (2017). Determinants of Market Outlet Choice of Coffee
Producing Farmers in Lalo Assabi District, West Wollege Zone,
Ethiopia: An
Schmitz H, (2005). Value Chain Analysis for Policy Makers and
Practitioners, Geneva: International Labour Office and Rockefeller
Foundation

AJSI Vol. 4, Issue 1 May, 2019
70
Seneshaw T and Bart M, (2016). Value Addition and Processing by Farmers
in Developing Countries: Evidence from the Coffee Sector in
Ethiopia; Invited poster presented at the 5thInternational Conference
of the African Association of Agricultural Economists, September
23-26, 2016, Addis Ababa, Ethiopia
Socio-economic profile of Arsi Zone Government of Oromia Region (last
accessed 1 August 2006)
UNIDO, (2009). Agro-value chain analysis and development: a staff
working paper, Vienna
UNICAF, (2016). Coffee Value Chain Report of Uganda.
World Bank, (2015). Risk and finance in the coffee sector. A compendium of
case studies related to improving risk management and access to
finance in the coffee sector.
Yamane T, (1967). Statistics: An Introductory Analysis, 2nd Ed., New York:
Harper and Row.

AJSI Vol. 4, Issue 1 May, 2019
71
Appendixes
Appendix Table 1: Cost sheet for coffee suppliers (Wholesalers) in the study
area
Description Unit expense (birr/ quintal)
1. Purchasing cost
Average purchase price of coffee 7000.00
Loading and unloading cost 23.86
Mean transport cost 29.41
Bags and twins 95.29
Other cost 0.00
2. Processing cost
Cleaning (pulping and hulling) 10.60
Cleaning and handling labor cost 71.00
Means stock insurance 2.40
Spillage and weight loss (ECX) 105.88
Other cost -
Taxes 314.12
Labor cost 5.88
Total marketing cost 682.35
Total cost for coffee trading 7682.35
Average Selling price 8000.00

AJSI Vol. 4, Issue 1 May, 2019
72
Appendix table 2: Cost sheet for coffee trading within different actors
(exporters)
Description Unit expense (birr/quintal)
3. Purchasing cost
Average purchase price of
coffee
8000.00
Loading and unloading cost 29.41
Mean transport cost 29.41
Bags and twins 100
4. Processing cost
Cleaning (pulping and hulling) 10.58
Cleaning and handling labor
cost
82.35
Means stock insurance 117.65
Spillage and weight loss 176.47
5. Selling (export expenses)
Export bags and twins 176.47
Transport to the port 105.88
Mean transport insurance 36.47
Weight and quality inspection 29.41
Fee for (Ethiopian standard) 52.94

AJSI Vol. 4, Issue 1 May, 2019
73
6. Miscellaneous expenses
Taxes 323.53
Brokers /agent cost 47.06
Total marketing cost 1317.65
Total cost for coffee trading 9317.65
Average Selling price to foreign
countries
4000USD/ton sold with the currency
of 28.45birr/1$(dec,2018) which is
equal to 11,380.00ETB
Source: survey result from Gololcha Woreda, 2018/19 (key informant
interview: Mr. Sadat Mohammed)
Appendix table 3: Average purchasing and selling price of coffee along
marketing channel
Sellers Buyers Price (birr/quintal ) (Marbush or
qishir) (NB. 1kg of coffee bean
(un-pulped) =0.5kg of pulped
coffee)
Marketing
cost
Producers Local
collectors
6100.00 263.18
Producers Wholesalers
(suppliers)
6300.00 263.18
Producer Primary
cooperative
6100.00 263.18
Local
collectors
Wholesalers 7000.00 120.00

AJSI Vol. 4, Issue 1 May, 2019
74
Primary
cooperative
Wholesalers
/ Unions
7000.00 210.00
Wholesalers Exporters 8000.00 682.35
Exporter International
buyer
(4000$/ton)
11380.00 1317.65
Source: from different buyers of coffee in the study area
ACKNOWLEDGEMENT
We, the researchers, would like to express our genuine thanks to Arsi
University research directorate office for funding this project and College of
Agriculture research and community service office as well as all staffs
members of Agribusiness and Value chain Management for their intensive
guidance, helpful comments, numerous revisions and reorganizations at all
stages of the work and quick response to improve our work.