airspace concept evaluation system (aces), … title: airspace concept evaluation system (aces),...
TRANSCRIPT
423
Title: Airspace Concept Evaluation System (ACES), Concept Simulations using Communication, Navigation and Surveillance (CNS) System Models Author(s): Greg Kubat (Analex Corp.), Don Van Drei (NASA-GRC) Abstract: With the current FAA, Operational Evolution Plan and the US Department of Transportation, Integrated National Plan for the Next Generation Air Transportation System (NGATS) currently focused on the need to ensure that the U.S. NAS meets safety, security, mobility, efficiency and capacity needs of the future, the continued development of improved resources for the study of new NAS concepts to support this initiative are required. These resources take on many forms, but as primary tools for evaluating new concepts to meet these objectives, simulation tools for NAS concept operations continue to play a key role. These tools, if properly designed and progressively upgraded to provide improved real-world capabilities are essential to this effort. One such tool, NASA’s Airspace Concept Evaluation System (ACES), is an example of a simulation environment that has proven very effective for these concept studies, and which has continued to undergo improvements to enhance its capabilities. One recent improvement that ACES has adopted, is the inclusion of CNS system modeling capabilities. These systems, legacy systems currently used in the NAS and newer technology systems that are under consideration, are in a state considerable evolution and evaluation for their ability to support NAS and CNS architectures that will support the functional reality of future airspace operations. With the addition of CNS system models in ACES, CNS systems performance can be evaluated in large-scale simulations and for simulations directed at specific details of NAS operations. Also with this system simulations and analysis can be done that addresses the performance of the CNS systems themselves to support future NAS operations. With the completion of the development effort to integrate Voice Communication, CPDLC, SSR and ADS-B surveillance, and GPS and VOR/DME navigations system models, and improvements to their configurability for CNS simulations by late FY06, many new simulation opportunities will exist in ACES. For future NAS concept studies, this paper presents information describing the new ACES CNS modeling capabilities and their configuration options. The paper presents ideas on how concept studies with ACES can be augmented by parallel CNS systems simulations. Also identified are ideas on what new CNS studies could be considered to evaluate CNS system operation and CNS architecture definition. Results of sample concept scenarios are included to support these opportunities.
Introduction Concepts to investigate solutions to air traffic capacity increases in the future National Airspace System will not only require evaluations of physical aircraft dynamics to demonstrate successful proof-of-concept, but will also require evaluations of the ATM supporting infrastructure to support these concepts. The Airspace Concepts Evaluation System (ACES), developed as a simulation tool to provide NAS concept investigations, identifies this as a basic objective as presented in its system definition stating that, “Concept studies that ACES models fall into one of three basic categories: Agent, Infrastructure, or Environment”, and continues to say, “Put simply, NAS Agents operate within the NAS Environment and communicate with each other and the NAS Environment through the NAS Infrastructure”. That infrastructure, which includes systems to communicate with pilots, systems to communicate information to and from aircraft, systems that provide information onboard aircraft to the cockpit, and systems that provide awareness of traffic conditions to controllers on the ground, (i.e. Communication, Navigation and Surveillance systems), are essential systems whose ability to support a concept may dictate concept success or failure if not properly implemented. To provide added infrastructure simulation capabilities in ACES, a baseline set of CNS models were integrated during FY05, and enhancements and new models that are currently in the process of being added as a deliverable to ACES by NASA GRC. This paper provides a brief overview of the CNS system models and enhanced capabilities that make use of these system models to add more realistic infrastructure airspace operations in ACES. Results of testing of select systems are provided as well as results from selected enhanced features. Also presented is an assessment of a simulation, presented as a sample concept idea, with results to indicate how communications simulations can be applied for studies with ACES that previously could not have been considered. Model Descriptions and Enhanced Features Communication System Model For Air Traffic Management, voice communication is the primary communication mechanism between the pilot and Air Traffic Control facilities (Tower, TRACON, ARTCC, etc.) in the present NAS. Message exchanges for directing airport gate departures, ground traffic instructions, take-off clearances, landing sequences, air route change information and aircraft maneuvers as well as air-space, region and sector-to-sector transitions are typical voice sequences that occur via voice communication. As the default communication model component, a voice communication system model is provided, simulating voice message exchanges that are typical for gate-to-gate
https://ntrs.nasa.gov/search.jsp?R=20070015018 2018-06-25T03:48:12+00:00Z
424
aircraft/flight operations. The simulated voice communication system transmits messages using a VHF radio model to provide voice message delivery with exchange characteristics and protocols that provide representative delay and message collision handling capabilities. During FY06, Controller-Pilot Data Link Communication (CPDLC), an application that provides a means of communicating digital data messages directly between computers on the ground and computers on board the aircraft for ATC communications, is being added. Use of this system for communicating messages for Air Traffic Management will help to alleviate frequency congestion problems, and allow the controller to handle more traffic. In its simulated implementation in ACES, the CPDLC system model will represent CPDLC messaging for air-to-ground services as derived from a combination of CPDLC, Baseline 1/2 and RTCA DO-269 specifications. The CPDLC messages will be applied to be consistent with the message set and airspace operations for the modeled Voice Communication system. The data link radio model employed for the CPDLC system is a VHF Data Link - Mode 2 (VDL-2) model. For both Voice and CPDLC Data link communications the modeled systems provide equivalent message sequences synchronized with ACES Flight events for each aircraft. Message sequences are provided for surface operations, departure and arrival TRACON operations and en route events where communications with the aircraft are normally conveyed for ATC-to-Pilot instructions. Message context and control parameters used by the radio models for simulated transmission of messages are available to both systems from user-reconfigurable configuration files, and other data such as ground station locations, ground station radio parameters, aircraft equipage,… can also be modified as required. The Voice and CPDLC system models operate in a similar manner within ACES, distinguished by their message type and the radio model used for message transmission. As ACES timing or events dictate, transmission of messages are directed from a flight or ATC Agent (as the sender agent) through the appropriate communication/Radio link model and on to the destination flight or ATC agent (as the receiver agent). Both the transfer of a particular communication message to the communication model and subsequent movement of the message from the model to its destination are handled using the publish/subscribe operations provided in the Agent-based simulation environment. Output parameters that identify message delivery success and performance characteristics of the end-to-end (sender to receiver) transmission of a message will be stored in output databases for experimenter analysis. As well as providing operation of the communication system models, three additional features have been added that can be used in parallel with communication system modeling to more realistically simulate its NAS implementation. These
include: 1) Communication Activated Maneuvers - which provides a sequence of ATC/Pilot, instruction and instruction acknowledgement messages that are required to be delivered successfully before an aircraft maneuver can be initiated, 2) Enhanced Frequency/Channel allocations that provides more realistic distribution of voice messages over multiple channels within the TRACON and airport airspace for specific airports, and 3) a Short Sector Transition Time feature that mimics ATC control of whether a new frequency is communicated to an aircraft when the length of time the aircraft will reside in a portion of a sector is limited. Navigation System Models System models for VHF Omni-directional Range/Data Measuring Equipment (VOR/DME) and Global Positioning System (GPS) will be available as Navigation systems in ACES. Used as a standard technology for navigation in the National Airspace System, VOR/DME is a ground based electronic navigation system that is provided as the default Navigation model to generate simulated latitude/longitude information available to the aircraft. In its operation, VOR facilities transmit signals at the same time and electronically compare the difference to interpret the result as a radial from the station. VOR is enhanced through use of DME systems. DME equipment onboard the aircraft transmits a stream of interrogations to the ground station, comprised of a pair of RF pulses, which are responded to by the ground stations. The airborne DME equipment receives the reply and measures the elapsed time (transmit to reply) to calculate the round-trip time. From this, it can determine exact distance from the ground station to augment position information available to the aircraft. The VOR/DME model provided is a statistical model implemented as a navigation activity of the Flight Agent. The true position (state information) of the flight is used by the navigation activity to compute the reported position by adding a VOR/DME equipment error to the true position. Also during the simulation, slant distance is calculated by the navigation activity for every aircraft location update using the next VOR/DME ground station location encountered by an aircraft. With the increasing use of GPS navigation equipment onboard aircraft to augment traditional systems, a GPS statistical model is in the process of being added as a second Navigation system model. GPS is a satellite-based navigation system made up of a network of 24 satellites placed into orbit by the U.S. Department of Defense. GPS was originally intended for military applications, but is now available for civilian use. GPS works in any weather conditions, anywhere in the world, 24 hours a day. GPS receivers placed onboard aircraft are beginning to see more widespread use as secondary navigation devices for use
425
within the NAS. GPS data on board aircraft can be provided to other onboard systems. The GPS model that will be introduced in ACES is also a statistical model implemented as an activity of the ACES flight agent, as an onboard system. As with the VOR/DME model, the GPS model obtains true position data by subscribing to flight agent, flight physics activity, state messages. The GPS model will provide varied GPS system accuracies, implementing Local Area Augmentation System (LAAS) accuracies for airport airspace and Wide Area Augmentation System (WAAS) accuracies for en-route airspace. As an added capability to enhance the use of the navigation modeling in ACES, a closed loop operation feature was recently introduced. With closed loop operation for navigation, the system provides feedback of the navigation system model output (reported position) to the aircraft flight agent. With this information, as would be the case where a pilot or autopilot would use the data for steering, the aircraft will see its position varied somewhat from its desired position (due to the imprecision of the navigation system), and therefore steer the aircraft to correct for the errant location. With this feedback, and depending on the accuracy of the navigation system information, it is anticipated that a more accurate representation of flight trajectories and flight times may be realized. Surveillance System Models For Surveillance, two surveillance system models will be available, Secondary Surveillance Radar (SSR) and Automatic Dependent Surveillance – Broadcast (ADS-B). In the current NAS, ground-based, Primary Radar systems are complimented by Secondary Surveillance Radar (SSR). Both systems are used to determine the presence and position of planes in the airspace allowing controllers to track each plane precisely and efficiently. For surveillance system modeling in ACES, an SSR model is implemented as the default system. The SSR model operates in a similar manner to navigation models, using Flight Agent true state data as input, and applying statistical performance characteristics to provide a new reported position. The model is integrated as an activity of a Surveillance Agent, represented as ground based agent due to the inherent surveillance system ground based data processing and subsequent delivery of these systems data to air traffic controllers. For its operation, the SSR model receives ACES aircraft state data as its input for processing using a publish/subscribe operation, and simulates delivery of data as available to ATC on the ground. ADS-B equipped aircraft automatically broadcast latitude and longitude, velocity, altitude, heading, identification and, optionally, intent as determined by the avionics on board. This information is broadcast via data link to ADS-B ground
stations, other ADS-B equipped aircraft and ground vehicles. The data captured by ADS-B ground stations is distributed to Air Traffic Management (ATM) and other control systems. As a modeled surveillance application, ADS-B is simulated for Air-to-Ground broadcast only (i.e. Aircraft Transmit, Ground Station Receive) using Mode S, extended squitter as the communication link. Onboard the aircraft ADS-B will use simulated Navigation system output data (VOR/DME or GPS) for the aircraft position (i.e. latitude, longitude), and ACES flight physics model output for aircraft altitude, velocity, heading, and aircraft Flight ID as input for messages. In adapting the ADS-B application to the ACES environment, this system model uses a combination of the methods used for communication systems and for the SSR model, and takes input from the navigation system that is selected for the simulation. For ADS-B an activity of the flight agent was created as a sender activity that receives data from the Navigation model. The output of the sender activity (as a published message) then provides an ADS-B message to a communication agent, Modes S Radio Model activity. If the Mode S model determines that favorable conditions exist for message delivery success, the ADS-B message is then transferred to an ADS-B receiver activity of the Surveillance Agent. This system therefore represents the monitoring and reception of ADS-B data again at the ATC location where the tracking of the aircraft is taking place. Similar to the closed loop operation feature added for navigation after the baseline development, an added capability to enhance the use of the surveillance modeling data in ACES was also implemented. With the surveillance system closed loop operation, a simulation can be configured to provide feedback of the reported surveillance system model output (reported position) to ATC agents in ACES. With this information, as would be the case where a controller would see an aircraft out of expected position, ACES NAS agents might use the data to generate new maneuvers for the aircraft, or may identify traffic restriction violations due to the variation of the aircraft from it anticipated/desired position, leading to more realistic and dynamic flight scenario. System Model tests results Testing of the Voice Communication, SSR and VOR/DME modeling was completed in September of 2005. Requirements test simulations were done to verify the system model operation and system/model configuration capabilities. Additional characterization tests were also run with varied Flight Data Sets (FDS) to identify trends in simulation results from multiple aircraft simulations for each system. After completion of the enhancements earlier this year, testing was also completed to exercise the six new enhanced capabilities. This section provides a description of selected tests and results from those simulation runs.
426
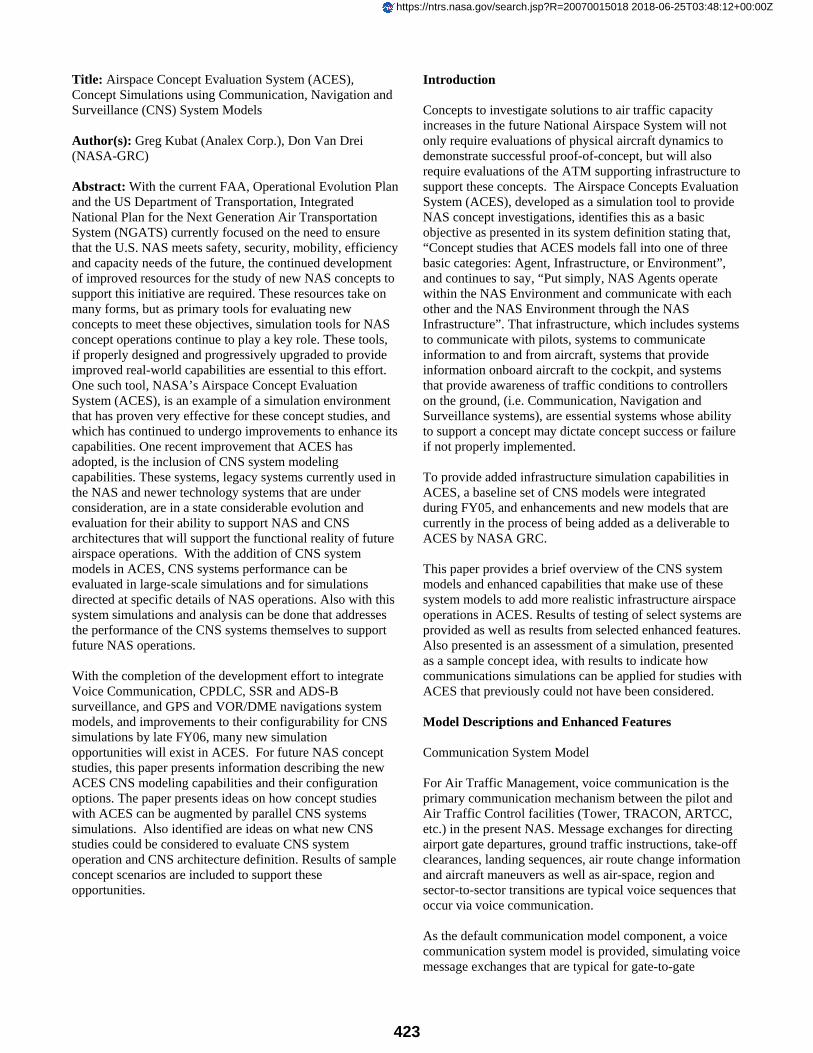
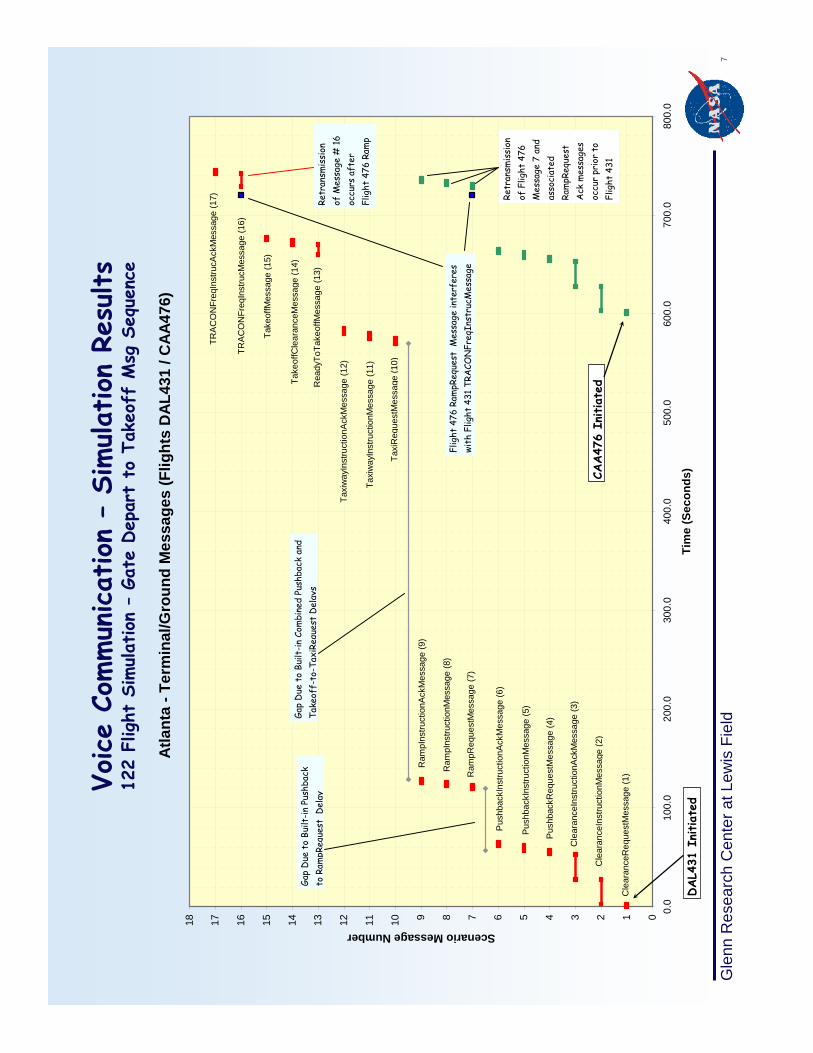
From the characterization tests for voice communications, a test case was configured to fly 122 flights, selected randomly from a standard 4800 flight, Flight Data Set. From the resulting output message data files, data was collected for specific messages that made up the message sequences for terminal/surface communication, TRACON maneuver communications and for select, en route, Center boundary-to-Center boundary messages. Shown in Figure 1 are results of the simulation for two of the flights for the surface message sequences. For each of the two flights, the sequence of messages begins with a ‘gate clearance request’ message and ends with a departure TRACON, ‘frequency assignment instruction acknowledge’ message that occurs just before takeoff. What can be seen in these data is the message transmission sequencing, coordinated by the use of message timing data from the message scenario configuration file, and synchronized by ACES timing based on ACES NAS Agent events and decisions. In some cases for the message sequences, gaps will occur between messages due to built-in delay decisions that are a function of when a specific next-message/event will occur. An example of this is the gap between the ‘ramp instruction ackmessage’ and the ‘taxi request message’ for flight 431. These gaps are dynamic and vary in length based on ACES NAS agent decisions for sequencing of flight departures, and their function to maintain traffic flow.
Atlanta - Terminal/Ground Messages (Flights DAL431 / CAA476)
0
1
2
3
4
5
6
7
8
9
10
11
12
13
14
15
16
17
18
0.0 100.0 200.0 300.0 400.0 500.0 600.0 700.0 800.0
Time (Seconds)
Scen
ario
Mes
sage
Num
ber
ClearanceRequestMessage (1)
ClearanceInstructionMessage (2)
ClearanceInstructionAckMessage (3)
PushbackRequestMessage (4)
PushbackInstructionAckMessage (6)
RampRequestMessage (7)
PushbackInstructionMessage (5)
TRACONFreqInstrucMessage (16)
TaxiRequestMessage (10)
RampInstructionAckMessage (9)
TaxiwayInstructionMessage (11)
TaxiwayInstructionAckMessage (12)
ReadyToTakeoffMessage (13)
TakeoffClearanceMessage (14)
TakeoffMessage (15)
TRACONFreqInstrucAckMessage (17)
RampInstructionMessage (8)
Gap Due to Built-in Pushbackto RampRequest Delay
Gap Due to Built-in Combined Pushback and Takeoff-to-TaxiRequest Delays
Flight 476 RampRequest Message interferes with Flight 431 TRACONFreqInstrucMessage
Retransmission of Message # 16 occurs after Flight 476 Ramp
CAA476 Initiated
DAL431 Initiated
Retransmission of Flight 476 Message 7 and associated RampRequest Ack messages occur prior to Flight 431
Figure 1: Surface Message Sequences (departure)
Also indicated in this chart is an instance that occurred where two messages, the flight 431 ‘TRACON frequency instruction’ message and the flight 476 ‘ramp instruction message’ initiate at the same time causing a radio model interference situation. For this type of message collision, the VHF communication link protocol sets the Ground to Air message as a higher priority message, and the three associated messages sequence for the ramp request are allowed to retransmit first, followed by the retransmission of the TRACON frequency instruction message. Similar type retransmissions of messages are also handled for step-on situations.
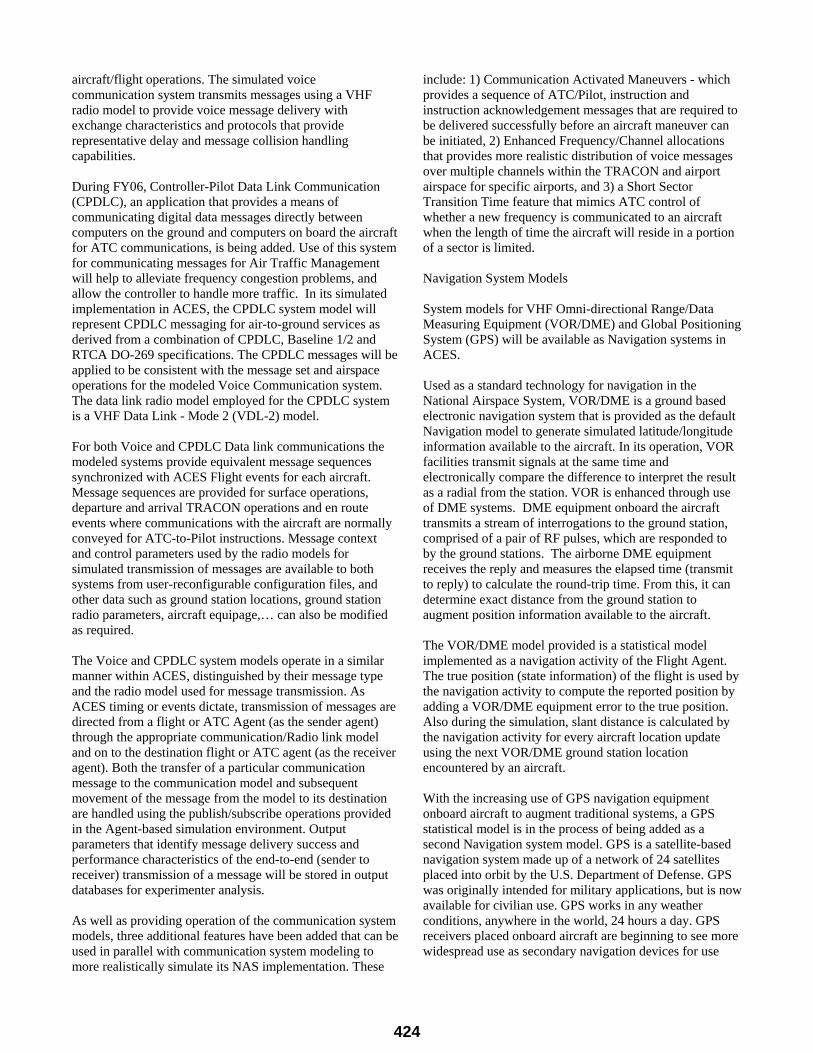
From the same voice communication simulation, Figure 2 shows results for three en-route flights passing boundary to boundary through ZOB Center. Shown in this chart are the frequency handoff instruction message sequences that routinely occur. For each flight, and preceding their entry into the Center, a new frequency has already been assigned to the flight for its use in the new center, therefore the first two messages observed after entry into the Center are a ‘first contact message’ sent to ATC to identify itself in the Center, and a response from ATC to acknowledge the aircraft. A similar sequence of message exchanges also occurs for each sector that each flight enters. It can be seen here that these three flights flew through one, two and three sectors and for each transition the four-message frequency handoff sequence has taken place. The final two messages for each flight are the ‘frequency instruction’ message from ATC and a ‘frequencyassignmentacknowledgement’ message from the aircraft just before entering the next Center.
ZOB Center Boundary to Center Boundary Messages - Enroute( Flights COM262 / COA172 / NWA396 )
25
26
27
28
29
30
31
32
33
34
35
0.0 500.0 1000.0 1500.0 2000.0 2500.0 3000.0 3500.0 4000.0 4500.0 5000.0 5500.0 6000.0
Time (Seconds)
Scen
ario
Mes
sage
Num
ber
COM262 NWA396COA1726
ARTCCContactRequestMessage (32)
ARTCCRadarContactMessage (33)
ARTCCFrequencyInstructionAckMessage (31)
ARTCCFrequencyInstructionMessage (30)
SectorRadarContactMessage (29)
SectorContactRequestMessage (28)
SectorFreqInstructionAckMessage (27)
SectorFreqInstructionMessage (26)
ZOB67 ZOB66
ZOB57 ZOB48
ZOB48 ZOB46
ZOB28 ZOB47
ZOB47 ZOB49 ZOB49 ZOB67
CEnterCEnter CEnter
CExit CExit CExit
S - S S - S S - SS - S
S - S S - S
ZOB28
ZOB67ZOB46ZOB66
ZOB57ZOB67
Figure 2: Center/Sector Freq. Transition Messages
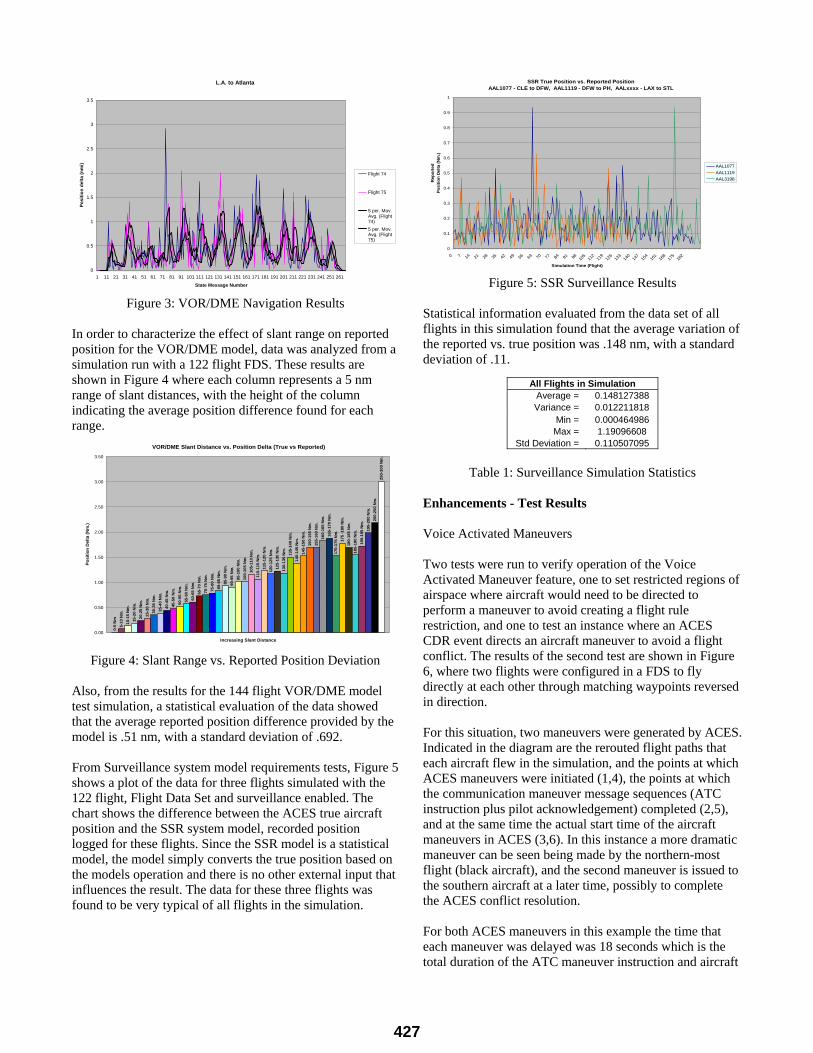
From characterization testing for the VOR/DME navigation model, a simulation test case was run with 144 flights that traversed the US between several of the largest airports. From each airport, 2 identical flights were flown to each of the remaining 8 airports to be able to compare information for similar flight path data. The graph in Figure 3 is a typical plot of the results for one of the flight pairs flown between Los Angeles and Atlanta. The chart indicates the position delta (i.e. the distance between the ACES true position and the Navigation system reported position lat/lon) in nautical miles for each state message generated by the flight, gate-to-gate, for every minute. Of interest in this plot is the pattern that can be seen (which was typical for all flight pairs) that shows a cyclical variation in the data due to the models use of the slant range in deriving a new reported position. The reason for this is that as the aircraft follows its flight path, it uses different navaid sites, to perform the reported position calculation. With the aircraft proximity to the navaid ground stations varying this has the effect of varying the accuracy of the reported position data provided by the VOR/DME model.
427
L.A. to Atlanta
0
0.5
1
1.5
2
2.5
3
3.5
1 11 21 31 41 51 61 71 81 91 101 111 121 131 141 151 161 171 181 191 201 211 221 231 241 251 261
State Message Number
Posi
tion
delta
(nm
i)
Flight 74
Flight 75
5 per. Mov.Avg. (Flight74)5 per. Mov.Avg. (Flight75)
Figure 3: VOR/DME Navigation Results
In order to characterize the effect of slant range on reported position for the VOR/DME model, data was analyzed from a simulation run with a 122 flight FDS. These results are shown in Figure 4 where each column represents a 5 nm range of slant distances, with the height of the column indicating the average position difference found for each range.
VOR/DME Slant Distance vs. Position Delta (True vs Reported)
0-5
Nm
5-10
Nm
.10
-15
Nm
.15
-20
Nm
.20
-25
Nm
.25
-30
Nm
.30
-35
Nm
.35
-40
Nm
.40
-45
Nm
.45
-50
Nm
.50
-55
Nm
.55
-60
Nm
.60
-65
Nm
.65
-70
Nm
.70
-75
Nm
.75
-80
Nm
.
85-9
0 N
m.
90-9
5 N
m.
95-1
00 N
m.
100-
105
Nm
.10
5-11
0 N
m.
110-
115
Nm
.11
5-12
0 N
m.
120-
125
Nm
.12
5-13
0 N
m.
130-
135
Nm
.13
5-14
0 N
m.
140-
145
Nm
.14
5-15
0 N
m.
150-
155
Nm
.15
5-16
0 N
m.
160-
165
Nm
.16
5-17
0 N
m.
170-
175
Nm
.17
5 -1
80 N
m.
180-
185
Nm
.18
5-19
0 N
m.
190-
195
Nm
.19
5-20
0 N
m.
200-
250
Nm
.25
0-30
0 N
m.
80-8
5 N
m.
0.00
0.50
1.00
1.50
2.00
2.50
3.00
3.50
Increasing Slant Distance
Posi
tion
Del
ta (N
m.)
Figure 4: Slant Range vs. Reported Position Deviation
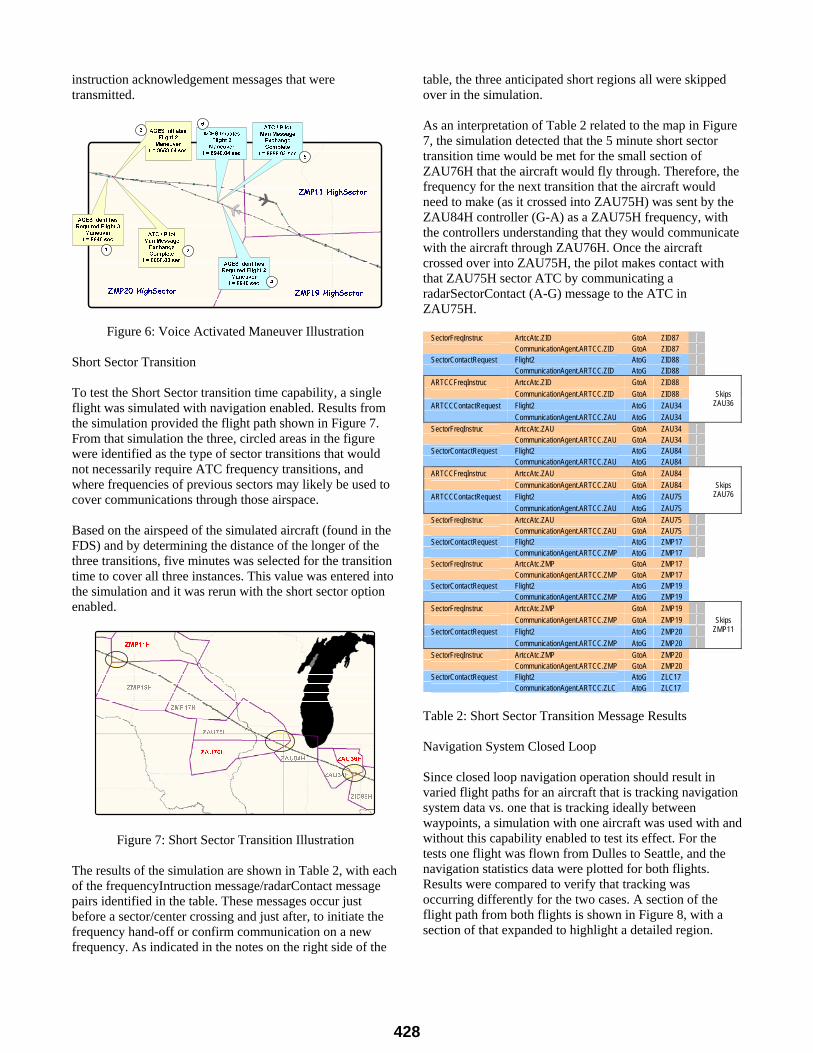
Also, from the results for the 144 flight VOR/DME model test simulation, a statistical evaluation of the data showed that the average reported position difference provided by the model is .51 nm, with a standard deviation of .692. From Surveillance system model requirements tests, Figure 5 shows a plot of the data for three flights simulated with the 122 flight, Flight Data Set and surveillance enabled. The chart shows the difference between the ACES true aircraft position and the SSR system model, recorded position logged for these flights. Since the SSR model is a statistical model, the model simply converts the true position based on the models operation and there is no other external input that influences the result. The data for these three flights was found to be very typical of all flights in the simulation.
SSR True Position vs. Reported Position AAL1077 - CLE to DFW, AAL1119 - DFW to PH, AALxxxx - LAX to STL
0
0.1
0.2
0.3
0.4
0.5
0.6
0.7
0.8
0.9
1
0 7 14 21 28 35 42 49 56 63 70 77 84 91 98 105
112
119
126
133
140
147
154
161
168
175
182
Simulation Time (Flight)
Rep
orte
d Po
sitio
n D
elta
(Nm
.)
AAL1077AAL1119AAL3198
Figure 5: SSR Surveillance Results
Statistical information evaluated from the data set of all flights in this simulation found that the average variation of the reported vs. true position was .148 nm, with a standard deviation of .11.
All Flights in Simulation Average = 0.148127388 Variance = 0.012211818
Min = 0.000464986 Max = 1.19096608
Std Deviation = 0.110507095
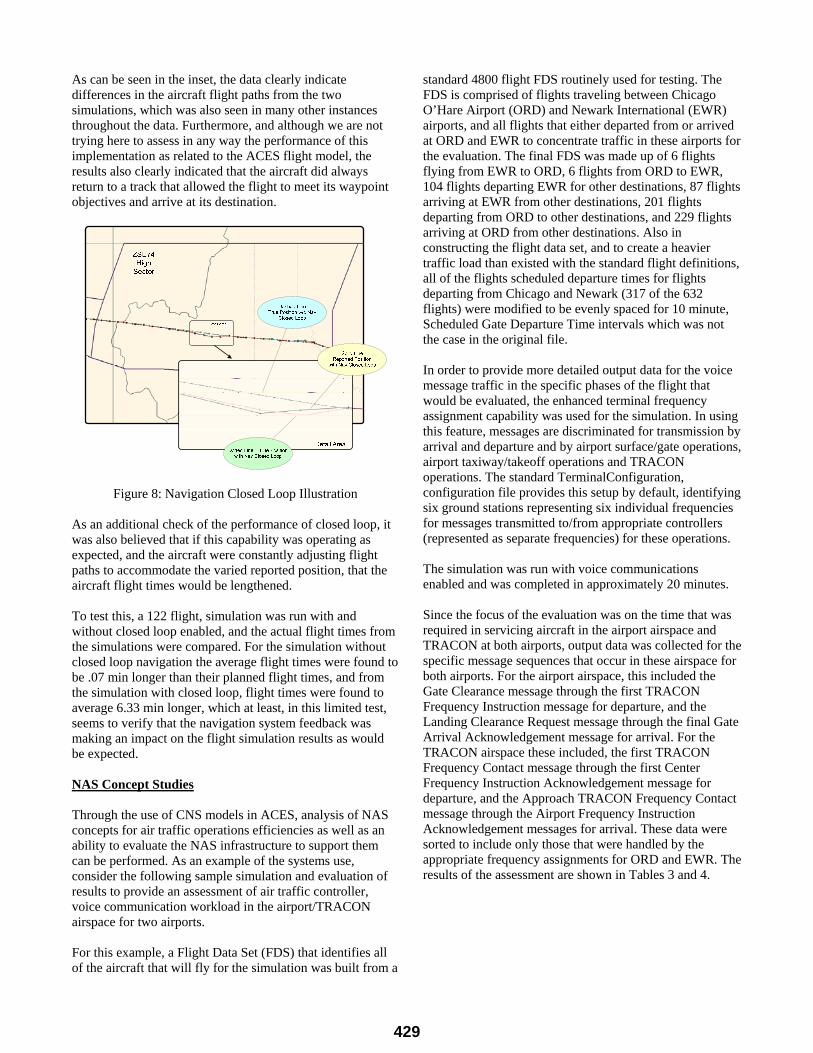
Table 1: Surveillance Simulation Statistics Enhancements - Test Results Voice Activated Maneuvers Two tests were run to verify operation of the Voice Activated Maneuver feature, one to set restricted regions of airspace where aircraft would need to be directed to perform a maneuver to avoid creating a flight rule restriction, and one to test an instance where an ACES CDR event directs an aircraft maneuver to avoid a flight conflict. The results of the second test are shown in Figure 6, where two flights were configured in a FDS to fly directly at each other through matching waypoints reversed in direction. For this situation, two maneuvers were generated by ACES. Indicated in the diagram are the rerouted flight paths that each aircraft flew in the simulation, and the points at which ACES maneuvers were initiated (1,4), the points at which the communication maneuver message sequences (ATC instruction plus pilot acknowledgement) completed (2,5), and at the same time the actual start time of the aircraft maneuvers in ACES (3,6). In this instance a more dramatic maneuver can be seen being made by the northern-most flight (black aircraft), and the second maneuver is issued to the southern aircraft at a later time, possibly to complete the ACES conflict resolution. For both ACES maneuvers in this example the time that each maneuver was delayed was 18 seconds which is the total duration of the ATC maneuver instruction and aircraft
428
instruction acknowledgement messages that were transmitted.
Figure 6: Voice Activated Maneuver Illustration
Short Sector Transition To test the Short Sector transition time capability, a single flight was simulated with navigation enabled. Results from the simulation provided the flight path shown in Figure 7. From that simulation the three, circled areas in the figure were identified as the type of sector transitions that would not necessarily require ATC frequency transitions, and where frequencies of previous sectors may likely be used to cover communications through those airspace. Based on the airspeed of the simulated aircraft (found in the FDS) and by determining the distance of the longer of the three transitions, five minutes was selected for the transition time to cover all three instances. This value was entered into the simulation and it was rerun with the short sector option enabled.
Figure 7: Short Sector Transition Illustration The results of the simulation are shown in Table 2, with each of the frequencyIntruction message/radarContact message pairs identified in the table. These messages occur just before a sector/center crossing and just after, to initiate the frequency hand-off or confirm communication on a new frequency. As indicated in the notes on the right side of the
table, the three anticipated short regions all were skipped over in the simulation. As an interpretation of Table 2 related to the map in Figure 7, the simulation detected that the 5 minute short sector transition time would be met for the small section of ZAU76H that the aircraft would fly through. Therefore, the frequency for the next transition that the aircraft would need to make (as it crossed into ZAU75H) was sent by the ZAU84H controller (G-A) as a ZAU75H frequency, with the controllers understanding that they would communicate with the aircraft through ZAU76H. Once the aircraft crossed over into ZAU75H, the pilot makes contact with that ZAU75H sector ATC by communicating a radarSectorContact (A-G) message to the ATC in ZAU75H.
SectorFreqInstruc ArtccAtc.ZID GtoA ZID87 CommunicationAgent.ARTCC.ZID GtoA ZID87 SectorContactRequest Flight2 AtoG ZID88 CommunicationAgent.ARTCC.ZID AtoG ZID88 ARTCCFreqInstruc ArtccAtc.ZID GtoA ZID88 CommunicationAgent.ARTCC.ZID GtoA ZID88 ARTCCContactRequest Flight2 AtoG ZAU34 CommunicationAgent.ARTCC.ZAU AtoG ZAU34
Skips ZAU36
SectorFreqInstruc ArtccAtc.ZAU GtoA ZAU34 CommunicationAgent.ARTCC.ZAU GtoA ZAU34 SectorContactRequest Flight2 AtoG ZAU84 CommunicationAgent.ARTCC.ZAU AtoG ZAU84 ARTCCFreqInstruc ArtccAtc.ZAU GtoA ZAU84 CommunicationAgent.ARTCC.ZAU GtoA ZAU84 ARTCCContactRequest Flight2 AtoG ZAU75 CommunicationAgent.ARTCC.ZAU AtoG ZAU75
Skips ZAU76
SectorFreqInstruc ArtccAtc.ZAU GtoA ZAU75 CommunicationAgent.ARTCC.ZAU GtoA ZAU75 SectorContactRequest Flight2 AtoG ZMP17 CommunicationAgent.ARTCC.ZMP AtoG ZMP17
SectorFreqInstruc ArtccAtc.ZMP GtoA ZMP17 CommunicationAgent.ARTCC.ZMP GtoA ZMP17 SectorContactRequest Flight2 AtoG ZMP19 CommunicationAgent.ARTCC.ZMP AtoG ZMP19 SectorFreqInstruc ArtccAtc.ZMP GtoA ZMP19 CommunicationAgent.ARTCC.ZMP GtoA ZMP19 SectorContactRequest Flight2 AtoG ZMP20 CommunicationAgent.ARTCC.ZMP AtoG ZMP20
Skips ZMP11
SectorFreqInstruc ArtccAtc.ZMP GtoA ZMP20 CommunicationAgent.ARTCC.ZMP GtoA ZMP20 SectorContactRequest Flight2 AtoG ZLC17 CommunicationAgent.ARTCC.ZLC AtoG ZLC17
Table 2: Short Sector Transition Message Results Navigation System Closed Loop Since closed loop navigation operation should result in varied flight paths for an aircraft that is tracking navigation system data vs. one that is tracking ideally between waypoints, a simulation with one aircraft was used with and without this capability enabled to test its effect. For the tests one flight was flown from Dulles to Seattle, and the navigation statistics data were plotted for both flights. Results were compared to verify that tracking was occurring differently for the two cases. A section of the flight path from both flights is shown in Figure 8, with a section of that expanded to highlight a detailed region.
429
As can be seen in the inset, the data clearly indicate differences in the aircraft flight paths from the two simulations, which was also seen in many other instances throughout the data. Furthermore, and although we are not trying here to assess in any way the performance of this implementation as related to the ACES flight model, the results also clearly indicated that the aircraft did always return to a track that allowed the flight to meet its waypoint objectives and arrive at its destination.
Figure 8: Navigation Closed Loop Illustration As an additional check of the performance of closed loop, it was also believed that if this capability was operating as expected, and the aircraft were constantly adjusting flight paths to accommodate the varied reported position, that the aircraft flight times would be lengthened. To test this, a 122 flight, simulation was run with and without closed loop enabled, and the actual flight times from the simulations were compared. For the simulation without closed loop navigation the average flight times were found to be .07 min longer than their planned flight times, and from the simulation with closed loop, flight times were found to average 6.33 min longer, which at least, in this limited test, seems to verify that the navigation system feedback was making an impact on the flight simulation results as would be expected. NAS Concept Studies Through the use of CNS models in ACES, analysis of NAS concepts for air traffic operations efficiencies as well as an ability to evaluate the NAS infrastructure to support them can be performed. As an example of the systems use, consider the following sample simulation and evaluation of results to provide an assessment of air traffic controller, voice communication workload in the airport/TRACON airspace for two airports. For this example, a Flight Data Set (FDS) that identifies all of the aircraft that will fly for the simulation was built from a
standard 4800 flight FDS routinely used for testing. The FDS is comprised of flights traveling between Chicago O’Hare Airport (ORD) and Newark International (EWR) airports, and all flights that either departed from or arrived at ORD and EWR to concentrate traffic in these airports for the evaluation. The final FDS was made up of 6 flights flying from EWR to ORD, 6 flights from ORD to EWR, 104 flights departing EWR for other destinations, 87 flights arriving at EWR from other destinations, 201 flights departing from ORD to other destinations, and 229 flights arriving at ORD from other destinations. Also in constructing the flight data set, and to create a heavier traffic load than existed with the standard flight definitions, all of the flights scheduled departure times for flights departing from Chicago and Newark (317 of the 632 flights) were modified to be evenly spaced for 10 minute, Scheduled Gate Departure Time intervals which was not the case in the original file. In order to provide more detailed output data for the voice message traffic in the specific phases of the flight that would be evaluated, the enhanced terminal frequency assignment capability was used for the simulation. In using this feature, messages are discriminated for transmission by arrival and departure and by airport surface/gate operations, airport taxiway/takeoff operations and TRACON operations. The standard TerminalConfiguration, configuration file provides this setup by default, identifying six ground stations representing six individual frequencies for messages transmitted to/from appropriate controllers (represented as separate frequencies) for these operations. The simulation was run with voice communications enabled and was completed in approximately 20 minutes. Since the focus of the evaluation was on the time that was required in servicing aircraft in the airport airspace and TRACON at both airports, output data was collected for the specific message sequences that occur in these airspace for both airports. For the airport airspace, this included the Gate Clearance message through the first TRACON Frequency Instruction message for departure, and the Landing Clearance Request message through the final Gate Arrival Acknowledgement message for arrival. For the TRACON airspace these included, the first TRACON Frequency Contact message through the first Center Frequency Instruction Acknowledgement message for departure, and the Approach TRACON Frequency Contact message through the Airport Frequency Instruction Acknowledgement messages for arrival. These data were sorted to include only those that were handled by the appropriate frequency assignments for ORD and EWR. The results of the assessment are shown in Tables 3 and 4.

430
ORD - Departures Airport Airspace
Time Span Handling Operations: 6.85 Hrs
Total # of A-G messages
(A-G) Pilot Combined On-Air Time (Hrs)
Total # of G-A
messages
(G-A) ATC On-Air Time
(Hrs)
1293 2.12 650 1.79
ORD - Arrival Airport Airspace
Time Span Handling Operations: 6.12 Hrs
Total # of A-G messages
(A-G) Pilot Combined On-Air Time (Hrs)
Total # of G-A
messages
(G-A) ATC On-Air Time
(Hrs)
496 0.59 331 0.56
ORD - Departures TRACON Airspace
Time Span Handling Operations: 7.07 Hrs
Total # of A-G messages
(A-G) Pilot Combined On-Air Time (Hrs)
Total # of G-A
messages
(G-A) ATC On-Air Time
(Hrs)
457 0.57 578 1.26
ORD - Arrivals TRACON Airspace
Time Span Handling Operations: 6.18 Hrs
Total # of A-G messages
(A-G) Pilot Combined On-Air Time (Hrs)
Total # of G-A
messages
(G-A) ATC On-Air Time
(Hrs)
705 1.51 721 1.49
Table 3: Chicago (ORD) Workload Results
EWR - Departures Airport Airspace
Time Span Handling Operations: 4.05 Hrs
Total # of A-G messages
(A-G) Pilot Combined On-Air
Time (Hrs)
Total # of G-A
messages
(G-A) ATC On-Air Time
(Hrs)
851 1.34 386 1.04
EWR - Arrival Airport Airspace
Time Span Handling Operations: 6.87 Hrs
Total # of A-G messages
(A-G) Pilot Combined On-Air
Time (Hrs)
Total # of G-A
messages
(G-A) ATC On-Air Time
(Hrs)
277 0.32 222 0.36
EWR - Departures TRACON Airspace
Time Span Handling Operations: 4.24 Hrs
Total # of A-G messages
(A-G) Pilot Combined On-Air
Time (Hrs)
Total # of G-A
messages
(G-A) ATC On-Air Time
(Hrs)
536 0.65 450 0.85
EWR - Arrivals TRACON Airspace
Time Span Handling Operations: 6.68 Hrs
Total # of A-G messages
(A-G) Pilot Combined On-Air
Time (Hrs)
Total # of G-A
messages
(G-A) ATC On-Air Time
(Hrs)
433 0.93 379 0.73
Table 4: Newark (EWR) Workload Results In the tables, five values are indicated for each of the four ORD and EWR operations. The first is the time span required to handle that operation. This value was derived by finding the timestamps for the first occurrence of the first message transmitted in the appropriate message sequence, and the final occurrence of the last message in the sequence for each airspace. This number represents the end-to-end, duration of time that would have been required to service the particular operation for the duration of the simulation. This could be viewed as the time that a controller would be sitting at a console to service the communications required for the operation category.
The remaining four values for each operations category identify a count of the voice messages that occurred, and the ‘On-air’ time that was required to deliver them. These are broken down by Air-Ground (combined Pilot) messages and Ground-to-Air (ATC) messages. These times therefore represent the amount of time required to communicate the messages during the span of time to service the operation, for both ATC and Pilots. These numbers also include message counts and times for any retransmitted message that were required. Following the initial simulation, the Flight Data Set was modified again to demonstrate some of the other analysis information provided. The modification consisted of increasing the traffic load of the total simulation by doubling the number of flights departing from both the Chicago and Newark airports, and further congesting the air traffic by reducing the scheduled departure times for all of those flights (twice the number of the previous FDS) to five minute intervals. The new FDS that was created now consisted of 929 flights. After the second simulation was run, data from several communication system statistics files were collected. Tabulated results from both simulations for message failure category data that is available are shown in Table 5. The table indicates the message failure counts for interference (i.e. congestion) failures, message step-on failures, and messages that expired (were never transmitted) after all retransmission attempts failed. Data are shown for both the original (632 flight) and the 929 flight simulation, and for occurrences within the different airspaces at each airport. As would be expected, for all channels, the instances of transmission errors show an increase. Important in this information is that the number of errors indicated for channel congestion and step-on does not necessarily indicate or translate to messages that was not delivered. Since a protocol exists in the VHF radio model for retransmission of message that incur these errors, many of these will result in a second or third attempts to transmit the message that may be successful. This would account for the low number of actual messages that expired in both simulations.
Message Failed Due to: Airspace 632 Flight Simulation
929 Flight Simulation
Congestion KEWR 89 316 N90NY 297 1000 KORD 209 299 C90 1340 1969
Step-On KEWR 130 200 N90NY 126 246 KORD 362 432 C90 470 920
Transmission Expired KEWR 4 4 N90NY 5 15 KORD 10 10 C90 27 56
Table 5: Reported Message Error Summary
431
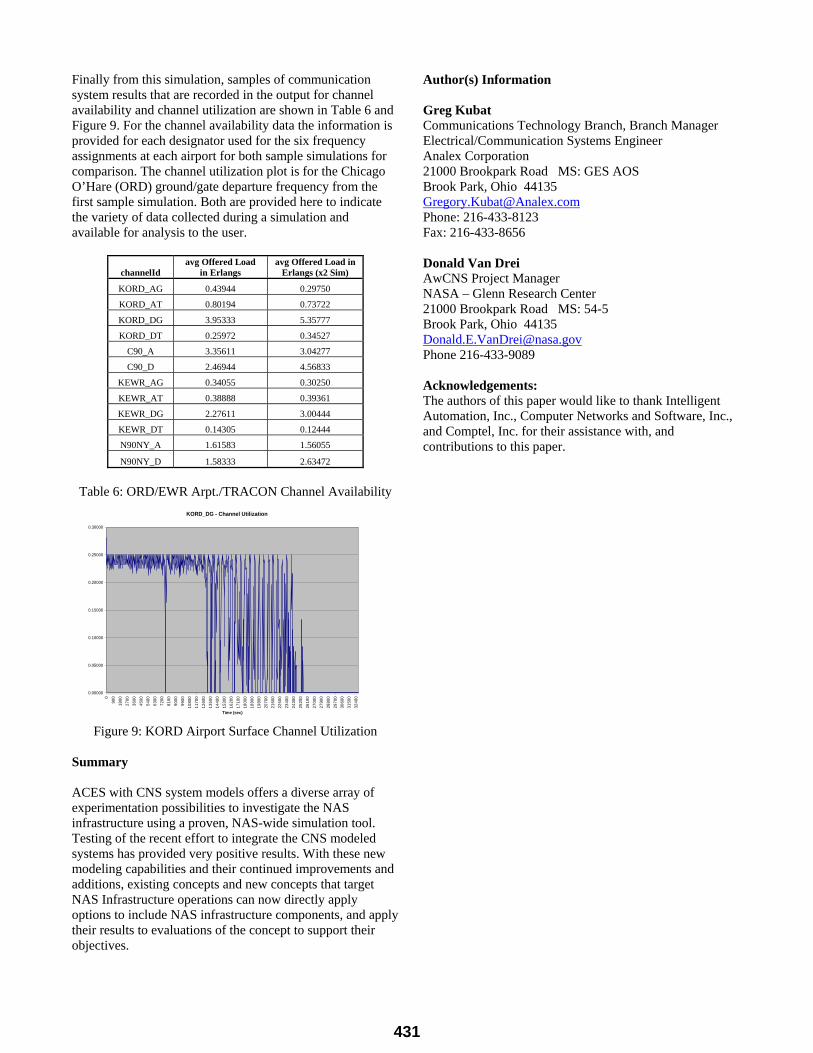
Finally from this simulation, samples of communication system results that are recorded in the output for channel availability and channel utilization are shown in Table 6 and Figure 9. For the channel availability data the information is provided for each designator used for the six frequency assignments at each airport for both sample simulations for comparison. The channel utilization plot is for the Chicago O’Hare (ORD) ground/gate departure frequency from the first sample simulation. Both are provided here to indicate the variety of data collected during a simulation and available for analysis to the user.
channelId avg Offered Load
in Erlangs avg Offered Load in
Erlangs (x2 Sim)
KORD_AG 0.43944 0.29750
KORD_AT 0.80194 0.73722
KORD_DG 3.95333 5.35777
KORD_DT 0.25972 0.34527
C90_A 3.35611 3.04277
C90_D 2.46944 4.56833
KEWR_AG 0.34055 0.30250
KEWR_AT 0.38888 0.39361
KEWR_DG 2.27611 3.00444
KEWR_DT 0.14305 0.12444
N90NY_A 1.61583 1.56055
N90NY_D 1.58333 2.63472
Table 6: ORD/EWR Arpt./TRACON Channel Availability
KORD_DG - Channel Utilization
0.00000
0.05000
0.10000
0.15000
0.20000
0.25000
0.30000
090
018
0027
0036
0045
0054
0063
0072
0081
0090
0099
0010
800
1170
012
600
1350
014
400
1530
016
200
1710
018
000
1890
019
800
2070
021
600
2250
023
400
2430
025
200
2610
027
000
2790
028
800
2970
030
600
3150
032
400
Time (sec)
Figure 9: KORD Airport Surface Channel Utilization
Summary ACES with CNS system models offers a diverse array of experimentation possibilities to investigate the NAS infrastructure using a proven, NAS-wide simulation tool. Testing of the recent effort to integrate the CNS modeled systems has provided very positive results. With these new modeling capabilities and their continued improvements and additions, existing concepts and new concepts that target NAS Infrastructure operations can now directly apply options to include NAS infrastructure components, and apply their results to evaluations of the concept to support their objectives.
Author(s) Information Greg Kubat Communications Technology Branch, Branch Manager Electrical/Communication Systems Engineer Analex Corporation 21000 Brookpark Road MS: GES AOS Brook Park, Ohio 44135 [email protected] Phone: 216-433-8123 Fax: 216-433-8656 Donald Van Drei AwCNS Project Manager NASA – Glenn Research Center 21000 Brookpark Road MS: 54-5 Brook Park, Ohio 44135 [email protected] Phone 216-433-9089 Acknowledgements: The authors of this paper would like to thank Intelligent Automation, Inc., Computer Networks and Software, Inc., and Comptel, Inc. for their assistance with, and contributions to this paper.

1G
lenn
Res
earc
h C
ente
r at L
ewis
Fie
ld
Commun
icat
ions
, Nav
igat
ion
and
Surv
eilla
nce
Mod
els
in A
CES
Test
Res
ults
and
Sam
ple
Conc
ept
Simulat
ion
Resu
lts
I-CN
S C
onfe
renc
eM
ay 1
stth
roug
h 3r
d , 20
06
Pre
sent
er –
Gre
g K
ubat
(Ana
lex
Cor
p.)
Aut
hors
: Gre
g K
ubat
(Ana
lex
Cor
p.),
Don
Van
drei
(NA
SA
GR
C)
2G
lenn
Res
earc
h C
ente
r at L
ewis
Fie
ld
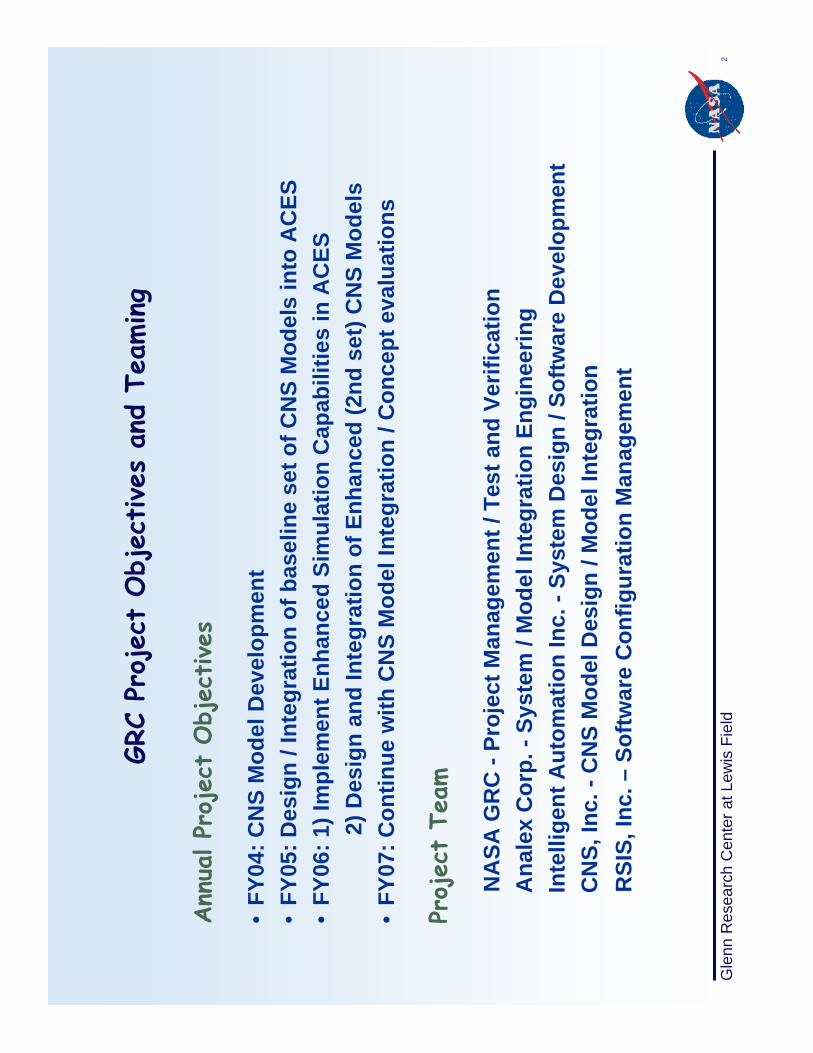
GRC
Proj
ect
Obj
ective
s an
d Te
aming
Ann
ual Pr
ojec
t Obj
ective
s
•FY
04: C
NS
Mod
el D
evel
opm
ent
•FY
05: D
esig
n / I
nteg
ratio
n of
bas
elin
e se
t of C
NS
Mod
els
into
AC
ES•
FY06
: 1) I
mpl
emen
t Enh
ance
d Si
mul
atio
n C
apab
ilitie
s in
AC
ES
2) D
esig
n an
d In
tegr
atio
n of
Enh
ance
d (2
nd s
et) C
NS
Mod
els
•FY
07: C
ontin
ue w
ith C
NS
Mod
el In
tegr
atio
n / C
once
pt e
valu
atio
ns
Proj
ect
Team
NA
SA G
RC
-Pr
ojec
t Man
agem
ent /
Tes
t and
Ver
ifica
tion
Ana
lex
Cor
p. -
Syst
em /
Mod
el In
tegr
atio
n En
gine
erin
gIn
telli
gent
Aut
omat
ion
Inc.
-Sy
stem
Des
ign
/ Sof
twar
e D
evel
opm
ent
CN
S, In
c. -
CN
S M
odel
Des
ign
/ Mod
el In
tegr
atio
nR
SIS,
Inc.
–So
ftwar
e C
onfig
urat
ion
Man
agem
ent
3G
lenn
Res
earc
h C
ente
r at L
ewis
Fie
ld
Pres
enta
tion
Obj
ective
s
Ove
rvie
w o
f the
AC
ES /
CN
S Sy
stem
Mod
els
and
Mod
elin
gEn
hanc
emen
ts
Pres
ent T
est R
esul
ts o
f CN
S Sy
stem
Mod
elin
g co
mpl
eted
to d
ate
Pres
ent T
est R
esul
ts o
f CN
S Sy
stem
Mod
elin
g En
hanc
emen
tsco
mpl
eted
to d
ate
Pres
ent r
esul
ts o
f a s
ampl
e C
once
pt to
dem
onst
rate
cap
abili
ties
4G
lenn
Res
earc
h C
ente
r at L
ewis
Fie
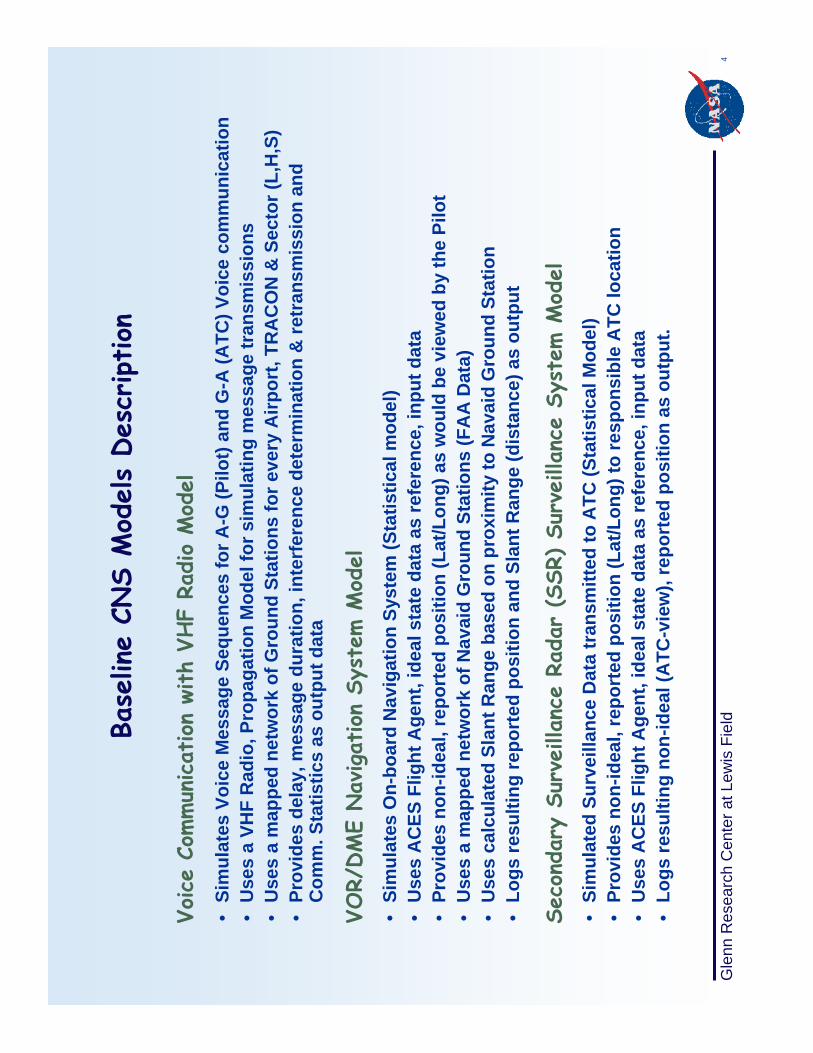
ldBase
line
CNS
Mod
els
Des
cription
Voice
Commun
icat
ion
with
VHF
Radio
Mod
el
VOR/
DM
E Nav
igat
ion
Syst
em M
odel
Seco
ndar
y Su
rveilla
nce
Rada
r (S
SR) Su
rveilla
nce
Syst
em M
odel
•Si
mul
ates
Voi
ce M
essa
ge S
eque
nces
for A
-G (P
ilot)
and
G-A
(ATC
) Voi
ce c
omm
unic
atio
n •
Use
s a
VHF
Rad
io, P
ropa
gatio
n M
odel
for s
imul
atin
g m
essa
ge tr
ansm
issi
ons
•U
ses
a m
appe
d ne
twor
k of
Gro
und
Stat
ions
for e
very
Airp
ort,
TRA
CO
N &
Sec
tor (
L,H
,S)
•Pr
ovid
es d
elay
, mes
sage
dur
atio
n, in
terf
eren
ce d
eter
min
atio
n &
retr
ansm
issi
on a
nd
Com
m. S
tatis
tics
as o
utpu
t dat
a
•Si
mul
ates
On-
boar
d N
avig
atio
n Sy
stem
(Sta
tistic
al m
odel
)•
Use
s A
CES
Flig
ht A
gent
, ide
al s
tate
dat
a as
refe
renc
e, in
put d
ata
•Pr
ovid
es n
on-id
eal,
repo
rted
pos
ition
(Lat
/Lon
g) a
s w
ould
be
view
ed b
y th
e Pi
lot
•U
ses
a m
appe
d ne
twor
k of
Nav
aid
Gro
und
Stat
ions
(FA
A D
ata)
•U
ses
calc
ulat
ed S
lant
Ran
ge b
ased
on
prox
imity
to N
avai
dG
roun
d St
atio
n•
Logs
resu
lting
repo
rted
pos
ition
and
Sla
nt R
ange
(dis
tanc
e) a
s ou
tput
•Si
mul
ated
Sur
veill
ance
Dat
a tr
ansm
itted
to A
TC (S
tatis
tical
Mod
el)
•Pr
ovid
es n
on-id
eal,
repo
rted
pos
ition
(Lat
/Lon
g) to
resp
onsi
ble
ATC
loca
tion
•U
ses
AC
ES F
light
Age
nt, i
deal
sta
te d
ata
as re
fere
nce,
inpu
t dat
a•
Logs
resu
lting
non
-idea
l (A
TC-v
iew
), re
port
ed p
ositi
on a
s ou
tput
.

5G
lenn
Res
earc
h C
ente
r at L
ewis
Fie
ld
Voice
and
CPDLC
Com
mun
icat
ion
Mes
sage
s
Gat
e-to
-Gat
e m
essa
ge e
xcha
nges
/mes
sage
seq
uenc
es d
eriv
ed fr
om s
ingl
e fli
ght V
oice
Scr
ipt
6G
lenn
Res
earc
h C
ente
r at L
ewis
Fie
ld
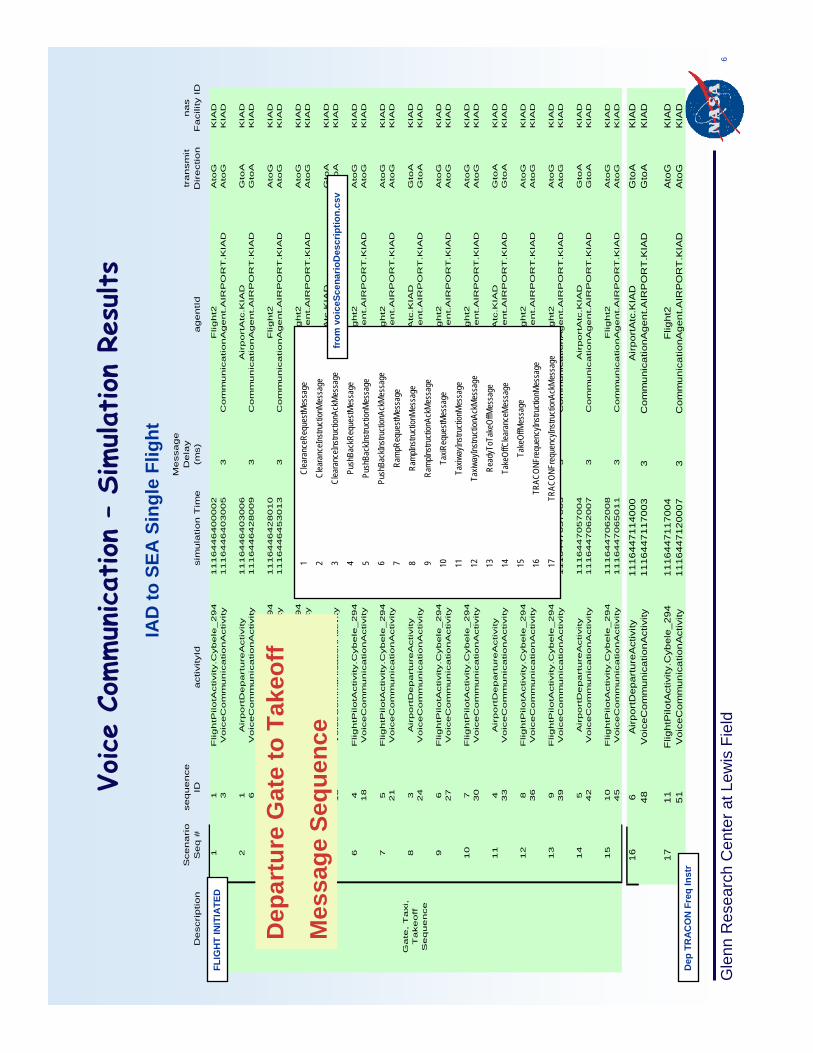
Voice
Commun
icat
ion
–Si
mulat
ion
Resu
lts
IAD
to S
EA S
ingl
e Fl
ight
11
Flig
htP
ilo
tActivity.C
yb
ele
_2
94
11
16
44
64
00
00
2F
lig
ht2
Ato
GK
IAD
3V
oic
eC
om
mu
nic
atio
nA
ctivity
11
16
44
64
03
00
53
Co
mm
un
ica
tio
nA
ge
nt.
AIR
PO
RT
.KIA
DA
toG
KIA
D
21
Air
po
rtD
ep
art
ure
Activity
11
16
44
64
03
00
6A
irp
ort
Atc
.KIA
DG
toA
KIA
D6
Vo
ice
Co
mm
un
ica
tio
nA
ctivity
11
16
44
64
28
00
93
Co
mm
un
ica
tio
nA
ge
nt.
AIR
PO
RT
.KIA
DG
toA
KIA
D
32
Flig
htP
ilo
tActivity.C
yb
ele
_2
94
11
16
44
64
28
01
0F
lig
ht2
Ato
GK
IAD
9V
oic
eC
om
mu
nic
atio
nA
ctivity
11
16
44
64
53
01
33
Co
mm
un
ica
tio
nA
ge
nt.
AIR
PO
RT
.KIA
DA
toG
KIA
D
43
Flig
htP
ilo
tActivity.C
yb
ele
_2
94
11
16
44
64
54
01
0F
lig
ht2
Ato
GK
IAD
12
Vo
ice
Co
mm
un
ica
tio
nA
ctivity
11
16
44
64
57
01
33
Co
mm
un
ica
tio
nA
ge
nt.
AIR
PO
RT
.KIA
DA
toG
KIA
D
52
Air
po
rtD
ep
art
ure
Activity
11
16
44
64
57
01
4A
irp
ort
Atc
.KIA
DG
toA
KIA
D1
5V
oic
eC
om
mu
nic
atio
nA
ctivity
11
16
44
64
62
01
73
Co
mm
un
ica
tio
nA
ge
nt.
AIR
PO
RT
.KIA
DG
toA
KIA
D
64
Flig
htP
ilo
tActivity.C
yb
ele
_2
94
11
16
44
64
62
01
8F
lig
ht2
Ato
GK
IAD
18
Vo
ice
Co
mm
un
ica
tio
nA
ctivity
11
16
44
64
65
02
13
Co
mm
un
ica
tio
nA
ge
nt.
AIR
PO
RT
.KIA
DA
toG
KIA
D
75
Flig
htP
ilo
tActivity.C
yb
ele
_2
94
11
16
44
65
20
00
0F
lig
ht2
Ato
GK
IAD
21
Vo
ice
Co
mm
un
ica
tio
nA
ctivity
11
16
44
65
23
00
33
Co
mm
un
ica
tio
nA
ge
nt.
AIR
PO
RT
.KIA
DA
toG
KIA
D
83
Air
po
rtD
ep
art
ure
Activity
11
16
44
65
23
00
4A
irp
ort
Atc
.KIA
DG
toA
KIA
D2
4V
oic
eC
om
mu
nic
atio
nA
ctivity
11
16
44
65
26
00
73
Co
mm
un
ica
tio
nA
ge
nt.
AIR
PO
RT
.KIA
DG
toA
KIA
D
96
Flig
htP
ilo
tActivity.C
yb
ele
_2
94
11
16
44
65
26
00
8F
lig
ht2
Ato
GK
IAD
27
Vo
ice
Co
mm
un
ica
tio
nA
ctivity
11
16
44
65
29
01
13
Co
mm
un
ica
tio
nA
ge
nt.
AIR
PO
RT
.KIA
DA
toG
KIA
D
10
7F
lig
htP
ilo
tActivity.C
yb
ele
_2
94
11
16
44
69
64
00
0F
lig
ht2
Ato
GK
IAD
30
Vo
ice
Co
mm
un
ica
tio
nA
ctivity
11
16
44
69
69
00
33
Co
mm
un
ica
tio
nA
ge
nt.
AIR
PO
RT
.KIA
DA
toG
KIA
D
11
4A
irp
ort
De
pa
rtu
reA
ctivity
11
16
44
69
69
00
4A
irp
ort
Atc
.KIA
DG
toA
KIA
D3
3V
oic
eC
om
mu
nic
atio
nA
ctivity
11
16
44
69
74
00
73
Co
mm
un
ica
tio
nA
ge
nt.
AIR
PO
RT
.KIA
DG
toA
KIA
D
12
8F
lig
htP
ilo
tActivity.C
yb
ele
_2
94
11
16
44
69
74
00
8F
lig
ht2
Ato
GK
IAD
36
Vo
ice
Co
mm
un
ica
tio
nA
ctivity
11
16
44
69
79
01
13
Co
mm
un
ica
tio
nA
ge
nt.
AIR
PO
RT
.KIA
DA
toG
KIA
D
13
9F
lig
htP
ilo
tActivity.C
yb
ele
_2
94
11
16
44
70
54
00
0F
lig
ht2
Ato
GK
IAD
39
Vo
ice
Co
mm
un
ica
tio
nA
ctivity
11
16
44
70
57
00
33
Co
mm
un
ica
tio
nA
ge
nt.
AIR
PO
RT
.KIA
DA
toG
KIA
D
14
5A
irp
ort
De
pa
rtu
reA
ctivity
11
16
44
70
57
00
4A
irp
ort
Atc
.KIA
DG
toA
KIA
D4
2V
oic
eC
om
mu
nic
atio
nA
ctivity
11
16
44
70
62
00
73
Co
mm
un
ica
tio
nA
ge
nt.
AIR
PO
RT
.KIA
DG
toA
KIA
D
15
10
Flig
htP
ilo
tActivity.C
yb
ele
_2
94
11
16
44
70
62
00
8F
lig
ht2
Ato
GK
IAD
45
Vo
ice
Co
mm
un
ica
tio
nA
ctivity
11
16
44
70
65
01
13
Co
mm
un
ica
tio
nA
ge
nt.
AIR
PO
RT
.KIA
DA
toG
KIA
D
Ga
te,
Ta
xi,
Ta
ke
off
S
eq
ue
nce
De
scri
ptio
nS
ce
na
rio
S
eq
#se
qu
en
ce
ID
activityId
sim
ula
tio
n T
ime
Me
ssa
ge
D
ela
y
(ms)
ag
en
tId
tra
nsm
it
Dir
ectio
nn
as
Fa
cili
ty I
D
1Cl
eara
nceR
eque
stMes
sage
2Cl
eara
nceI
nstru
ction
Mes
sage
3Cl
eara
nceI
nstru
ction
AckM
essa
ge
4Pu
shBa
ckRe
ques
tMes
sage
5Pu
shBa
ckIn
struc
tionM
essa
ge
6Pu
shBa
ckIn
struc
tionA
ckM
essa
ge
7Ra
mpR
eque
stMes
sage
8Ra
mpI
nstru
ction
Mes
sage
9Ra
mpI
nstru
ction
AckM
essa
ge
10Ta
xiReq
uestM
essa
ge
11Ta
xiway
Instr
uctio
nMes
sage
12Ta
xiway
Instr
uctio
nAck
Mes
sage
13Re
adyT
oTak
eOffM
essa
ge
14Ta
keOf
fClea
ranc
eMes
sage
15Ta
keOf
fMes
sage
16TR
ACON
Freq
uenc
yInstr
uctio
nMes
sage
17TR
ACON
Freq
uenc
yInstr
uctio
nAck
Mes
sage
from
voi
ceSc
enar
ioD
escr
iptio
n.cs
v
16
6A
irp
ort
De
pa
rtu
reA
ctiv
ity1
11
64
47
11
40
00
Air
po
rtA
tc.K
IAD
Gto
AK
IAD
48
Vo
ice
Co
mm
un
ica
tion
Act
ivity
11
16
44
71
17
00
33
Co
mm
un
ica
tion
Ag
en
t.A
IRP
OR
T.K
IAD
Gto
AK
IAD
17
11
Flig
htP
ilotA
ctiv
ity.C
ybe
le_
29
41
11
64
47
11
70
04
Flig
ht2
Ato
GK
IAD
51
Vo
ice
Co
mm
un
ica
tion
Act
ivity
11
16
44
71
20
00
73
Co
mm
un
ica
tion
Ag
en
t.A
IRP
OR
T.K
IAD
Ato
GK
IAD
FLIG
HT
INIT
IATE
D
Dep
TRAC
ON
Fre
q In
str
Dep
artu
re G
ate
to T
akeo
ff
Mes
sage
Seq
uenc
e
7G
lenn
Res
earc
h C
ente
r at L
ewis
Fie
ld
Voice
Commun
icat
ion
–Si
mulat
ion
Resu
lts
122
Flight
Sim
ulat
ion
–Ga
te D
epar
t to
Tak
eoff
Msg
Sequ
ence
Atla
nta
- Ter
min
al/G
roun
d M
essa
ges
(Flig
hts
DA
L431
/ C
AA47
6)
0123456789101112131415161718
0.0
100.
020
0.0
300.
040
0.0
500.
060
0.0
700.
080
0.0
Tim
e (S
econ
ds)
Scenario Message Number
Cle
aran
ceR
eque
stM
essa
ge (1
)
Cle
aran
ceIn
stru
ctio
nMes
sage
(2)
Cle
aran
ceIn
stru
ctio
nAck
Mes
sage
(3)
Pus
hbac
kReq
uest
Mes
sage
(4)
Pus
hbac
kIns
truct
ionA
ckM
essa
ge (6
)
Ram
pReq
uest
Mes
sage
(7)
Pus
hbac
kIns
truct
ionM
essa
ge (5
)
TRA
CO
NFr
eqIn
stru
cMes
sage
(16)
Taxi
Re q
uest
Mes
sage
(10)
Ram
pIns
truct
ionA
ckM
essa
ge (9
)
Taxi
way
Inst
ruct
ionM
essa
ge (1
1)
Taxi
way
Inst
ruct
ionA
ckM
essa
ge (1
2)
Rea
dyTo
Take
offM
essa
ge (1
3)
Take
offC
lear
ance
Mes
sage
(14)
Take
offM
essa
ge (1
5)
TRA
CO
NFr
eqIn
stru
cAck
Mes
sage
(17)
Ram
pIns
truct
ionM
essa
ge (8
)
Gap
Due
to
Built
-in P
ushb
ack
to R
ampR
eque
st D
elay
Gap
Due
to
Built
-in C
ombi
ned
Push
back
and
Ta
keof
f-to
-Tax
iReq
uest
Del
ays
Flig
ht 4
76 R
ampR
eque
st M
essa
ge in
terf
eres
wi
th F
light
431
TRA
CON
Freq
Inst
rucM
essa
ge
Retr
ansm
issi
on
of M
essa
ge #
16
occu
rs a
fter
Fl
ight
476
Ram
p
CAA47
6 In
itiate
d
DAL4
31 I
nitiat
ed
Retr
ansm
issi
on
of F
light
476
M
essa
ge 7
and
as
soci
ated
Ra
mpR
eque
st
Ack
mes
sage
s oc
cur
prio
r to
Fl
ight
431
8G
lenn
Res
earc
h C
ente
r at L
ewis
Fie
ld
Voice
Commun
icat
ion
-Si
mulat
ion
Resu
lts
IAD
to S
EA S
ingl
e Fl
ight
De
scri
ptio
nS
cen
ari
o
Se
q #
seq
ue
nce
ID
act
ivity
Idsi
mu
latio
n T
ime
Me
ssa
ge
D
ela
y (m
s)a
ge
ntI
dtr
an
smit
Dir
ect
ion
na
s F
aci
lity
ID
18
1F
ligh
tAsc
en
tAct
ivity
11
16
44
72
09
00
0F
ligh
t2A
toG
TK
IAD
3V
oic
eC
om
mu
nic
atio
nA
ctiv
ity
11
16
44
72
13
00
11
Co
mm
un
ica
tio
nA
ge
nt.
TR
AC
ON
.TK
IAD
Ato
GT
KIA
D
19
1T
erm
ina
lDe
pa
rtu
reA
ctiv
ity
11
16
44
72
13
00
2T
raco
nA
tc.T
KIA
DG
toA
TK
IAD
6V
oic
eC
om
mu
nic
atio
nA
ctiv
ity
11
16
44
72
27
00
31
Co
mm
un
ica
tio
nA
ge
nt.
TR
AC
ON
.TK
IAD
Gto
AT
KIA
D 20
2F
ligh
tAsc
en
tAct
ivity
11
16
44
72
27
00
4F
ligh
t2A
toG
TK
IAD
9V
oic
eC
om
mu
nic
atio
nA
ctiv
ity
11
16
44
72
32
00
51
Co
mm
un
ica
tio
nA
ge
nt.
TR
AC
ON
.TK
IAD
Ato
GT
KIA
D
64
2T
erm
ina
lDe
pa
rtu
reA
ctiv
ity
11
16
44
73
97
26
0T
raco
nA
tc.T
KIA
DG
toA
TK
IAD
12
Vo
ice
Co
mm
un
ica
tio
nA
ctiv
ity
11
16
44
74
02
26
11
Co
mm
un
ica
tio
nA
ge
nt.
TR
AC
ON
.TK
IAD
Gto
AT
KIA
D6
53
Flig
htA
sce
ntA
ctiv
ity
11
16
44
74
02
26
2F
ligh
t2A
toG
TK
IAD
15
Vo
ice
Co
mm
un
ica
tio
nA
ctiv
ity
11
16
44
74
07
26
31
Co
mm
un
ica
tio
nA
ge
nt.
TR
AC
ON
.TK
IAD
Ato
GT
KIA
D6
43
Te
rmin
alD
ep
art
ure
Act
ivity
11
16
44
76
50
52
0T
raco
nA
tc.T
KIA
DG
toA
TK
IAD
18
Vo
ice
Co
mm
un
ica
tio
nA
ctiv
ity
11
16
44
76
55
52
11
Co
mm
un
ica
tio
nA
ge
nt.
TR
AC
ON
.TK
IAD
Gto
AT
KIA
D6
54
Flig
htA
sce
ntA
ctiv
ity
11
16
44
76
55
52
2F
ligh
t2A
toG
TK
IAD
21
Vo
ice
Co
mm
un
ica
tio
nA
ctiv
ity
11
16
44
76
60
52
31
Co
mm
un
ica
tio
nA
ge
nt.
TR
AC
ON
.TK
IAD
Ato
GT
KIA
D6
44
Te
rmin
alD
ep
art
ure
Act
ivity
11
16
44
79
03
78
0T
raco
nA
tc.T
KIA
DG
toA
TK
IAD
24
Vo
ice
Co
mm
un
ica
tio
nA
ctiv
ity
11
16
44
79
08
78
11
Co
mm
un
ica
tio
nA
ge
nt.
TR
AC
ON
.TK
IAD
Gto
AT
KIA
D6
55
Flig
htA
sce
ntA
ctiv
ity
11
16
44
79
08
78
2F
ligh
t2A
toG
TK
IAD
27
Vo
ice
Co
mm
un
ica
tio
nA
ctiv
ity
11
16
44
79
13
78
31
Co
mm
un
ica
tio
nA
ge
nt.
TR
AC
ON
.TK
IAD
Ato
GT
KIA
D
21
5T
erm
ina
lDe
pa
rtu
reA
ctiv
ity
11
16
44
79
09
78
0T
raco
nA
tc.T
KIA
DG
toA
TK
IAD
30
Vo
ice
Co
mm
un
ica
tio
nA
ctiv
ity
11
16
44
79
18
06
35
28
3C
om
mu
nic
atio
nA
ge
nt.
TR
AC
ON
.TK
IAD
Gto
AT
KIA
D
22
6F
ligh
tAsc
en
tAct
ivity
11
16
44
79
18
06
4F
ligh
t2A
toG
TK
IAD
33
Vo
ice
Co
mm
un
ica
tio
nA
ctiv
ity
11
16
44
79
21
06
51
Co
mm
un
ica
tio
nA
ge
nt.
TR
AC
ON
.TK
IAD
Ato
GT
KIA
D
23
2F
ligh
tEn
Ro
ute
Act
ivity
11
16
44
80
43
78
2F
ligh
t2A
toG
ZD
C0
53
Vo
ice
Co
mm
un
ica
tio
nA
ctiv
ity
11
16
44
80
53
78
31
Co
mm
un
ica
tio
nA
ge
nt.
AR
TC
C.Z
DC
Ato
GZ
DC
05
24
1C
ross
ing
Act
ivity.
ZD
C1
11
64
48
05
37
84
Art
ccA
tc.Z
DC
Gto
AZ
DC
05
6V
oic
eC
om
mu
nic
atio
nA
ctiv
ity
11
16
44
80
61
78
51
Co
mm
un
ica
tio
nA
ge
nt.
AR
TC
C.Z
DC
Gto
AZ
DC
05
25
3F
ligh
tEn
Ro
ute
Act
ivity
11
16
44
80
61
78
6F
ligh
t2A
toG
ZD
C0
59
Vo
ice
Co
mm
un
ica
tio
nA
ctiv
ity
11
16
44
80
64
78
71
Co
mm
un
ica
tio
nA
ge
nt.
AR
TC
C.Z
DC
Ato
GZ
DC
05
26
-12
Cro
ssin
gA
ctiv
ity.
ZD
C1
11
64
48
21
87
82
Art
ccA
tc.Z
DC
Gto
AZ
DC
05
72
Vo
ice
Co
mm
un
ica
tio
nA
ctiv
ity
11
16
44
82
21
78
31
Co
mm
un
ica
tio
nA
ge
nt.
AR
TC
C.Z
DC
Gto
AZ
DC
05
27
-14
Flig
htE
nR
ou
teA
ctiv
ity
11
16
44
82
21
78
4F
ligh
t2A
toG
ZD
C0
57
5V
oic
eC
om
mu
nic
atio
nA
ctiv
ity
11
16
44
82
24
78
51
Co
mm
un
ica
tio
nA
ge
nt.
AR
TC
C.Z
DC
Ato
GZ
DC
05
28
-15
Flig
htE
nR
ou
teA
ctiv
ity
11
16
44
83
73
78
2F
ligh
t2A
toG
ZD
C0
38
3V
oic
eC
om
mu
nic
atio
nA
ctiv
ity
11
16
44
83
78
78
31
Co
mm
un
ica
tio
nA
ge
nt.
AR
TC
C.Z
DC
Ato
GZ
DC
03
29
-13
Cro
ssin
gA
ctiv
ity.
ZD
C1
11
64
48
37
87
84
Art
ccA
tc.Z
DC
Gto
AZ
DC
03
87
Vo
ice
Co
mm
un
ica
tio
nA
ctiv
ity
11
16
44
83
81
78
51
Co
mm
un
ica
tio
nA
ge
nt.
AR
TC
C.Z
DC
Gto
AZ
DC
03
A/C
Tra
nsi
tio
n
fro
m A
irp
ort
A
irsp
ace
to
D
ep
atu
re
TR
AC
ON
Sect
or
to S
ect
or
De
pa
rtu
re
TR
AC
ON
M
an
eu
ver
Me
ssa
ges
A/C
tra
nsi
tio
n
fro
m D
ep
art
ure
T
RA
CO
N in
to f
irst
Ce
nte
r -
ZD
C (
ie
En
rou
te A
irsp
ace
)
18De
partu
reTRA
CONC
ontac
tReq
uestM
essa
ge
19De
partu
reTRA
CONR
adarC
ontac
tWith
Instru
ction
Mess
age
20De
partu
reTRA
CONR
adarC
ontac
tWith
Instru
ction
AckM
essa
ge
64De
partu
reMan
euve
rMes
sage
65De
partu
reMan
euve
rAck
Mess
age
21Fir
stART
CCFre
quen
cyIns
tructi
onMe
ssag
e
22Fir
stART
CCFre
quen
cyIns
tructi
onAc
kMes
sage
23Fir
stART
CCCo
ntactR
eque
stMes
sage
24AR
TCCR
adarC
ontac
tWith
Instru
ction
Mess
age
25AR
TCCR
adarC
ontac
tWith
Instru
ction
AckM
essa
ge
26Se
ctorF
reque
ncyIn
struc
tionM
essa
ge
27Se
ctorFr
eque
ncyIn
struc
tionA
ckMe
ssag
e
28Se
ctorC
ontac
tReq
uestM
essa
ge
29Se
ctorR
adarC
ontac
tMes
sage
Ente
rs D
ep. T
RAC
ON
Ente
rs 1
stC
ente
r
Ente
rs N
ext S
ecto
r
Cen
ter T
rans
ition
and
Sect
or T
rans
ition
Freq
Han
doff
Mes
sage
s

9G
lenn
Res
earc
h C
ente
r at L
ewis
Fie
ld
Voice
Commun
icat
ion
–Si
mulat
ion
Resu
lts
122
Flight
Sim
ulat
ion
–Ce
nter
and
Sec
tor
Freq
uenc
y Han
doff
Msg
Sequ
ence
sZO
B C
ente
r Bou
ndar
y to
Cen
ter B
ound
ary
Mes
sage
s -
Enro
ute
( Flig
hts
CO
M26
2 / C
OA
172
/ NW
A39
6 )
2526272829303132333435
0.0
500.
010
00.0
1500
.020
00.0
2500
.030
00.0
3500
.040
00.0
4500
.050
00.0
5500
.060
00.0
Tim
e (S
econ
ds)
Scenario Message Number
COM
262
NW
A39
6CO
A17
26
AR
TCC
Con
tact
Req
uest
Mes
sage
(32)
AR
TCC
Rad
arC
onta
ctM
essa
ge (3
3)
AR
TCC
Freq
uenc
yIns
truct
ionA
ckM
essa
ge (3
1)
AR
TCC
Freq
uenc
yIns
truct
ionM
essa
ge (3
0)
Sec
torR
adar
Con
tact
Mes
sage
(29)
Sec
torC
onta
ctR
eque
stM
essa
ge (2
8)
Sec
torF
reqI
nstru
ctio
nAck
Mes
sage
(27)
Sec
torF
reqI
nstru
ctio
nMes
sage
(26)
ZOB6
7ZO
B66
ZOB5
7ZO
B48
ZOB4
8ZO
B46
ZOB2
8ZO
B47 ZO
B47
ZOB4
9ZO
B49
ZOB6
7
CEn
ter
CEn
ter
CEn
ter
CEx
itC
Exit
CEx
it
S - S
S - S
S - S
S - S
S - S
S - S
ZOB2
8
ZOB6
7ZO
B46
ZOB6
6
ZOB5
7ZO
B67

10G
lenn
Res
earc
h C
ente
r at L
ewis
Fie
ld
Nav
igat
ion
(VOR/
DM
E) C
hara
cter
izat
ion
Test
Res
ults
L.A
. to
Atla
nta
0
0.51
1.52
2.53
3.5
111
2131
4151
6171
8191
101
111
121
131
141
151
161
171
181
191
201
211
221
231
241
251
261
Stat
e M
essa
ge N
umbe
r
Position delta (nmi)
Flig
ht 7
4
Flig
ht 7
5
5 pe
r. M
ov.
Avg
. (Fl
ight
74)
5 pe
r. M
ov.
Avg
. (Fl
ight
75)
•Te
st s
imul
atio
n fle
w tw
o fli
ghts
alo
ng s
ame
rout
es b
etw
een
seve
ral m
ajor
US
airp
orts
.
Typi
cal r
esul
ting
plot
sho
win
g di
ffere
nce
betw
een
true
and
repo
rted
pos
ition
(i.e
. po
sitio
n de
lta)
for e
ach
Flig
ht A
gent
Sta
te
mes
sage
(1/m
in)
Cyc
lical
pat
tern
in a
ll pl
ots
due
to S
lant
R
ange
val
ue e
ffect
on
mod
el a
ccur
acy
•Lo
wer
cha
rt fr
om 1
22 fl
ight
sim
ulat
ion
Indi
cate
s ra
nges
of S
lant
Ran
ge v
s.
Posi
tion
delta
(lar
ger s
lant
dis
tanc
e –
wid
er
posi
tion
diffe
renc
e)
Avg
delta
= .5
1 nm
S
tdD
ev=.
692
VOR
/DM
E Sl
ant D
ista
nce
vs. P
ositi
on D
elta
(Tru
e vs
Rep
orte
d)
0-5 Nm5-10 Nm.
10-15 Nm.15-20 Nm.
20-25 Nm.25-30 Nm.
30-35 Nm.35-40 Nm.
40-45 Nm.45-50 Nm.
50-55 Nm.55-60 Nm.60-65 Nm.
65-70 Nm.70-75 Nm.75-80 Nm.
85-90 Nm.90-95 Nm.
95-100 Nm.100-105 Nm.
105-110 Nm.110-115 Nm.
115-120 Nm.120-125 Nm.
125-130 Nm.130-135 Nm.
135-140 Nm.140-145 Nm.
145-150 Nm.150-155 Nm.155-160 Nm.
160-165 Nm.165-170 Nm.
170-175 Nm.175 -180 Nm.
180-185 Nm.185-190 Nm.
190-195 Nm.195-200 Nm.
200-250 Nm.250-300 Nm.
80-85 Nm.0.
00
0.50
1.00
1.50
2.00
2.50
3.00
3.50
Incr
easi
ng S
lant
Dis
tanc
e
Position Delta (Nm.)
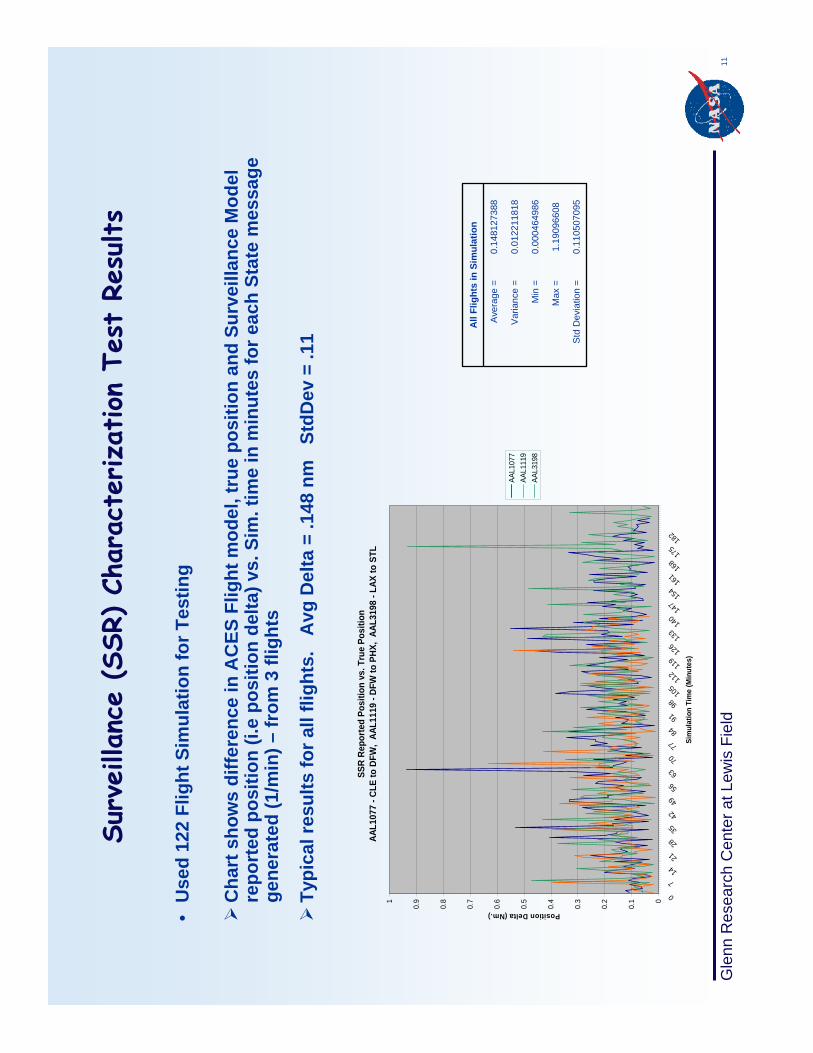
11G
lenn
Res
earc
h C
ente
r at L
ewis
Fie
ld
Surv
eilla
nce
(SSR
) Ch
arac
teriza
tion
Tes
t Re
sults
•U
sed
122
Flig
ht S
imul
atio
n fo
r Tes
ting
Cha
rt s
how
s di
ffere
nce
in A
CES
Flig
ht m
odel
, tru
e po
sitio
n an
d Su
rvei
llanc
e M
odel
re
port
ed p
ositi
on (i
.e p
ositi
on d
elta
) vs.
Sim
. tim
e in
min
utes
for e
ach
Stat
e m
essa
ge
gene
rate
d (1
/min
) –fr
om 3
flig
hts
Typi
cal r
esul
ts fo
r all
fligh
ts.
Avg
Del
ta =
.148
nm
St
dDev
= .1
1
SSR
Repo
rted
Posi
tion
vs. T
rue
Posi
tion
AAL1
077
- CLE
to D
FW,
AAL1
119
- DFW
to P
HX,
AAL3
198
- LAX
to S
TL
0
0.1
0.2
0.3
0.4
0.5
0.6
0.7
0.8
0.91
07
1421
2835
4249
5663
7077
8491
9810
511
211
912
613
314
014
715
416
116
817
518
2
Sim
ulat
ion
Tim
e (M
inut
es)
Position Delta (Nm.)
AAL1
077
AAL1
119
AAL3
198
0.11
0507
095
Std
Dev
iatio
n =
1.19
0966
08M
ax =
0.00
0464
986
Min
=
0.01
2211
818
Var
ianc
e =
0.14
8127
388
Ave
rage
=
All
Flig
hts
in S
imul
atio
n
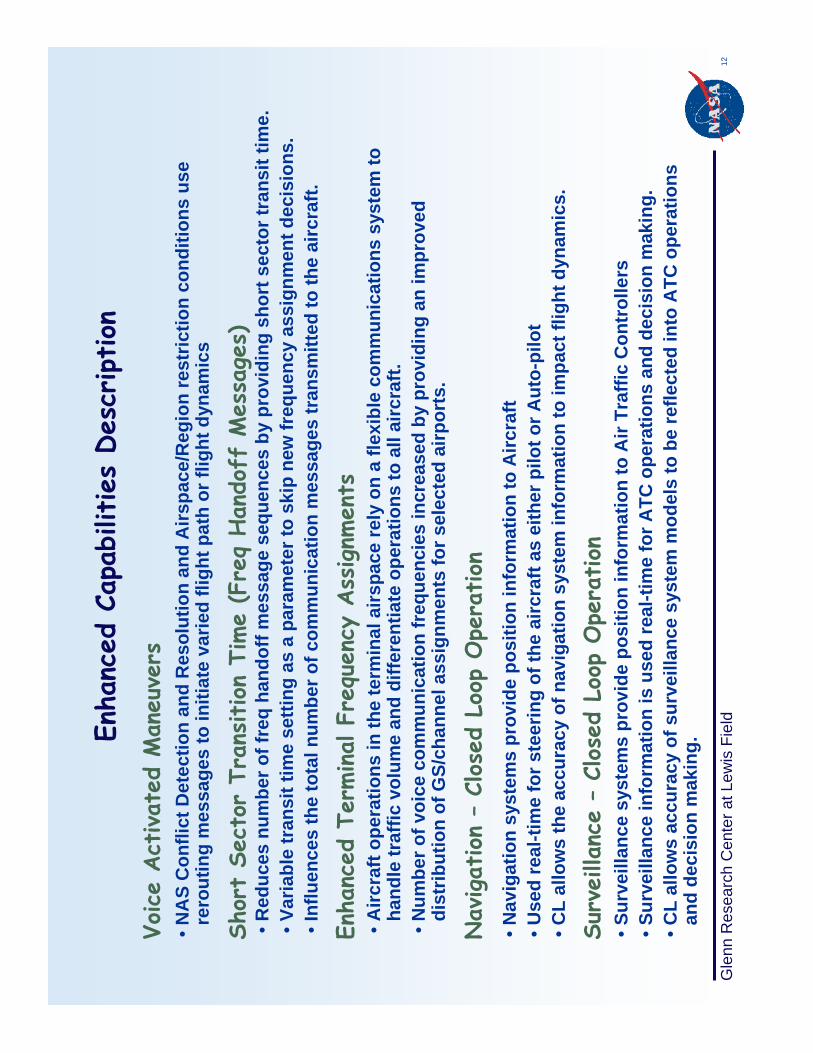
12G
lenn
Res
earc
h C
ente
r at L
ewis
Fie
ldEnha
nced
Cap
abilities
Des
cription
Voice
Act
ivat
ed M
aneu
vers
Shor
t Se
ctor
Tra
nsition
Time
(Fre
q Han
doff
Mes
sage
s)
Enha
nced
Ter
minal F
requ
ency
Ass
ignm
ents
Nav
igat
ion
–Cl
osed
Loo
p Ope
ration
Surv
eilla
nce
–Cl
osed
Loo
p Ope
ration
•NA
S C
onfli
ct D
etec
tion
and
Res
olut
ion
and
Airs
pace
/Reg
ion
rest
rictio
n co
nditi
ons
use
rero
utin
g m
essa
ges
to in
itiat
e va
ried
fligh
t pat
h or
flig
ht d
ynam
ics
•Airc
raft
oper
atio
ns in
the
term
inal
airs
pace
rely
on
a fle
xibl
e co
mm
unic
atio
ns s
yste
m to
ha
ndle
traf
fic v
olum
e an
d di
ffere
ntia
te o
pera
tions
to a
ll ai
rcra
ft.
•Num
ber o
f voi
ce c
omm
unic
atio
n fr
eque
ncie
s in
crea
sed
by p
rovi
ding
an im
prov
ed
dist
ribut
ion
of G
S/ch
anne
l ass
ignm
ents
for s
elec
ted
airp
orts
.
•Sur
veill
ance
sys
tem
s pr
ovid
e po
sitio
n in
form
atio
n to
Air
Traf
ficC
ontr
olle
rs•S
urve
illan
ce in
form
atio
n is
use
d re
al-ti
me
for A
TC o
pera
tions
and
dec
isio
n m
akin
g.•C
L al
low
s ac
cura
cy o
f sur
veill
ance
sys
tem
mod
els
to b
e re
flect
edin
to A
TC o
pera
tions
an
d de
cisi
on m
akin
g.
•Red
uces
num
ber o
f fre
q ha
ndof
f mes
sage
seq
uenc
es b
y pr
ovid
ing
shor
t sec
tor t
rans
it tim
e.•V
aria
ble
tran
sit t
ime
setti
ng a
s a
para
met
er to
ski
p ne
w fr
eque
ncy
assi
gnm
ent d
ecis
ions
. •I
nflu
ence
s th
e to
tal n
umbe
r of c
omm
unic
atio
n m
essa
ges
tran
smitt
ed to
the
airc
raft.
•Nav
igat
ion
syst
ems
prov
ide
posi
tion
info
rmat
ion
to A
ircra
ft•U
sed
real
-tim
e fo
r ste
erin
g of
the
airc
raft
as e
ither
pilo
t or A
uto-
pilo
t•C
L al
low
s th
e ac
cura
cy o
f nav
igat
ion
syst
em in
form
atio
n to
impa
ct fl
ight
dyn
amic
s.
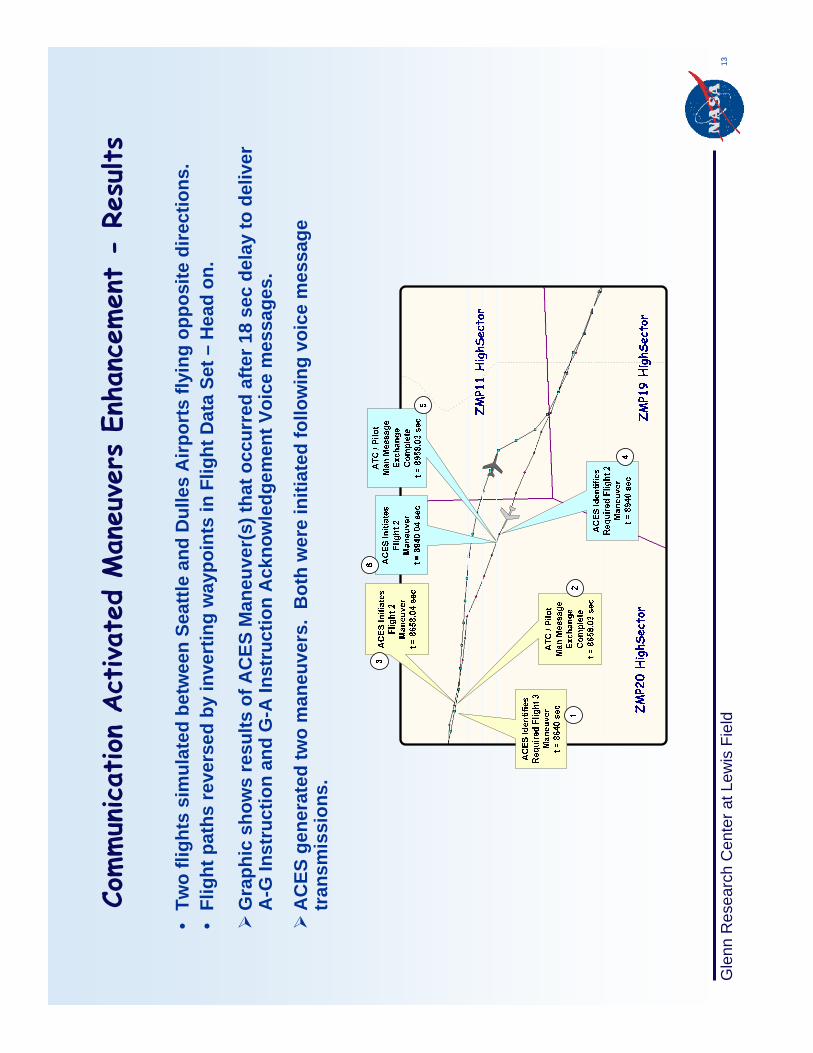
13G
lenn
Res
earc
h C
ente
r at L
ewis
Fie
ld
Commun
icat
ion
Act
ivat
ed M
aneu
vers
Enh
ance
men
t -
Resu
lts
•Tw
o fli
ghts
sim
ulat
ed b
etw
een
Seat
tle a
nd D
ulle
s A
irpor
ts fl
ying
oppo
site
dire
ctio
ns.
•Fl
ight
pat
hs re
vers
ed b
y in
vert
ing
way
poin
ts in
Flig
ht D
ata
Set –
Hea
d on
.
Gra
phic
sho
ws
resu
lts o
f AC
ES M
aneu
ver(
s) th
at o
ccur
red
afte
r 18
sec
dela
y to
del
iver
A
-G In
stru
ctio
n an
d G
-A In
stru
ctio
n A
ckno
wle
dgem
ent V
oice
mes
sage
s.
AC
ES g
ener
ated
two
man
euve
rs.
Bot
h w
ere
initi
ated
follo
win
g vo
ice
mes
sage
tr
ansm
issi
ons.
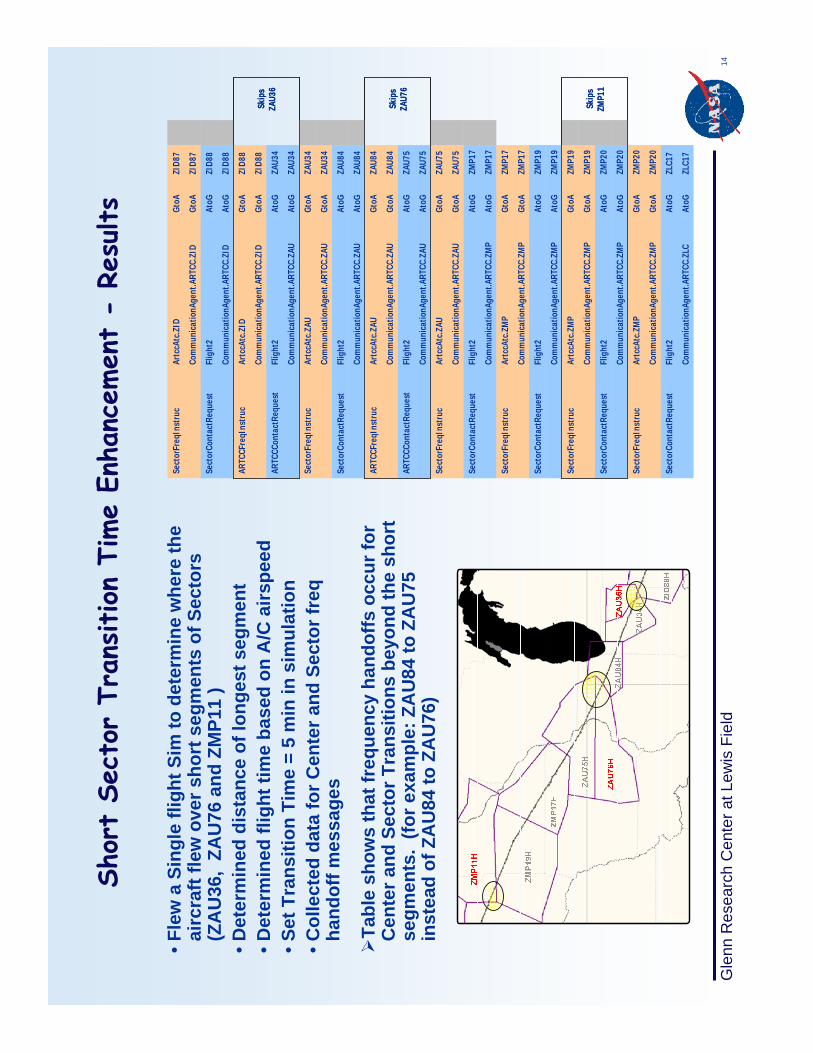
14G
lenn
Res
earc
h C
ente
r at L
ewis
Fie
ld
Shor
t Se
ctor
Tra
nsition
Time
Enha
ncem
ent
-Re
sults
•Fle
w a
Sin
gle
fligh
t Sim
to d
eter
min
e w
here
the
airc
raft
flew
ove
r sho
rt s
egm
ents
of S
ecto
rs
(ZA
U36
, ZA
U76
and
ZM
P11
)•D
eter
min
ed d
ista
nce
of lo
nges
t seg
men
t•D
eter
min
ed fl
ight
tim
e ba
sed
on A
/C a
irspe
ed•S
et T
rans
ition
Tim
e =
5 m
in in
sim
ulat
ion
•Col
lect
ed d
ata
for C
ente
r and
Sec
tor f
req
hand
off m
essa
ges
Tabl
e sh
ows
that
freq
uenc
y ha
ndof
fs o
ccur
for
Cen
ter a
nd S
ecto
r Tra
nsiti
ons
beyo
nd th
e sh
ort
segm
ents
. (fo
r exa
mpl
e: Z
AU
84 to
ZA
U75
in
stea
d of
ZA
U84
to Z
AU
76)
ZLC1
7At
oGCo
mm
unic
atio
nAge
nt.A
RTCC
.ZLC
ZLC1
7At
oGFl
ight
2Se
ctor
Cont
actR
eque
st
ZMP2
0Gt
oACo
mm
unic
atio
nAge
nt.A
RTCC
.ZM
P
ZMP2
0Gt
oAAr
tccA
tc.Z
MP
Sect
orFr
eqIn
stru
c
ZMP2
0At
oGCo
mm
unic
atio
nAge
nt.A
RTCC
.ZM
P
ZMP2
0At
oGFl
ight
2Se
ctor
Cont
actR
eque
st
ZMP1
9Gt
oACo
mm
unic
atio
nAge
nt.A
RTCC
.ZM
PSk
ips
ZMP1
1
ZMP1
9Gt
oAAr
tccA
tc.Z
MP
Sect
orFr
eqIn
stru
c
ZMP1
9At
oGCo
mm
unic
atio
nAge
nt.A
RTCC
.ZM
P
ZMP1
9At
oGFl
ight
2Se
ctor
Cont
actR
eque
st
ZMP1
7Gt
oACo
mm
unic
atio
nAge
nt.A
RTCC
.ZM
P
ZMP1
7Gt
oAAr
tccA
tc.Z
MP
Sect
orFr
eqIn
stru
c
ZMP1
7At
oGCo
mm
unic
atio
nAge
nt.A
RTCC
.ZM
P
ZMP1
7At
oGFl
ight
2Se
ctor
Cont
actR
eque
st
ZAU7
5Gt
oACo
mm
unic
atio
nAge
nt.A
RTCC
.ZAU
ZAU7
5Gt
oAAr
tccA
tc.Z
AUSe
ctor
Freq
Inst
ruc
ZAU7
5At
oGCo
mm
unic
atio
nAge
nt.A
RTCC
.ZAU
ZAU7
5At
oGFl
ight
2AR
TCCC
onta
ctRe
ques
t
ZAU8
4Gt
oACo
mm
unic
atio
nAge
nt.A
RTCC
.ZAU
Skip
s ZA
U76
ZAU8
4Gt
oAAr
tccA
tc.Z
AUAR
TCCF
reqI
nstr
uc
ZAU8
4At
oGCo
mm
unic
atio
nAge
nt.A
RTCC
.ZAU
ZAU8
4At
oGFl
ight
2Se
ctor
Cont
actR
eque
st
ZAU3
4Gt
oACo
mm
unic
atio
nAge
nt.A
RTCC
.ZAU
ZAU3
4Gt
oAAr
tccA
tc.Z
AUSe
ctor
Freq
Inst
ruc
ZAU3
4At
oGCo
mm
unic
atio
nAge
nt.A
RTCC
.ZAU
ZAU3
4At
oGFl
ight
2AR
TCCC
onta
ctRe
ques
t
ZID8
8Gt
oACo
mm
unic
atio
nAge
nt.A
RTCC
.ZID
Skip
s ZA
U36
ZID8
8Gt
oAAr
tccA
tc.Z
IDAR
TCCF
reqI
nstr
uc
ZID8
8At
oGCo
mm
unic
atio
nAge
nt.A
RTCC
.ZID
ZID8
8At
oGFl
ight
2Se
ctor
Cont
actR
eque
st
ZID8
7Gt
oACo
mm
unic
atio
nAge
nt.A
RTCC
.ZID
ZID8
7Gt
oAAr
tccA
tc.Z
IDSe
ctor
Freq
Inst
ruc
ZLC1
7At
oGCo
mm
unic
atio
nAge
nt.A
RTCC
.ZLC
ZLC1
7At
oGFl
ight
2Se
ctor
Cont
actR
eque
st
ZMP2
0Gt
oACo
mm
unic
atio
nAge
nt.A
RTCC
.ZM
P
ZMP2
0Gt
oAAr
tccA
tc.Z
MP
Sect
orFr
eqIn
stru
c
ZMP2
0At
oGCo
mm
unic
atio
nAge
nt.A
RTCC
.ZM
P
ZMP2
0At
oGFl
ight
2Se
ctor
Cont
actR
eque
st
ZMP1
9Gt
oACo
mm
unic
atio
nAge
nt.A
RTCC
.ZM
PSk
ips
ZMP1
1
ZMP1
9Gt
oAAr
tccA
tc.Z
MP
Sect
orFr
eqIn
stru
c
ZMP1
9At
oGCo
mm
unic
atio
nAge
nt.A
RTCC
.ZM
P
ZMP1
9At
oGFl
ight
2Se
ctor
Cont
actR
eque
st
ZMP1
7Gt
oACo
mm
unic
atio
nAge
nt.A
RTCC
.ZM
P
ZMP1
7Gt
oAAr
tccA
tc.Z
MP
Sect
orFr
eqIn
stru
c
ZMP1
7At
oGCo
mm
unic
atio
nAge
nt.A
RTCC
.ZM
P
ZMP1
7At
oGFl
ight
2Se
ctor
Cont
actR
eque
st
ZAU7
5Gt
oACo
mm
unic
atio
nAge
nt.A
RTCC
.ZAU
ZAU7
5Gt
oAAr
tccA
tc.Z
AUSe
ctor
Freq
Inst
ruc
ZAU7
5At
oGCo
mm
unic
atio
nAge
nt.A
RTCC
.ZAU
ZAU7
5At
oGFl
ight
2AR
TCCC
onta
ctRe
ques
t
ZAU8
4Gt
oACo
mm
unic
atio
nAge
nt.A
RTCC
.ZAU
Skip
s ZA
U76
ZAU8
4Gt
oAAr
tccA
tc.Z
AUAR
TCCF
reqI
nstr
uc
ZAU8
4At
oGCo
mm
unic
atio
nAge
nt.A
RTCC
.ZAU
ZAU8
4At
oGFl
ight
2Se
ctor
Cont
actR
eque
st
ZAU3
4Gt
oACo
mm
unic
atio
nAge
nt.A
RTCC
.ZAU
ZAU3
4Gt
oAAr
tccA
tc.Z
AUSe
ctor
Freq
Inst
ruc
ZAU3
4At
oGCo
mm
unic
atio
nAge
nt.A
RTCC
.ZAU
ZAU3
4At
oGFl
ight
2AR
TCCC
onta
ctRe
ques
t
ZID8
8Gt
oACo
mm
unic
atio
nAge
nt.A
RTCC
.ZID
Skip
s ZA
U36
ZID8
8Gt
oAAr
tccA
tc.Z
IDAR
TCCF
reqI
nstr
uc
ZID8
8At
oGCo
mm
unic
atio
nAge
nt.A
RTCC
.ZID
ZID8
8At
oGFl
ight
2Se
ctor
Cont
actR
eque
st
ZID8
7Gt
oACo
mm
unic
atio
nAge
nt.A
RTCC
.ZID
ZID8
7Gt
oAAr
tccA
tc.Z
IDSe
ctor
Freq
Inst
ruc
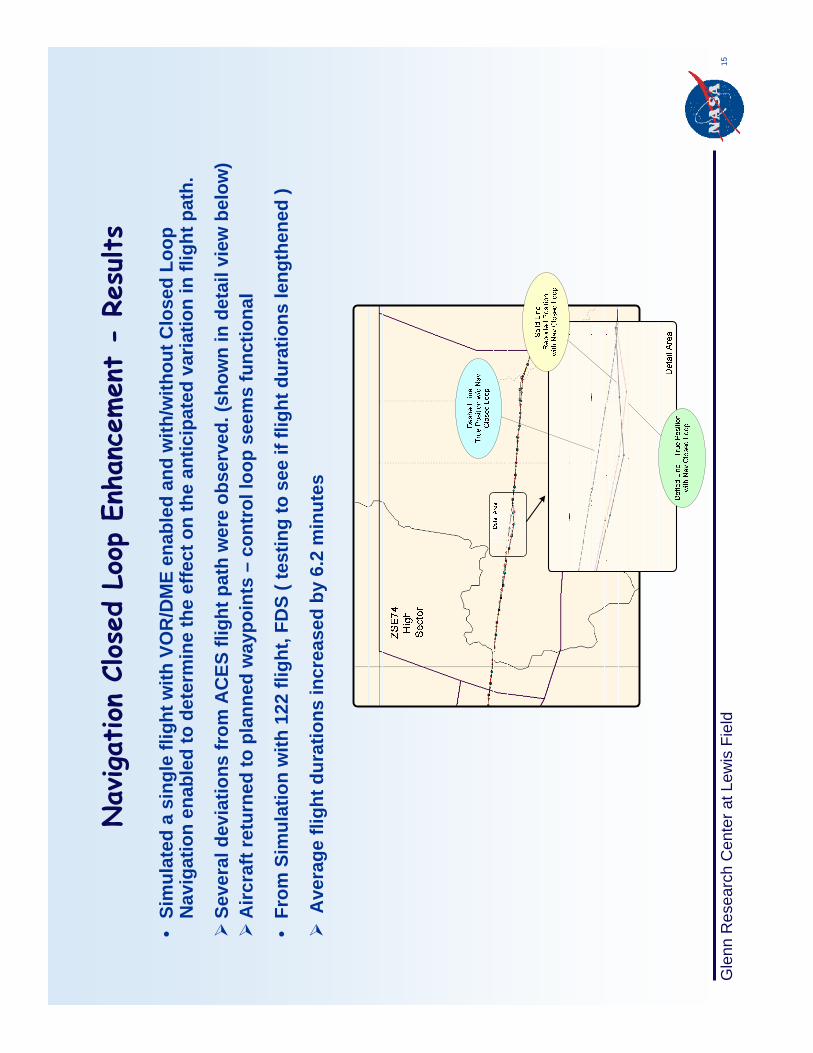
15G
lenn
Res
earc
h C
ente
r at L
ewis
Fie
ld
Nav
igat
ion
Clos
ed L
oop
Enha
ncem
ent
-Re
sults
•Si
mul
ated
a s
ingl
e fli
ght w
ith V
OR
/DM
E en
able
d an
d w
ith/w
ithou
t Clo
sed
Loop
N
avig
atio
n en
able
d to
det
erm
ine
the
effe
ct o
n th
e an
ticip
ated
var
iatio
n in
flig
ht p
ath.
Seve
ral d
evia
tions
from
AC
ES fl
ight
pat
h w
ere
obse
rved
. (sh
own
in d
etai
l vie
w b
elow
)A
ircra
ft re
turn
ed to
pla
nned
way
poin
ts –
cont
rol l
oop
seem
s fu
nctio
nal
•Fr
om S
imul
atio
n w
ith 1
22 fl
ight
, FD
S ( t
estin
g to
see
if fl
ight
dur
atio
ns le
ngth
ened
)
Ave
rage
flig
ht d
urat
ions
incr
ease
d by
6.2
min
utes
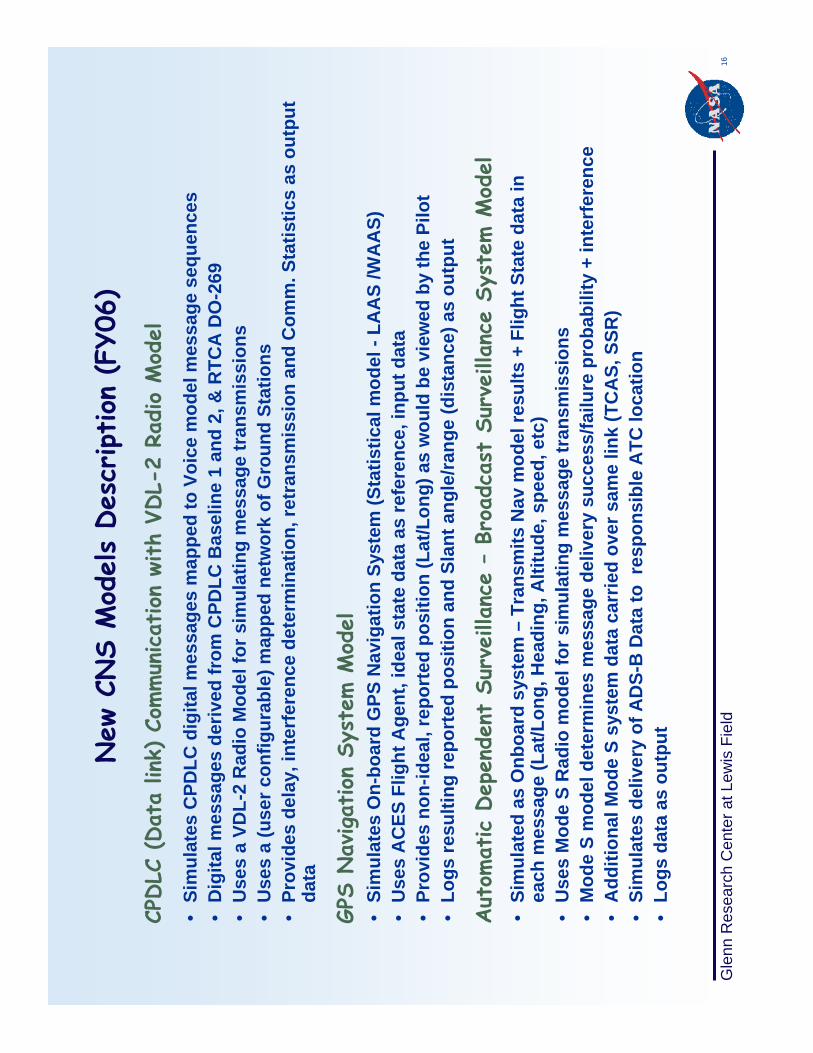
16G
lenn
Res
earc
h C
ente
r at L
ewis
Fie
ld
New
CNS
Mod
els
Des
cription
(FY
06)
CPDLC
(Dat
a lin
k) C
ommun
icat
ion
with
VDL-
2 Ra
dio
Mod
el
GPS
Nav
igat
ion
Syst
em M
odel
Aut
omat
ic D
epen
dent
Sur
veillan
ce –
Broa
dcas
t Su
rveilla
nce
Syst
em M
odel
•Si
mul
ated
as
Onb
oard
sys
tem
–Tr
ansm
its N
avm
odel
resu
lts +
Flig
ht S
tate
dat
a in
ea
ch m
essa
ge (L
at/L
ong,
Hea
ding
, Alti
tude
, spe
ed, e
tc)
•U
ses
Mod
e S
Rad
io m
odel
for s
imul
atin
g m
essa
ge tr
ansm
issi
ons
•M
ode
S m
odel
det
erm
ines
mes
sage
del
iver
y su
cces
s/fa
ilure
pro
babi
lity
+ in
terf
eren
ce•
Add
ition
al M
ode
S sy
stem
dat
a ca
rrie
d ov
er s
ame
link
(TC
AS,
SSR
)•
Sim
ulat
es d
eliv
ery
of A
DS-
B D
ata
to r
espo
nsib
le A
TC lo
catio
n•
Logs
dat
a as
out
put
•Si
mul
ates
CPD
LC d
igita
l mes
sage
s m
appe
d to
Voi
ce m
odel
mes
sage
seq
uenc
es•
Dig
ital m
essa
ges
deriv
ed fr
om C
PDLC
Bas
elin
e 1
and
2, &
RTC
A D
O-2
69•
Use
s a
VDL-
2 R
adio
Mod
el fo
r sim
ulat
ing
mes
sage
tran
smis
sion
s•
Use
s a
(use
r con
figur
able
) map
ped
netw
ork
of G
roun
d St
atio
ns•
Prov
ides
del
ay, i
nter
fere
nce
dete
rmin
atio
n, re
tran
smis
sion
and
Com
m. S
tatis
tics
as o
utpu
t da
ta
•Si
mul
ates
On-
boar
d G
PS N
avig
atio
n Sy
stem
(Sta
tistic
al m
odel
-LA
AS
/WA
AS)
•U
ses
AC
ES F
light
Age
nt, i
deal
sta
te d
ata
as re
fere
nce,
inpu
t dat
a •
Prov
ides
non
-idea
l, re
port
ed p
ositi
on (L
at/L
ong)
as
wou
ld b
e vi
ewed
by
the
Pilo
t•
Logs
resu
lting
repo
rted
pos
ition
and
Sla
nt a
ngle
/rang
e (d
ista
nce)
as
outp
ut
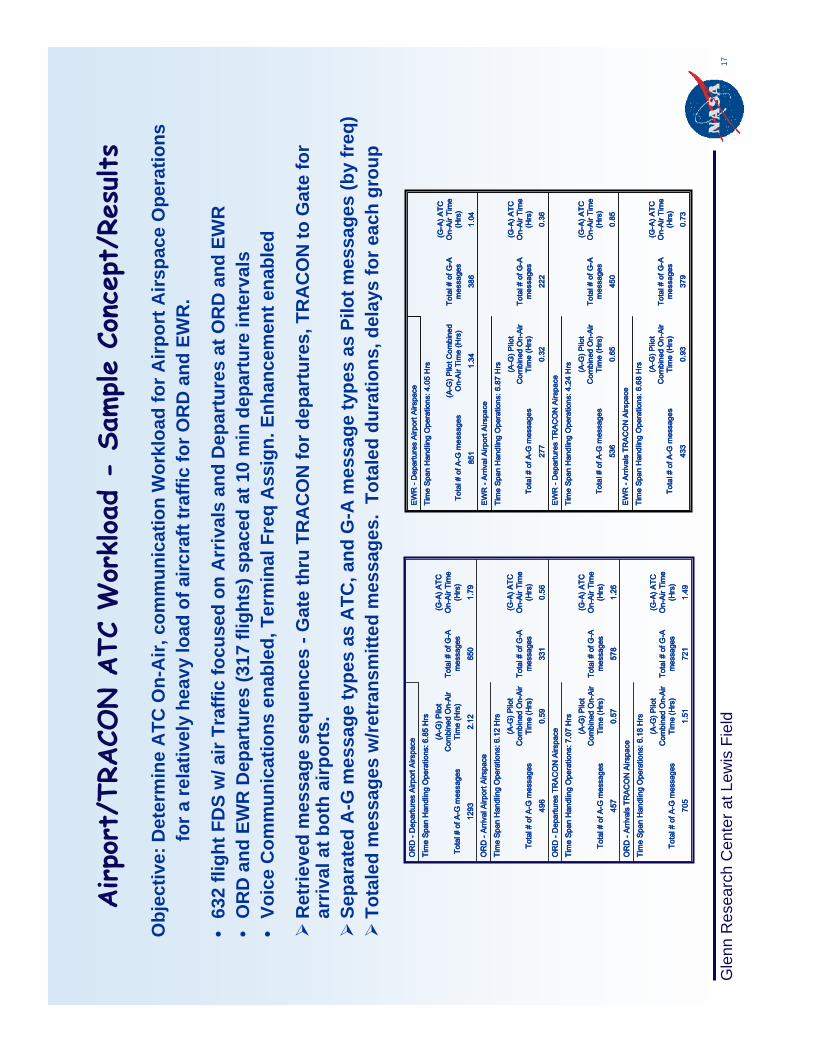
17G
lenn
Res
earc
h C
ente
r at L
ewis
Fie
ld
Airpo
rt/T
RACO
N A
TC W
orkloa
d -
Sample
Conc
ept/
Resu
lts
Obj
ectiv
e: D
eter
min
e A
TC O
n-A
ir, c
omm
unic
atio
n W
orkl
oad
for A
irpor
t Airs
pace
Ope
ratio
ns
for a
rela
tivel
y he
avy
load
of a
ircra
ft tr
affic
for O
RD
and
EW
R.
•63
2 fli
ght F
DS
w/ a
ir Tr
affic
focu
sed
on A
rriv
als
and
Dep
artu
res
at O
RD
and
EW
R•
OR
D a
nd E
WR
Dep
artu
res
(317
flig
hts)
spa
ced
at 1
0 m
in d
epar
ture
inte
rval
s•
Voic
e C
omm
unic
atio
ns e
nabl
ed, T
erm
inal
Fre
q A
ssig
n. E
nhan
cem
ent e
nabl
ed
Ret
rieve
d m
essa
ge s
eque
nces
-G
ate
thru
TR
AC
ON
for d
epar
ture
s, T
RA
CO
N to
Gat
e fo
r ar
rival
at b
oth
airp
orts
. Se
para
ted
A-G
mes
sage
type
s as
ATC
, and
G-A
mes
sage
type
s as
Pilo
t mes
sage
s (b
y fr
eq)
Tota
led
mes
sage
s w
/retr
ansm
itted
mes
sage
s. T
otal
ed d
urat
ions
, del
ays
for e
ach
grou
p
1.49
721
1.51
705
(G-A
) ATC
O
n-Ai
r Tim
e (H
rs)
Tota
l # o
f G-A
m
essa
ges
(A-G
) Pilo
t C
ombi
ned
On-
Air
Tim
e (H
rs)
Tota
l # o
f A-G
mes
sage
s
Tim
e Sp
an H
andl
ing
Ope
ratio
ns: 6
.18
Hrs
OR
D -
Arriv
als
TRAC
ON
Airs
pace
1.26
578
0.57
457
(G-A
) ATC
O
n-Ai
r Tim
e (H
rs)
Tota
l # o
f G-A
m
essa
ges
(A-G
) Pilo
t C
ombi
ned
On-
Air
Tim
e (H
rs)
Tota
l # o
f A-G
mes
sage
s
Tim
e Sp
an H
andl
ing
Ope
ratio
ns: 7
.07
Hrs
OR
D -
Dep
artu
res
TRAC
ON
Airs
pace
0.56
331
0.59
496
(G-A
) ATC
O
n-Ai
r Tim
e (H
rs)
Tota
l # o
f G-A
m
essa
ges
(A-G
) Pilo
t C
ombi
ned
On-
Air
Tim
e (H
rs)
Tota
l # o
f A-G
mes
sage
s
Tim
e Sp
an H
andl
ing
Ope
ratio
ns: 6
.12
Hrs
OR
D -
Arriv
al A
irpor
t Airs
pace
1.79
650
2.12
1293
(G-A
) ATC
O
n-Ai
r Tim
e (H
rs)
Tota
l # o
f G-A
m
essa
ges
(A-G
) Pilo
t C
ombi
ned
On-
Air
Tim
e (H
rs)
Tota
l # o
f A-G
mes
sage
s
Tim
e Sp
an H
andl
ing
Ope
ratio
ns: 6
.85
Hrs
OR
D -
Dep
artu
res
Airp
ort A
irspa
ce
0.73
379
0.93
433
(G-A
) ATC
On-
Air T
ime
(Hrs
)To
tal #
of G
-A
mes
sage
s
(A-G
) Pilo
t C
ombi
ned
On-
Air
Tim
e (H
rs)
Tota
l # o
f A-G
mes
sage
s
Tim
e Sp
an H
andl
ing
Ope
ratio
ns: 6
.68
Hrs
EWR
-Ar
rival
s TR
ACO
N A
irspa
ce
0.85
450
0.65
536
(G- A
) ATC
On-
Air T
ime
(Hrs
)To
tal #
of G
-A
mes
sage
s
(A-G
) Pilo
t C
ombi
ned
On-
Air
Tim
e (H
rs)
Tota
l # o
f A-G
mes
sage
s
Tim
e Sp
an H
andl
ing
Ope
ratio
ns: 4
.24
Hrs
EWR
-D
epar
ture
s TR
ACO
N A
irspa
ce
0.36
222
0.32
277
(G- A
) ATC
On-
Air T
ime
(Hrs
)To
tal #
of G
-A
mes
sage
s
(A-G
) Pilo
t C
ombi
ned
On-
Air
Tim
e (H
rs)
Tota
l # o
f A-G
mes
sage
s
Tim
e Sp
an H
andl
ing
Ope
ratio
ns: 6
.87
Hrs
EWR
-Ar
rival
Airp
ort A
irspa
ce
1.04
386
1.34
851
(G- A
) ATC
On-
Air T
ime
(Hrs
)To
tal #
of G
-A
mes
sage
s(A
-G) P
ilot C
ombi
ned
On-
Air T
ime
(Hrs
)To
tal #
of A
-G m
essa
ges
Tim
e Sp
an H
andl
ing
Ope
ratio
ns: 4
.05
Hrs
EWR
-D
epar
ture
s Ai
rpor
t Airs
pace

18G
lenn
Res
earc
h C
ente
r at L
ewis
Fie
ld
Airpo
rt/T
RACO
N A
TC W
orkloa
d -
Sample
Conc
ept
Resu
lts
Incr
ease
d th
e FD
S ai
r tra
ffic
by d
oubl
ing
the
num
ber o
f Dep
artin
g fli
ghts
from
OR
D a
nd
EWR
to e
valu
ate
the
effe
ct o
n co
mm
unic
atio
n m
essa
ge In
terf
eren
cean
d St
ep-o
n oc
curr
ence
s. (
929
fligh
ts )
•Se
t the
dep
artu
re ti
mes
to 5
min
spa
cing
for a
ll fli
ghts
dep
artin
g O
RD
and
EW
R
Rec
orde
d th
e nu
mbe
r of C
onge
stio
n (In
terf
eren
ce) E
rror
s, S
tep-
on E
rror
s an
d Ex
pire
d Tr
ansm
issi
ons
(I.e.
mes
sage
s ne
ver s
ent)
Com
pare
d da
ta fo
r 632
and
929
flig
ht s
imul
atio
n
5627
C90
1010
KOR
D
155
N90
NY
44
KEW
RTr
ansm
issi
on
Expi
red
920
470
C90
432
362
KOR
D
246
126
N90
NY
200
130
KEW
RSt
ep-O
n
1969
1340
C90
299
209
KOR
D
1000
297
N90
NY
316
89KE
WR
Con
gest
ion
929
Flig
ht
Sim
ulat
ion
632
Flig
ht
Sim
ulat
ion
Airs
pace
Mes
sage
Fai
led
Due
to
:
5627
C90
1010
KOR
D
155
N90
NY
44
KEW
RTr
ansm
issi
on
Expi
red
920
470
C90
432
362
KOR
D
246
126
N90
NY
200
130
KEW
RSt
ep-O
n
1969
1340
C90
299
209
KOR
D
1000
297
N90
NY
316
89KE
WR
Con
gest
ion
929
Flig
ht
Sim
ulat
ion
632
Flig
ht
Sim
ulat
ion
Airs
pace
Mes
sage
Fai
led
Due
to
:
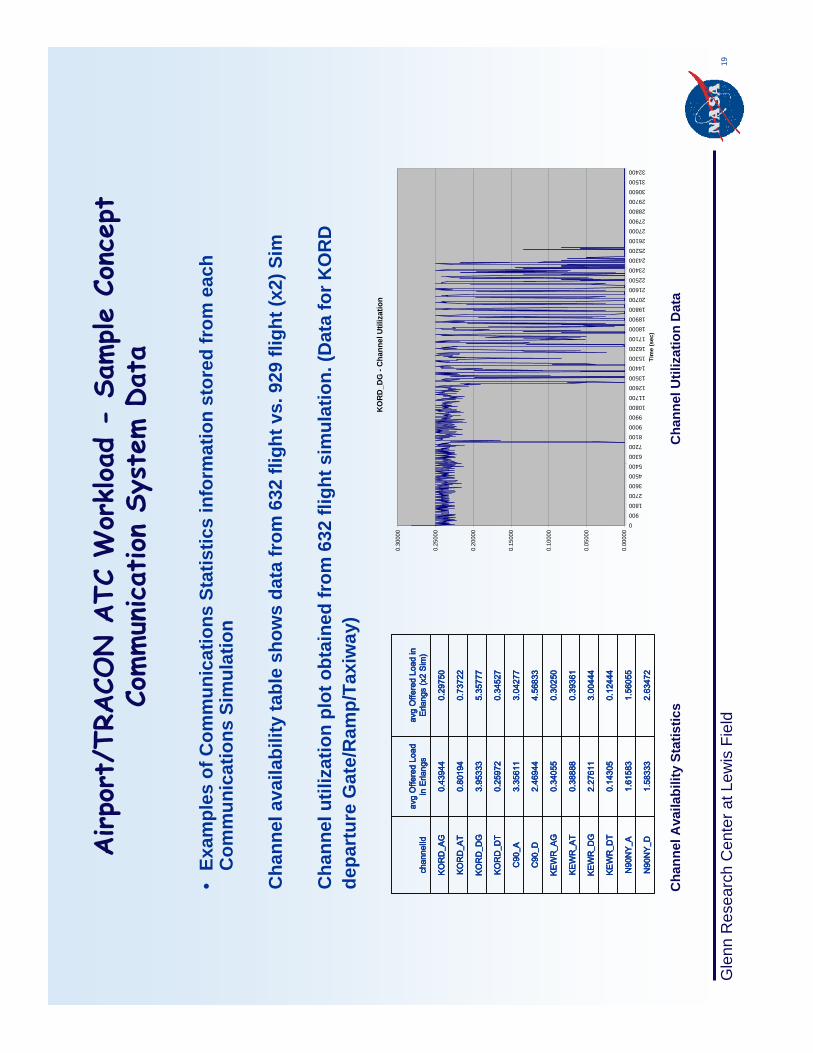
19G
lenn
Res
earc
h C
ente
r at L
ewis
Fie
ld
Airpo
rt/T
RACO
N A
TC W
orkloa
d -
Sample
Conc
ept
Commun
icat
ion
Syst
em D
ata
•Ex
ampl
es o
f Com
mun
icat
ions
Sta
tistic
s in
form
atio
n st
ored
from
eac
h C
omm
unic
atio
ns S
imul
atio
n
Cha
nnel
ava
ilabi
lity
tabl
e sh
ows
data
from
632
flig
ht v
s. 9
29 fl
ight
(x2)
Sim
Cha
nnel
util
izat
ion
plot
obt
aine
d fr
om 6
32 fl
ight
sim
ulat
ion.
(Dat
a fo
r KO
RD
de
part
ure
Gat
e/R
amp/
Taxi
way
)
2.63
472
1.58
333
N90
NY_
D
1.56
055
1.61
583
N90
NY_
A
0.12
444
0.14
305
KEW
R_D
T
3.00
444
2.27
611
KEW
R_D
G
0.39
361
0.38
888
KEW
R_A
T
0.30
250
0.34
055
KEW
R_A
G
4.56
833
2.46
944
C90
_D
3.04
277
3.35
611
C90
_A
0.34
527
0.25
972
KOR
D_D
T
5.35
777
3.95
333
KOR
D_D
G
0.73
722
0.80
194
KOR
D_A
T
0.29
750
0.43
944
KOR
D_A
G
avg
Offe
red
Load
in
Erla
ngs
(x2
Sim
)av
gO
ffere
d Lo
ad
in E
rlang
sch
anne
lId
KO
RD
_DG
- C
hann
el U
tiliz
atio
n
0.00
000
0.05
000
0.10
000
0.15
000
0.20
000
0.25
000
0.30
000
0900
1800270036004500540063007200810090009900
1080011700
126001350014400153001620017100
180001890019800207002160022500
234002430025200261002700027900
2880029700306003150032400
Tim
e (s
ec)
Cha
nnel
Ava
ilabi
lity
Stat
istic
sC
hann
el U
tiliz
atio
n D
ata
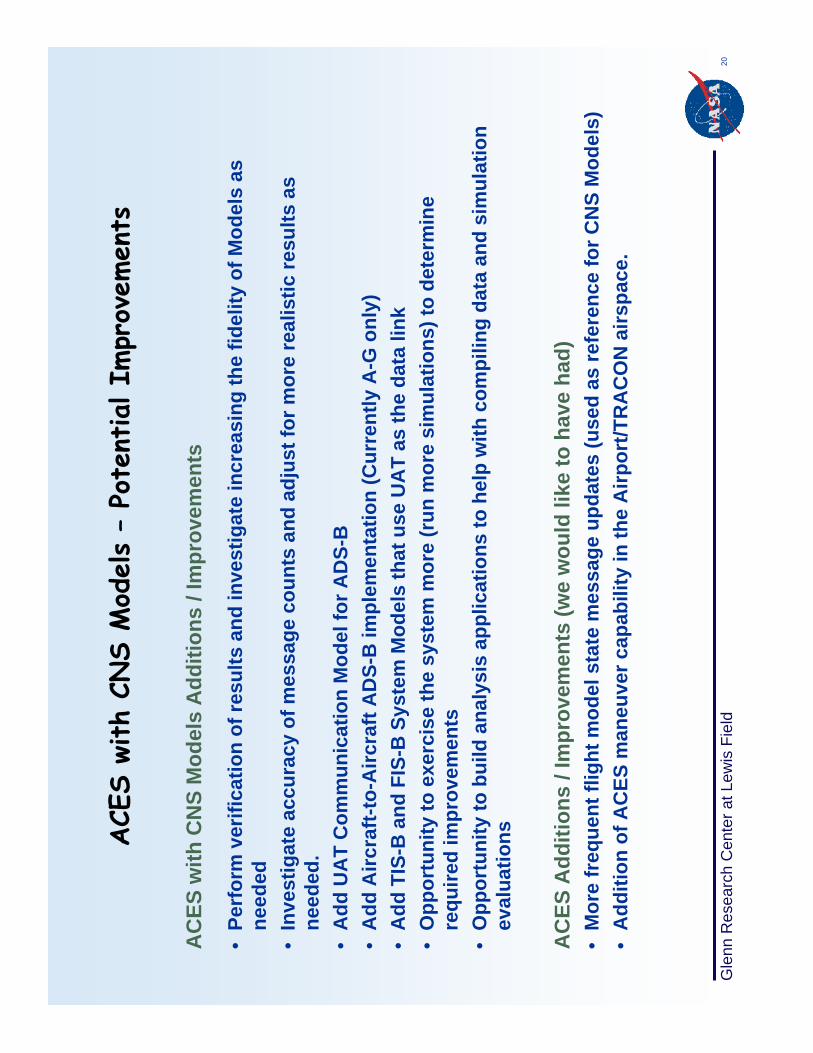
20G
lenn
Res
earc
h C
ente
r at L
ewis
Fie
ld
ACE
S wi
th C
NS
Mod
els
–Po
tent
ial Im
prov
emen
ts
AC
ES w
ith C
NS
Mod
els
Add
ition
s / I
mpr
ovem
ents
•Pe
rfor
m v
erifi
catio
n of
resu
lts a
nd in
vest
igat
e in
crea
sing
the
fidel
ity o
f Mod
els
as
need
ed•
Inve
stig
ate
accu
racy
of m
essa
ge c
ount
s an
d ad
just
for m
ore
real
istic
resu
lts a
s ne
eded
.•
Add
UA
T C
omm
unic
atio
n M
odel
for A
DS-
B•
Add
Airc
raft-
to-A
ircra
ft A
DS-
B im
plem
enta
tion
(Cur
rent
ly A
-G o
nly)
•A
dd T
IS-B
and
FIS
-B S
yste
m M
odel
s th
at u
se U
AT
as th
e da
ta li
nk•
Opp
ortu
nity
to e
xerc
ise
the
syst
em m
ore
(run
mor
e si
mul
atio
ns) t
o de
term
ine
requ
ired
impr
ovem
ents
•O
ppor
tuni
ty to
bui
ld a
naly
sis
appl
icat
ions
to h
elp
with
com
pilin
g da
ta a
nd s
imul
atio
n ev
alua
tions
AC
ES A
dditi
ons
/ Im
prov
emen
ts (w
e w
ould
like
to h
ave
had)
•M
ore
freq
uent
flig
ht m
odel
sta
te m
essa
ge u
pdat
es (u
sed
as re
fere
nce
for C
NS
Mod
els)
•A
dditi
on o
f AC
ES m
aneu
ver c
apab
ility
in th
e A
irpor
t/TR
AC
ON
airs
pace
.

21G
lenn
Res
earc
h C
ente
r at L
ewis
Fie
ld
ACE
S wi
th C
NS
Mod
els
–Su
mmar
y
AC
ES w
ith C
NS
Mod
els
offe
rs a
wid
e ar
ray
of e
xper
imen
tatio
n po
ssib
ilitie
s
Prov
ides
an
Opp
ortu
nity
to in
vest
igat
e N
AS
CN
S in
fras
truc
ture
ope
ratio
ns
or C
NS
tech
nolo
gy c
ompa
rison
s in
a p
rove
n N
AS
sim
ulat
ion
envi
ronm
ent
(AC
ES)
Con
cept
stu
dies
cou
ld s
imul
tane
ousl
y ob
tain
resu
lts d
irect
ed a
t CN
S sy
stem
issu
es th
at c
ould
det
erm
ine
succ
ess
or fa
ilure
of a
con
cept
s im
plem
enta
tion.