air.sfsu
DESCRIPTION
San Francisco State University Office of Academic Institutional Research Student Success & Graduation Initiative Milestone Study. air.sfsu.edu. FTF 6 Yr. Graduation Rates Comparison. 66.2 % San Diego State 55% U.S. average 52.4% CSU average 48% SJSU 48% SFSU - PowerPoint PPT PresentationTRANSCRIPT

air.sfsu.edu
San Francisco State UniversityOffice of Academic Institutional Research
Student Success & Graduation Initiative Milestone Study
2
2001 2002 2003 2004 2005 2006 2007 2008 2009 2010 2011 2012 2013 2014 201520.0%
25.0%
30.0%
35.0%
40.0%
45.0%
50.0%
55.0%
60.0%
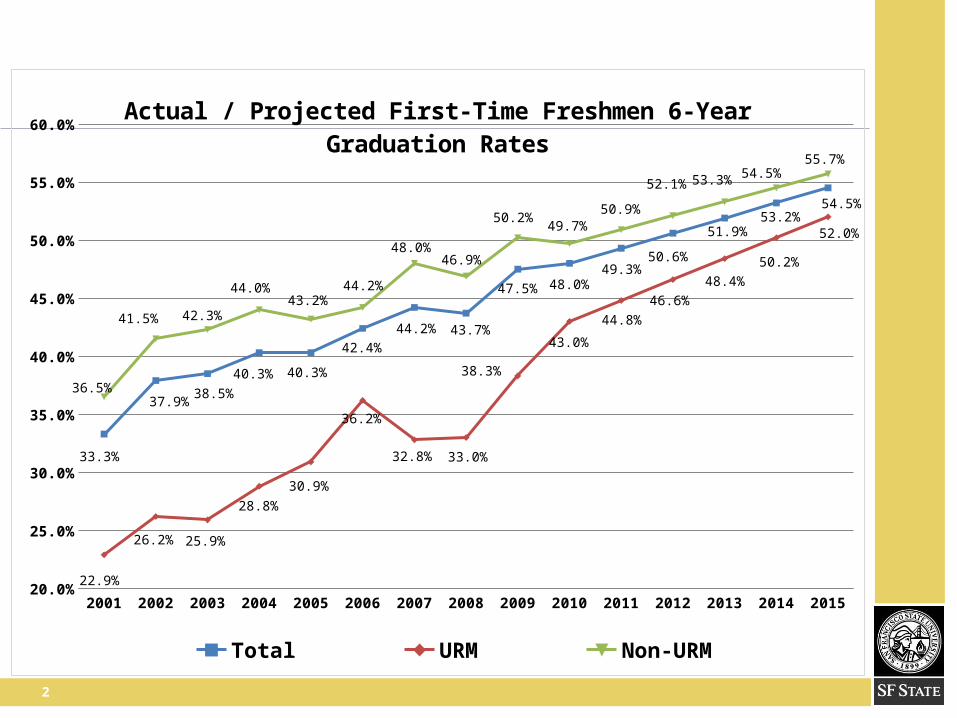
33.3%
37.9%38.5%
40.3% 40.3%
42.4%44.2% 43.7%
47.5% 48.0%49.3%
50.6%
51.9%53.2%
54.5%
22.9%
26.2% 25.9%
28.8%30.9%
36.2%
32.8% 33.0%
38.3%
43.0%
44.8%46.6%
48.4%50.2%
52.0%
36.5%
41.5% 42.3%
44.0%43.2%
44.2%
48.0%46.9%
50.2%49.7%
50.9%
52.1% 53.3% 54.5%55.7%
Actual / Projected First-Time Freshmen 6-Year Graduation Rates
Total URM Non-URM

3
1999 2000 2001 2002 2003 2004 2005 2006 2007 2008 2009 2010 2011 2012 2013 2014 201535.0%
40.0%
45.0%
50.0%
55.0%
60.0%
65.0%
70.0%
75.0%
80.0%
50.7%
53.0%
55.7% 56.2%
59.2%
61.4%62.3% 62.1%
65.9%
69.1% 69.0%68.8%
70.1%71.4%
72.7%74.0%
75.3%
41.6%
47.1%
47.1%
50.7%
45.5%
53.0%
55.8%56.8%
63.5%60.8%
65.4%
62.7%64.6%
66.5%68.4%
70.3%72.2%
53.0% 54.5%
57.9% 57.6%
62.2%63.7%
63.8% 63.4%
66.5%
71.2%69.9%
70.5%71.6% 72.7%
73.8%74.9%
76.0%
Actual / Projected Transfer 4-Year Graduation Rates
Total URM Non-URM
4
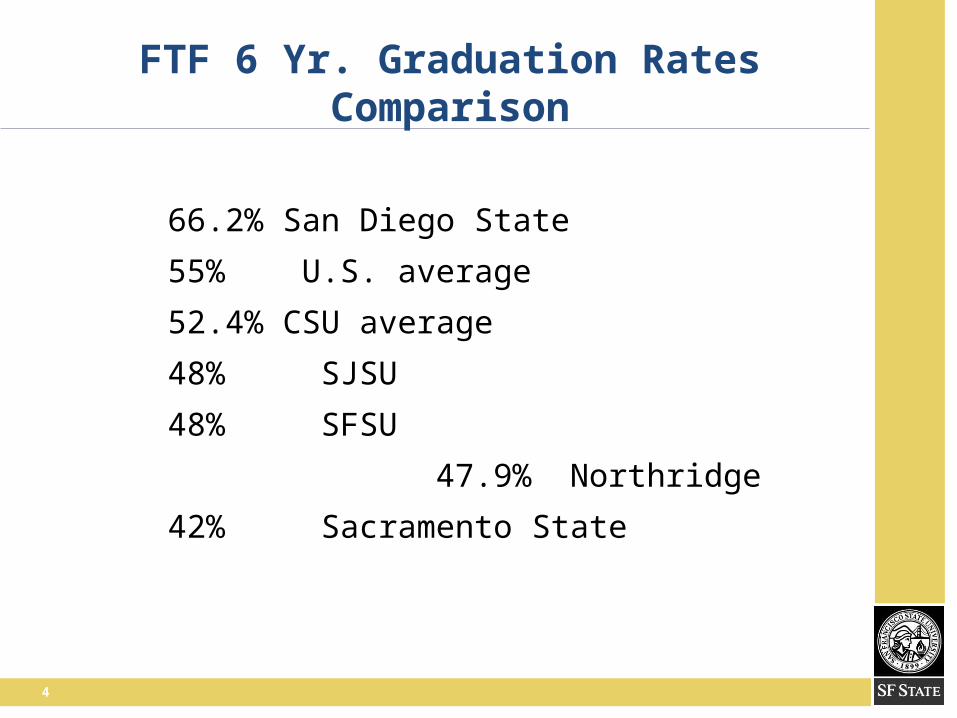
FTF 6 Yr. Graduation Rates Comparison
66.2% San Diego State
55% U.S. average
52.4% CSU average
48% SJSU
48% SFSU
47.9% Northridge
42% Sacramento State
5
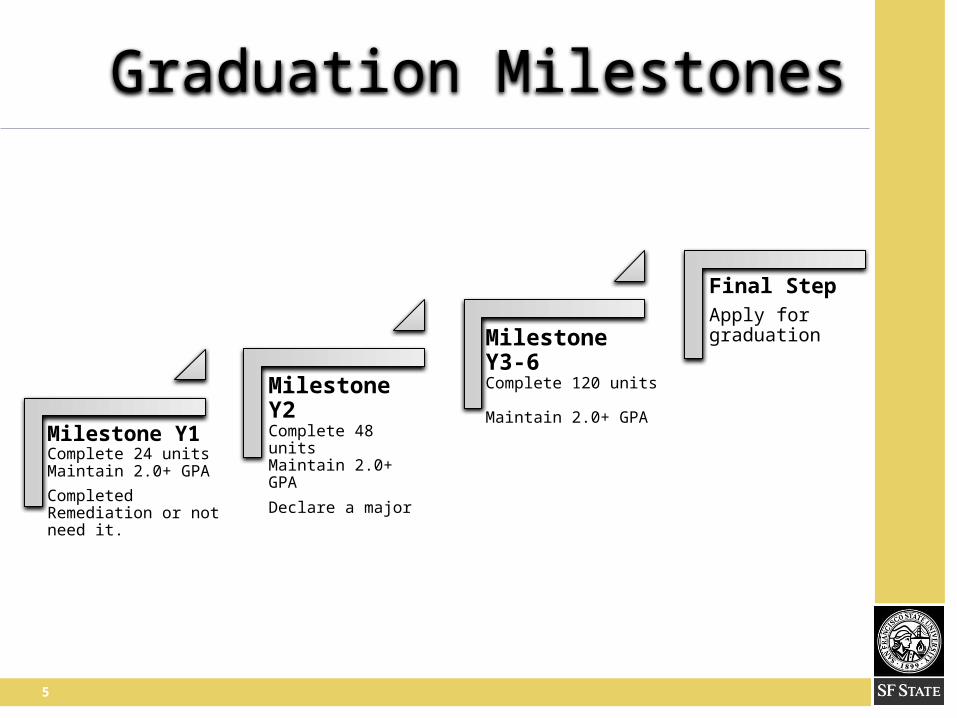
Milestone Y1 Complete 24 units Maintain 2.0+ GPA
Completed Remediation or not need it.
Milestone Y2 Complete 48 units Maintain 2.0+ GPA
Declare a major
Milestone Y3-6Complete 120 units Maintain 2.0+ GPA
Final StepApply for graduation
Graduation Milestones

6
1st term
Entry Cohort = 4,032
• Need remediation = 61.1%• Avg. GPA end of term = 2.8
Avg. Total units = 11.3• Good standing = 85%
2nd term = 3,769
• Cum. Retention % = 93.5%
• Avg. GPA end of term = 2.8Avg. Total units = 23.3
• Good standing = 87%
1st Year Milestone
• Met Y1 milestone = 53%
• 24 units = 54%• 24 units & GPA>2.0 = 53%• Completed remediation =
85%
3rdterm = 3,046
• Cum. Retention %= 75%• Avg. GPA end of term =
2.9 Avg. Total units = 37.9
• Good standing = 93.6%
4th term = 2,911
• Cum. Retention %= 72%• Avg. GPA end of term =
2.93Avg. Total units = 51.1
• Good standing = 94.6 %
2nd Year Milestone
• Met Y2 milestone = 50%
• Completed 48 units = 50%• Declared a major = 83%
FTF Performance - Fall 2009 Cohort

7
3rd term = 2,724
• Cum. Retention %= 86%• Avg. GPA end of term = 3.0
Avg. Total units = 37.2 • Good standing = 92%
4th term = 2,526
• Cum. Retention %= 79%• Avg. GPA end of term = 3.1
Avg. Total units = 49.1• Good standing = 95%
Graduated
• % Graduated = 26%
UDT Performance - Fall 2009 Cohort
1st term
Entry Cohort = 3,178
• Avg. GPA end of term = 2.9 Avg. Total units = 11
• Good standing = 87%
2nd term = 2,967
• Cum. Retention % = 93.3%• Avg. GPA end of term = 2.9
Avg. Total units = 23• Good standing = 89%

8
San Francisco State UniversityEnrolled First-Time Freshmen By EthnicityUnderrepresented Minority (URM) compared to Non-URM
73.9%
26.1%
URM Non-URM
30.7%
69.3%
Fall 2005 Fall 2010

9
San Francisco State UniversityEnrolled Transfers By EthnicityUnderrepresented Minority (URM) compared to Non-URM
30.7%
69.3%
21.5%
78.5%
URM Non-URM
26.5%
73.5%
Fall 2005 Fall 2010

10
2009 FTF Y1 Milestone Completion FactorsMilestone Not Completed by Gender
Unit<24 GPA<2.0 Remediation Not Completed Milestone Not Completed0.0%
5.0%
10.0%
15.0%
20.0%
25.0%
30.0%
35.0%
40.0%
45.0%
50.0%
38.2%
9.0%9.9%
43.1%
38.9%
15.5%
8.1%
42.8%
Female Male
11
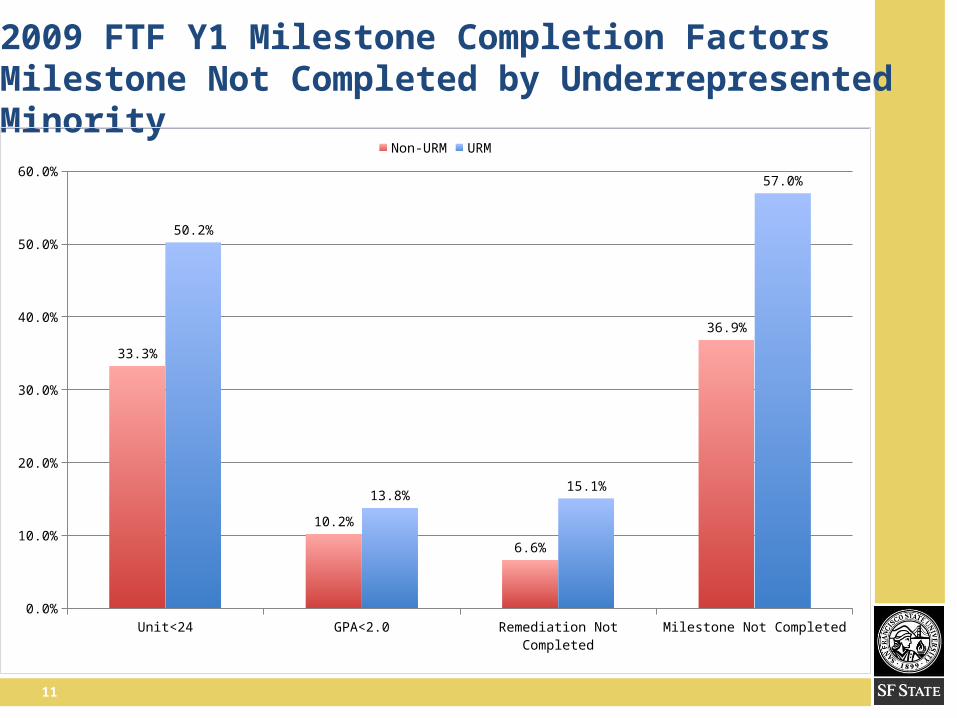
2009 FTF Y1 Milestone Completion Factors Milestone Not Completed by Underrepresented Minority
Unit<24 GPA<2.0 Remediation Not Completed Milestone Not Completed0.0%
10.0%
20.0%
30.0%
40.0%
50.0%
60.0%
33.3%
10.2%
6.6%
36.9%
50.2%
13.8%15.1%
57.0%
Non-URM URM

12
2009 FTF Y1 Milestone Completion FactorsMilestone Not Completed by First-Generation
Unit<24 GPA<2.0 Remediation Not Completed Milestone Not Completed0.0%
10.0%
20.0%
30.0%
40.0%
50.0%
60.0%
35.7%
10.1%8.1%
40.0%
49.0%
16.1%
13.3%
54.4%
Non-First Generation First Generation

13
2009 FTF Y1 Milestone Completion FactorsMilestone Not Completed by PELL-Eligibility
Unit<24 GPA<2.0 Remediation Not Completed Milestone Not Completed0.0%
10.0%
20.0%
30.0%
40.0%
50.0%
60.0%
33.7%
9.7%8.0%
38.7%
49.2%
15.0%
11.9%
52.5%
PELL-Not-Eligible PELL-Eligible

14
2004 2005 2006 2007 2008 2009 2010
Continuation Term 2 93.6% 92.9% 93.1% 92.7% 93.7% 93.5% 94.4%
Continuation Term 3 79.3% 76.3% 75.6% 74.1% 74.1% 75.5% 80.6%
Continuation Term 4 75.6% 72.4% 71.7% 70.7% 70.9% 72.2% #FMT
Continuation Term 5 66.8% 63.3% 62.5% 59.4% 61.8% 63.7% #FMT
52.5%
57.5%
62.5%
67.5%
72.5%
77.5%
82.5%
87.5%
92.5%
97.5%
93.6% 92.9% 93.1% 92.7%93.7% 93.5% 94.4%
79.3%
76.3% 75.6%74.1% 74.1%
75.5%
80.6%
75.6%
72.4% 71.7% 70.7% 70.9%72.2%
66.8%
63.3% 62.5%
59.4%
61.8%63.7%
First Time Freshmen 5 term Continuation Rate Fall 2004 - Fall 2010

15
2004 2005 2006 2007 2008 2009 2010 2011
% URM of all FTF cohort 25.1% 25.4% 25.7% 25.9% 27.5% 30.6% 31.2% 34.1%
% Pell of all FTF 28.2% 26.9% 26.1% 27.5% 27.4% 30.9% 38.5% 43.5%
% 1st Gen of all FTF 21.0% 21.3% 19.1% 20.0% 19.2% 21.3% 23.9% 28.2%
% one or more risk factor 48.1% 48.1% 46.3% 47.8% 47.8% 51.7% 56.9% 62.8%
15.0%
25.0%
35.0%
45.0%
55.0%
65.0%
25.1% 25.4% 25.7% 25.9%27.5%
30.6% 31.2%34.1%
28.2%26.9% 26.1%
27.5% 27.4%
30.9%
38.5%
43.5%
21.0% 21.3%19.1% 20.0% 19.2%
21.3%23.9%
28.2%
48.1% 48.1%46.3%
47.8% 47.8%
51.7%
56.9%
62.8%
First Time Freshman Risk Factor Trend Fall 2004 - Fall 2011

16
2004 2005 2006 2007 2008 2009 2010 2011
% URM + Pell 10.4% 9.7% 10.1% 10.5% 11.4% 14.0% 16.8% 20.1%
% URM + 1st Gen 7.4% 8.3% 7.6% 8.3% 8.7% 11.0% 11.2% 14.2%
% Pell + 1st Gen 13.3% 12.7% 11.6% 11.7% 11.7% 13.5% 16.9% 19.6%
% URM + Pell + 1st Gen 5.0% 5.2% 4.7% 4.9% 5.4% 7.5% 8.2% 11.0%
2.5%
7.5%
12.5%
17.5%
10.4%9.7% 10.1%
10.5%11.4%
14.0%
16.8%
20.1%
7.4%8.3%
7.6%8.3% 8.7%
11.0% 11.2%
14.2%13.3%
12.7%
11.6% 11.7% 11.7%
13.5%
16.9%
19.6%
5.0% 5.2%4.7% 4.9%
5.4%
7.5%8.2%
11.0%
First Time Freshmen one or more risk factors trends Fall 2004 - Fall 2011

17
FTF Risk Factors Venn Diagram
Fall 2004 Fall 2011

18
Students Value Faculty and Staff
“Great classes. My professors are so knowledgeable.”
“Even with the budget cuts, I feel the staff is making a HUGE effort to make students’ experience and education the most important factor in their decision making. Thank you!
“I am having a really good experience, my instructors are terrific…”

19
Action Plan for the Year
• Beyond 12
• New comparison groups experiencing HIPs