airs on-orbit cryocooler system performance...airs on-orbit cryocooler system performance jose i....
TRANSCRIPT

AIRS On-Orbit Cryocooler System Performance Jose I. Rodriguez* and Ronald G. Ross, Jr.
Jet Propulsion Laboratory, California Institute of Technology 4800 Oak Grove Drive, Pasadena, CA 91 109
ABSTRACT
The Atmospheric Infrared Sounder (AIRS) is one instrument in a suite of six instruments currently flying onboard NASA’s Earth Observing System (EOS) Aqua spacecraft. NASA’s Aqua spacecraft was launched successfully on May 4, 2002 from Vandenberg Air Force Base in Califomia. AIRS is a cryogenic instrument developed under a Jet Propulsion Laboratory contract by BAe Systems, formerly Lockheed Martin Infrared Imaging Systems, for NASA. AIRS will provide new and more accurate data about the atmosphere, land and oceans, which provides a powerful new tool for climate studies and enables the advancement of whether prediction models. AIRS observations will permit the measurement of the atmospheric temperature with an accuracy of 1 K in 1 km thick-layers in the troposphere and surface temperatures with an accuracy of 0.5 K.
The Aqua spacecraft was placed in a sun-synchronous near-circular polar orbit with an inclination of 98.2 degrees, mean altitude of 705 km, 98.72 minute orbit period and 1:30 pm ascending node. The nominal on-orbit mission lifetime for the instrument is 6 years. AIRS measurements are based on passive infrared remote sensing using a precisely calibrated, high spectral resolution grating spectrometer with an infrared coverage from 3.7 to 15.4 pm. To achieve this high performance over this broad wavelength range, the spectrometer is cooled to 155 K and the Mercury Cadmium Telluride (HgCdTe) focal plane is cooled to 58 K. The detectors are cooled by a pair of long-life, low vibration, pulse tube mechanical coolers to 58 K and a two-stage passive cooler with a deployable Earth shield provides cooling for the spectrometer to achieve a stable temperature near 155 K. This paper provides a general overview of the cryogenic system design and presents its on-orbit performance for the first year of operation.
.
Keywords: AIRS, EOS, Aqua, cryocoolers, pulse tube, contamination, cryodeposit, MLI, remote sensing, spectrometer
1. INTRODUCTION
The objective of the Atmospheric Infrared Sounder (AIRS) instrument is to provide both new and more accurate data about the atmosphere, land and oceans for application to climate studies and weather prediction. This will enable improved weather forecasting capability and a better understanding of Earth processes affecting global climate change. To meet these challenges, AIRS measurements are based on very sensitive passive infrared remote sensing using a precisely calibrated, high spectral resolution grating spectrometer operating in the 3.7 to 15.4 pm region. The high performance required over this broad wavelength range is achieved by operating the spectrometer at 155 K using a two- stage passive cooler and cooling the HgCdTe focal plane to 58 K using a long-life pulse tube cryocooler. The instrument waste heat is removed by means of the spacecraft-provided heat rejection system (HRS), which utilizes variable conductance heat pipes and space-viewing cold radiators.
The instrument successfully underwent instrument-level thermal vacuum/ balance performance testing at BAe Systems and after integration to the EOS Aqua spacecraft underwent spacecraft-level thermal vacuum/ balance testing at Northrop G r u ” a n Space Technology (NGST), formerly TRW. The spacecraft-level test was conducted over a 45-day period beginning August 25, 2001. This was a major test wherein all instrument systems were checked out end-to-end, the remaining cryo-thermal issues were addressed, and the thermal models were correlated with thermal balance test data. AIRS testing focused on four key cryo-thermal issues: (1) verification of spacecraft-provided heat rejection system (HRS) performance, (2) verification of scan head operating temperatures predictions, (3) verification of spectrometer operating temperature range and stability as well as its choke-point heater control authority with the Earth shield
*Correspondence: email: jose.i.rodrigue~(~iDl.nasa.gov Telephone: (818)354-0799; Fax: (818)393-4206

deployed, and (4) verification of the integrity of cryocoolers and focal plane Dewar assembly. All remaining cryo-thermal issues were successfully resolved during the test or after carefully reviewing the test data. The thermal vacuum/ balance test report is documented in Ref. 1 .
The EOS Aqua spacecraft carrying AIRS was successfully launch on May 4, 2002 at 2:55 a.m. PDT aboard a Delta I1 vehicle from the Western Test Range of Vandenberg Air Force Base in California and achieved its operational orbit two weeks later. An artist's rendition of the EOS Aqua spacecraft on orbit is shown in Fig. 1 and the spacecraft configuration is shown in Fig. 2. The AIRS instrument was powered on May 6, 2002 and remains operational to date.
2. INSTRUMENT CRYO-THERMAL SYSTEM DESIGN
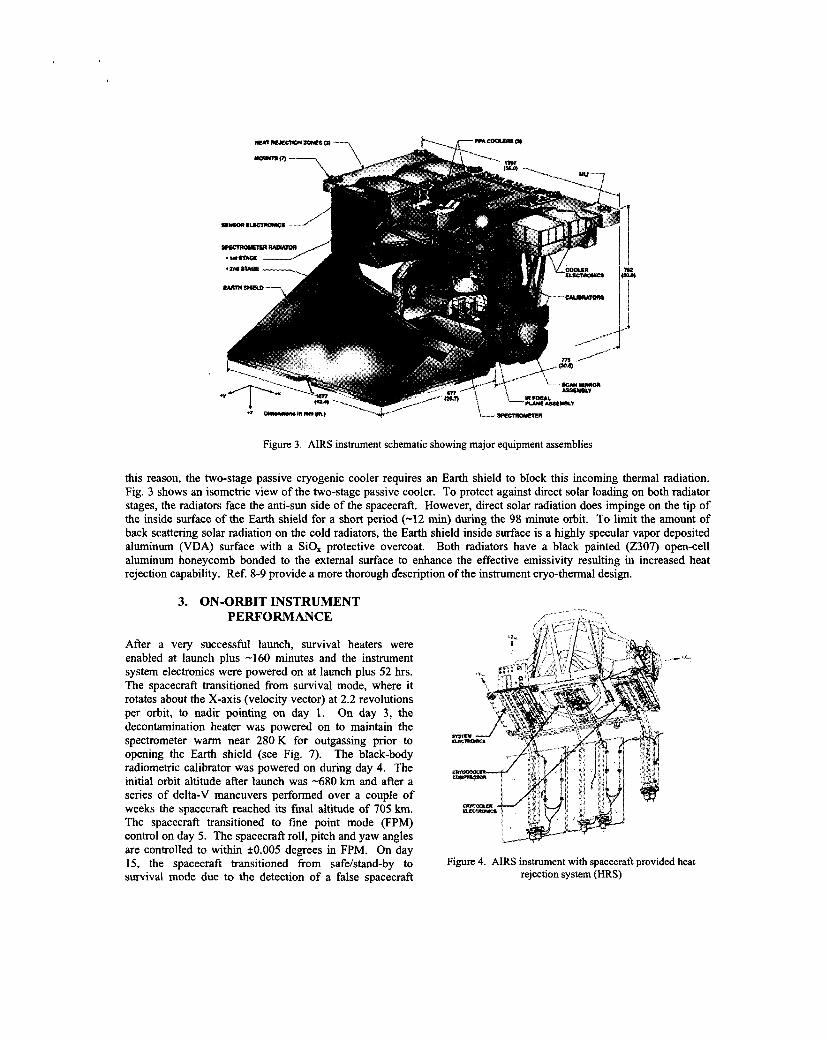
The heart of the AIRS instrument is the HgCdTe focal plane array located in a vacuum sealed Dewar hard mounted on the spectrometer. The focal plane array is cooled to 58 K by a pair of mechanical pulse tube coolers while the spectrometer is maintained at 155 K by means of a passive two-stage cooler. Refs. 2-7 provide a historical account of the development efforts for the AIRS coolers. The passive cooler first-stage running at 195 K intercepts parasitic heat leaks from the surrounding environment at 300 K. Fig. 3 illustrates the overall instrument construction and highlights key assemblies. The scan mirror is cooled below 273 K by radiative coupling to space. The VISiNIR detectors are not cooled and operate in the 293 K to 300 K ambient range of the instrument housing. The instrument structure is built primarily from advanced composite materials, as is the passive cooler Earth shield. The instrument envelope is 1.4 m by 0.8 m by 0.8 m with the Earth shield stowed and 1.4 m by 0.8 m by 1.5
Figure 1. Artist's rendition of EOS Aqua spacecraft on orbit
'\\ "*6U 8 W R n T . U )
Figure 2. EOS Aqua spacecraft configuration
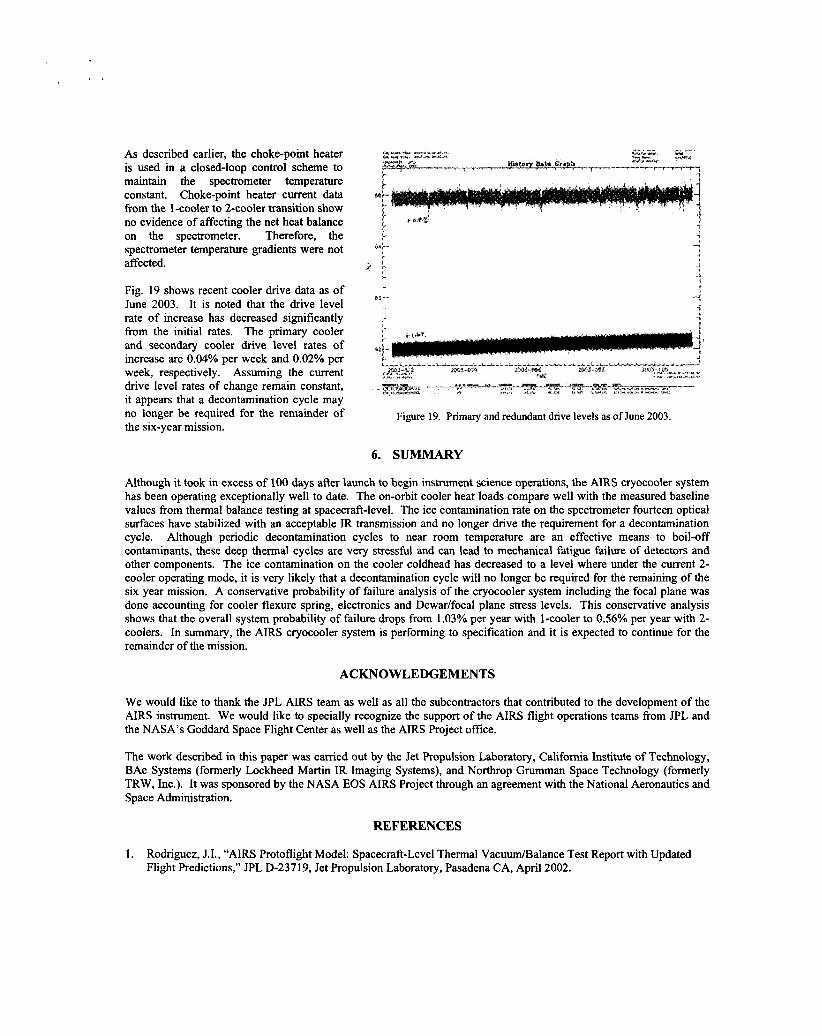
m with the Earth shield deployed. The allocated mass and average operating power is 150 kg and 220 W, respectively. The instrument design incorporates both passive and active thermal control techniques to reject waste heat to space. The heat load from the spectrometer to the second stage radiator of the passive cooler is 10.9 W at 155 K. The cryocooler beginning-of-life (BOL) heat load is 1 1 73 m W at 55 K with one cooler off. Electronic assemblies and the cooler compressors are mounted on the spacecraft-provided HRS coldplates as shown in Fig. 4. The scanning mirror assembly is mounted on a support structure on the +Z side. Fig. 5 shows the protoflight instrument without the external multilayer insulation (MLI) blankets. Isometric views of the spectrometer are shown in Fig. 6. The Aqua spacecraft low altitude sun-synchronous orbit results in significant Earth IR and albedo heat flux loading on the nadir side of the spacecraft. For
‘2 Dlmr*onlnnmi*r)
Figure 3. AIRS instrument schematic showing major equipment assemblies
this reason, the two-stage passive cryogenic cooler requires an Earth shield to block this incoming thermal radiation. Fig. 3 shows an isometric view of the two-stage passive cooler. To protect against direct solar loading on both radiator stages, the radiators face the anti-sun side of the spacecraft. However, direct solar radiation does impinge on the tip of the inside surface of the Earth shield for a short period (-12 min) during the 98 minute orbit. To limit the amount of back scattering solar radiation on the cold radiators, the Earth shield inside surface is a highly specular vapor deposited aluminum (VDA) surface with a SiO, protective overcoat. Both radiators have a black painted (2307) open-cell aluminum honeycomb bonded to the external surface to enhance the effective emissivity resulting in increased heat rejection capability. Ref. 8-9 provide a more thorough description of the instrument cryo-thermal design.
3. ON-ORBIT INSTRUMENT PERFORMANCE
After a very successful launch, survival heaters were enabled at launch plus -160 minutes and the instrument system electronics were powered on at launch plus 52 hrs. The spacecraft transitioned from survival mode, where it rotates about the X-axis (velocity vector) at 2.2 revolutions per orbit, to nadir pointing on day 1. On day 3, the decontamination heater was powered on to maintain the spectrometer warm near 280K for outgassing prior to opening the Earth shield (see Fig. 7). The black-body radiometric calibrator was powered on during day 4. The initial orbit altitude after launch was -680 km and after a series of delta-V maneuvers performed over a couple of weeks the spacecraft reached its final altitude of 705 km. The spacecraft transitioned to fine point mode (FPM) control on day 5. The spacecraft roll, pitch and yaw angles are controlled to within k0.005 degrees in FPM. On day 15, the spacecraft transitioned from safektand-by to survival mode due to the detection of a false spacecraft
Figure 4. AIRS instrument with spacecraft provided heat rejection system (HRS)

Figure 6. Isometric views of spectrometer
Figure 5 . AIRS i n s w e n t without external MLI blankets fault; however, it was safely commanded back to safelstand- by mode (nadir pointing) within 24 hours. The spacecraft fault management triggered the transitioned due to a false condition showing the battery “excessively” discharged
upon eclipse entry. The Earth shield was successfully deployed on day 26 and the decontamination heater was turn off on day 36. The estimated beta angle at launch was -20 degrees. The beta angle is defined as the angle between the orbit plane and the sun vector and is a key parameter for on-orbit thermal performance. In general, orbital heat loads increase with smaller beta angles. The beta angle varies with season and will reach each year a minimum of 16 degrees on July 8 and a maximum of 32 degrees on November 6. Both primary and redundant cryocooler electronics (A and B) were initialized on day 37 and both compressors were powered on day 39.
The AIRS instrument entered operational mode on about day 70 (mid-July 2002); however, the continuity of science measurements were interrupted after only 15 days of science operations due to the need for decontamination of the spectrometer optical surfaces. Up to this point, the spectrometer had been maintained at 153 K for 36 days following 40 days of post-launch outgassing. The source of the contamination was water cryodepositing on the cold optical surfaces. The key sources of water contamination are MLI blankets and composite structures. Apparently, the initial 40-day outgassing period was not long enough to remove most of the water vapor. Prior to launch, it was recognized that periodic decontamination cycles would be required with a decreasing need with time. The ice buildup was monitored daily by tracking the loss of IR transmissivity within the broad absorption features of water at 4.2 and 10.4 p. Although, IR transmission losses up to 50% could be tolerated and still be able to obtain adequate radiances, it was decided to proceed with the first decontamination cycle because the pulse tube coldhead required de-icing as well. The decontamination cycle was started on day 86 (July 29,2002), at which time the worst case IR channel transmission was

slightly less than 80%. The 130 W decontamination heater warms up the spectrometer to 268K within 6 hours; however, due to the large spectrometer thermal mass and low passive cooler heat rejection capacity, about 72 hours are required to cooldown and stabilized at the operating temperature. Following this decontamination cycle, the spectrometer operating temperature was increased from 153 K to 155 K to mitigate the problem of water vapor cryodepositing on the cold optical surfaces. Higher optics temperatures result in increased equilibrium vapor pressures near or above the existing partial pressures of water in the vicinity of the instrument.
The decontamination heater was shut-down on day 94 to begin the long cooldown transient to the operating temperature. The spectrometer was first allowed to cool to 153K, and then the temperature setpoint was changed to 155K. Fig. 8 shows the choke- point heater current during this transition. After the spectrometer stabilized at the new temperature of 155 K, the primary cooler compressor was powered on during day 97, and approximately 6 hours later the cooler electronics experienced a trip of the watchdog timer (WDT) which shut-down the compressor. Fig. 9 shows the focal plane temperature during this event. Analysis of the flight data indicated a false trip. This type of WDT false trip was observed previously only in the redundant cooler electronics during ground testing both at unit and spacecraft-level. The cause of these false WDT trips was previously identified by the cooler vendor (NGST) as a design deficiency in the cooler electronics watchdog:
Figure 7. Spectrometer temperature after Earth shield deployment with decontamination heater on
Figure 8. Choke-point heater dunng transition from operating at 153 K to 155 K
circuit. NGST developed a software patch-to disable the WDT feature; however, the project opted not to upload the patch because of the lack of testing and understanding of its consequences. On day 101 (August 13, 2002), the cooler electronics were power cycled once again and re-initialized. The primary cooler compressor was powered on the following day.
On day 110 (August 22, 2002), the cooler electronics detected an over-stroke condition and shut-down the primary compressor again. Analysis of the flight data indicated that a single event transient (SET) caused the false trip, stopping the compressor. After power cycling the cooler electronics, the compressor was powered on once again on day 114. During each of these inadvertent events where the compressor is shut-down, there is significant loss of AIRS science data not only because of the down time; but, also because of the need to perform calibration rechecks after returning to operational status.

On day 201 (November 21, 2002) while the primary cooler was operating, the redundant cooler was powered on and both coolers have been operating continuously to date without problems. The 2-cooler operational mode offers significant advantages in terms of the overall system reliability and has been adopted as the baseline operational mode for the remaining of the mission. A detailed discussion of this topic is found in the next sections.
The heat rejection system (HRS) for the system electronics, cryocooler electronics and cryocooler compressor has performed exceptionally well. Fig. 4 shows the instrument with HRS including the cold spaceviewing radiators. When the equipment is operating, the HRS cold-plate temperatures are controlled independently to 13*1 degrees C by means of the variable conductance heat pipes (VCHPs) and associated control electronics. If the equipment is turned off, the VCHPs are shut- down and survival heaters with bi-metallic thermostats control the equipment temperature at 1 +2 degrees C.
4. PASSIVE TWO-STAGE CRYOGENIC COOLER
PERFORMANCE
The passive two-stage cooler provides the necessary cooling to maintain the spectrometer below 155 K. The first-stage radiator running at about 195 K serves to intercept radiative and conductive parasitic heat loads from the surrounding equipment at room temperature. The thermal model shows the second-stage radiator has a net heat rejection capability of 10.9 W at 155 K. Thermal balance data from spacecraft-level testing showed that the second-stage radiator choke-point heater has a control authority of
I
Figure 9. Focal plane cooldown and warm up transient during SET event
Figure 10. Initial spectrometer cooldown transient after shutting down decontamination heater
10.2 K. The maximum power available-from this heater is 3.47 W. This thin film heater is bonded to an aluminum plate, which mounts to the spectrometer at the interface to the second-stage radiator. The thermal model on-orbit worst case predictions showed the spectrometer operating temperature range from 148.5 K to 153.9 K with the choke-point heater off. These worst case predictions are based on estimates of beginning-of-life (BOL) and end-of-life (EOL) properties, expected environmental heat load variations (albedo, Earth IR and solar), spacecraft interface allowable flight temperature ranges and beta angle variations. From a science point of view, it is desirable to operate the spectrometer at a constant temperature for the life of the mission. Considering the heater control authority and the predicted on-orbit spectrometer temperatures, the initial control setpoint temperature selected was 153 K. At this temperature, the choke- point heater was expected to operate at 40-50% maximum capacity and as material surfaces degraded, the heater power required would decrease to accommodate the increased parasitic heat loads.

'4 -"*. L The spectrometer decontamination heater I "--- was shut-down on day 36 and the spectrometer begun cooling down immediately as shown in Fig. 10. After reaching quasi-steady state operation, the choke-point heater was able to control the spectrometer at 153 K with a maximum heater power of 1.5OM.20 W (43.2*5.8% of maximum capacity). Note this correlates , well with thermal model predictions. 2'5; -, Considering the on-orbit beta angle and spacecraft interface temperatures, it was determined that the choke-point heater had sufficient capacity to operate the spectrometer at 155 K and would be able to sustain this control temperature for the life of the mission. Operating the spectrometer at 155 K versus 153 K mitigates the ice contamination on optical surfaces problem, which was identified after analyzing the science data about 2 weeks into on-orbit science operations. This problem is discussed further in the next section.
temperature setpoint was changed from m, - 153 K to 155 K on day 65 and has
without problems. The choke-point heater
-
-- '*?"
,,,"
Figure 11. Earth shield temperature d u n g deployment transition
~ %.," - - I --_1 ~ i ~ ~ ~ ~ ~ ~ ~ m " - ~ ~ ~ ~ - . _l_l - _ Consequently, the choke-point heater i
successfully controlled this temperature b
(67.9*5.9% of maximum capacity). Fig. 8 z
shows a snapshot of the heater current as a function of time during the setpoint change. 1 I
3
i.
_* power required at 155 K is 2.36+0.20 W & I I
* [ .I
i r
4
The Earth shade on-orbit temperature is shown in Fig. 1 1. mc.
i
5. PULSE TUBE CRYOCOOLER PERFORMANCE
53- _I
Prior to powering on the cryocoolers, it was agreed that both cryocoolers would be powered on individually for about 4-6 hours to assess their on-orbit performance and compare against the baseline performance measured during thermal balance testing at NGST. Both cooler electronics were powered on day 37 and both compressors were subsequently powered on day 39. The redundant cooler compressor (B) was powered on first and operated for about 5 hours and was subsequently shut- down prior to powering the primary compressor for evaluation and transitioning to normal operations. The initial assessment of both coolers indicated that both were operating nominally and the net heat load was within 25 mW of the baseline measured at NGST during thermal balance testing (Ref. 10-1 1). The initial focal plane and coldhead cooldown transient with the primary cooler is shown in Fig. 12. A cross-section of the pulse tube cooler and the focal plane Dewar is shown in Fig. 13. The initial coldhead control setpoint was selected at 55.28 K with the expectation that the focal plane temperature would settle at 57.78 K. Ground test data showed a 2.5 K temperature difference between the cooler coldhead and focal plane with only one cooler operating. Fig. 14 shows a schematic of the thermal link between the
Figure 12. Initial focal plane cooling with primary cooler

coldhead and the focal plane. When both coolers are operating, this temperature difference is reduced because the off-state conductance parasitic heat leak from the off cooler no longer contributes to the total heat load. The off-state conductance heat leak from the redundant cooler is in the order of 470 mW, which is a significant fraction of the total cooler load. After reaching equilibrium on-orbit, the focal plane temperature stabilized at 57.50 K only 0.28 K lower than the expected value. Note that the temperature difference between the coldhead and the focal plane is only a function of the net cryocooler heat load.
Even though, the initial cooler assessment indicated nominal net heat loads on both coolers when compared to the baseline, the increasing cooler drive level trend indicated increasing cooler heat loads. This and the fact that science data analysis indicated the presence of ice on the optical elements in the spectrometer and/or the focal plane Dewar window, led to the conclusion that the cooler coldend extemal surfaces were being contaminated most likely with ice. Thin ice layers in the order of a few microns thick leads to increased surface effective emittance resulting in increased radiative parasitic heat loads (Ref. 12). The initial ice accumulation rates resulted in the cooler drive levels increasing at a rate of 1.02% per week prior to the first decontamination cycle. Fig. 15 shows the cooler drive for the first 150 days of cooler oDerations. After four weeks of
CWRESS%R A TFM’
Figure 13. Pulse tube cryocooler and focal plane Dewar configuration
T,,, (-313 K)
Sspphtr?? Cdd Link
Primary Pulse Tub@
Figure 14. Schematic of thermal link between clyocooler coldhead to focal plane
operation just prior to the first decontamination cycle, the rate decreased to 0.63% per week. Operation after the first decontamination cycled shows the drive level decreased to its initial value of -81%; however, the drive level rate remained the same at about 0.63% per week. During the WDT trip interruption in September 22, 2002, the focal plane/coldhead reached 150 K. After restarting the primary cooler, the drive level settled out only about 0.5% lower and there was no change in the drive level rate. The data shows that after the SET over-stroke trip in October 20, 2002, the drive level decrease by about 0.75% and the rate decreased to 0.47% per week. Based on cooler performance data published in Ref. 10-1 1, 13, this rate is equivalent to about a 20 mW heat load increase per week. Assuming the ice contamination rates remained constant, the maximum drive level setpoint of 90% would have been reached by the end of January 2003. The maximum cooler drive level setpoint is commandable from the ground and may be increased up to 100%; however, this is not recommended from overall cooler reliability point of view, mainly because of mechanical wear-out and parts stress issues. With the concurrence of the cooler vendor (NGST), a maximum drive level of 90% was selected as a safe limit consistent with the six year mission life-time requirement.
Following a thorough investigation of the ice contamination problem revealed that the most likely sources of water were the extemal warm MLI blankets surrounding the instrument and possibly the nearby spacecraft MLI blankets. On July 29,2002, the spectrometer underwent its first and only full decontamination cycle which raised its temperature by means of the decontamination heaters with thermostatic control to 268 K. Subsequently, two unintentional events caused the cooler to shut-down and consequently, the coldhead and focal plane temperatures rose above 150 K. This event occurred

on day 1 10 about 6 days from cooler turn-on after decontamination. The first of these events was the false trip of the watchdog timer in the cooler electronics. The second cooler shutdown was caused by a single- event transient (SET) while the spacecraft passed through the South Atlantic Anomaly (SAA) in space. Four days earlier a large coronal mass ejection (CME) in the direction of earth had been observed on the sun. These CMEs are sources of high energetic proton fluxes that are concentrated in the SAA and polar regions. The SET caused the cooler electronics to falsely detect a cooler overstroke condition resulting in an immediate cooler shut-down. Cooler drive level data after the decontamination cycle revealed that the level of contamination was decreasing, but remained significant where a decontamination cycle lasting about 6-8 days would be required every 3-6 months. Clearly, this mode of operation would have important science implications, but would also expose the hardware and specifically the focal plane to repeated deep thermal cycles increasing the risk of hardware failure.
An altemative solution was sought which considered all the facts, but also specifically addressed the overall cooler system reliability issue. One option seriously considered was to operate both coolers simultaneously. Since the primary and secondary coolers (A and B) draw power from the spacecraft noisy bus A and B, respectively, there are no operational constraints prohibiting dual cooler operation. It was estimated that if both coolers were running, the total power draw from the noisy bus would only be about 8 W more then for a single cooler running (102 W versus 94 W). This did not present a problem for the
Figure 15. Cryocooler drive level rate of increase due to water contamination
X ~ . , . . . . . . . . . . . . . . . . . . . . . .
lM1IM link32 I t l l m 2 1w1m
Figure 16. Primary cooler drive level prior to turning on redundant cooler. Date
spacecraft power subsystem. In the event of a SET resulting in a cooler shut-down condition, the focal plane temperature would only rise 1.25 K when the remaining cooler drive level increased to accommodate the entire coldend heat load. The spacecraft provided HRS could easily handle the slightly higher power dissipation from both coolers. In addition, if the focal plane is included in the overall assessment of system reliability, its reliability becomes the driver and the overall system reliability improves with both coolers operating. It was also estimated that if both coolers were running and shared equally the coldend heat load, the coolers would run at drive levels between 60-64%. This is a significant reduction in drive level, from the single cooler operating mode, which results in less mechanical wear and longer cooler life. Running with two coolers permits significantly longer operational periods between decontamination cycles. After careful consideration, this mode of operation was adopted and procedures were developed to implement it. Ref. 14 documents the overall system reliability analysis results. The rate of ice accumulation has been decreasing over time, but has not leveled-off to date. Science data indicates that the ice accumulation on the optics has stopped and the

loss of signal transmission due to the accumulated ice is acceptable from a science point of view. The requirement for a defrost cycle will only be driven by the cooler decontamination requirements.
The primary cooler drive level prior to the 2- cooler operating transition is shown in Fig. 16. A linear regression analysis of this data shows that prior to the change over, the drive level was 87.3+0.4% and was increasing at a rate of 0.389% per week which corresponds to a cooler heat load increase of 16.5mW per week. The maximum drive level was set at 90% which would have been reached on December 31, 2002 with only one cooler operating.
The drive levels for both coolers after transitioning to the 2-cooler operating mode are shown in Fig. 17. Again a linear regression analysis was performed on both sets of data to determine the drive level rates. The primary and redundant cooler drive levels decreased to 60.6% and 64.2%, respectively. The initial drive level rate of increase was 0.169% per week for the primary cooler and 0.100% per week for redundant cooler. These rates correspond to a heat load increase of 1O.lmW per week for the primary cooler and 6.0mW per week for the redundant cooler. The net heat load rate of increase for the two coolers is 16.lmW per week, which correlates well with one cooler operating mode. Note that the sum of the drive level rates for the two coolers (0.169% per week + 0.100% per week = 0.269% per week) is about 30% lower than with only one cooler operating (0.389%/wk). This is due to the fact that at lower drive levels the slope of the heat lift curve as a function of drive level is steeper which indicates the cooler is more efficient.
With two-coolers operating, the cooler coldblock temperature setpoint needs to be increased by about 1.25 K because the off-
s o , , . . . . . I . . . . . . , . .
B o o t ' : : : : : : * : : : : : : 1 : : i
1IRSMOt 3 1" lanRco2 Date
Figure 17. Drive levels for both coolers after transition to 2-cooler operation.
Figure 18. Focal plane temperature during transition to 2-cooler operating mode.
state conductance parasitic heat load from the redundant off-cooler disappears and the focal plane temperature would decrease by 1.25 K. In order to maintain a constant focal plane temperature, the cooler coldblock temperature setpoint was changed from 55.28 K to 56.53 K after transitioning to the 2-cooler operating mode. This increase has a positive effect in that the cooler refrigeration capacity increases at higher coldblock temperatures. Drive levels for both coolers are shown in Figs. 16 as a function of time. The focal plane temperature during the transition to the 2-cooler operating mode is shown in Fig. 18. After reaching equilibrium with 2-coolers operating, the focal temperature increased 50mK from its equilibrium temperature when operating with only one cooler.
As described earlier, the choke-point heater is used in a closed-loop control scheme to maintain the spectrometer temperature constant. Choke-point heater current data from the 1 -cooler to 2-cooler transition show no evidence of affecting the net heat balance on the spectrometer. Therefore, the spectrometer temperature gradients were not affected.
Fig. 19 shows recent cooler drive data as of June 2003. It is noted that the drive level rate of increase has decreased significantly from the initial rates. The primary cooler and secondary cooler drive level rates of increase are 0.04% per week and 0.02% per week, respectively. Assuming the current drive level rates of change remain constant, it appears that a decontamination cycle may no longer be required for the remainder of the six-year mission.
Figure 19. Primary and redundant drive levels as of lune 2003.
6. SUMMARY
Although it took in excess of 100 days after launch to begin instrument science operations, the AIRS cryocooler system has been operating exceptionally well to date. The on-orbit cooler heat loads compare well with the measured baseline values from thermal balance testing at spacecraft-level. The ice contamination rate on the spectrometer fourteen optical surfaces have stabilized with an acceptable IR transmission and no longer drive the requirement for a decontamination cycle. Although periodic decontamination cycles to near room temperature are an effective means to boil-off contaminants, these deep thermal cycles are very stressful and can lead to mechanical fatigue failure of detectors and other components. The ice contamination on the cooler coldhead has decreased to a level where under the current 2- cooler operating mode, it is very likely that a decontamination cycle will no longer be required for the remaining of the six year mission. A conservative probability of failure analysis of the cryocooler system including the focal plane was done accounting for cooler flexure spring, electronics and Dewadfocal plane stress levels. This conservative analysis shows that the overall system probability of failure drops from 1.03% per year with I-cooler to 0.56% per year with 2- coolers. In summary, the AIRS cryocooler system is performing to specification and it is expected to continue for the remainder of the mission.
ACKNOWLEDGEMENTS
We would like to thank the JPL AIRS team as well as all the subcontractors that contributed to the development of the AIRS instrument. We would like to specially recognize the support of the AIRS flight operations teams from JPL and the NASA’s Goddard Space Flight Center as well as the AIRS Project office.
The work described in this paper was carried out by the Jet Propulsion Laboratory, California Institute of Technology, BAe Systems (formerly Lockheed Martin IR Imaging Systems), and Northrop Grumman Space Technology (formerly TRW, Inc.). It was sponsored by the NASA EOS AIRS Project through an agreement with the National Aeronautics and Space Administration.
REFERENCES
1. Rodriguez, J.I., “AIRS Protoflight Model: Spacecraft-Level Thermal VacuumBalance Test Report with Updated Flight Predictions,” JPL D-23719, Jet Propulsion Laboratory, Pasadena CA, April 2002.

2.
3.
4.
5.
6.
7.
8.
9.
Ross, R.G., Jr. and Green K., “AIRS Cryocooler System Design and Development,” Cryocoolers 9, Plenum Publishing Corp., New York, 1997, pp. 885-894. Chan, C.K., et al., “Performance of the AIRS Pulse Tube Engineering Model Cryocooler,” Cryocoolers 9, Plenum Publishing Corp., New York, 1997, pp. 195-202. Chan, C.K., et al., “AIRS Pulse Tube Cryocooler System,” Cryocoolers 9, Plenum Publishing Corp., New York,
Chan, C.K., Raab, J., Colbert, R., Carlson, C. and Orsini, R., “Pulse Tube Coolers for NASA AIRS Flight Instrument,” Proceedings ofICEC 17, 14-17 July 1998, Boumemouth, UK. Johnson, D.L.. Collins, S.A. and Ross, R.G., Jr., “EM1 Performance of the AIRS Cooler and Electronics,” Cryocoofers IO, Plenum Publishing Corp., New York, 1999, pp. 771-780. Morse, P., et al., “Development and Test of the Atmospheric Infrared Sounder (AIRS) for the NASA Earth Observing System (EOS),” SPIE 3759-28, 1999. Wickman, H.A., et al., “Development Status of the Cryocooler and Thermal Management System for the Atmospheric Infrared Sounder (AIRS),” Proceedings of the SPIE Conference on Infrared Spaceborne Remote Sensing VI, SPIE Vol. 3437, pp. 261-272, July 1998. Coda, R., et al., “Atmospheric Infrared Sounder (AIRS) Thermal Test Program,” SPIE 3759-29, 1999.
1997, pp. 895-903.
10. Ross, R.G., Jr., et al., “AIRS pulse Tube Cooler System-Level and In-Space performance Comparison,” Cryocoolers
1 1. Ross, R.G., Jr., Test Results of the AIRS Cryocooler /Dewar Heat Load T/V test at TR W, AIRS Design File Report
12. Ross, R.G., Jr., “Cryocooler Load Increase due to External Contamination of Low-E Cryogenic Surfaces,”
13. Ross, R.G., Jr., et at., “AIRS PFM Pulse Tube Cooler System-Level Performance,” Cryocoolers 10, Plenum
14. Schindler, R.A., Reassessment of Two Cooler Operation, AIRS Design File Report ADF#615 (Internal Document),
12, Plenum Publishing Corp., New York, 2002, pp. 747-754.
ADF#54 1 (Internal Document), Jet Propulsion Laboratory, September 13,2001.
Cryocoolers 12, Plenum Publishing Corp., New York, 2002, pp. 727-736.
Publishing Corp., New York, 1998, pp. 119-128.
Jet Propulsion Laboratory, December 5,200