airborne electromagnetic survey roxmark mines … · 52k15nwe«32 2.1337 fredart lake 010 airborne...
TRANSCRIPT

52K15NWe«32 2.1337 FREDART LAKE 010
AIRBORNE ELECTROMAGNETIC SURVEY
ROXMARK MINES LIMITED
BELANGER TWP. AREA, ONTARIO
FILE NO: 14023
QuestorSurveys Limited,20CansoRd.,Rexdale,Ontario,Canada

- 1 -
INTRODUCTION
This report contains our interpretation of the
results of an airborne electromagnetic survey flown in the
Belanger Twp. Area, Ontario on August 10 and 11, 1972. A
brief description of the survey procedure together with
recommendations for ground follow-up is included.
The survey totalled 13 line miles and was per
formed by Questor Surveys Limited. The survey aircraft
was a Skvvan CF-OS];, and the operating base was Red Lake.
The area outline is shown in a 1:125,000 map
at the end of this report. This is part of the Trout Lake -
Birch Lake Sheet, Preliminary Geological Map No. P 406.
MAP COMPILATION
The base map is an uncontrolled mosaic constructed
from Ontario Department of Lands & Forests 1" = 1/4 mile
photographs. The mosaic was reproduced at a scale of 1"
equals 1320 feet on stable transparent film from which
white prints can be made.
Flight path recovery was accomplished by compar
ison of the prints of the 35mm film with the mosaic in order
to locate the fiducial points. These points are approximately
one mile apart.

(iv)
DATA PRESENTATION
The symbols used to designate the anomalies are
shown in the legend on each map sheet, and the anomalies
on each line are lettered in alphabetical order in the
direction of flight. Their locations are plotted with
reference to the fiducial numbers on the analog record.
A sample record is included to indicate the method
used for correcting the position of the E.M. Bird and
to identify the parameters that are recorded.
All the anomaly locations, magnetic correlations,
conductivity-thickness values and the amplitudes of
channel number 2 are listed on the data sheets accom
panying the final maps.
GENERAL INTERPRETATION
The INPUT system will respond to conductive over
burden and near-surface horizontal conducting layers in
addition to bedrock conductors. Differentiation is based
on the rate of transient decay, magnetic correlation and
the anomaly shape together with the conductor pattern and
topography.
Power lines sometimes produce spurious anomalies
but these can be identified by reference to the monitor
channel.
(V)
Railroad and pipeline responses are recognized by
studying the film strips.
Graphite or carbonaceous material exhibits a wide
range of conductivity. When long conductors without
magnetic correlation are located on or parallel to
known faults or photographic linears, graphite is most
likely the cause.
Contact zones can often be predicted when anomaly
trends coincide with the lines of maximum gradient along
a flanking magnetic anomaly. It is unfortunate that
graphite can also occur as relatively short conductors
and produce attractive looking anomalies. With no other
information than the airborne results, these must be ex
amined on the ground.
Serpentinized peridotites often produce anomalies
with a character that is fairly easy to recognize. The
conductivity which is probably caused in part by magnetite,
is fairly low so that the anomalies often have a fairly
large response on channel #1; they decay rapidly, and
they have strong magnetic correlation. INPUT E.M. anom
alies over massive magnetites show a relationship to the
total Fe content. Below 25 - 30%, very little or no re
sponse at all is obtained, but as the percentage increases
the anomalies become quite strong with a characteristic
rate of decay which is usually greater than that produced
by massive sulphides.

(vi)
Commercial sulphide ore bodies are rare, and those
that respond to airborne survey methods usually have
medium to high conductivity. Limited lateral dimensions
are to be expected and many have magnetic correlation
caused by magnetite or pyrrhotite. Provided that the
ore bodies do not occur within formational conductive
zones as mentioned above, the anomalies caused by them
will usually be recognized on an E.M. map as priority
targets.

- 2 -
SURVEY PROCEDURE
Terrain clearance was maintained as close to
400 feet as possible, with the E.M. Bird at approximately
150 feet above the ground. A normal S-pattern flight path
using approximately one mile turns was used. The equipment
operator logged the flight details and monitored the instru
ments .
A line spacing of 1000 feet was used.
INTERPRETATION AND RECOMMENDATIONS
The trend of anomalies which extends from inter
cept 18A to intercept 36A inclusive, is thought to be due
to an iron formation. It will be noted on Ontario Department
of Mines, Preliminary Geological Map. No. P 406, that sul
phides is indicated in the vicinity of intercepts 31A, 31B,
31C, 32A and 32B. The conductor displays a good E.M. res
ponse and has good magnetic correlation. The anomalies have
a relatively broad E.M. response in relation to their amp
litudes. This could be an indication of either of two things.
First, the conductor is at depth or second, it is a wide
zone. The latter is thought to be the cause of the broad
response.
A second group of anomalies, intercepts 15A, 16A
and 17A, which are situated at the extreme west end of the
claim blocks, could have interesting possibilities. They
display good E.M. responses and have flanking magnetic

- 3 -
correlation. The zone appears to be isolated from the pre
viously mentioned iron formation. Referring to Map No. P 406,
metavolcanics with some metasediments have been indicated.
Ground follow-up on this conductor is suggested.
QUESTOR SURVEYS LIMITED
/\. xhi Cctrvc
R. de Carle
Geophysicist
APPENDIX
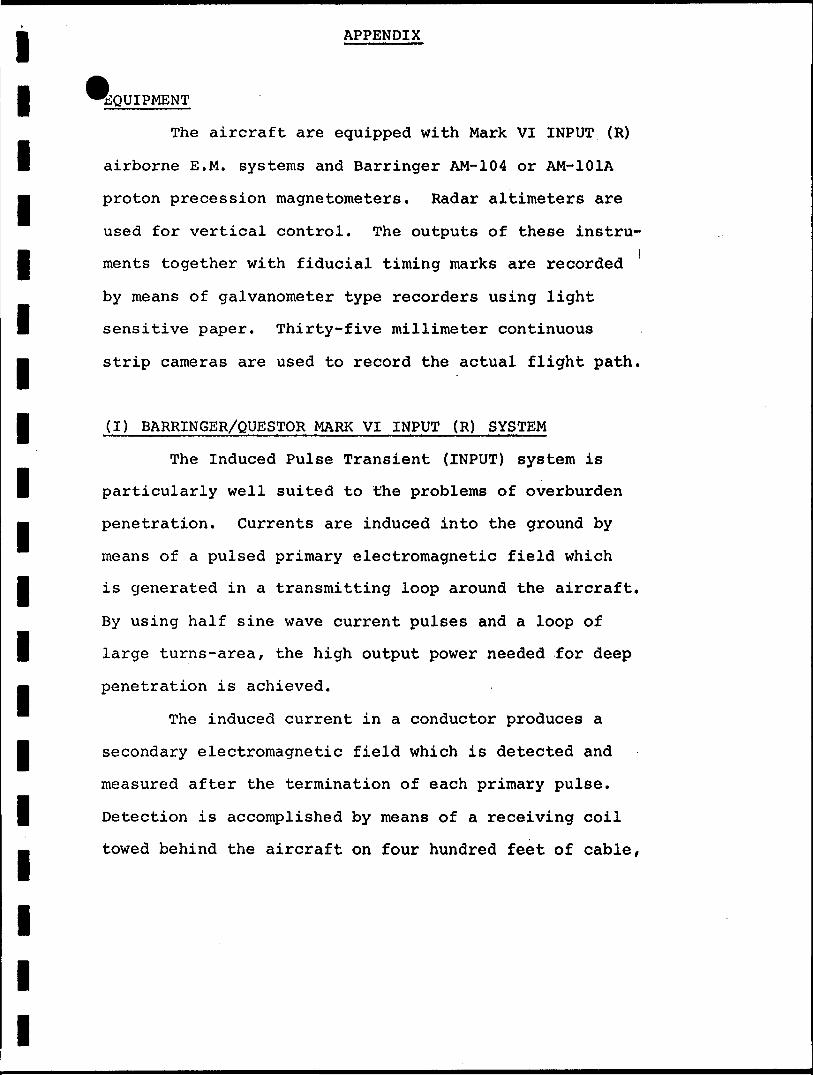
EQUIPMENT
The aircraft are equipped with Mark VI INPUT (R)
airborne E.M. systems and Barringer AM-104 or AM-1O1A
proton precession magnetometers. Radar altimeters are
used for vertical control. The outputs of these instru-
ments together with fiducial timing marks are recorded '
by means of galvanometer type recorders using light
sensitive paper. Thirty-five millimeter continuous
strip cameras are used to record the actual flight path.
(I) BARRINGER/QUESTOR MARK VI INPUT (R) SYSTEM
The Induced Pulse Transient (INPUT) system is
particularly well suited to the problems of overburden
penetration. Currents are induced into the ground by
means of a pulsed primary electromagnetic field which
is generated in a transmitting loop around the aircraft.
By using half sine wave current pulses and a loop of
large turns-area, the high output power needed for deep
penetration is achieved.
The induced current in a conductor produces a
secondary electromagnetic field which is detected and
measured after the termination of each primary pulse.
Detection is accomplished by means of a receiving coil
towed behind the aircraft on four hundred feet of cable.
(ii)
and the received signal is processed and recorded by
equipment in the aircraft. Since the measurements are
in the time domain rather than the frequency domain
common to continuous wave systems, interference effects
of the primary transmitted field are eliminated. The
secondary field is in the form of a decaying voltage
transient originating in time at the termination of the
transmitted pulse. The amplitude of the transient is,
of course, proportional to the amount of Current induced
into the conductor and, in turn, this current is propor
tional to the dimensions, the conductivity and the depth
beneath the aircraft.
The rate of decay of the transient is inversely
proportional to conductivity. By sampling the decay
curve at six different time intervals, and recording
the amplitude of each sample, an estimate of the rela
tive conductivity can be obtained. By this means, it
is possible to discriminate between the effects due to
conductive near-surface materials such as swamps and
lake bottom silts, and those due,to genuine bedrock
sources. The transients due to strong conductors such
as sulphides exhibit long decay curves and are therefore
commonly recorded on all six channels. Sheet-like sur
face materials, on the other hand, have short decay
curves and will normally only show a response in the
first two or three channels.

(iii)
The samples, or gates, are positioned at 260, 480,
755, 1100, 1575 and 2100 micro-seconds after the cessation
of the pulse. The widths of the gates are 225, 225, 320,
410, 500 and 540 micro-seconds respectively.
For homogeneous conditions, the transient decay
will be exponential and the time constant of decay is
equal to the time difference at two successive sampling
points divided by the log ratio of the amplitudes at
these points.
(II) BARRINGER AM-104 OR AM-IOIA PROTON PRECESSION MAGNETOMETER
The magnetometers which measure the total magnetic
field have a sensitivity of 5 gammas and a range from
20,000 gammas to 100,000 gammas.
Because of the high intensity field produced by
the INPUT transmitter, the magnetometer results are re
corded on a time-sharing basis. The magnetometer head is (
energized while the transmitter is on, but the read-out
is obtained during a short period when the transmitter is
off. Using this technique, the head is energized for 1.15
seconds and then the transmitter is switched off for 0.15
seconds while the precession frequency is being recorded
and converted to gammas. Thus a magnetic reading is taken
every 1.3 seconds.


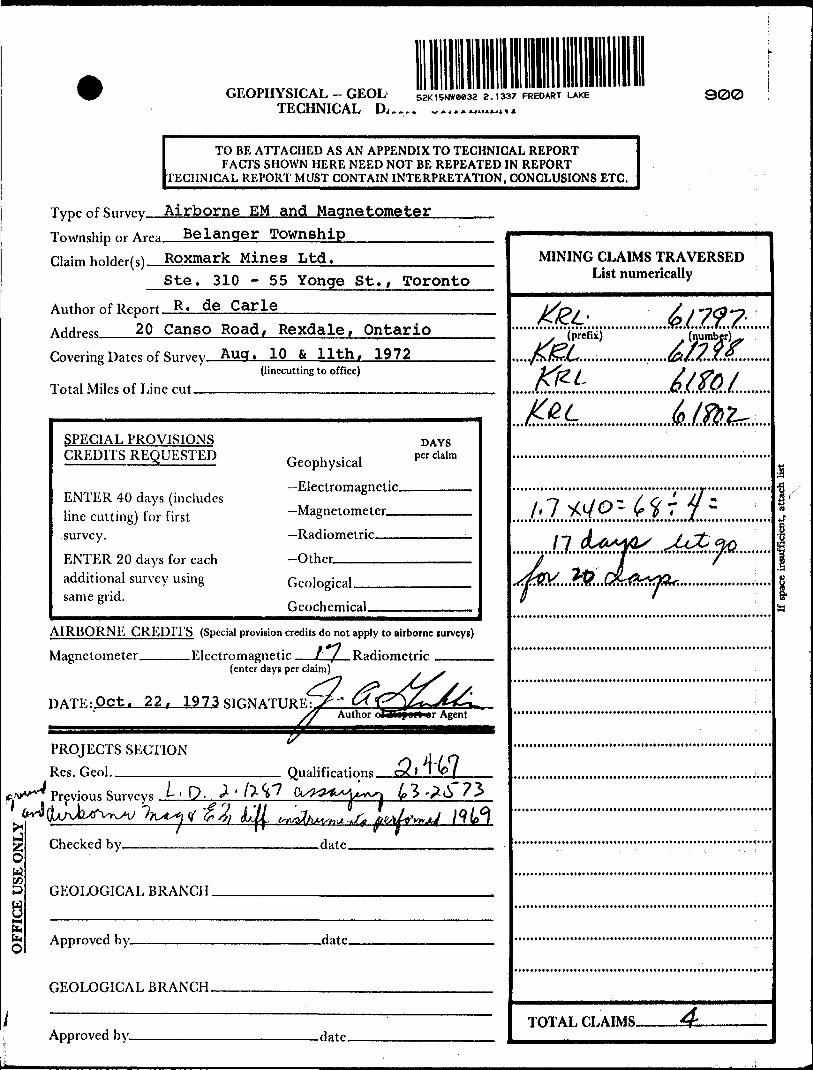
GEOPHYSICAL - GEOL TECHNICAL Di.
52K15NW0e32 2.1337 FREDART LAKE 9 0 0 >_̂ A 4 * .a. AjltAJL.411 J.
TO BE ATTACHED AS AN APPENDIX TO TECHNICAL REPORT FACTS SHOWN HERE NEED NOT BE REPEATED IN REPORT
TECHNICAL REPORT MUST CONTAIN INTERPRETATION, CONCLUSIONS ETC.
Type of s.irvpy Airborne EM and Magnetometer Township or Arr̂ Belanger Township ClaimhniH r̂(c) Roxmark Mines Ltd.
Ste. 310 - 55 Yonge St., Toronto
Author of Rppnrt R* de Carle AHHrpss 20 Canso Road/ Rexdale, Ontario
Covering Dates of Survey Aug . 10 & l i t h , 1972 (linccutting to office)
Total Miles of Line cut .
SPECIAL PROVISIONS CREDITS REQUESTED
ENTER 40 days (includes line cutting) for first survey.
ENTER 20 days for each additional survey using same grid.
Geophysical
—Electromagnetic.
—Magnetometer
—Radiometric
-Other
DAYS per claim
Geological.
Geochemical.
A I R B O R N E C R E D I T S (Special provision credits do not apply to airborne surveys)
Magnetometer Electromagnetic f / Radiometric (enter days per claim)
DATE: O p t . 22r 1 9 7 3 SIGNATURE^ Author -•^<:=4C^
r Agent
PROJECTS SECTION
Res. Geol.. Qualifications. sMl f^fi^^^ Previous Surveys t - ' D . ^ ' Z^^*? CCX'^O^^MA^ (p'^'?.6 ?^
z o
8 (*<
o
< ^ I
Checked by_ -date.
f^^*
GEOLOGICAL BRANCH.
Approved by_ -date.
GEOLOGICAL BRANCH.
Approved by. -date.
MINING CLAIMS TRAVERSED List numerically
/k'eL' y (prefix)
KB:.. ML...
.6..af.2:..
.mi...
.im..L
..Ltl^lrr..
i:l.M2-..M.il.l. J-
I
TOTAL CLAIMS.

Show instrument technical data in each space for type of survey submitted or indicate "not applicable"
GEOPHYSICAL TECHNICAL DATA
GROUND SURVEYS
Number of Stations
Station interval.
Line spacing
Profile scale or Contour intervals.
MAGNETIC
Instrument
Accuracy - Scale constant—
Diurnal correction method.
Base station location
ELECTROMAGNETIC
Instrument
Coil configuration.
Coil separation
Accuracy
Method:
Frequency
.Number of Readings.
(specify for each type of survey)
• Fixed transmitter • Shoot back • In line D Parallel line
(specify V.L.F. station) Parameters measured.
GRAVITY
Instrument
Scale constant.
Corrections made.
Base station value and location.
Elevation accuracy
INDUCED POLARIZATION - RESISTIVITY
Instrument
Time domain.
Frequency
Power
Frequency domain.
. Range
Electrode array
Electrode spacing.
Type of electrode.
• H M

SELF POTENTIAL
Instrument Range.
Survey Method
Corrections made.
RADIOMETRIC
Instrument
Values measured.
Energy windows (levels) —^—^
Height of instrument Background Count,
Size of detector ____
Overburden (type, depth — include outcrop map)
OTHERS (SEISMIC, DRILL WELL LOGGING ETC.)
Type of survey
Instrument
Accuracy . , ^
Parameters measured.
Additional information (for understanding results).
AIRBORNE SURVEYS
Type of survey(s)-lM_and_MAG_
Instrumcnt(s) Mark VI INPUT and AM-104 Proton Magnetometer (specify for eadi type of survey)
Accuracy AM-104 has a 5 gamma sensi t iv i ty (specify for each type of survey)
Aircraft used Sky van CF-QgL
Sensor altitude 150 feet
Navigation and flight path recovery m t̂h»H Visual Navigation U t i l i z i n g 1/4 mile photos, F l i g h t path 35 mm s t r i p s used to p l o t path on mosiac
Aircraft altitude__iOO_Jeet Line Spacing_JML_£®£i. Miles flown over total r̂ea 450 l i n e miles Over claims only " I n l i n e miles
/ ' 7 / 2.
^^•^^^^ ^ X 4 ^ c cTtf -^ y ^ ^

GEOCHEMICAL SURVEY - PROCEDURE RECORD
Numbers of claims from which samples taken.
Total Number of Samples.
Type of Sample. (Nature of Material)
Average Sample Weight
Method of Collection
Soil Horizon Sampled.
Horizon Development.
Sample Depth
Terrain
Drainage Development
Estimated Range of Overburden Thickness.
Mesh size bf fraction used for analysis.
ANALYTICAL METHODS
Values expressed in: per cent p. p. m. p. p. b.
n a n
Cu, Pb, Zn, Ni, Co, Ag, Mo, As,-(circle)
Others .—.. . ,
Field Analysis (>
Extraction Method.
Analytical Method-
Reagents Used
Field Laboratory Analysis
No.(_. ,
SAMPLE PREPARATION (Includes drying, screening, crushing, ashing)
Extraction Method.
Analytical Method _
Reagents Used
Commercial Laboratory (_
Name of Laboratory
Extraction Method
Analytical Method
Reagents Used ^
.tests)
-tests)
-testis)
General- General .


