air quality and agriculture: challenges and opportunities agexpo slides.2015... · air quality and...
TRANSCRIPT

Air Quality and Agriculture: Challenges and Opportunities
Sustainable Agriculture Expo November 16, 2015
Nancy Levin, U.S. Environmental Protection Agency
Region 9 Air Division

The average adult breathes 3,000 gallons of air every day.

Contents
I. Air Quality and Public Health
II. National Air Quality Standards
III. Sustainable Agriculture is part of the Air Quality solution

I. Air Quality and Public Health

U.S. EPA’s Mission
“Protect Human Health and the
Environment”
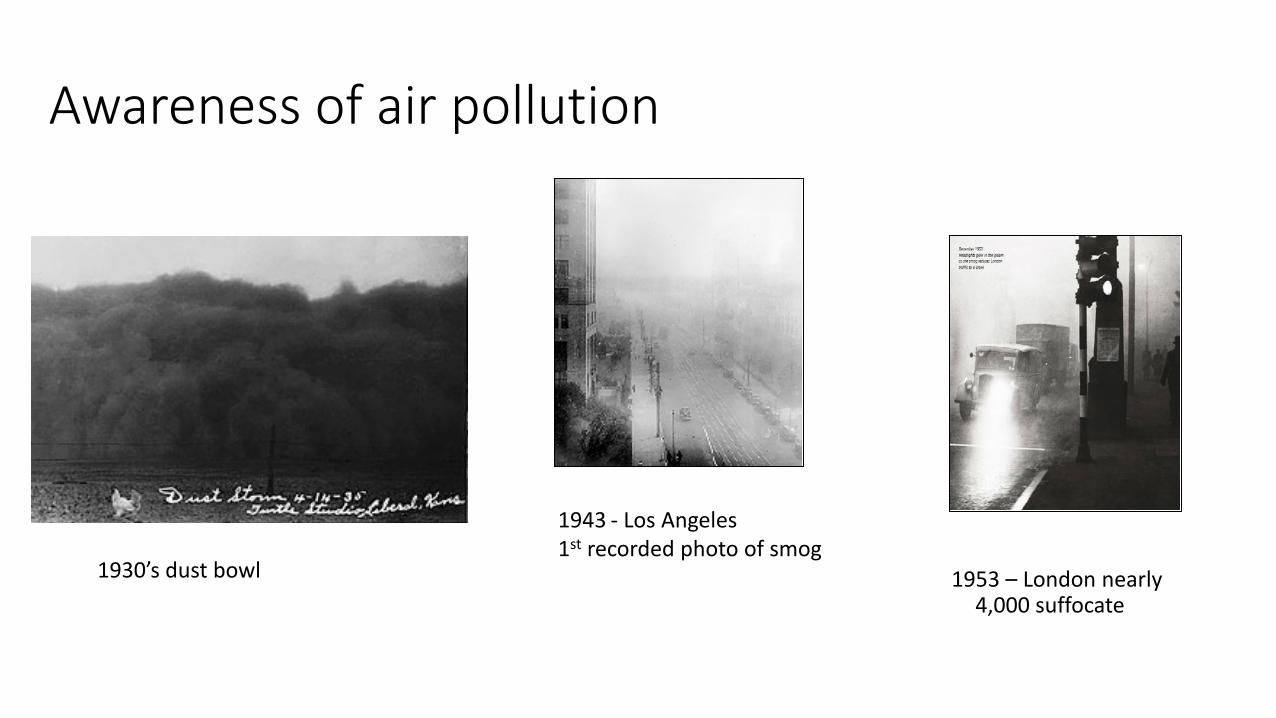
Awareness of air pollution
1953 – London nearly 4,000 suffocate
1943 - Los Angeles 1st recorded photo of smog
1930’s dust bowl

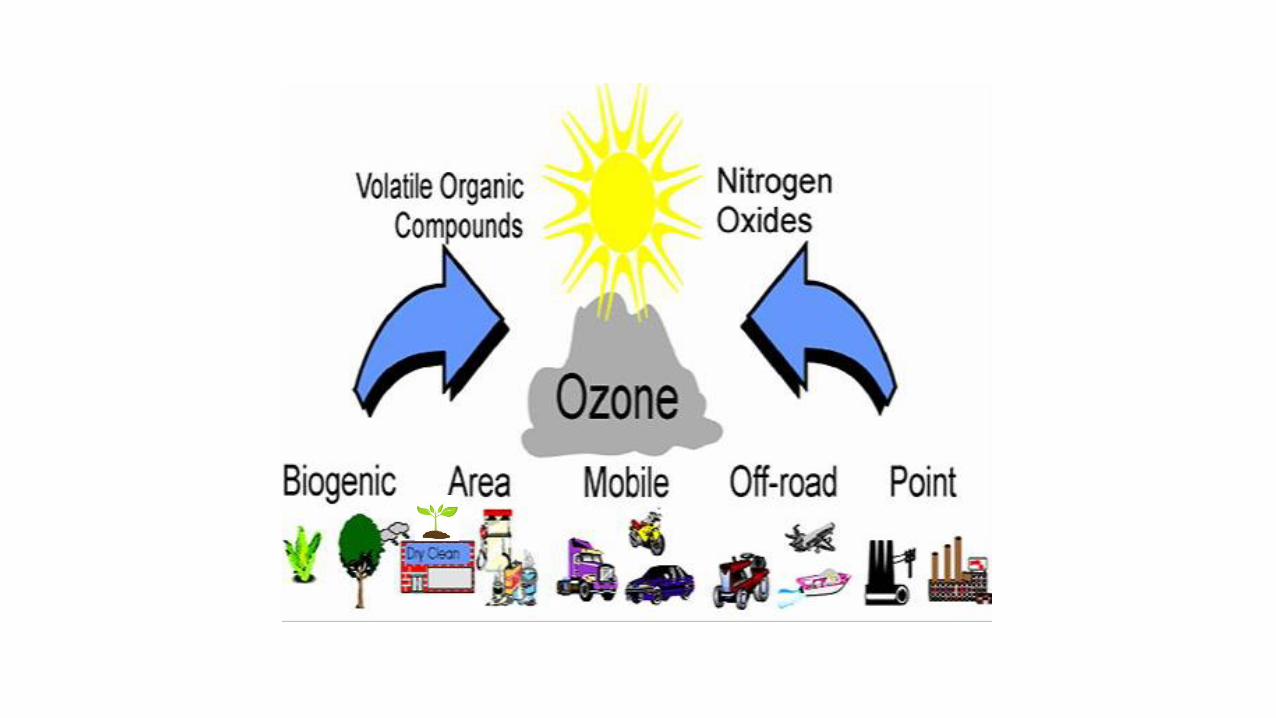
Many Sources of Smog and Air Particles

How Is Ozone (Smog) Formed?

Ozone exposure can… • Irritate respiratory system.
• Reduce lung function.
• Inflame and damage cells.
• Aggravate asthma, emphysema, chronic bronchitis.
• Cause permanent lung damage.
http://www3.epa.gov/apti/ozonehealth/population.html http://cfpub.epa.gov/airnow/index.cfm?action=aqi_brochure.index

Children are at higher risk. So are… People with lung disease. Older adults. Active people of all ages.
People most affected by ozone exposure
http://www.stateoftheair.org/2015/key-findings/people-at-risk.html

Particulate Matter (PM) PM 10 (microns in diameter) PM 2.5 (microns in diameter)

Size of Particle Pollution
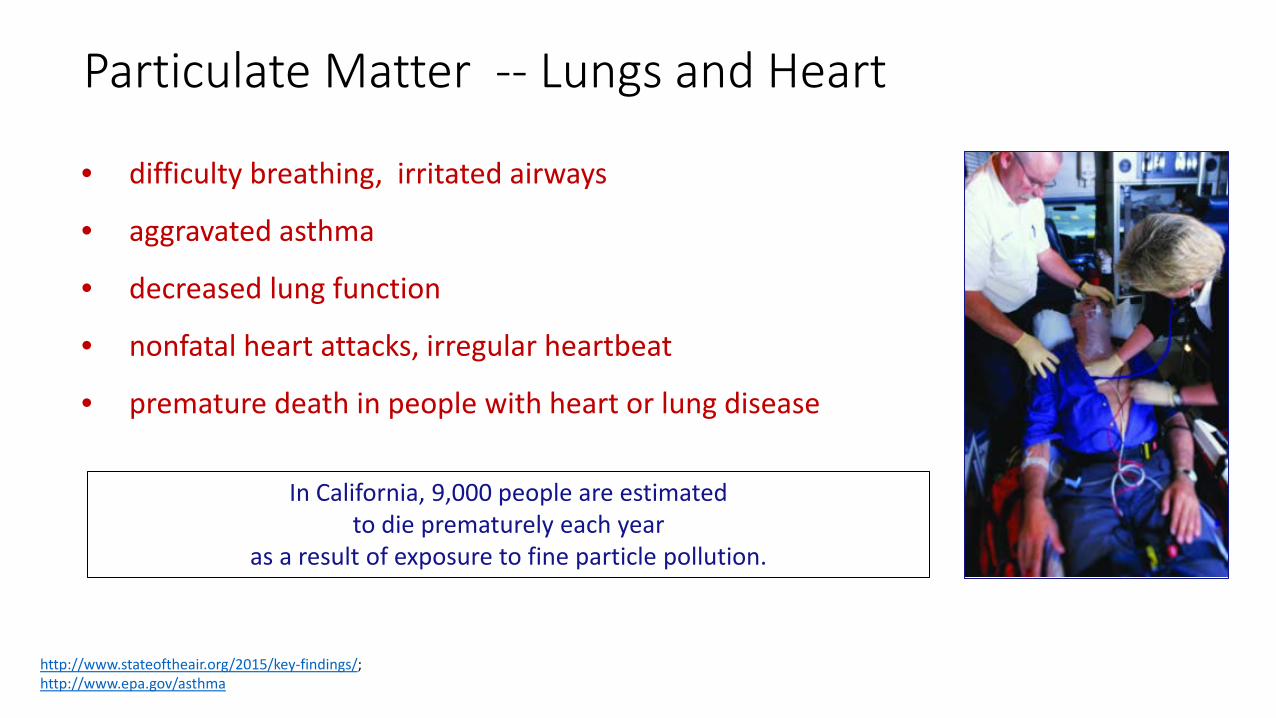
Particulate Matter -- Lungs and Heart
• difficulty breathing, irritated airways
• aggravated asthma
• decreased lung function
• nonfatal heart attacks, irregular heartbeat
• premature death in people with heart or lung disease
http://www.stateoftheair.org/2015/key-findings/; http://www.epa.gov/asthma
In California, 9,000 people are estimated to die prematurely each year
as a result of exposure to fine particle pollution.

II. National Ambient Air Quality Standards

1977 Clean Air Act and 1990 Amendments
Title I: National Air Ambient Quality Standards Title II: Mobile Sources Title III: Toxics Title IV: Acid Deposition Title V: Permits Title VII: Enforcement

70
80
90
100
110
120
130
140
150
8-ho
ur O
zone
Ave
rage
con
cent
ratio
n (p
pb)
8-hour ozone NAAQS
San Francisco Bay Area, CA
San Joaquin Valley, CA
Los Angeles-South Coast Air Basin, CA
Air pollution levels have decreased in CA

Emissions Drop – Economy Grows

CA = 34 million, 23%
2
…But Challenges Remain
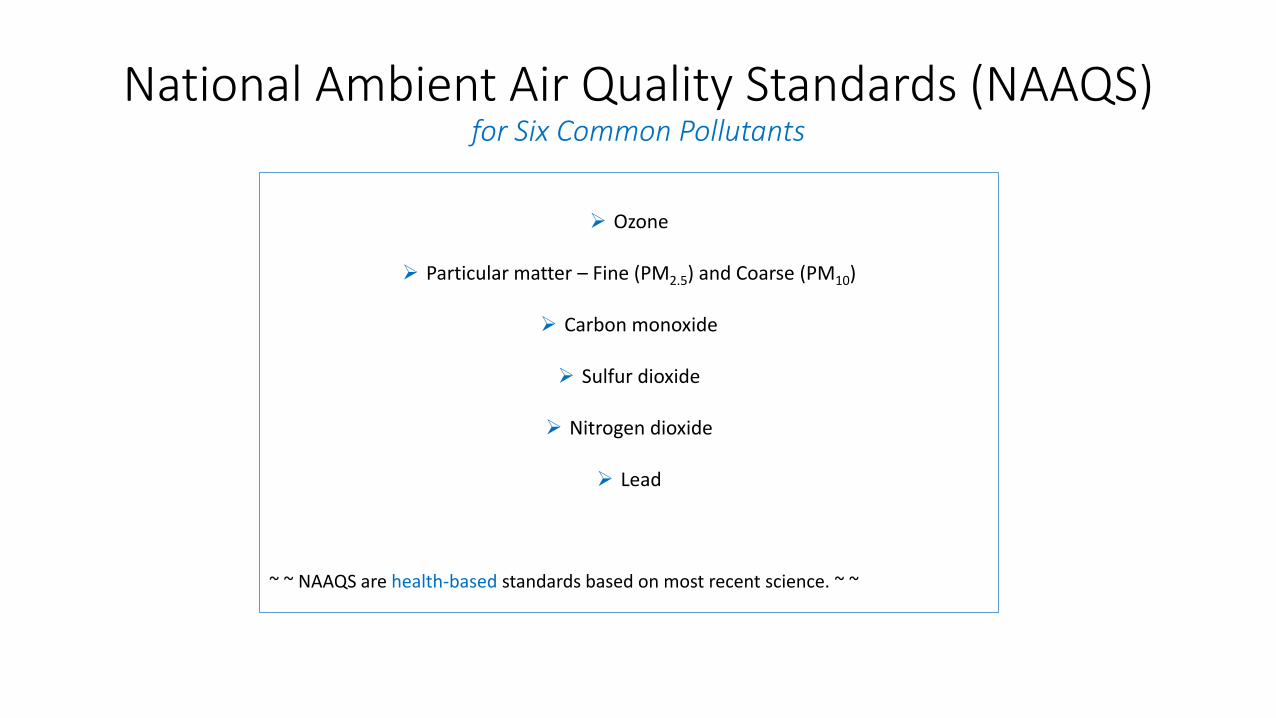
National Ambient Air Quality Standards (NAAQS) for Six Common Pollutants
Ozone
Particular matter – Fine (PM2.5) and Coarse (PM10)
Carbon monoxide
Sulfur dioxide
Nitrogen dioxide
Lead
~ ~ NAAQS are health-based standards based on most recent science. ~ ~

NAAQS and Nonattainment Areas
If an area exceeds (does not “attain”) the NAAQS …
“Nonattainment Area”
An area is nonattainment if it violates the NAAQS or contributes to a nearby area that violates.

1. Public health - Worst air quality in US • Population growth, topography & climate
2. Ports and goods movement corridors • Emissions from trains, trucks and ships
3. Major Industrial, Commercial, and
Agricultural Sources • Intractable problems requiring new
technologies
California’s Unique Challenges

Maps tell the story….

8-Hour Ozone Nonattainment Areas (2008)

24-Hour PM2.5 Nonattainment Areas

NAAQS are Updated Review air quality standards every 5 years.
Propose new standard (or range). Holds public hearings, public comment period. Finalize new standard.
2008 – Ozone standard set at 75 parts per billion (ppb)
After 2008 – Studies found 75 ppb not sufficiently protective of public health.
2015 – new Ozone standard at 70 ppb.
26

Recent NAAQS by Pollutant
Pollutant Year Level* Averaging Time
Ozone 2008 75 ppb 8-Hour
Ozone 2015 70 ppb 8-Hour
PM2.5 2012 12 μg/m3 Annual
PM2.5 2006 35 μg/m3 24-Hour
Sulfur Dioxide 2010 75 ppb 1-Hour
Lead 2008 0.15 μg/m3 Rolling 3-Month
Nitrogen Dioxide 2010 100 ppb 1-Hour
PM 10 1997 150 μg/m3 24-hour
27
* μg/m3 =micro grams per cubic meter; ppb = parts per billion http://www3.epa.gov/ttn/naaqs/criteria.html

2015 Ozone NAAQS
1. Where is the air quality problem? “Designation” 2. How bad is the problem? “Classification” 3. What are the requirements? “Implementation” 4. Here’s the Clean Air Plan. “State Implementation Plan” (SIP)
http://www3.epa.gov/ozonepollution/actions.html
28
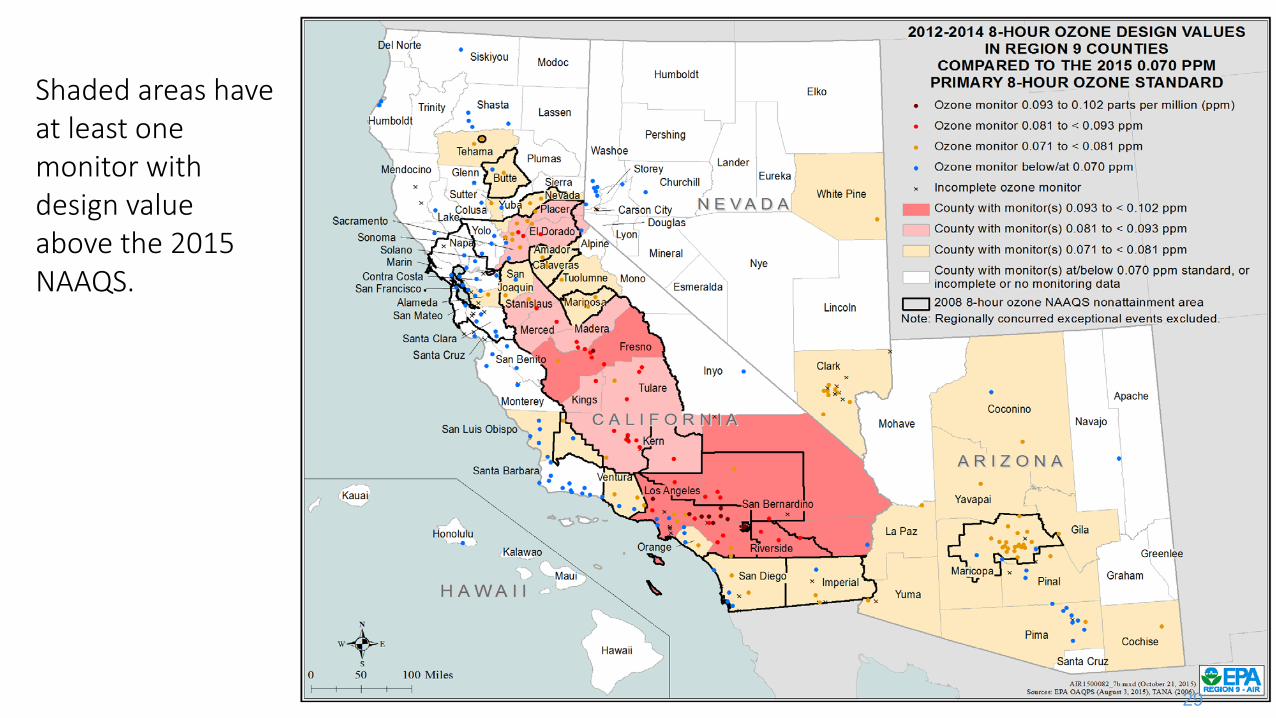
29
Shaded areas have at least one monitor with design value above the 2015 NAAQS.

Ask Fletcher for zoom in to central coast area
• Insert zoom in of mid-central valley and central coast area

Timeline for New Ozone Standard October 2015: Standard set at 70 ppb. (+1 year) October 2016: States/tribes recommend NAAs. (+ 1 year) October 2017: EPA designates nonattainment areas. Based on air monitoring data from 2014-2016. (+ 1.5 to 3 years) 2019-2021: SIPs due.
31

III. Agriculture and Air Quality

California Agriculture • Top Agricultural producer in the Nation - over $40 billion in annual production,
representing greater than 10% of the total U.S. ag output.
• Extreme product diversity - Ranked #1 in the U.S. for milk production, almonds, pistachios, broccoli, celery, dairy, avocados, hay, grapes, lettuce, onions, peaches, strawberries, tomatoes, walnuts, lettuce, plums, sweet potatoes…
Photo courtesy of Dennis Chessman USDA-NRCS
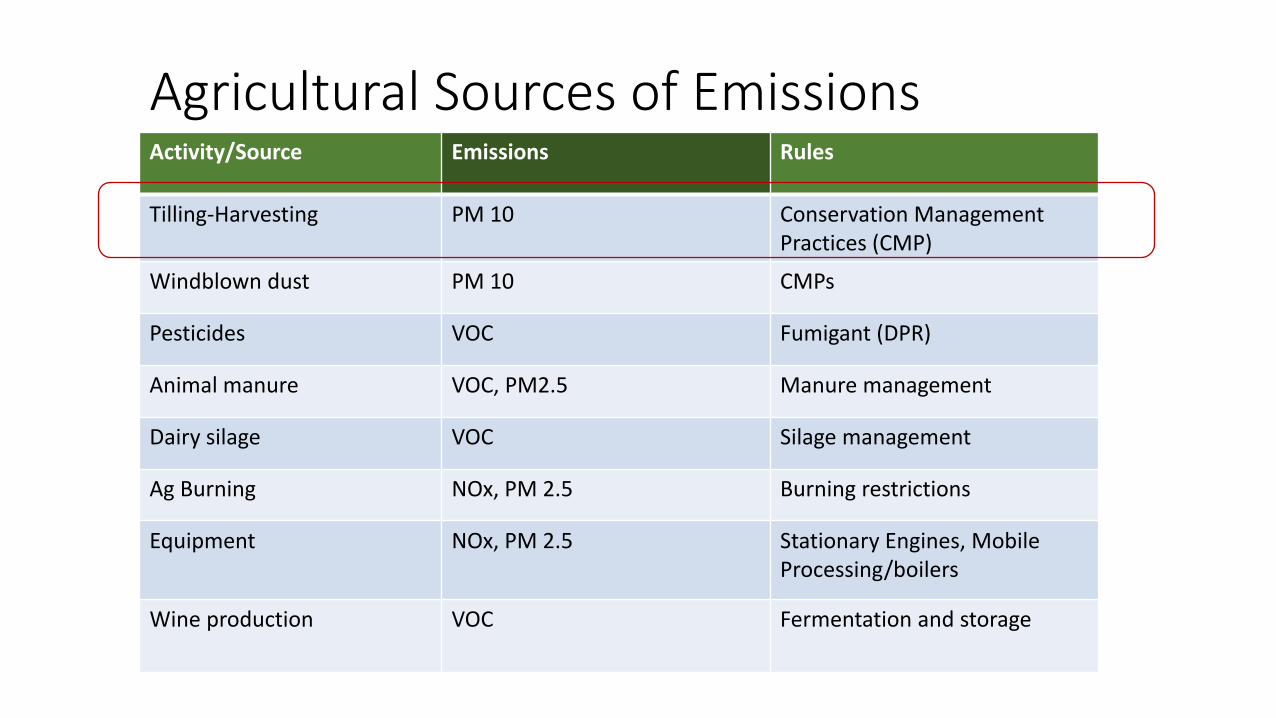
Agricultural Sources of Emissions Activity/Source Emissions Rules
Tilling-Harvesting PM 10 Conservation Management Practices (CMP)
Windblown dust PM 10 CMPs
Pesticides VOC Fumigant (DPR)
Animal manure VOC, PM2.5 Manure management
Dairy silage VOC Silage management
Ag Burning NOx, PM 2.5 Burning restrictions
Equipment NOx, PM 2.5 Stationary Engines, Mobile Processing/boilers
Wine production VOC Fermentation and storage

Sustainable agriculture is a win for public health
Regulatory tools
Non-regulatory tools
New technology and funding

1. Regulatory Tools
Rules can provide incentives to use sustainable practices such as conservation tillage and cover crops.

2. Non-regulatory tools – Soil Health
Farmer benefits
Reduced erosion, reduced compaction, increased
organic matter, better filtration, better irrigation
efficiency, improved biology, better yield, long-term
cost input savings, better drought resistance
Air Quality benefits
Reduced dust and equipment emissions, climate
benefit from increased carbon storage in soil.
USDA/Natural Resource Conservation Service
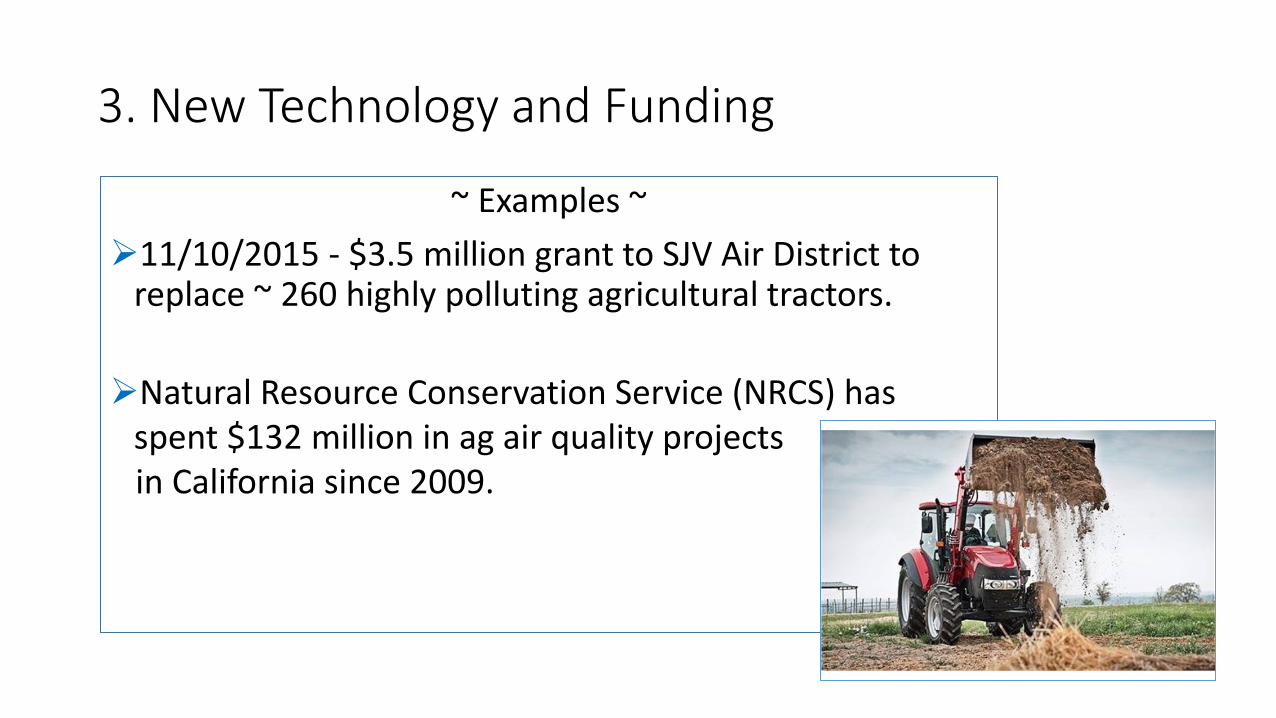
3. New Technology and Funding
~ Examples ~ 11/10/2015 - $3.5 million grant to SJV Air District to
replace ~ 260 highly polluting agricultural tractors. Natural Resource Conservation Service (NRCS) has
spent $132 million in ag air quality projects in California since 2009.

Summary Air Quality and Sustainable Ag
Air quality is important to everyone’s health.
We continue to make progress.
Sustainable Ag provides opportunity for cleaner air and
better bottom line.
How can we help? Please visit us: http://www3.epa.gov/region09/

Questions?