air force institute of technology - defense … · department of the air force air university ......
TRANSCRIPT

BIAXIAL (TENSION-TORSION) TESTING OF AN OXIDE/OXIDE CERAMIC
MATRIX COMPOSITE
THESIS
Joseph M. DeRienzo, Captain, USAF
AFIT-ENY-13-M-10
DEPARTMENT OF THE AIR FORCEAIR UNIVERSITY
AIR FORCE INSTITUTE OF TECHNOLOGY
Wright-Patterson Air Force Base, Ohio
DISTRIBUTION STATEMENT A:APPROVED FOR PUBLIC RELEASE; DISTRIBUTION UNLIMITED

The views expressed in this thesis are those of the author and do not reflect the officialpolicy or position of the United States Air Force, the Department of Defense, or the UnitedStates Government.
This material is declared a work of the U.S. Government and is not subject to copyrightprotection in the United States.
AFIT-ENY-13-M-10
BIAXIAL (TENSION-TORSION) TESTING OF AN OXIDE/OXIDE CERAMIC
MATRIX COMPOSITE
THESIS
Presented to the Faculty
Department of Aeronautics and Astronautics
Graduate School of Engineering and Management
Air Force Institute of Technology
Air University
Air Education and Training Command
in Partial Fulfillment of the Requirements for the
Degree of Master of Science in Materials Science
Joseph M. DeRienzo, B.S.
Captain, USAF
March 2013
DISTRIBUTION STATEMENT A:APPROVED FOR PUBLIC RELEASE; DISTRIBUTION UNLIMITED

AFIT-ENY-13-M-10
BIAXIAL (TENSION-TORSION) TESTING OF AN OXIDE/OXIDE CERAMIC
MATRIX COMPOSITE
Joseph M. DeRienzo, B.S.Captain, USAF
Approved:
Marina B. Ruggles-Wrenn, PhD (Chairman)
Thomas G. Eason, PhD (Member)
Gregory A. Schoeppner, PhD (Member)
Date
Date
Date

AFIT-ENY-13-M-10Abstract
High temperatures and structural loads in advanced aerospace structures often result
in complex loading conditions. This study is focused on biaxial (tension-torsion) testing
of an oxide-oxide porous matrix ceramic matrix composite (CMC) (NextelTM 720/AS) thin
wall tube with a novel involute layup. Tests included pure torsion and biaxial (tension-
torsion) loading. Strain gages were used in addition to digital image correlation (DIC)
to measure strains and to detect crack initiation and propagation. Room temperature and
1100C uniaxial tests were performed in a build up approach prior to biaxial (tension-
torsion) testing. Double-notch shear (DNS) specimens were tested at 1100C in air to
obtain interlaminar shear strength (ILSS).
iv

To my family and friends for their role in this non-trivial project. They all spent asignificant time listening and discussing my project with me over the entire project length.
Especially important among those was my fiancee who was my day-to-day support andlistening ear even as she piloted through her own difficult career and educational
endeavors, my mother and father whom, having both completed doctoral and masterslevel educations, respectively, gave advice that only a parent who has completed a
comparable level of education can give. Additionally, the love and support of my maternaland paternal grandparents has outlasted their natural lives and provided more inspiration
than I could ever have imagined. Especially important were my maternal grandfatherwhose love and encouragement through my undergraduate coursework has been a sourceof inspiration in my graduate level work and my paternal grandmother whose unwavering
love and support of all my endeavors, especially my mechanical and engineering ones,has meant more than I may ever realize.
v

Acknowledgments
This project would not have been possible without the opportunity from my advisor,
Dr. Marina Ruggles-Wrenn, and my sponsors at AFRL in Mr. Larry Zawada, Dr.
Eric Jones, and Dr. Craig Przybyla. My advisor and sponsors’ time in their own
educational opportunities and the work they have done in their post-educational endeavors
is remarkable and personally admirable. I sincerely appreciate them giving me an
opportunity to learn under their guidance.
I’d also like to publicly acknowledge the men of the AFIT Model Shop who dedicated
themselves to accomplishing non-standard, unusual, and oftentimes very difficult, risky,
and extremely time-intensive work required for test article machining, preparation, and
setup. Mr. Dan Ryan, Mr. Brian Crabtree, and Mr. Chris Hawkless all spent more time
than I ever could have asked them to have ever spent on my test articles. They are absolute
professionals and I regard their work, work ethic, and enthusiasm in very high regard. I
simply would not have taken off, let alone landed, without their power. I appreciate their
supervisor Jan LeValley for enabling Dan, Brian, and Chris to use their talents appropriately
on my project.
Additional thanks goes to Mr. Jay Anderson and Mr. Barry Page of AFIT and Mr.
Greg Walsh of MTS. Jay and Barry were instrumental in teaching me the use of the test
equipment, testing within the AFIT lab, and having a lab with functional test platforms and
test instrumentation. The true measure of their help is in getting my test equipment back
in order after malfunctions and test setup setbacks. Jay and Barry never took these lightly
and were always instrumental in making sure my test equipment was never the limiting
factor in my testing. I am grateful for Jay and Barry’s work in having and maintaining
such top notch facilities for these endeavors. Greg was a miracle worker getting the biaxial
vi

(tension-torsion) running after a computer failure and added the TTL capability to sync my
two instrumentation systems.
Mr. Chris Zickefoose, Mr. Wilbur Lacey, Mr. John Hixenbaugh, and Mr. Shaun Miller
all deserve thanks for assisting me with the seemingly endless small requests generated by
this project. Their assistance was just as important as anyone else in the project and they
helped despite my projects not being of their direct concern.
Additional support and discussions from Jennifer Pierce and Phil Blosser of UDRI
was extremely valuable.
I am sincerely appreciative of the astronomical amount of work put in to editing and
teaching me the finer details of Materials Science from Lt. Col. Tim Radsick, PhD. He
spent many hours putting aside many other important tasks to critique, edit, and discuss
my written content. From technical content enhancements, to writing style tweaks and
everything in between, I am far more appreciative than I could put into words on a page.
In addition to project sponsorship, Mr. Larry Zawada, Dr. Eric Jones, Dr.
Craig Przybyla, and Dr. George Jefferson at AFRL also devoted time to enhance my
understanding and provide valuable edits and critiques to my manuscript. This writing
and my work was far better because of your effort and support.
Thanks is also due to Drs. Thomas G. Eason and Gregory A. Schoeppner who took
the time to give my work a discerning evaluation.
I am grateful to all of these professionals and their willingness to educate me in the
art and science of materials engineering. These words fall short of my true indebtedness.
It would be an honor for my professional endeavors to allow me to cross paths with these
professionals in the future.
Joseph M. DeRienzo
vii

Table of Contents
Page
Abstract . . . . . . . . . . . . . . . . . . . . . . . . . . . . . . . . . . . . . . . . . iv
Dedication . . . . . . . . . . . . . . . . . . . . . . . . . . . . . . . . . . . . . . . . v
Acknowledgments . . . . . . . . . . . . . . . . . . . . . . . . . . . . . . . . . . . . vi
Table of Contents . . . . . . . . . . . . . . . . . . . . . . . . . . . . . . . . . . . . viii
List of Figures . . . . . . . . . . . . . . . . . . . . . . . . . . . . . . . . . . . . . . x
List of Tables . . . . . . . . . . . . . . . . . . . . . . . . . . . . . . . . . . . . . . xviii
List of Symbols . . . . . . . . . . . . . . . . . . . . . . . . . . . . . . . . . . . . . xix
List of Acronyms . . . . . . . . . . . . . . . . . . . . . . . . . . . . . . . . . . . . xx
I. Introduction . . . . . . . . . . . . . . . . . . . . . . . . . . . . . . . . . . . . . 1
II. Background . . . . . . . . . . . . . . . . . . . . . . . . . . . . . . . . . . . . . 5
2.1 Ceramic Matrix Composites . . . . . . . . . . . . . . . . . . . . . . . . . 52.2 Fibers . . . . . . . . . . . . . . . . . . . . . . . . . . . . . . . . . . . . . 62.3 Matrix . . . . . . . . . . . . . . . . . . . . . . . . . . . . . . . . . . . . . 62.4 Methods to Increase Fracture Toughness . . . . . . . . . . . . . . . . . . . 82.5 Oxide/Oxide ceramic matrix composites (CMCs) . . . . . . . . . . . . . . 102.6 Previous Biaxial (Tension-Torsion) Research on Oxide-Oxide Thin-Wall
Tubes . . . . . . . . . . . . . . . . . . . . . . . . . . . . . . . . . . . . . 122.7 Thesis Objective . . . . . . . . . . . . . . . . . . . . . . . . . . . . . . . 13
III. Test Material and Specimen Geometry . . . . . . . . . . . . . . . . . . . . . . . 14
3.1 Uniaxial Specimens . . . . . . . . . . . . . . . . . . . . . . . . . . . . . . 143.2 Double-Notch Shear (DNS) Specimens . . . . . . . . . . . . . . . . . . . 213.3 Thin-Wall Tube Specimens . . . . . . . . . . . . . . . . . . . . . . . . . . 25
IV. Experimental Setup and Procedures . . . . . . . . . . . . . . . . . . . . . . . . 30
4.1 Room Temperature Uniaxial Tests . . . . . . . . . . . . . . . . . . . . . . 30
viii

Page
4.1.1 Aluminum Alloy Dogbone Specimen Testing . . . . . . . . . . . . 314.1.2 NextelTM 720/AS Dogbone Specimen Testing . . . . . . . . . . . . 334.1.3 NextelTM 720/AS Straightsided Specimen Testing . . . . . . . . . . 34
4.2 Room Temperature Uniaxial Tests with Digital Image Correlation (DIC) . . 344.3 Elevated Temperature (1100C) Uniaxial NextelTM 720/AS Dogbone and
Straightsided Specimen Testing . . . . . . . . . . . . . . . . . . . . . . . . 384.4 Elevated Temperature (1100C) Uniaxial NextelTM 720/AS Double Notch
Shear (DNS) Specimen Testing . . . . . . . . . . . . . . . . . . . . . . . . 404.5 Biaxial Tests . . . . . . . . . . . . . . . . . . . . . . . . . . . . . . . . . . 454.6 Biaxial (Tension-Torsion) Test Method . . . . . . . . . . . . . . . . . . . . 56
4.6.1 Build Up Approach . . . . . . . . . . . . . . . . . . . . . . . . . . 564.6.2 Digital Image Correlation (DIC) . . . . . . . . . . . . . . . . . . . 574.6.3 Challenges and Objectives . . . . . . . . . . . . . . . . . . . . . . 58
V. Results and Discussion . . . . . . . . . . . . . . . . . . . . . . . . . . . . . . . 67
5.1 Dogbone Specimens . . . . . . . . . . . . . . . . . . . . . . . . . . . . . 705.1.1 Monotonic Loading Tests . . . . . . . . . . . . . . . . . . . . . . 705.1.2 Sequentially Loaded Tension Tests . . . . . . . . . . . . . . . . . . 71
5.2 Straightsided Specimens . . . . . . . . . . . . . . . . . . . . . . . . . . . 765.3 Double-Notch Shear (DNS) Specimens . . . . . . . . . . . . . . . . . . . 785.4 Thin-Wall Tube Specimens . . . . . . . . . . . . . . . . . . . . . . . . . . 86
VI. Conclusions and Recommendations . . . . . . . . . . . . . . . . . . . . . . . . 102
Appendix A . . . . . . . . . . . . . . . . . . . . . . . . . . . . . . . . . . . . . . . 124
Bibliography . . . . . . . . . . . . . . . . . . . . . . . . . . . . . . . . . . . . . . 126
Vita . . . . . . . . . . . . . . . . . . . . . . . . . . . . . . . . . . . . . . . . . . . 131
ix

List of Figures
Figure Page
2.1 CMC nail test damage tolerance demonstration[13] . . . . . . . . . . . . . . . 5
2.2 Typical composite cross section [15] . . . . . . . . . . . . . . . . . . . . . . . 7
2.3 Typical service temperatures for polymers, metals, and ceramics [13] . . . . . . 8
2.4 Mechanisms for increasing damage tolerance: a) conventional weak fiber
interface in dense matrix b) porous matrix concept with strong fiber interface[48] 9
2.5 CMC turbine engine exhaust nozzle and centerbody (Courtesy Boeing) . . . . . 11
3.1 NextelTM 720/AS Dogbone and Straightsided Specimen Layups . . . . . . . . 15
3.2 Prepreg processing steps of NextelTM 720/AS composite . . . . . . . . . . . . 16
3.3 NextelTM 720/AS dogbone (left) and straightsided (right) specimens . . . . . . 17
3.4 NextelTM 720/AS dogbone specimen geometry specifications . . . . . . . . . . 17
3.5 NextelTM 720/AS dogbone ply (0 fiber dominated) layup (side view) . . . . . 18
3.6 NextelTM 720/AS straightsided ply (90 matrix dominated) layup (side view) . . 19
3.7 NextelTM 720/AS straightsided specimen geometry specifications . . . . . . . . 20
3.8 M-Bond 200 Adhesive and Catalyst . . . . . . . . . . . . . . . . . . . . . . . 20
3.9 Baseline NextelTM 720/AS Balanced 0/90 plate . . . . . . . . . . . . . . . . 21
3.10 NextelTM 720/AS double-notch shear (DNS) ply layup (side view) . . . . . . . 23
3.11 American Society for Testing and Materials (ASTM) C1425-11 DNS specimen
geometry. Reproduced from [9] . . . . . . . . . . . . . . . . . . . . . . . . . 24
3.12 Biaxial (tension-torsion) thin-wall involute tube specimen layup . . . . . . . . 25
3.13 Aluminum alloy grip support plug inserts with nominal dimensions in inches . 28
4.1 MTS 3 kip loadframe . . . . . . . . . . . . . . . . . . . . . . . . . . . . . . . 31
4.2 Dogbone and straightsided specimen load spreadsheet . . . . . . . . . . . . . . 33
4.3 Example stochastic, or random, speckle pattern for use with DIC . . . . . . . . 35
x

Figure Page
4.4 Gesellschaft fur Optische Messtechnik (GOM) 65x52mm DIC calibration panel 36
4.5 Sequentially-loaded dogbone tension test profile . . . . . . . . . . . . . . . . . 38
4.6 Temperature calibration specimen setup with piano wire wound around two
CMC pieces securing thermocouple beads on DNS specimen used to determine
setpoints for 1100C testing in air and steam . . . . . . . . . . . . . . . . . . . 39
4.7 DNS load spreadsheet . . . . . . . . . . . . . . . . . . . . . . . . . . . . . . . 41
4.8 MTS 5 kip high-temperature loadframe . . . . . . . . . . . . . . . . . . . . . 41
4.9 MTS 409.83 Temperature Controller . . . . . . . . . . . . . . . . . . . . . . . 42
4.10 Omega CL3515A digital, hand thermometer during temperature calibration . . 43
4.11 Alumina susceptor used for high temperature (1100C) steam testing assem-
bled (L) and disassembled (R) . . . . . . . . . . . . . . . . . . . . . . . . . . 44
4.12 AMTECO HRFS-STMGEN Steam Generation System . . . . . . . . . . . . . 45
4.13 MTS 809 Axial-Torsional Testing System . . . . . . . . . . . . . . . . . . . . 46
4.14 NextelTM 720/AS thin-wall involute tube specimen with strain gage alignment
mark (above) and specifications (below) . . . . . . . . . . . . . . . . . . . . . 47
4.15 Oxide-oxide CMC involute tube strain gage locations . . . . . . . . . . . . . . 48
4.16 Strain gage locations (dimensions in inches) . . . . . . . . . . . . . . . . . . . 49
4.17 Bank of Vishay 2310 rack-mounted strain gage signal conditioning amplifiers . 50
4.18 Quarter-bridge strain gage setup[1] . . . . . . . . . . . . . . . . . . . . . . . . 51
4.19 Wire jumpers to signal conditioning amplifiers . . . . . . . . . . . . . . . . . . 52
4.20 MIL-C-26482 standard connector pin arrangement to signal conditioning
amplifiers[1] . . . . . . . . . . . . . . . . . . . . . . . . . . . . . . . . . . . . 52
4.21 Wiring diagram from strain gage to MIL-C-26482 standard connector pin[1] . . 53
4.22 Standard sieves used for brushing black laser printer toner powder through for
uniform stochastic speckle patterns . . . . . . . . . . . . . . . . . . . . . . . . 54
xi
Figure Page
4.23 Laser printer toner speckling procedure on involute oxide-oxide CMC tube . . 54
4.24 Laser printer toner speckling on involute oxide-oxide CMC tube NOTE: this
pattern was not used . . . . . . . . . . . . . . . . . . . . . . . . . . . . . . . . 55
4.25 Aluminum alloy grip support plug inserts custom machined to each tube end
to prevent grip section crushing during alumina and oxide-oxide CMC tension-
torsion testing . . . . . . . . . . . . . . . . . . . . . . . . . . . . . . . . . . . 59
4.26 Biaxial (tension-torsion) grip pressure estimation spreadsheet developed from
MTS provided grip estimation algorithms and constants . . . . . . . . . . . . . 61
4.27 Biaxial (tension-torsion) load spreadsheet with independent axial load and
torsion torque calculations. . . . . . . . . . . . . . . . . . . . . . . . . . . . . 62
5.1 Biaxial (tension-torsion) failure envelope comparison . . . . . . . . . . . . . . 69
5.2 Stress vs. Strain curves obtained in monotonic tension tests of NextelTM
720/AS dogbone-shaped specimens . . . . . . . . . . . . . . . . . . . . . . . 71
5.3 Fracture surface of NextelTM 720/AS dogbone specimen 12-113 tested in
monotonic tension to failure at 1100C in laboratory air, top, right side . . . . . 72
5.4 Biaxial (tension-torsion) failure envelope with dogbone ultimate tensile
strength (UTS) point . . . . . . . . . . . . . . . . . . . . . . . . . . . . . . . 73
5.5 Stress vs. Strain curves without hysteresis removed obtained in sequentially
loaded tension tests of NextelTM 720/AS dogbone-shaped specimens . . . . . . 74
5.6 NextelTM 720/AS dogbone specimen just before failure . . . . . . . . . . . . . 74
5.7 NextelTM 720/AS dogbone specimen just after failure . . . . . . . . . . . . . . 75
5.8 Stress vs. Strain curves obtained in tension test of NextelTM 720/AS
straightsided specimens 12-098, 12-099, and 12-106 . . . . . . . . . . . . . . 77
5.9 Biaxial (tension-torsion) failure envelope with monotonic UTS and ultimate
shear strength (USS) . . . . . . . . . . . . . . . . . . . . . . . . . . . . . . . 78
xii

Figure Page
5.10 ABS Shear Stress vs. ABS Strain curves obtained in compression test of
NextelTM 720/AS DNS specimens 1, 2, and 3 at 1100C . . . . . . . . . . . . . 80
5.11 Biaxial (tension-torsion) failure envelope with monotonic UTS, USS, and
interlaminar shear strength (ILSS) values . . . . . . . . . . . . . . . . . . . . 81
5.12 DNS creep runout stress estimation spreadsheet with curve fit to 6, 5, and
5 MPa to estimate runout at 360,000 seconds (100 hours) used for NextelTM
720/AS in air at 1100C . . . . . . . . . . . . . . . . . . . . . . . . . . . . . 82
5.13 ABS Strain vs. Time curve for interlaminar shear creep tests on NextelTM
720/AS in air at 1100C . . . . . . . . . . . . . . . . . . . . . . . . . . . . . . 83
5.14 6 MPa ABS Strain vs. Time curve comparison of interlaminar shear creep tests
on NextelTM 720/AS in air and steam at 1100C . . . . . . . . . . . . . . . . . 83
5.15 DNS Specimen 1 ILSS of NextelTM 720/AS in air at 1100C . . . . . . . . . . 84
5.16 DNS Specimen 9 interlaminar creep of NextelTM 720/AS in air (top) and steam
(bottom) at 1100C . . . . . . . . . . . . . . . . . . . . . . . . . . . . . . . . 84
5.17 DNS specimen 12 left side notch undercut by 51.19µm - specimen failed
unsatisfactorily under 4 MPa creep load at 1100C in steam . . . . . . . . . . . 85
5.18 DNS specimen 12 right side cut to specification - specimen failed unsatisfac-
torily under 4 MPa creep load at 1100C in steam . . . . . . . . . . . . . . . . 85
5.19 Shear stress vs. shear strain for NextelTM 720/AS oxide-oxide involute tube
specimen 12-063 in pure torsion . . . . . . . . . . . . . . . . . . . . . . . . . 87
5.20 Qualitative crack distance to left, center, and right rosettes (from left to right)
explaining differences in measured shear strains in NextelTM 720/AS oxide-
oxide involute tube specimen 12-063 in pure torsion . . . . . . . . . . . . . . . 88
5.21 Aramis DIC showing crack propagation in NextelTM 720/AS oxide-oxide
involute tube specimen 12-063 in pure torsion . . . . . . . . . . . . . . . . . . 90
xiii

Figure Page
5.22 NextelTM 720/AS oxide-oxide involute tube specimen 12-063 in pure torsion . . 91
5.23 Involute Ply Failure - NextelTM 720/AS oxide-oxide involute tube specimen
12-063 in pure torsion . . . . . . . . . . . . . . . . . . . . . . . . . . . . . . . 91
5.24 Closeup of NextelTM 720/AS oxide-oxide involute tube specimen 12-063
fracture damage from pure torsion . . . . . . . . . . . . . . . . . . . . . . . . 92
5.25 Biaxial (tension-torsion) failure envelope with monotonic UTS and USS, ILSS,
and actual value of in-plane shear stress as seen in the pure torsion to failure
oxide-oxide CMC involute tube test . . . . . . . . . . . . . . . . . . . . . . . 93
5.26 Axial and shear stresses vs. shear strain for NextelTM 720/AS oxide-oxide
involute tube specimen 12-064 - biaxial loads to failure - failed in torsion . . . 94
5.27 Shear stresses vs. shear strain (expanded) for NextelTM 720/AS oxide-oxide
involute tube specimen 12-064 - biaxial loads to failure - failed in torsion . . . 95
5.28 NextelTM 720/AS oxide-oxide involute tube specimen 12-064 - biaxial loads to
failure - failed in torsion . . . . . . . . . . . . . . . . . . . . . . . . . . . . . 96
5.29 NextelTM 720/AS oxide-oxide involute tube specimen 12-064 - biaxial loads to
failure - failed in torsion . . . . . . . . . . . . . . . . . . . . . . . . . . . . . 97
5.30 NextelTM 720/AS oxide-oxide involute tube specimen 12-064 just after failure
- biaxial loads to failure - failed in torsion . . . . . . . . . . . . . . . . . . . . 98
5.31 DIC measured strains of individual fiber tows on NextelTM 720/AS oxide-oxide
involute tube specimen 12-064 - biaxial loads to failure - failed in torsion . . . 98
5.32 DIC measured strains of individual fiber tows on NextelTM 720/AS oxide-oxide
involute tube specimen 12-064 - biaxial loads to failure - failed in torsion . . . 99
5.33 Distance between warps in 8H NextelTM 720 satin weave used in NextelTM
720/AS involute layup . . . . . . . . . . . . . . . . . . . . . . . . . . . . . . 99
xiv

Figure Page
5.34 Damage of NextelTM 720/AS oxide-oxide involute tube specimen 12-064
similar to that of dogbone specimen in Figure 5.3 - biaxial loads to failure -
failed in torsion . . . . . . . . . . . . . . . . . . . . . . . . . . . . . . . . . . 100
5.35 Failure site damage in NextelTM 720/AS oxide-oxide involute tube specimen
12-064 - biaxial loads to failure - failed in torsion . . . . . . . . . . . . . . . . 100
5.36 Failure envelope of an oxide-oxide CMC thin-wall involute tube . . . . . . . . 101
6.1 MTS Station Manager straightsided specimen room temperature displacement
to failure procedure . . . . . . . . . . . . . . . . . . . . . . . . . . . . . . . . 104
6.2 NextelTM 720/AS DNS ILSS monotonic compression to failure test procedures 105
6.3 NextelTM 720/AS DNS interlaminar shear creep test procedures . . . . . . . . . 106
6.4 Room temperature uniaxial test incorporating DIC . . . . . . . . . . . . . . . . 107
6.5 Elevated temperature (1100C) uniaxial NextelTM 720/AS dogbone specimen
test procedure . . . . . . . . . . . . . . . . . . . . . . . . . . . . . . . . . . . 108
6.6 Elevated temperature (1100C) uniaxial NextelTM 720/AS straightsided speci-
men test procedure . . . . . . . . . . . . . . . . . . . . . . . . . . . . . . . . 109
6.7 MTS Station Manager oxide-oxide CMC involute tube monotonic torsion to
failure procedure with Aramis DIC 1/sec trigger . . . . . . . . . . . . . . . . . 110
6.8 MTS Station Manager oxide-oxide CMC involute tube biaxial (tension-
torsion) to failure procedure with Aramis DIC 1/sec trigger . . . . . . . . . . . 111
6.9 DNS specimens before cleaning . . . . . . . . . . . . . . . . . . . . . . . . . 112
6.10 DNS specimens during first cleaning . . . . . . . . . . . . . . . . . . . . . . . 112
6.11 DNS specimens after first cleaning . . . . . . . . . . . . . . . . . . . . . . . . 113
6.12 DNS specimens during 25 minute ultrasonic acetone bath . . . . . . . . . . . . 113
6.13 Side 1 of DNS specimens before 100C 16 hour bakeout . . . . . . . . . . . . 114
6.14 Side 2 of DNS specimens before 100C 16 hour bakeout . . . . . . . . . . . . 114
xv

Figure Page
6.15 DNS specimen bakeout furnace . . . . . . . . . . . . . . . . . . . . . . . . . . 115
6.16 DNS specimens bakeout setup . . . . . . . . . . . . . . . . . . . . . . . . . . 115
6.17 Dogbone Specimen 12-109 - 0 involute layup - 1100C in air - NextelTM 720/AS116
6.18 Dogbone Specimen 12-111 - 0 involute layup - 1100C in air - NextelTM 720/AS116
6.19 Dogbone Specimen 12-113 - 0 involute layup - 1100C in air - NextelTM 720/AS117
6.20 Dogbone Specimen 12-110 - 0 involute layup - room temperature in air -
NextelTM 720/AS . . . . . . . . . . . . . . . . . . . . . . . . . . . . . . . . . 117
6.21 Dogbone Specimen 12-112 - 0 involute layup - DIC test at room temperature
in air - NextelTM 720/AS . . . . . . . . . . . . . . . . . . . . . . . . . . . . . 118
6.22 Straightsided Specimen 12-098 - 90 involute layup - DIC test at room
temperature in air - NextelTM 720/AS . . . . . . . . . . . . . . . . . . . . . . . 118
6.23 Straightsided Specimen 12-106 - 90 involute layup - room temperature in air
- NextelTM 720/AS . . . . . . . . . . . . . . . . . . . . . . . . . . . . . . . . 119
6.24 Straightsided Specimen 12-099 - 90 involute layup - 1100C in air - NextelTM
720/AS . . . . . . . . . . . . . . . . . . . . . . . . . . . . . . . . . . . . . . 119
6.25 Straightsided Specimen 12-100 - 90 involute layup - 1100C in air - NextelTM
720/AS . . . . . . . . . . . . . . . . . . . . . . . . . . . . . . . . . . . . . . 120
6.26 DNS Specimen 2 - ILSS test at 1100C in air - NextelTM 720/AS . . . . . . . . 120
6.27 DNS Specimen 3 - ILSS test at 1100C in air - NextelTM 720/AS . . . . . . . . 121
6.28 DNS Specimen 4 - interlaminar creep at 1100C in air - 6 MPa - NextelTM
720/AS - failed . . . . . . . . . . . . . . . . . . . . . . . . . . . . . . . . . . 121
6.29 DNS Specimen 6 - interlaminar creep at 1100C in air - 5 MPa - NextelTM 720/AS122
6.30 DNS Specimen 7 - interlaminar creep at 1100C in air - 4 MPa - NextelTM 720/AS122
6.31 DNS Specimen 8 - interlaminar creep at 1100C in air - 2 MPa - NextelTM 720/AS123
xvi

Figure Page
6.32 DNS Specimen 10 - interlaminar creep at 1100C in steam - 6 MPa - NextelTM
720/AS . . . . . . . . . . . . . . . . . . . . . . . . . . . . . . . . . . . . . . 123
6.33 DNS Specimen 11 - interlaminar creep at 1100C in steam - 6 MPa - NextelTM
720/AS . . . . . . . . . . . . . . . . . . . . . . . . . . . . . . . . . . . . . . 124
6.34 DNS Specimen 12 - interlaminar creep at 1100C in steam - 6 MPa - NextelTM
720/AS . . . . . . . . . . . . . . . . . . . . . . . . . . . . . . . . . . . . . . 124
6.35 DNS Specimen 13 - NextelTM 720/AS - failed prior to testing . . . . . . . . . . 125
xvii

List of Tables
Table Page
2.1 Mechanical properties of NextelTM 720 fibers[2] . . . . . . . . . . . . . . . . . 11
2.2 Properties of the NextelTM 720/AS composite used in this research[2] . . . . . 12
3.1 Values for Figure 3.11 . . . . . . . . . . . . . . . . . . . . . . . . . . . . . . . 24
3.2 Specifications and tolerances for CoorsTek AD-998 alumina tubes . . . . . . . 27
4.1 GOM 65x52mm DIC calibration panel specifications . . . . . . . . . . . . . . 36
5.1 Summary of dogbone (0) specimen tests . . . . . . . . . . . . . . . . . . . . 70
5.2 Summary of straightsided (90) specimen tests . . . . . . . . . . . . . . . . . . 76
5.3 Summary of DNS Specimen Tests . . . . . . . . . . . . . . . . . . . . . . . . 79
5.4 Summary of oxide-oxide CMC involute tube specimen tests . . . . . . . . . . 86
xviii

List of Symbols
Symbol Definition
µε ∆LL0
x10−6 (microstrain)
Ω resistance (Ohms)
kip 1,000 pounds-force
xix

List of Acronyms
Acronym Definition
ABS absolute value
AFIT Air Force Institute of Technology
AFRL Air Force Research Laboratory
alumina Al2O3
aluminosilicate Al2SiO5
ASTM American Society for Testing and Materials
CMC ceramic matrix composite
CNC Computer Numerically Controlled
COI Composite Optics, Inc.
DIC Digital Image Correlation
DNS double-notch shear
EBC environmental barrier coatings
FEA finite element analysis
FOV field of view
GOM Gesellschaft fur Optische Messtechnik
ILSS interlaminar shear strength
PMC polymer matrix composite
SCA Signal Conditioning Amplifier
SiC silicon carbide
SiC-SiC Silicon Carbide-Silicon Carbide
UDRI University of Dayton Research Institute
USS ultimate shear strength
UTS ultimate tensile strength
xx

BIAXIAL (TENSION-TORSION) TESTING OF AN OXIDE/OXIDE CERAMIC
MATRIX COMPOSITE
I. Introduction
C omposite materials combine multiple material phases into a material system
designed to execute a desirable performance characteristic or set of characteristics.
If designed properly, the sum properties of the phases exceed those of the constitutive
parts[8]. The phase of material that is continuous throughout the material is referred to
as the matrix. The matrix serves as a binder to hold the composite together in addition
to providing a mechanism for load transfer to the reinforcement. The reinforcement is
discontinuous through the composite and provides the main load-bearing capability. The
interaction of the two (or more) phases takes place in the interface. The interface can be
controlled through an interphase, often applied to the reinforcement, to achieve a desired
interface between the matrix and reinforcement. An interphase, however, is not required
present in a composite. The reinforcement and matrix and the interface can be engineered
to achieve different macroscopic material properties. Processing, layup, and construction
of phases into a composite often have more influence on macroscopic system material
properties than the constitutive materials themselves[15].
Many modern aerospace, energy, automotive and biomedical engineering systems
require components capable of withstanding harsh environments like those found in parts
of gas turbine engines, nuclear power plants, the human body, and internal combustion
engines[44][47][18]. Advanced gas turbine engines have already attained steady-state
combustor temperatures of 1316C. Under these conditions, one or more advanced cooling
techniques such as louver, convection/film, film, impingement/film cooling, and thermal
1

barrier coatings are required to protect individual components currently made out of metal
superalloys. Cooling effectiveness, φ, is defined in Equation (1.1) where Tg, Tm, and Tc are
defined as mainstream gas, average metal, and cooling air temperatures. One superalloy
found in combustor liners is Hastelloy X whose solid-phase upper limit is 982C. If
cooling air temperature is 649C, per Equation (1.1), a combustor liner of Hastelloy X
would have a cooling effectiveness of 0.5. Increasing mainstream gas temperature would
increase overall turbine engine efficiency. To maintain the same cooling effectiveness
with higher mainstream gas temperature, either average metal temperature must go up or
cooling temperature must go down. Materials with higher upper temperature limits as
well as abilities to withstand highly corrosive environments seen in turbine engines could
increase operational temperatures of advanced turbine engines. Additionally, materials
with higher upper temperature limits could reduce demands for turbine engine component
cooling air[27]. Increasing overall turbine engine temperatures could increase overall
engine efficiencies, thus, reducing fuel consumption and allow for greater design flexibility
of engine airflow [13].
φ =Tg − Tl
Tg − Tc(1.1)
Ceramic materials offer higher temperatures and strength-to-weight ratios over metal
super alloys while maintaining corrosive resistance. Disadvantages of ceramics, however,
include brittleness and porosity including microscopic cracks inherent to monolithic
ceramics. One promising candidate material class for use in high-temperature aerospace
environments is CMCs. CMCs offer the advantages of high temperature ratings and
high strength-to-weight ratio inherent to engineering ceramics with an increased fracture
toughness reducing brittleness and unanticipated catastrophic failures[16].
Oxidating environments can present service limiting conditions for certain CMCs.
Sources have observed performance degradations in certain CMCs like Silicon Carbide-
2

Silicon Carbide (SiC-SiC). To obtain extended service lifetimes with these oxidation-prone
CMCs environmental barrier coatings (EBC) must be implemented[44]. The EBC prevents
mechanical performance degradation due to oxidation[12]. Coatings increase the cost of
CMC manufacture. All oxide materials provide high temperature, high strength-to-weight
ratio, and oxidation resistant properties without the use of coatings [43].
One candidate oxide-oxide CMC commonly investigated for application in high
temperature oxidizing aerospace applications is NextelTM 720 fiber (3M, St. Paul MN)
deposited in an oxide Al2SiO5 (aluminosilicate) matrix with no fiber-matrix interface
coating. NextelTM 720/AS is the focus of the present study. The oxide NextelTM 720
reinforcement has a chemical composition of 85% Al2O3 and 15% SiO2 (by weight) and is
rated to 1200C [30]. The NextelTM 720/AS oxide-oxide CMC has an upper temperature
limit of 1100C limited by the aluminosilicate matrix [3]. The upper temperature limit of
NextelTM 720/AS is achieved with a density 2.60 g/cm3 which is over three times less than
the density of Hastelloy X at 8.22 g/cm3.
A novel involute oxide-oxide CMC layup using fiber tapes has been developed by
Composite Optics, Inc. (COI) Ceramics. According to COI Ceramics, this material layup
exhibits efficiencies in processing resources, little to no ply wrinkling, a fine microstructure,
and excellent machinability. This advancement in the processability of CMCs could enable
more widespread use by reducing machining tolerances and manufacture of potential parts.
The goal of the present study is to investigate the porous matrix oxide-oxide CMC
thin-wall involute tube under pure torsion and proportionally loaded tension-torsion. These
studies will demonstrate procedures and produce preliminary results used for future testing
and engineering component designs for advanced high-temperature aerospace structures.
Procedures were developed through uniaxial tensile tests both in a 0 and 90 fiber-
dominated orientation out of an involute panel in laboratory air at room and elevated
temperatures (1100C). Additional experimentation tested interlaminar shear properties of
3

a baseline balanced 0/90 layup from an eight harness satin weave also in laboratory air
and steam both at elevated temperatures (1100C). Involute CMC layups were tested to
further the understanding of a complex loading condition for future design considerations.
Strain gages, in both linear and rectangular rosette gages, were used. GOM Aramis DIC
software, a full-field displacement and strain measurement technique was also used to
detect crack initiation and crack propagation. DIC utilizes a stochastic or random speckle
pattern applied through various techniques such as commercially available spray paint, air
brushing, or laser toner ink powder on the test article. DIC data can be used to verify and
validate predictive computational models, such as finite element analysis (FEA), with its
full field measurement capability.
4

II. Background
2.1 Ceramic Matrix Composites
M onolithic ceramics often have strengths much greater than high-strength alloys, but
their use in structural applications is limited by their brittle and damage intolerant
nature. CMCs are tougher and more damage tolerant. A ”nail test” illustrates the damage
tolerant nature of CMCs. An attempt to drive a nail through a monolithic ceramic would
result in catastrophic failure. The same nail driven through a CMC is more likely to be
supported in a similar fashion to a nail driven through wood as seen in Figure 2.1. The
fibers and matrix are able to keep damage localized near the nail penetration site similar to
that of wood. Damage tolerant behaviors have led to the more widespread use of CMCs in
advanced high-temperature engineering applications[43].
Figure 2.1: CMC nail test damage tolerance demonstration[13]
5

2.2 Fibers
Composite stiffness and strength is determined in large part by the configuration of
the fiber reinforcement and fiber volume. Fiber reinforcement can be in the form of
chopped fibers, whiskers, or continuous fibers either in unidirectional continuous, crossply
or fabric, or multidirectional fiber composite [15]. Fibers possess higher flexibility and
higher strength over the same bulk material phase in non-fiber form due to their small cross-
section and high aspect ratio. Flaw size in fibers must inherently be smaller smaller than
the fiber itself. The high aspect ratio allows for weaving fibers into fabric. Fabrics can be
woven to obtain a desired flexibility which in turn affects the overall stiffness of the resultant
fabric. Fabric weave influences composite matrix porosity. A plain or basket weave results
in a stiffer fabric which usually increases matrix porosity within the composite while a
satin weave in the common form of eight or five harness (8H or 5H) fabric is more flexible
and usually reduces matrix porosity within the composite. The flexibility of the weave is
influential in parts forming. Parts that require complex shapes can benefit from weaves
that can be easily formed or draped into molds. Fibers can be made from polymers, metals
or ceramics. Several ceramic fibers commercially available and used today include silicon
carbide (SiC) and Al2O3 (alumina) available in under the Sylramic TM, Nicalon TM, and
NextelTM brand names[13].
2.3 Matrix
Matrix serves to protect and support the fiber reinforcement as well as transfer loads
between fibers[15]. The fiber-to-fiber load transfer mechanism provided by the matrix plays
a major role in the load-bearing properties of the composite. A cross section of a composite
is shown in Figure 2.2.
Many composites currently in use contain a polymer matrix such as polyethylene
or epoxy with a carbon or glass reinforcement. polymer matrix composites (PMCs)
6

Figure 2.2: Typical composite cross section [15]
have gained wide acceptance across a wide range of uses such as aircraft wings and
engines as well as civil structures[46][6][34]. Polymers have low density and fracture
toughness similar to that of monolithic ceramics. Figure 2.3 illustrates the significantly
lower operating temperature capability polymers have compared to ceramics. For CMCs
to capitalize on their high temperature and low density properties and find a place in
engineering designs and applications, an increase in damage tolerance must be made[13].
7

Figure 2.3: Typical service temperatures for polymers, metals, and ceramics [13]
2.4 Methods to Increase Fracture Toughness
Ceramic strength is a function of fracture toughness and flaw size as seen in
Equation (2.1)[20]. One manner to increase ceramic material strength is to increase
fracture toughness. Several design philosophies for increasing CMC fracture toughness
currently exist. One is a weak fiber-matrix interface that provides for crack deflection in a
dense matrix. This mechanism allows cracks to grow through the matrix but due to weak
fiber-matrix interface, cracks are deflected around the fiber. If, however, a strong fiber-
matrix interface was present, the crack would be allowed to propagate through the fibers
unimpeded and, thus, have a lower fracture toughness. This unimpeded crack propagation
would lead to undesired catastrophic failure like a monolithic ceramic rather than graceful
failure sought out with the use of CMCs[13]. Trials of fiber coatings to create a weak
fiber-matrix interface have been used in SiC-SiC CMCs[13]. These coatings, such as
Monazite (lanthanum phosphide) have been used in oxide-oxide CMCs, but resulted in
fiber degradation[11].
8

σ f =KIC
Y√
c(2.1)
Another design to increase fracture toughness is a porous matrix oxide-oxide CMC.
In a porous matrix oxide-oxide CMC, the bonds between the oxide fibers and the oxide
matrix are very strong, but cracks are deflected away from the fibers due to the porosity
of the matrix. In this case, the porosity of the matrix, as opposed to a the weak fiber-
matrix interface, is used as the crack deflection mechanism. Without an interphase layer,
an oxide-oxide CMC with a dense matrix would exhibit a strong fiber-matrix interface and
lack the porosity needed as a crack deflection mechanism required for increased fracture
toughness [13]. Selecting a matrix material that resists densification and retains porosity is
another key to increasing high temperature fracture toughness in porous matrix oxide-oxide
CMCs[21]. These concepts can be seen illustrated in Figure 2.4.
Figure 2.4: Mechanisms for increasing damage tolerance: a) conventional weak fiber
interface in dense matrix b) porous matrix concept with strong fiber interface[48]
9

2.5 Oxide/Oxide CMCs
Silicon carbide fibers are some of the most popular CMC reinforcements[25]. This
popularity is due to the ability of SiC-SiC composites to operate in temperatures as
high as 1400C. These materials are well-suited for liquid propellant rocket motors and
turbine engine parts for several reasons. SiC-SiC CMCs demonstrate a high specific
strength, thereby decreasing component weight. Additionally, because of their high
maximum use temperature, SiC-SiC components do not require cooling which eliminates
the requirements for heavy cooling systems[13]. Despite excellent high temperature
properties, SiC composites are known to exhibit oxidation embrittlement. Performance
degredations are caused by oxidation embrittlement at temperatures as low as 500C in
steam[12]. Matrix cracks allow the environment to interact with fibers and fiber coatings.
Steam or other oxidizing environments accelerate oxidation embritlement. Cyclic loading
in an oxidating environment is thought to increase fiber and fiber coating oxidation rate.
Accelerated degredation is thought to be a result of reaction gases being expelled from
matrix cracks during unloading and the oxidizing environment being drawn into the
composite during reloading[39]. This performance degredation illustrates limits to non-
oxide CMCs.
Recent efforts have turned to porous matrix oxide-oxide composites which, without
fiber coatings, can be utilized successfully in high-temperature oxidizing environments
such as exhaust washed turbine engine components[30]. One example of an exhaust-
washed structure is a commercial jetliner turbine engine exhaust nozzle and centerbody
pictured in Figure 2.5. NextelTM 720 fibers consist of 85% alumina and 15% SiO2 by
weight. Other fibers with higher strength have been used in oxide-oxide CMCs. NextelTM
610 fibers are one such example. However, NextelTM 720 fibers investigated in this
study have a higher creep resistance and temperature stability compared to NextelTM 610
10

fibers[2]. NextelTM 720 fiber and NextelTM 720/AS CMC properties are listed in Table 2.1
and Table 2.2, respectively.
Figure 2.5: CMC turbine engine exhaust nozzle and centerbody (Courtesy Boeing)
Property NextelTM 720
Filament Diameter (µm) 10-12
Tensile Strength (GPa) 2.1
Modulus (GPa) 260
Density (g/cm2) 3.4
Coefficient of Thermal Expansion (ppm/C) 6.0
Table 2.1: Mechanical properties of NextelTM 720 fibers[2]
11
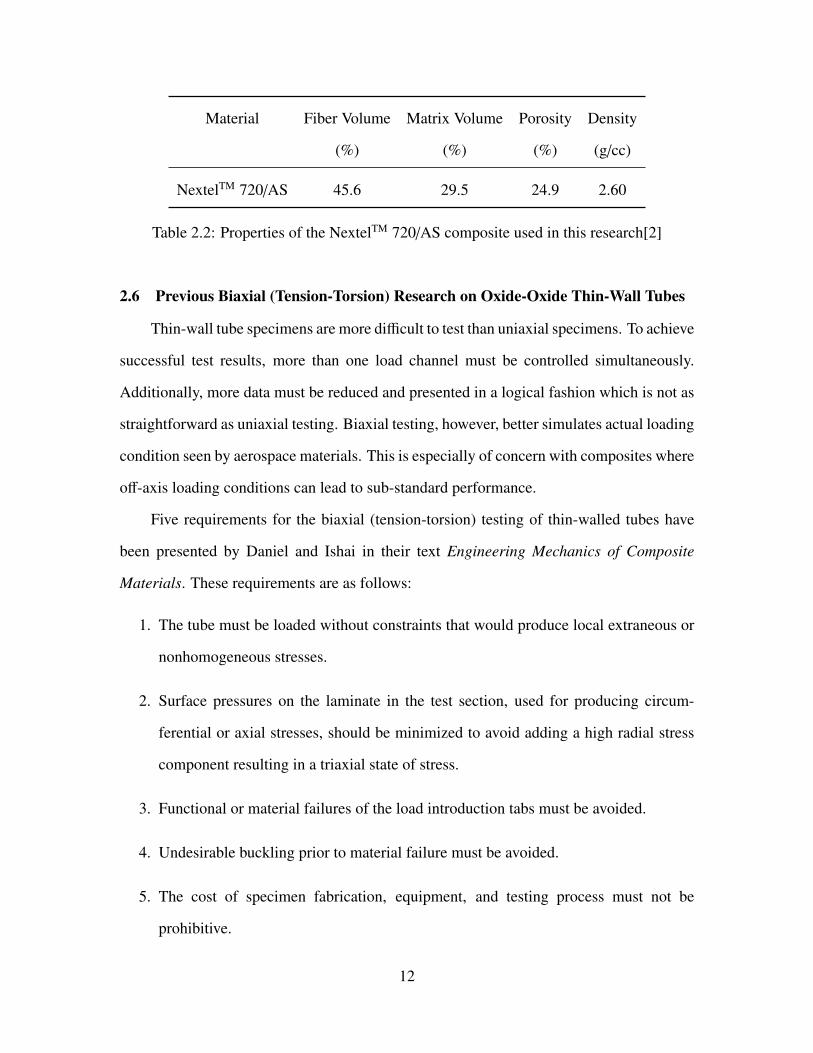
Material Fiber Volume Matrix Volume Porosity Density
(%) (%) (%) (g/cc)
NextelTM 720/AS 45.6 29.5 24.9 2.60
Table 2.2: Properties of the NextelTM 720/AS composite used in this research[2]
2.6 Previous Biaxial (Tension-Torsion) Research on Oxide-Oxide Thin-Wall Tubes
Thin-wall tube specimens are more difficult to test than uniaxial specimens. To achieve
successful test results, more than one load channel must be controlled simultaneously.
Additionally, more data must be reduced and presented in a logical fashion which is not as
straightforward as uniaxial testing. Biaxial testing, however, better simulates actual loading
condition seen by aerospace materials. This is especially of concern with composites where
off-axis loading conditions can lead to sub-standard performance.
Five requirements for the biaxial (tension-torsion) testing of thin-walled tubes have
been presented by Daniel and Ishai in their text Engineering Mechanics of Composite
Materials. These requirements are as follows:
1. The tube must be loaded without constraints that would produce local extraneous or
nonhomogeneous stresses.
2. Surface pressures on the laminate in the test section, used for producing circum-
ferential or axial stresses, should be minimized to avoid adding a high radial stress
component resulting in a triaxial state of stress.
3. Functional or material failures of the load introduction tabs must be avoided.
4. Undesirable buckling prior to material failure must be avoided.
5. The cost of specimen fabrication, equipment, and testing process must not be
prohibitive.
12

Uniaxial tests are more common than biaxial tests because of the requirements
outlined by Daniel and Ishai. Despite the additional testing burdens, biaxial tests
have, however, been accomplished in both tension-torsion with tubes and in-plane with
cruciform specimens. These experiments all required procedural development and most
experimental setups experienced failures in one or more of Daniel and Ishai’s thin-
walled tube biaxial (tension-torsion) testing requirements before achieving successful
results[19][26][29][31][42]. While extensive uniaxial test results of NextelTM 720/AS
layups exist, a relatively few number of multiaxial test results have been reported on.
Searches of biaxial (tension-torsion) test results on oxide-oxide CMCs reveal no results.
The present study aims to add to the contributions of multiaxial CMC testing.
This study set out to develop the test methodology for biaxial (tension-torsion) testing
of thin-walled CMC tubes.
2.7 Thesis Objective
In a typical CMC component used in a high temperature aerospace application,
mechanical loading and thermal gradients combine to create biaxial states of stress. Biaxial
stress in metals and other ductile materials has been well documented and understood
and has led to the development of biaxial failure criterion such as von Mises and Tresca
to predict ultimate loads in these materials. A suitable failure criterion for CMCs has
not been established due to their low ductility and the relatively low quantities of data
when compared to metals. The objective of this study was to develop a test methodology
useful for collecting and analyzing the effects of biaxial stress on oxide-oxide CMCs.
The methodology that was developed in the present study utilizes standard strain gage
instrumentation as well as DIC to capture full field strain and deformation behaviors for
incorporation into computational models. Additional predictive data was collected through
uniaxial tests of flat specimens at room and elevated temperature (1100C) in both air and
steam.
13
III. Test Material and Specimen Geometry
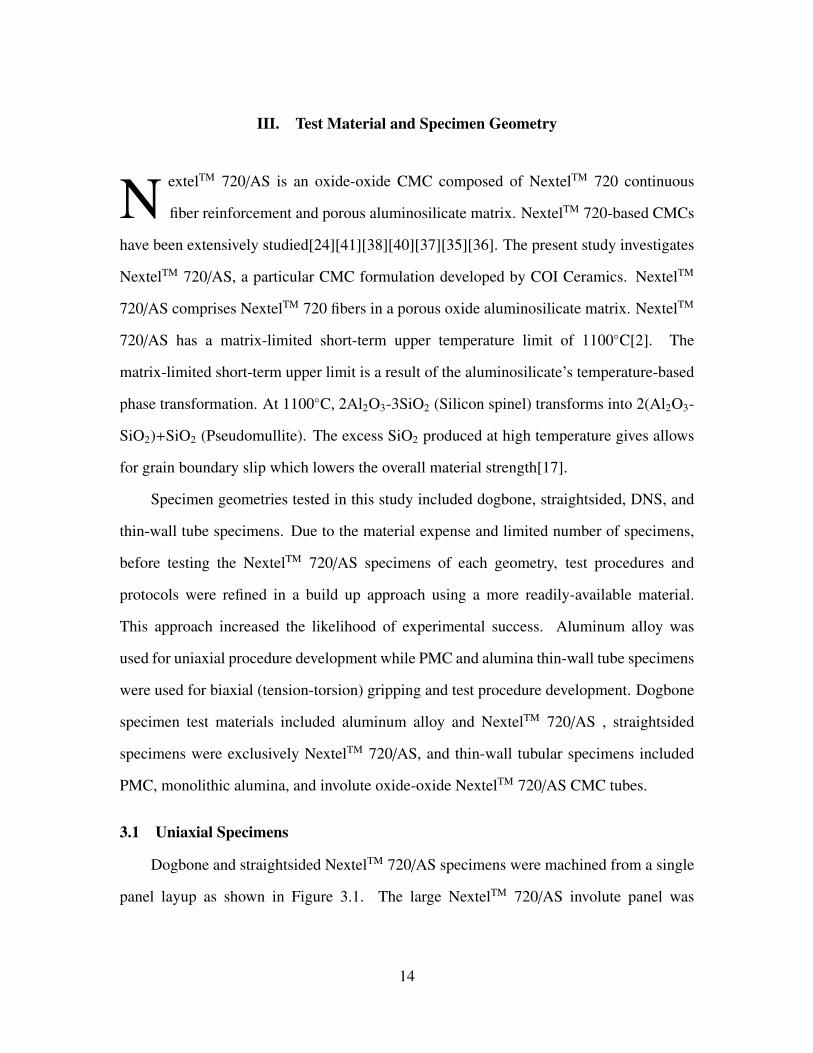
N extelTM 720/AS is an oxide-oxide CMC composed of NextelTM 720 continuous
fiber reinforcement and porous aluminosilicate matrix. NextelTM 720-based CMCs
have been extensively studied[24][41][38][40][37][35][36]. The present study investigates
NextelTM 720/AS, a particular CMC formulation developed by COI Ceramics. NextelTM
720/AS comprises NextelTM 720 fibers in a porous oxide aluminosilicate matrix. NextelTM
720/AS has a matrix-limited short-term upper temperature limit of 1100C[2]. The
matrix-limited short-term upper limit is a result of the aluminosilicate’s temperature-based
phase transformation. At 1100C, 2Al2O3-3SiO2 (Silicon spinel) transforms into 2(Al2O3-
SiO2)+SiO2 (Pseudomullite). The excess SiO2 produced at high temperature gives allows
for grain boundary slip which lowers the overall material strength[17].
Specimen geometries tested in this study included dogbone, straightsided, DNS, and
thin-wall tube specimens. Due to the material expense and limited number of specimens,
before testing the NextelTM 720/AS specimens of each geometry, test procedures and
protocols were refined in a build up approach using a more readily-available material.
This approach increased the likelihood of experimental success. Aluminum alloy was
used for uniaxial procedure development while PMC and alumina thin-wall tube specimens
were used for biaxial (tension-torsion) gripping and test procedure development. Dogbone
specimen test materials included aluminum alloy and NextelTM 720/AS , straightsided
specimens were exclusively NextelTM 720/AS, and thin-wall tubular specimens included
PMC, monolithic alumina, and involute oxide-oxide NextelTM 720/AS CMC tubes.
3.1 Uniaxial Specimens
Dogbone and straightsided NextelTM 720/AS specimens were machined from a single
panel layup as shown in Figure 3.1. The large NextelTM 720/AS involute panel was
14

fabricated using 8-harness (8H) satin weave NextelTM 720 cloth cut into two inch strips.
Strips were stacked and offset by two millimeter. This offset creates the novel involute
layup. Specimens machined from this panel were used to test uniaxial properties which
were then used for comparison to the thin-wall tube involute specimens. The fabrication
process can be seen graphically in the COI Ceramics-provided fabrication process in
Figure 3.2. The process followed the fabric, prepreg, and layup process versus the fiber
tow and filament winding process which are both shown in the diagram.
Figure 3.1: NextelTM 720/AS Dogbone and Straightsided Specimen Layups
The dogbone specimens, seen on the left in Figure 3.3, were cut in a 0,
fiber dominated orientation from the involute panel. The NextelTM 720/AS dogbone
specifications can be seen in Figure 3.4. Straightsided specimens, seen on the right in
Figure 3.3, were cut in a 90 orientation. The 90 orientation measured both a normal and
15

Oxide CMC Fabrication ProcessOxide CMC Fabrication Process
Fire
Ceramic Processing Steps
NDE/QA
Fabric Prepreg
Vacuum Bag
Autoclave Processing
Standard PMC Processing Steps
Sol
Filler
Final Machine
TowFilament Winding
Lay-Up
De-Tool
Ship
Figure 3.2: Prepreg processing steps of NextelTM 720/AS composite
shear stress. The NextelTM 720/AS straightsided specifications can be seen in Figure 3.7.
The two specimen cut orientations to the fibers are illustrated in Figure 3.1.
Fiber orientation in the dogbone specimens, cut in the 0 direction with the involute
panel ply stacking layup, can be seen in Figure 3.5. In contrast, fiber orientation of the
straightsided specimens, cut 90 perpendicular to the involute panel ply stacking layup,
can be seen in Figure 3.6. Thus, the 0 orientation displayed in the dogbone specimens of
Figure 3.5 contain fibers that span the length of the specimens. Straightsided specimens
do no have continuous fibers through the specimen length. Straightsided specimens are
dependent more on the matrix-to-fiber load transfer mechanism. Because of the involute
layup, this mechanism is subject to both a shear and axial stress when loaded along the
16

Figure 3.3: NextelTM 720/AS dogbone (left) and straightsided (right) specimens
Notes:1) Not to scale 2) Symmetrical about centerline3) Leave thickness as manufactured4) Do not under cut radius5) Do not break edges6) Diamond grind edges along length following water jet cut
7) L = 152.0 mm (~6")
DR: Tim Beck
Date: 9 January 12
All Dimensions in: MillimetersMaterial: Oxide-OxideTitle: L152W20GL28GW12R50
U. S. Air Force
Tolerances:xxx.x ±0.10mmxxx.xx ± 0.03mm
0.03 -A-
-A-
0.03 -B-
-B-
20.00 12.00
4.00
R50.0
L
L/2
14.00
28.00
Figure 3.4: NextelTM 720/AS dogbone specimen geometry specifications
17
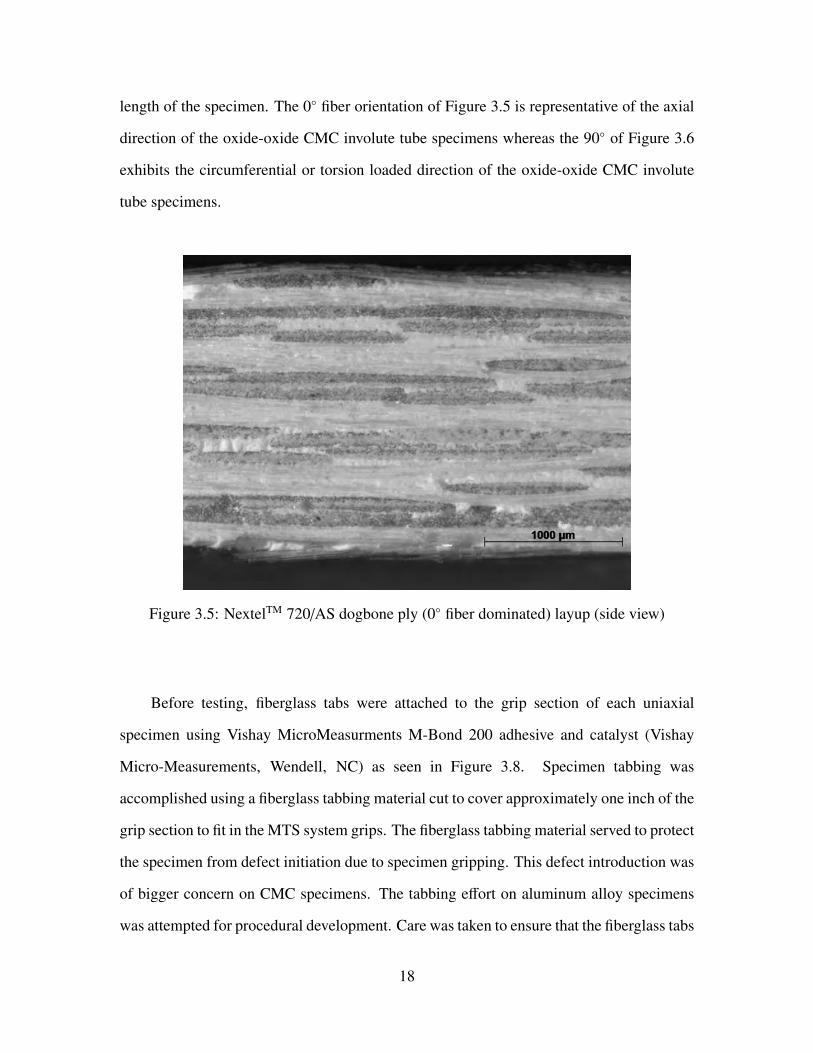
length of the specimen. The 0 fiber orientation of Figure 3.5 is representative of the axial
direction of the oxide-oxide CMC involute tube specimens whereas the 90 of Figure 3.6
exhibits the circumferential or torsion loaded direction of the oxide-oxide CMC involute
tube specimens.
Figure 3.5: NextelTM 720/AS dogbone ply (0 fiber dominated) layup (side view)
Before testing, fiberglass tabs were attached to the grip section of each uniaxial
specimen using Vishay MicroMeasurments M-Bond 200 adhesive and catalyst (Vishay
Micro-Measurements, Wendell, NC) as seen in Figure 3.8. Specimen tabbing was
accomplished using a fiberglass tabbing material cut to cover approximately one inch of the
grip section to fit in the MTS system grips. The fiberglass tabbing material served to protect
the specimen from defect initiation due to specimen gripping. This defect introduction was
of bigger concern on CMC specimens. The tabbing effort on aluminum alloy specimens
was attempted for procedural development. Care was taken to ensure that the fiberglass tabs
18

Figure 3.6: NextelTM 720/AS straightsided ply (90 matrix dominated) layup (side view)
did not extend past the exterior dimensions of the grip sections, yet covered the maximum
gripping area.
19

DR: Matthew O'Malley
Date: 9 January 12Tolerences:
All Dimensions in: Millimeters
U. S. Air ForceNotes:
1) Do not break edges
2) Diamond grind edges following water jet cut along length
3) Leave thickness as manufactured
Material: oxide-oxideTitle: L152W12
Thickness see note
(3)
xx.x ±0.10mmxx.xx ±0.03mm
-A-
// A 0.05
152 .0
12.0
Figure 3.7: NextelTM 720/AS straightsided specimen geometry specifications
Figure 3.8: M-Bond 200 Adhesive and Catalyst
20

3.2 Double-Notch Shear (DNS) Specimens
DNS specimens were used to measure ILSS, a matrix-dominated property. DNS
specimens were machined per ASTM Standard C1425-05 from two remnant 6.25 inch
x 6 inch sheets of NextelTM 720/AS (labeled as Panels C and B of the baseline panel in
Figure 3.9). Figure 3.11 and Table 3.1 show the geometry and dimensions, respectively, for
the specimens cut from the remnant panels (Panel C and B) of the balanced panel layup.
Remnant sheet C and B possessed 0 fiber-dominated layup as seen in Figure 3.10. ASTM
machining standard C1425-05 was chosen to create a specimen geometry that would test
matrix-dominated ILSS properties. ILSS properties were compared to the shear values of
straightsided specimens to estimate the properties of the biaxial (tension-torsion) oxide-
oxide thin wall involute tubes.
Figure 3.9: Baseline NextelTM 720/AS Balanced 0/90 plate
21

DNS specimens were machined in-house at the Air Force Institute of Technology
(AFIT) Model Shop using a diamond saw. Notch depth was determined through plate
thickness. Per ASTM standard C1425-05, plate thickness is defined as t and thus t/2
is the midplane of the specimen. To test matrix dominated ILSS, both notches must
be cut to the midplane (t/2) with a -0.00mm specification. Variations in plate thickness
resulted in several of the 15 total specimens not meeting the -0.00mm t/2 specification.
The influence of this tolerance is discussed later. The majority of specimens exhibited
acceptable machining standards. After machining, DNS specimens were cleaned using the
following procedure:
1. Five (5) minute ultrasonic deionized water bath
2. Seven (7) minute ultrasonic deionized water bath
3. Ten (10) minute ultrasonic acetone bath
4. Ten (10) minute ultrasonic acetone bath
5. Twenty-Five (25) minute ultrasonic acetone bath
6. Final acetone rinse
7. 100C bakeout overnight (approximately 16 hours)
Ultrasonic cleaning with deionized water was conducted in order to remove residues
and contaminates from the machining process. Five minutes was determined to be
insufficient. A second iteration of seven minutes was also insufficient. Specimen cleaning
with deionized water was thus determined to be insufficient. Ultrasonic cleaning in
acetone was then conducted with better results. Cleaning results were determined by close
visual inspection. Dogbone, straightsided, and tube specimens were subjected to chemical
contamination removal at COI Ceramics through a bake-out procedure after processing.
22

Figure 3.10: NextelTM 720/AS DNS ply layup (side view)
It should be noted that chemical contamination in remnant materials (Panels C and B in
Figure 3.9) was not burned out by COI Ceramics after processing. Bake-out of remnant
materials was performed at Air Force Research Laboratory (AFRL). During bake-out at
AFRL, the specimens were placed on an alumina block to avoid thermal gradients from
contact with the discontinuous metallic support rack and to minimize risk of damage that
would result from accidental falls between the rack supports. Images of the DNS cleaning
and bakeout process can be seen in Appendix A in Figure 6.9 through Figure 6.16.
23

Figure 3.11: ASTM C1425-11 DNS specimen geometry. Reproduced from [9]
Dimension Value (mm)
L 150
h 12
W 15
d 0.5
t/2 2
Table 3.1: Values for Figure 3.11
24

3.3 Thin-Wall Tube Specimens
The thin-walled involute oxide-oxide CMC tube geometry is a novel specimen layup,
constructed by offset stacking strips of NextelTM 720/AS prepreg material. The involute
tube walls were nominally 16 NextelTM 720/AS plies thick. Plies, were two inches
(approximately 1/3 the circumference of the tube) in length and were assembled such that a
ply end started on the tube outer diameter and terminated on the inner diameter. Figure 3.12
is a simplified visualization of the 54 total plies (arranged in a manner similar to that of
a rolled newspaper). The layup exhibits excellent machinability and defect resistance to
issues such as ply wrinkling. Fiber architecture was designed to support axial loads with
fiber-dominated properties along the tube length. The involute architecture design produced
a matrix-dominated interlaminar path from the inner diameter to the outer diameter. ILSS
determination was a priority of this involute tube architecture study.
Figure 3.12: Biaxial (tension-torsion) thin-wall involute tube specimen layup
Specimens were machined to a total length of nine inches resulting in a 2.3 inch
long grip section on each end, a central 3.38 inch gage section, and a 0.51 inch transition
25

zone separating each grip section from the gage section. Gage section outer diameter was
machined nominally to 1.61 inches. Grip section outer diameter was machined to 1.75
inches. Tube dimensions and tolerances were in accordance with ASTM Standard E 2207-
08 and are illustrated in Figure 4.14[10].
Gripping CMC tubes for biaxial testing is substantially more complex than for typical
uniaxial coupon specimens. Gripping pressures were initially calculated based on MTS
provided algorithms using material UTS and estimated coefficients of friction (µ). The
algorithms estimated the pressure necessary to prevent specimen slip during a given applied
load. Specimen damage resulting from gripping was of significant concern. The PMC tubes
used in initial development to validate experimental setup exhibited sufficient ductility and
toughness and were thick enough that specimen damage resulting from gripping was of
little concern. The next stage in the test buildup process was gripping of the brittle alumina
tubes. Gripping alumina tubes, the next step in test validation, was more challenging due
to the brittle nature and thin walls.
A total of three alumina tubes were obtained from CoorsTek (Golden, CO) with
dimensions and tolerances listed in Table 3.2. While alumina tubes met specifications,
the tubes were nevertheless out-of-round, non-concentric, and non-uniform and presented
challenges to subsequent machining to specifications in Figure 4.14. Tubes were ground
on a Computer Numerically Controlled (CNC) lathe using diamond tooling on a tool post
grinder. To minimize chance of machining-induced damage, the alumina was spun at 100
RPM and the tool post grinder was moved at 0.0005 inch/rev with 0.002 inch depth cuts
per pass. Alumina specimens were cooled with biodegradable lubricating oil.
Aluminum alloy insert plugs were machined for both the alumina tubes and the
oxide-oxide CMC involute tubes. The aluminum alloy plugs are shown in Figure 4.25.
Dimensional drawings are shown in Figure 3.13. Outer diameter dimensions listed in
Figure 3.13 are nominal and were modified to match each individual tube inner diameter.
26
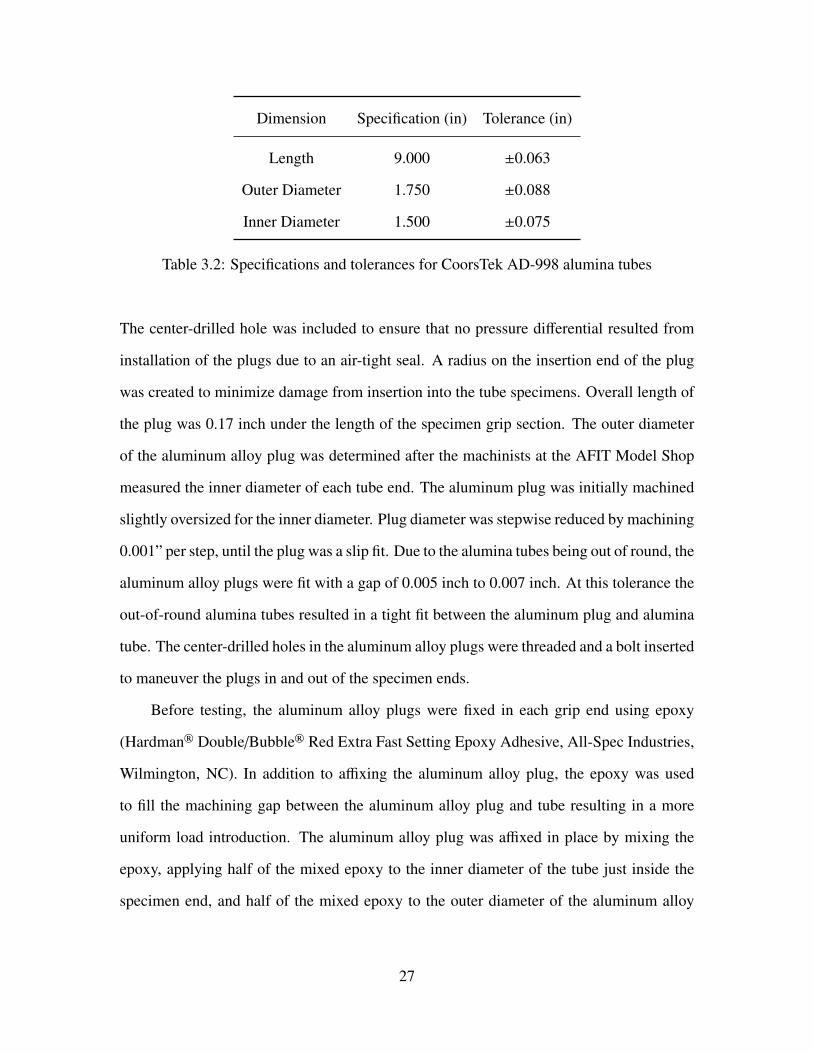
Dimension Specification (in) Tolerance (in)
Length 9.000 ±0.063
Outer Diameter 1.750 ±0.088
Inner Diameter 1.500 ±0.075
Table 3.2: Specifications and tolerances for CoorsTek AD-998 alumina tubes
The center-drilled hole was included to ensure that no pressure differential resulted from
installation of the plugs due to an air-tight seal. A radius on the insertion end of the plug
was created to minimize damage from insertion into the tube specimens. Overall length of
the plug was 0.17 inch under the length of the specimen grip section. The outer diameter
of the aluminum alloy plug was determined after the machinists at the AFIT Model Shop
measured the inner diameter of each tube end. The aluminum plug was initially machined
slightly oversized for the inner diameter. Plug diameter was stepwise reduced by machining
0.001” per step, until the plug was a slip fit. Due to the alumina tubes being out of round, the
aluminum alloy plugs were fit with a gap of 0.005 inch to 0.007 inch. At this tolerance the
out-of-round alumina tubes resulted in a tight fit between the aluminum plug and alumina
tube. The center-drilled holes in the aluminum alloy plugs were threaded and a bolt inserted
to maneuver the plugs in and out of the specimen ends.
Before testing, the aluminum alloy plugs were fixed in each grip end using epoxy
(Hardman® Double/Bubble® Red Extra Fast Setting Epoxy Adhesive, All-Spec Industries,
Wilmington, NC). In addition to affixing the aluminum alloy plug, the epoxy was used
to fill the machining gap between the aluminum alloy plug and tube resulting in a more
uniform load introduction. The aluminum alloy plug was affixed in place by mixing the
epoxy, applying half of the mixed epoxy to the inner diameter of the tube just inside the
specimen end, and half of the mixed epoxy to the outer diameter of the aluminum alloy
27

plug just past the radius cut. The plug was inserted with a twisting motion to ensure even
spread of the epoxy within the tube. The plugs were inserted until flush with the ends of
the tube by setting the tube down on a flat disposable piece of cardboard. Immediately after
insertion and pressing the aluminum alloy plug flush with the specimen, an alcohol-soaked
disposable paper towel was used to wipe the grip section to ensure excess epoxy was not
spread onto the outer grip radius. The bottom face of the aluminum alloy plug was also
wiped to remove any remaining excess epoxy. Once the epoxy was sufficiently cleaned
from external surfaces, the tube with plug was stood on end on a clean section of flat
cardboard for the remainder of the five minute cure time. After the cure time had elapsed,
the opposing end aluminum alloy plug was set in accordance with the same procedure.
Figure 3.13: Aluminum alloy grip support plug inserts with nominal dimensions in inches
28

The alumina tubes presented a worst case scenario for gripping procedures. The lack
of specimen and inner diameter uniformity presented the possibility of premature specimen
failure due to thickness variation within the gage section. Alumina tubes were not used for
data collection in this study. The non-circular cross section could lead to specimen failure
from stress concentrations and invalid results if used for data collection. Due to the tighter
tolerances and higher specimen uniformity of the oxide-oxide CMC involute tubes, it was
believed that if alumina tubes were successfully gripped and tested, gripping pressures of
the same values would be applicable to oxide-oxide CMC involute tube specimens.
Machining gaps ranged from 0.001” to 0.025” between the involute tube inner
diameter and aluminum alloy plug outer diameter on the oxide-oxide CMC involute tube
specimens. Vent holes were not required to be threaded for a bolt in the CMC specimen
aluminum alloy plugs. The aluminum alloy plugs were fixed to the CMC test specimens in
the same manner as alumina tube specimens.
29

IV. Experimental Setup and Procedures
T his study included uniaxial and biaxial (tension-torsion) tests on NextelTM 720/AS
CMC specimens. Uniaxial flat-plate coupon tests were used to determine UTS and
USS values prior to biaxial (tension-torsion) testing. UTS and USS values were used in
biaxial (tension-torsion) thin-wall tube specimen failure strength envelope estimations. All
tests were conducted in the mechanical testing lab at the Air Force Institute of Technology.
4.1 Room Temperature Uniaxial Tests
Uniaxial aluminum alloy dogbone specimens were studied first for procedure
development and vetting in addition to risk reduction. NextelTM 720/AS dogbone and
straightsided specimen studies followed. These studies were conducted using a servo-
hydraulic controlled MTS 810 Material Test System 3 kip mechanical loadframe. The MTS
loadframe was outfitted with an MTS Force Transducer (Model 661.19E-04) with hydraulic
wedge grips and was controlled by a Flextest 40 digital controller connected to a computer
with MTS Station Manager software installed. A high-temperature MTS extensometer
(model number 632.53 E-14) with a gage length of 0.5 inch was used to measure strains
throughout the tests. The complete test apparatus can be seen in Figure 4.1.
The loadframe’s hydraulic system was warmed up prior to testing with a displacement-
controlled sine waveform of 0.5 inch for at least 30 minutes. After warm up of the
hydraulic system was completed, the specimens with load tabs were then inserted into
the hydraulic wedge grips. Grip pressure was set to 8 MPa based on previous work on
NextelTM 720/A[24]. Gripping pressure of 8 MPa ensured sufficient pressure to prevent
slippage, yet was low enough to prevent specimen crushing[24].
30

Figure 4.1: MTS 3 kip loadframe
4.1.1 Aluminum Alloy Dogbone Specimen Testing
Stock aluminum alloy dogbone specimens, previously prepared and available in the
AFIT lab, were used to develop and test experimental procedures to be used on the
NextelTM 720/AS specimens. Aluminum alloy specimens were prepared by measuring
the width and thickness of the gage section. Following measurements, indentions were
created on the sides of the specimens using a manual punch and hammer. Indentions
were used for mounting the low-contact force, high-temperature MTS Model 632.53 E-
14 high temperature extensometer. Indentions were aligned using a previously made and
available punch alignment template. During the indention process, the specimen was held
in a wooden jig, also previously fabricated.
31

The crosshead and hydraulic actuators were positioned in displacement control to
grip approximately one inch of the specimen grip section while centering the gage section
relative to the extensometer arm. The aluminum alloy specimen was loaded into the MTS
loadframe with care taken to align the punched indentions with the extensometer mounting
bracket. The specimen was loaded into the grips by placing the top and bottom grip sections
firmly against the alignment posts to ensure vertical orientation in line with the applied
loading force. The top grip was closed after placing the aluminum alloy specimen firmly
against the alignment posts. The load cell was zeroed out, the MTS actuator arm was
switched to load control, an input of zero force was input, and the lower grip was closed.
Studies were completed in load control with loading rates of 2 MPa/second to initiate
fast fracture. Data was acquired at 30 Hz and time, actuator displacement, strain, and
force were recorded. The loads were applied in 50 MPa cycles to failure with unloading
occurring after each loading increment (e.g. 0 MPa to 50 MPa, unload to 0 MPa, load to 100
MPa, unload to 0 MPa, load to 150 MPa, etc.). When test procedures were finalized and
successfully executed on the aluminum alloy specimens, tests on oxide-oxide specimens
proceeded.
To determine applied loads and loading rates, a spreadsheet was developed based off
of dogbone and straightsided specimen geometry. This spreadsheet is shown in Figure 4.2.
Loads were calculated using Equation (4.1). It should be noted that while SI units were used
for all analysis, loadframe limits were listed in kip. For test safety, loads were calculated
in kip to ensure that loadframe limits were not exceeded.
32

σ =PA
(4.1)
where
σ = Axial Stress (Pa)
P = Axial Force (N)
A = Cross-sectional Area (m2)
Specimen(IDDesired(Stress,(σ(
(MPa)Width,(w((mm)
Thickness,(t((mm)
Area,(A(
(m2)Force,(P((kip)
Nextel&720/AS&(Spec&Geo)&3&123XXX 2 11.96 1.97 2.36E305 0.0113.5 11.96 1.97 2.36E305 0.0195 11.96 1.97 2.36E305 0.02610 11.96 1.97 2.36E305 0.05320 11.96 1.97 2.36E305 0.10625 11.96 1.97 2.36E305 0.13280 11.96 1.97 2.36E305 0.42450 11.96 1.97 2.36E305 0.26484100 11.96 1.97 2.36E305 0.52968150 11.96 1.97 2.36E305 0.79452200 11.96 1.97 2.36E305 1.05935250 11.96 1.97 2.36E305 1.32419300 11.96 1.97 2.36E305 1.58903350 11.96 1.97 2.36E305 1.85387400 11.96 1.97 2.36E305 2.11871
Figure 4.2: Dogbone and straightsided specimen load spreadsheet
4.1.2 NextelTM 720/AS Dogbone Specimen Testing
NextelTM 720/AS dogbone specimens were prepared and loaded in a similar manner
as the aluminum alloy specimens, but without the creation of indentations. Brittle CMCs
do not withstand indentations as ductile aluminum alloys. Indenting CMCs would cause
extensive damage to the specimen leading to premature failure. The surface finish of the
edge of the CMC, however, provided enough friction force to hold the extensometer against
the specimen under test with the rods’ conical ends. The top grip was closed and the
low-contact force extensometer was installed with the alumina tips onto the side of the
NextelTM 720/AS specimen. After extensometer mounting, the load cell was zeroed out,
33

the MTS actuator arm was switched to load control, an input of zero force was input, and
immediately the lower grip was closed.
NextelTM 720/AS dogbone specimens were tested to failure at room temperature with
monotonically increasing load at 4 MPa/second. Data was acquired at 30 Hz and time,
actuator displacement, strain, and force were recorded.
4.1.3 NextelTM 720/AS Straightsided Specimen Testing
Straightsided specimen geometry were prepared from NextelTM 720/AS panels.
Specimens were loaded in displacement control at 0.05 mm/second to initiate fast fracture.
Testing of straightsided specimens was completed in the same manner as for NextelTM
720/AS dogbone specimens. Straightsided specimens lack a defined gage section in
contrast with dogbone-shaped specimens. As a result, the extensometer was centered on
the overall length of the straightsided specimen, rather than the gage section.
The MTS Station Manager procedure can be seen in Appendix A, Figure 6.1. This
procedure incorporated an Aramis DIC 5V TTL 1/sec trigger signal. The 5V TTL 1/sec
trigger signal was programmed into the MTS Station Manager procedure as an output and
fed into a triggerbox trigger input in the Aramis DIC system. The Aramis DIC system was
then set to detect the signal and begin a 1/sec image acquisition procedure. For non-DIC
tests, this step in the procedure was removed or disabled.
4.2 Room Temperature Uniaxial Tests with Digital Image Correlation (DIC)
Material testing with the addition of DIC was accomplished in the second phase of
testing. The addition of a stochastic, or random, speckle pattern, as seen in Figure 4.3, was
the only additional specimen preparation. Speckle patterns were painted to enable the use
of GOM Optical Measuring Techniques’ Aramis DIC software suite as an additional full
field measurement technique. The DIC random speckle pattern was created by applying a
solid coating of flat white spray paint and then applying an incomplete, speckled layer of
flat black spray paint for speckling. Both spray paints were commercially available.
34

The DIC system consisted of a pair of tripod-mounted Schneider Kreuznach
Componon-S 2.8/50 50 mm aperture cameras mounted at an angle of 21.6 and run with
Aramis DIC software version v6.0 2-6 (Build 2007-09-06). Calibration of the Aramis
system was completed with a GOM 65x52mm calibration panel and can be seen in
Figure 4.4. Facet size of 11 pixels and step size of 7 pixels was used. Specifications for
the ceramic calibration panel can be seen in Table 4.1. Calibrations ultimately yielded
a correlation coefficient that was compared with Aramis standards. Per the Aramis
user manual, a correlation coefficient between 0.01 and 0.04 pixels indicates a correct
calibration. Correlation coefficients for tests in the present study were between 0.023 pixels
and 0.031 pixels, within Aramis guidelines.
Figure 4.3: Example stochastic, or random, speckle pattern for use with DIC
DIC tracks the deformations of a specimen during mechanical loading by correlating
movement of the speckles on the surface through a series of images. If deformations are in
a single plane, movements can be tracked via a single camera. If out-of-plane deformations
35

Figure 4.4: GOM 65x52mm DIC calibration panel
Panel ID P04895
Distance 39.003mm/1.5355in
Certification Temperature 20.0C
Expansion Coefficient 0.10 x 10⁻⁶ K−1
Measurement Temperature 20.0C
Table 4.1: GOM 65x52mm DIC calibration panel specifications
are of interest or are of significant value, the use of a two camera system is necessary.
Biaxial (tension-torsion) testing, which involves out of plane loading, was the ultimate
goal of this experimentation and thus a two camera system was used. Additionally, a two
camera DIC system allowed for the out-of-plane deformations and strains to be mapped
during the build-up uniaxial tests.
36

Speckle size of the stochastic pattern is important to the correlation of the specimen
deformations. Rajan et al. (2012) formulated the relationship that the subset size should be
three times the speckle size. DIC system evenly breaks the field of regard into the subsets
dictated by the user. Each subset, in essence, acts as a single strain gage. The smaller the
speckle size is, the smaller the subset size will be. The relation of speckle to subset size
relates to the fidelity or spatial resolution of the system. The smaller the speckle size the
higher the spatial resolution and vice versa. In an effort to achieve a stochastic pattern with
the smallest speckle size, several iterations of speckle painting was done on aluminum alloy
dogbone specimens. Once a suitable technique was found, the NextelTM 720/AS dogbone
and straightsided specimens were both prepared in the same manner as for the standard
uniaxial tests, but with the addition of the random speckle pattern.
NextelTM 720/AS dogbone uniaxial test procedures incorporating DIC required time
synchronization to compare experimental loads and strains between the MTS loadframe
and Aramis DIC system. The Aramis system possessed two analog-to-digital recording
channels and a trigger input via a trigger box. The MTS loadframe possessed digital-to-
analog outputs. Coaxial cables connected the MTS loadframe axial load and strain channels
to the Aramis system triggerbox for recording. Synchronization was achieved with a 5V
TTL signal connected via coaxial cable from MTS loadframe to the Aramis trigger box.
The 5V TTL trigger signal then was initiated at test start via the MTS Station Manager
software and triggered every second for the test duration. The Aramis system was set to
receive the 5V TTL signal and record an image set. The test was completed in load control
with loading rates of 2 MPa/second to initiate fast fracture. Data was acquired at 30 Hz
and time, actuator displacement, strain, and force were recorded. The sequentially loaded
tension loads were applied in 50 MPa cycles to failure with unloading occurring after each
loading increment (e.g. 0 MPa to 50 MPa, unload to 0 MPa, load to 100 MPa, unload to
37

0 MPa, load to 150 MPa, etc.).The MTS procedure can be seen in Appendix A, Figure 6.4
and the sequentially loaded tension test profile can be seen in Figure 4.5.
Figure 4.5: Sequentially-loaded dogbone tension test profile
4.3 Elevated Temperature (1100C) Uniaxial NextelTM 720/AS Dogbone and Straight-
sided Specimen Testing
Temperature calibration was accomplished prior to elevated temperature testing. A
dogbone specimen was instrumented with two type-R thermocouples protected by ceramic
beading and attached in similar fashion to previous works by Laffey and Pope[24][32].
Thermocouples were attached with high temperature piano wire wound around two
grooved CMC pieces securing the thermocouple beads to the specimen. This setup can
be seen on a DNS specimen in Figure 4.6. The specimen was then loaded into the MTS
test frame, set in a zero load hold condition, and furnace temperature raised until 1100C
was measured and maintained on both left and right side of the specimen. Temperature
was measured with an Omega CL3515A digital hand thermometer as seen in Figure 4.10.
The setpoints of the furnace were then recorded and used for subsequent 1100C air test
temperature runs.
38

Figure 4.6: Temperature calibration specimen setup with piano wire wound around two
CMC pieces securing thermocouple beads on DNS specimen used to determine setpoints
for 1100C testing in air and steam
Following temperature calibration, dogbone specimens were loaded in both monotonic
and sequentially loaded tension to failure tests. The specimens were heat soaked at 1100C
in a zero load condition before loads to failure were applied. Straightsided specimens were
also heat soaked prior to testing in 0.05 mm/sec displacement-to-failure loading. MTS
Station Manager procedures for both dogbone and straightsided specimens can be seen in
Appendix A, Figure 6.5 and Figure 6.6, respectively.
Procedure additions from room temperature testing included temperature ramp, dwell,
and shutoff segments as well as zero-load-hold conditions during temperature ramp
and dwell times. Temperature ramp increased test specimen temperature from room
temperature to 1100C. Dwells held the 1100C temperature for the 30 minute dwell
period. Shutoff segments brought specimen temperatures back to room temperature at the
conclusion of testing.
39

4.4 Elevated Temperature (1100C) Uniaxial NextelTM 720/AS Double Notch Shear
(DNS) Specimen Testing
Monotonic compression to failure and interlaminar shear creep tests were conducted
to DNS specimens at 1100C. Loads and elevated temperatures were applied with a 5
kip servohydraulic-controlled MTS 810 Material Test System to impart desired stress
levels based on DNS specimen geometry. Loads were determined with a spreadsheet
shown in Figure 4.7 similar to dogbone and straightsided specimens and calculated
using Equation (4.2). The MTS loadframe was controlled by a Flextest 40 digital
controller connected to a computer with MTS Station Manager software installed as
seen in Figure 4.8. The 5 kip loadframe was equipped with water cooled wedge
grips and an AMTECO Hot Rail two-zone resistance-heater furnace connected to a
temperature controller for each zone (left and right). An R-type thermocouple was inserted
into each zone to measure temperature and provide temperature controller feedback.
The MTS Model 409.83B Temperature Controller was used to control the furnace
operating temperature and controlled both the left and right furnaces independently and
simultaneously. Each zone utilized a display with two readouts in a stacked arrangement.
The type-R thermocouple-measured temperature was displayed on top and the MTS
programmable temperature setpoint was displayed below as seen in Figure 4.9.
σ =P
WL(4.2)
where
σ = Axial Stress (Pa)
P = Axial Compressive Force (N)
W = Specimen Width (m)
L = Fracture surface length (m)
40

Specimen(IDDesired(Stress,(σ((MPa)
Width,(w((mm)
Thickness,(t((mm)
Area,(A(
(m2)Force,(P((kip)
Nominal(Fracture(Surface(Length(
(in)
Nominal(Fracture(Surface(
Length((m)
Nominal(Fracture(Surface(
Area((m2)Nextel™'720/AS'DNS'Specimen'X 1 14.90 3.99 5.95E<05 0.013365 0.46875 0.01190625 0.000177403
2 14.90 3.99 5.95E<05 0.0267303.5 14.90 3.99 5.95E<05 0.0467785 14.90 3.99 5.95E<05 0.06682610 14.90 3.99 5.95E<05 0.13365120 14.90 3.99 5.95E<05 0.26730230 14.90 3.99 5.95E<05 0.40095440 14.90 3.99 5.95E<05 0.53460550 14.90 3.99 5.95E<05 0.66825660 14.90 3.99 5.95E<05 0.80190775 14.90 3.99 5.95E<05 1.002384
Figure 4.7: DNS load spreadsheet
Figure 4.8: MTS 5 kip high-temperature loadframe
Temperature calibration was performed prior to experimentation in the 1100C testing
environment. A temperature calibration specimen of the same NextelTM 720/AS material
and geometry to be tested was mounted using a similar procedure as above. The
41

Figure 4.9: MTS 409.83 Temperature Controller
temperature calibration was run in load control with zero load. The specimen was straddled
by two R-type thermocouples connected to an Omega CL3515A digital, hand thermometer
as seen in Figure 4.10. The furnace temperature was gradually raised until the temperature
calibration specimen reached the target testing temperature of 1100C. Once steady state
1100C temperature was observed for two hours, the corresponding temperature setpoints
were recorded. The same procedure was repeated in both steam and air. Set points for
corresponding tests were then used for subsequent testing. Temperature calibrations were
reaccomplished whenever alumina insulation or furnace igniters were replaced.
Two safety-of-test mechanisms were in place for compressive load tests. A failure
detector developed and described by Laffey comprised the first safety mechanism[24]. This
failure detector preserved test specimen fracture surfaces. The second safety mechanism
provided furnace crush protection from the lower hydraulic actuator or upper grip. Furnace
crush protection was accomplished by raising the furnace rail support to a height outside
of the damaging range of the hydraulic actuator. A sufficient amount of range remained
42

Figure 4.10: Omega CL3515A digital, hand thermometer during temperature calibration
for compressive loads to be applied without enough throw to reach the furnace bottom.
Similarly, the upper crosshead was raised to allow downward travel of the upper grip during
specimen release without reaching the furnace top.
The loadframe’s hydraulic system was warmed up prior to testing by running a
displacement-controlled sine wave of 0.5 inch for a minimum of 30 minutes. Fiberglass
tabs were attached to the grip section of each specimen using M-Bond 200 (Vishay Micro-
Measurements, Wendell, NC) adhesive and catalyst as discussed above. Tabbed grip
sections were inserted into the hydraulic wedge grips following warm up. An alumina
susceptor, seen in Figure 4.11, was used to separate the saturated steam environment (for
steam tests) from the laboratory air within the furnace. The susceptor was an alumina
cylinder with holes for both extensometer rods as well as a steam port located on the
opposite side of the cylinder. The grips were cooled with 15C water from a Naslab model
HX-75 chiller. Grip pressures were set to 8 MPa. An AMTECO Steam Generator was
43

used to generate steam when required for steam tests and is displayed in Figure 4.12. Each
furnace half was closed around the susceptor after specimen mounting inside the susceptor
and grips. After the furnaces were closed, an MTS Model 632.53 E-14 high temperature
extensometer was mounted to measure strain during testing. It should be noted that the
strain measurement by the extensometer was not the actual interlaminar shear strain, but
change in gage section length per unit original gage section.
Figure 4.11: Alumina susceptor used for high temperature (1100C) steam testing
assembled (L) and disassembled (R)
Loads were applied after elevated temperatures were reached and held for 30 minutes.
Zero-load hold conditions were maintained during temperature ramp-up. Monotonic
compression tests were carried out at elevated temperatures in laboratory air. Interlaminar
shear creep tests were accomplished both in air and steam. Procedures for interlaminar
shear creep tests in steam differed only by the addition of steam generator warmup
and operation prior to DNS specimen loading. Both the monotonic compression and
interlaminar shear creep procedures can be seen in Appendix A, Figure 6.2 and Figure 6.3,
respectively.
44

Figure 4.12: AMTECO HRFS-STMGEN Steam Generation System
4.5 Biaxial Tests
Biaxial (tension-torsion) tests were performed at room temperature (nominal value of
23C) in laboratory air environment. A servo-controlled MTS 809 Axial-Torsional Testing
System pictured in Figure 4.13 mated with an MTS TestStar IIm digital controller was used
with TestStar IIm Station Manager software (version 5.3B 3243) for computerized testing
and data acquisition.
Thin-walled PMC tubes were studied first for procedure development and vetting in
addition to risk reduction. These surplus PMC specimens from previous experimentation
were used for test setup and procedure maturation. Alumina tubes were then instrumented
and tested. Alumina was used to verify test instrumentation and procedures were
appropriately setup for testing with a brittle material. Finally, NextelTM 720/AS CMC
involute tubes were tested.
45
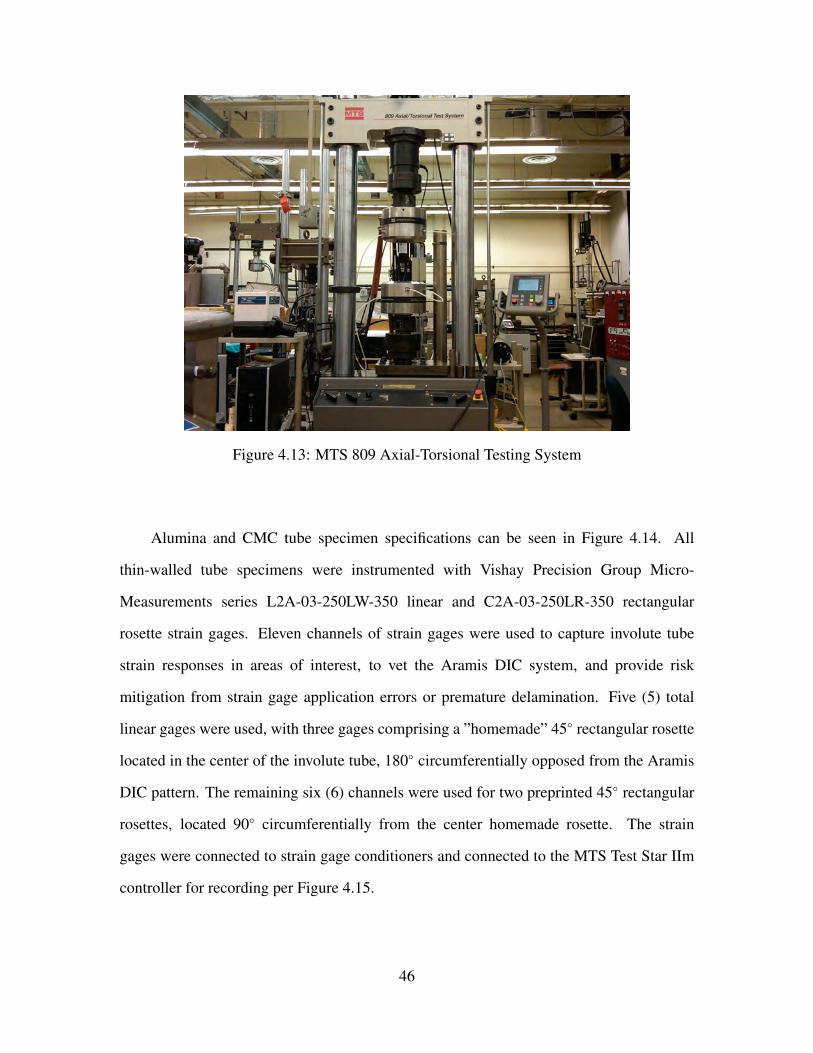
Figure 4.13: MTS 809 Axial-Torsional Testing System
Alumina and CMC tube specimen specifications can be seen in Figure 4.14. All
thin-walled tube specimens were instrumented with Vishay Precision Group Micro-
Measurements series L2A-03-250LW-350 linear and C2A-03-250LR-350 rectangular
rosette strain gages. Eleven channels of strain gages were used to capture involute tube
strain responses in areas of interest, to vet the Aramis DIC system, and provide risk
mitigation from strain gage application errors or premature delamination. Five (5) total
linear gages were used, with three gages comprising a ”homemade” 45 rectangular rosette
located in the center of the involute tube, 180 circumferentially opposed from the Aramis
DIC pattern. The remaining six (6) channels were used for two preprinted 45 rectangular
rosettes, located 90 circumferentially from the center homemade rosette. The strain
gages were connected to strain gage conditioners and connected to the MTS Test Star IIm
controller for recording per Figure 4.15.
46

Figure 4.14: NextelTM 720/AS thin-wall involute tube specimen with strain gage alignment
mark (above) and specifications (below)
Gages were selected based on performance specifications and availability from Micro-
Measurements–350Ω resistance strain gages were selected. An excitation voltage of 0.5V
was used. High resistance and low excitation voltage were selected to reduce thermal
effects on gages. As seen in Figure 4.16, five linear and two rectangular rosette strain
gages were used to measure axial, torsion, and shear strains. Two linear gages were placed
circumferentially to measure torsion at opposite ends of the tube and three linear strain
gages were used to create a ”homemade” rectangular strain gage rosette with one gage
aligned axially, one gage circumferentially, and one gage at a 45 angle to both the axial
47

Figure 4.15: Oxide-oxide CMC involute tube strain gage locations
and torsional gages. The homemade rectangular strain gage rosette was installed 180
(circumferentially) from the DIC random speckle pattern. This orientation was used for
verification and validation of DIC test data. The homemade rectangular strain gage rosette
was used in lieu of a manufactured rectangular strain gage rosette for risk reduction of
strain gage debonding.
Strain gages were installed using a modified installation procedure provided by Micro-
Measurements. High amounts of degreasing, sanding, and cleaning dictated by Micro-
Measurements for common metals such as steel and aluminum alloys were difficult to
accomplish without introducing significant surface defects or leaving cleaning products
residuals such as strands of textiles or paper byproducts from cleaning and drying products
on the surface of the CMC. The following procedure was adopted and subsequently
48

Figure 4.16: Strain gage locations (dimensions in inches)
modified from Daniel J. Knapke via Phil Blosser both of University of Dayton Research
Institute (UDRI) for use with CMCs:
1. Lightly sand (one to three passes maximum) surface to remove high points on surface
using 320 or 400 grit SiC paper. Do not try to sand flat.
2. If possible, clean the surface with isopropyl alcohol.
3. Draw pencil lines for orientation of gage through center (x and/or y as necessary).
4. Remove the strain gage from package and place face up on a smooth, flat, clean glass
surface.
5. Apply Vishay PCT-2M tape over the top of the gage with at least 1 additional length
of tape on both sides of the gage.
6. Remove the tape with the gage from the surface and apply the gage to the marked
specimen, aligning the arrows to the alignment marks.
7. Adjust the position of the gage by moving the tape as needed for proper alignment.
8. Peel back the tape until all the gage is off the surface.
49

9. Apply a very light application of M-Bond 200 catalyst to the back of the gage and
wait one minute to drying.
10. Apply M-Bond 200 adhesive to the specimen surface under the gage and apply the
tape and strain gage while keeping proper alignment.
11. Hold application pressure for two minutes with a finger in place over the tape and
strain gage
A bank of 11 rack-mounted Vishay Precision Group Model 2300 Signal Conditioning
Amplifiers (SCAs), seen in Figure 4.17 were used to provide 0.5V excitation voltage
to 350Ω strain gages and condition the signal before input to the MTS system for
recording. The SCAs were setup in accordance with provided documentation to balance
the system prior to calibration followed by calibration and finally balance of the strain
gages immediately prior to testing. Calibration was done with a Vishay Wheatstone-Bridge
Simulator model 1550A Strain Indicator Calibrator[4]. SCAs were calibrated from ±10V
at 0.0005 εV which provided a range of ±0.5%ε. The 11 SCAs were then wired to the Test
Star II controller analog to digital converter cards. Two cards were installed and available
and each card would accommodate up to six input channels.
Figure 4.17: Bank of Vishay 2310 rack-mounted strain gage signal conditioning amplifiers
50

Input from strain gages to SCAs was done via a three-wire connection using a true
quarter Wheatstone Bridge (internal dummy) setup, pictured in Figure 4.18. The internal
dummy setup was used due to the automatic leadwire resistance correction from the three-
wire circuit [1]. Strain gage lead wires were connected to the SCAs via wire jumpers seen
in Figure 4.19. The SCAs were connected to the jumpers via three-wires terminated with a
Bendix PT06A-14-15(SR) connector designed to a MIL-C-26482 connector. All 11 MIL-
C-26482 connectors were modified from from 120Ω to 350Ω setups. The MIL-C-26482
connector pin arrangement can be seen in Figure 4.20 and the associated wiring diagram
can be seen in Figure 4.21. This required desoldering wire from pin B in Figure 4.20 and
resoldering to pin C.
Figure 4.18: Quarter-bridge strain gage setup[1]
Strain gage application was accomplished first on the PMC tubes. Strain gage
setup and instrumentation procedures were vetted with the successful SCA setup and
strain gage installation followed by test data collection with the PMC tubes. Strain gage
application and use procedures were then applied to alumina test specimens. One alumina
specimen test was accomplished with strain gage instrumentation alone. The subsequent
alumina specimen test used the same strain gage instrumentation and the addition of a
DIC stochastic, or random, speckle pattern and Aramis software suite as an additional
51

Figure 4.19: Wire jumpers to signal conditioning amplifiers
Figure 4.20: MIL-C-26482 standard connector pin arrangement to signal conditioning
amplifiers[1]
full field measurement technique. DIC was used in a similar fashion as the uniaxial test
procedures. Two different trial procedures for creating the DIC random speckle pattern
using standard black laser printer toner ink powder and airbrush techniques were carried
out. Alumina tube specimens were painted with a sufficient layer of flat-white standard
52

Figure 4.21: Wiring diagram from strain gage to MIL-C-26482 standard connector pin[1]
household spray paint to achieve a uniform white background. Once the white paint was
dry, laser printer toner ink powder was filtered through a 74 µm and 149 µm sieve stacked
together as pictured in Figure 4.22. A 1/2” wide artist’s brush was lightly dipped into a
jar of toner powder. Speckling was accomplished by gently brushing the powder through
the sieve stack consisting of 74 µm and 149 µm sieves while moving the stack evenly over
the area of interest. As the rate of speckles falling through the sieve decreased, the sieve
stack was lightly tapped repeatedly and moved over the speckling area. This process was
repeated until a sufficiently speckled surface was achieved. The process in progress can be
seen in Figure 4.23 while the end result can be seen in Figure 4.24. It must be noted that
sufficient care was required to ensure that bumping of any sort was kept to a minimum to
prevent toner from being discharged from the surface area of interest. Laser toner provided
higher contrast and smaller speckles than the spray painted speckle patterns, both traits that
were highly desirable for this test setup.
53

Figure 4.22: Standard sieves used for brushing black laser printer toner powder through for
uniform stochastic speckle patterns
Figure 4.23: Laser printer toner speckling procedure on involute oxide-oxide CMC tube
54

Figure 4.24: Laser printer toner speckling on involute oxide-oxide CMC tube NOTE: this
pattern was not used
It was initially thought that the CMC specimens would provide a naturally sufficient
white background, eliminating the need for a white paint layer for laser toner speckling.
However, unlike the alumina specimens, the laser printer toner did not adhere to the CMC
tube surface as the toner did to the painted alumina specimens. As a result, the random
speckle pattern was spray painted on the involute oxide-oxide tubes in the same manner as
the uniaxial aluminum alloy and NextelTM 720/AS dogbone and straightsided specimens
with a flat black speckle pattern painted over a flat white background.
After specimen preparation, biaxial (tension-torsion) testing was completed as
follows:
1. Set and enable applicable MTS axial and torsional load/displacement limits
2. Connect strain gage(s) to signal conditioning amplifier(s), turn on for warm-up
3. Calibrate DIC (Aramis)
55

4. Install test specimen in upper grip with speckle pattern aligned to DIC (Aramis)
5. Align DIC (Aramis) field of view (FOV) with test specimen
6. Verify DIC (Aramis) correlation with speckle pattern using two images
7. Establish strain noise floor for Aramis (can use correlation verification images)
8. Balance (zero) strain gage(s) signal conditioning amplifier(s)
9. Perform the following steps as quickly as possible in order:
a. Switch to manual command - axial load = 0 kip, torsion torque = 0 in-kip
b. Grip lower grip
c. Turn off manual command
10. Balance (zero) strain gage(s) signal conditioning amplifier(s)
11. Turn off applicable MTS axial and torsional load/displacement limits
12. Execute test (Run MPT program)
4.6 Biaxial (Tension-Torsion) Test Method
4.6.1 Build Up Approach
Uniaxial tests at room temperature were conducted on NextelTM 720/AS dogbone
and straightsided specimens to determine involute layup properties. UTS in the axial
direction for the involute tubes was estimated with uniaxial dogbone involute coupon tests.
USS in the circumferential direction for the involute tubes was estimated with uniaxial
straightsided involute coupon tests. Dogbone and straightsided involute coupons were
prepared for characterization using DIC. The DIC system was vetted by this process
and was used as a full field measurement system. This was accomplished in a build up
approach to compare DIC against extensometer strain measurements. With reasonable
56

strain agreement between DIC and extensometer data, the DIC system could then be
used for full field strain measurement on the biaxial (tension-torsion) test specimens.
Uniaxial tensile testing was also conducted at 1100C on dogbone, straightsided, and DNS
specimens. Results were used to predict high-temperature performance of involute CMC
tubes[28].
4.6.2 Digital Image Correlation (DIC)
Aramis DIC system is a non-contact optical technique used to measure surface
displacements and strain fields of a test specimen subjected to an external stimulus, which
in the present research was a mechanically applied tensile load. DIC was developed in the
1980s as numerical computing was becoming available by M.A. Sutton and others at the
University of South Carolina (USC)[29]. In a typical DIC tests, a high-contrast speckle
pattern is created on the surface of the test specimen. Displacements are obtained by
capturing images of the speckles during a load application and comparing displacement
of speckles at each image to the original, unloaded, position. Strains are obtained by
differentiating displacement fields with strain resolutions of 10−4 or less. DIC is an
excellent full field strain measuring technique due its full field strain resolution. CMCs
undergo non-uniform deformation during loading due to their heterogeneous architecture.
Non-uniform deformation among fiber tows can be seen in uniaxial testing with CMCs.
DIC’s full field strain measurement and high strain resolution gives a higher probability
of capturing damage initiation and failure progression during loading. Resolution of DIC
is influenced by speckle, facet, and subset size and is determined by the individual user
and calibration. Data collected from DIC can then be used to formulate high-fidelity
computational models of oxide-oxide CMCs. Strain gages and extensometers have a
lower probability of capturing discrete damage events and measure average strain over
a discrete, localized areas. DIC has a higher probability than strain gages or extensometers
57

of capturing discrete damage events and measuring localized strains anywhere within its
field of regard[33].
4.6.3 Challenges and Objectives
Through collaboration with project sponsors at AFRL, Daniel and Ishai’s biaxial
(tension-torsion) list of requirements listed in Previous Biaxial (Tension-Torsion) Research
on Oxide-Oxide Thin-Wall Tubes was carefully considered and risk reduction carried
out. Previous researchers found that buckling was a challenge for similar types of
experiments[7]. Anti-buckling devices in the previous tests were used to overcome the
buckling challenges. Due to the high modulus of the oxide-oxide CMC tube in this study,
the risk of gage section buckling was determined to be low and no external anti-buckling
devices or mechanisms were used during testing. Due to the elimination of any anti-
buckling or other external support mechanisms that would contact the external surface of
the tube, chance of extraneous or nonhomogeneous stresses on the outside of the tubes was
reduced. Additionally, specimen geometry and MTS collet grip design provided loading
exclusively through grip sections. Several other tests experimented with load introduction
tab geometries often with sophisticated reinforcements or gripping procedures[26]. Load
introduction for this effort was accomplished through the use of aluminum alloy plug inserts
custom machined and epoxied in to take up the machining tolerances between the CMC
tube and aluminum alloy plug. Care was taken to have enough epoxy to fill the gap in
a uniform fashion. Additional measures were taken to prevent test result influence due to
excess epoxy as seen by Liao et al[26]. Careful consideration was taken to not use an excess
quantity of epoxy that would span across the tube diameter allowing crack propagation and
thus premature tube failure outside the gage section.
Three test setup parameters posed the biggest challenges to biaxial (tension-torsion)
testing. Specimen development and manufacture, gripping the test specimens, and
specimen failure outside of the gage section. Specimen development and manufacture in
58

Figure 4.25: Aluminum alloy grip support plug inserts custom machined to each tube end to
prevent grip section crushing during alumina and oxide-oxide CMC tension-torsion testing
the present study required approximately one year to complete (including six months of
fiber architecture development and six months of fabrication) and was carried out by the
project sponsors at AFRL and COI Ceramics, an ATK Aerospace Affiliate, in San Diego,
California. Small specimen diameters would be desirable to minimize material costs and
enable the use of smaller test stands. Minimum tube diameters are required due to the
brittle nature of the ceramic fibers when they are wrapped to form the tube circumference.
Diameter limits increase test resource requirements including the machinery required for
the biaxial (tension-torsion) tests, raw materials, and machining required including tooling
and layup machinery. This manufacturing process presents a non-trivial task for wound-
type tubes. An innovative layup similar to a fanning of a deck of cards was proposed and
used by COI Ceramics. This layup allows for a machining option to obtain smaller radii per
a specified design. This also allows for a more conventional biaxial (tension-torsion) tube
design with a reduced gage section and thicker gripping sections on the specimen top and
bottom with a transition zone of a set machined radius between the grip and gage section
as seen in Figure 4.14. Time and fiscal resource requirements for tube manufacture are
significantly higher than flat uniaxial tensile coupons.
Gripping the test specimens required special attention. MTS collet grip estimation
algorithms were provided. Collet grip estimation algorithms were intended for use with
59
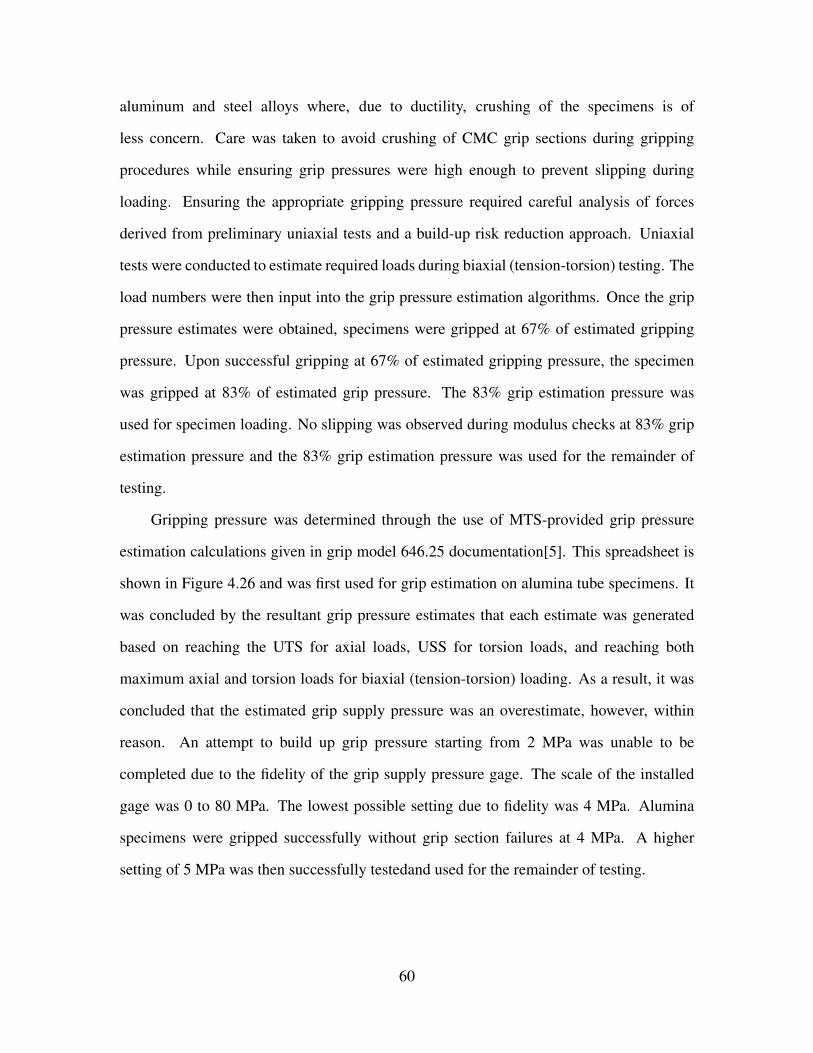
aluminum and steel alloys where, due to ductility, crushing of the specimens is of
less concern. Care was taken to avoid crushing of CMC grip sections during gripping
procedures while ensuring grip pressures were high enough to prevent slipping during
loading. Ensuring the appropriate gripping pressure required careful analysis of forces
derived from preliminary uniaxial tests and a build-up risk reduction approach. Uniaxial
tests were conducted to estimate required loads during biaxial (tension-torsion) testing. The
load numbers were then input into the grip pressure estimation algorithms. Once the grip
pressure estimates were obtained, specimens were gripped at 67% of estimated gripping
pressure. Upon successful gripping at 67% of estimated gripping pressure, the specimen
was gripped at 83% of estimated grip pressure. The 83% grip estimation pressure was
used for specimen loading. No slipping was observed during modulus checks at 83% grip
estimation pressure and the 83% grip estimation pressure was used for the remainder of
testing.
Gripping pressure was determined through the use of MTS-provided grip pressure
estimation calculations given in grip model 646.25 documentation[5]. This spreadsheet is
shown in Figure 4.26 and was first used for grip estimation on alumina tube specimens. It
was concluded by the resultant grip pressure estimates that each estimate was generated
based on reaching the UTS for axial loads, USS for torsion loads, and reaching both
maximum axial and torsion loads for biaxial (tension-torsion) loading. As a result, it was
concluded that the estimated grip supply pressure was an overestimate, however, within
reason. An attempt to build up grip pressure starting from 2 MPa was unable to be
completed due to the fidelity of the grip supply pressure gage. The scale of the installed
gage was 0 to 80 MPa. The lowest possible setting due to fidelity was 4 MPa. Alumina
specimens were gripped successfully without grip section failures at 4 MPa. A higher
setting of 5 MPa was then successfully testedand used for the remainder of testing.
60
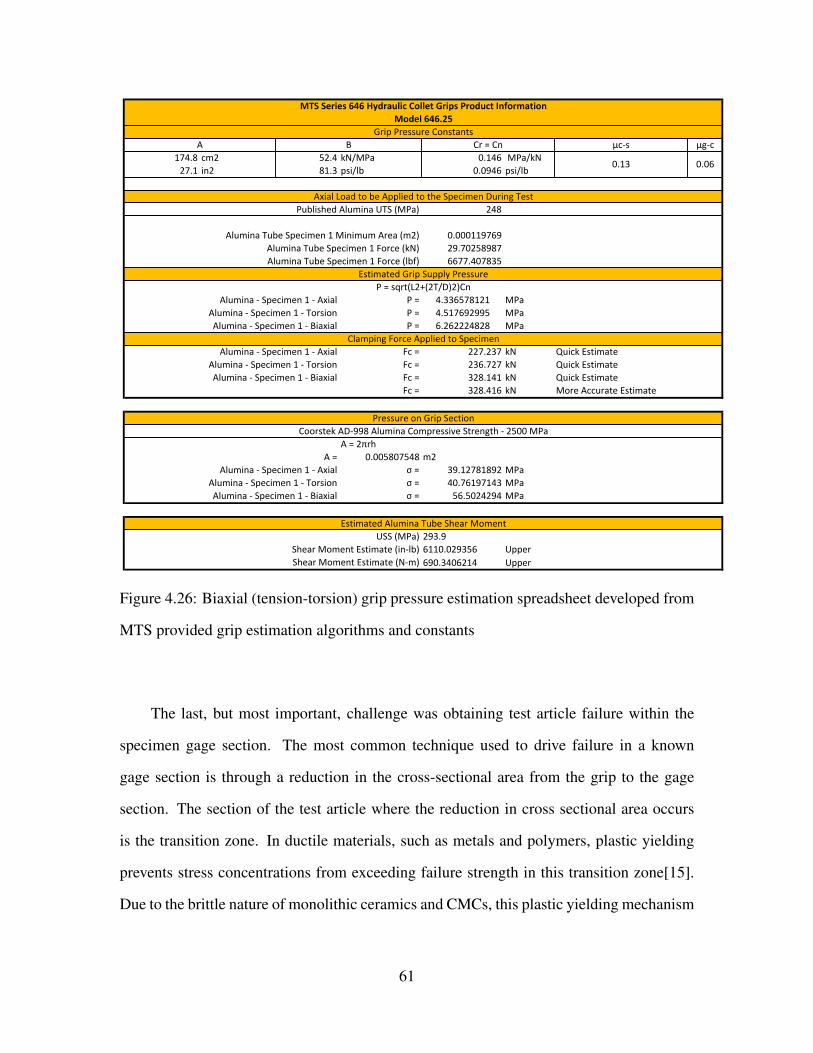
µc#s µg#c
174.8 cm2 52.4 kN/MPa 0.146 6MPa/kN
27.1 in2 81.3 psi/lb 0.0946 psi/lb
248
0.000119769
29.70258987
6677.407835
P6= 4.336578121 MPa
P6= 4.517692995 MPa
P6= 6.262224828 MPa
Fc6= 227.237 kN Quick6Estimate
Fc6= 236.727 kN Quick6Estimate
Fc6= 328.141 kN Quick6Estimate
Fc6= 328.416 kN More6Accurate6Estimate
A6=62πrh
A6= 0.005807548 m2
σ6= 39.12781892 MPa
σ6= 40.76197143 MPa
σ6= 56.5024294 MPa
6110.029356 Upper
690.3406214 Upper
P6=6sqrt(L2+(2T/D)2)Cn
Estimated6Grip6Supply6Pressure
MTS$Series$646$Hydraulic$Collet$Grips$Product$InformationModel$646.25
Grip6Pressure6Constants
A B Cr6=6Cn
0.13 0.06
Axial6Load6to6be6Applied6to6the6Specimen6During6Test
Published6Alumina6UTS6(MPa)
Alumina6Tube6Specimen616Minimum6Area6(m2)
Alumina6Tube6Specimen616Force6(kN)
Alumina6Tube6Specimen616Force6(lbf)
Alumina6#6Specimen616#6Biaxial
Alumina6#6Specimen616#6Axial
Alumina6#6Specimen616#6Torsion
Alumina6#6Specimen616#6Biaxial
Clamping6Force6Applied6to6Specimen
Alumina6#6Specimen616#6Axial
Alumina6#6Specimen616#6Torsion
Alumina6#6Specimen616#6Biaxial
Pressure6on6Grip6Section
Coorstek6AD#9986Alumina6Compressive6Strength6#625006MPa
Alumina6#6Specimen616#6Axial
Alumina6#6Specimen616#6Torsion
Estimated6Alumina6Tube6Shear6Moment
USS6(MPa) 293.9
Shear6Moment6Estimate6(in#lb)
Shear6Moment6Estimate6(N#m)
Figure 4.26: Biaxial (tension-torsion) grip pressure estimation spreadsheet developed from
MTS provided grip estimation algorithms and constants
The last, but most important, challenge was obtaining test article failure within the
specimen gage section. The most common technique used to drive failure in a known
gage section is through a reduction in the cross-sectional area from the grip to the gage
section. The section of the test article where the reduction in cross sectional area occurs
is the transition zone. In ductile materials, such as metals and polymers, plastic yielding
prevents stress concentrations from exceeding failure strength in this transition zone[15].
Due to the brittle nature of monolithic ceramics and CMCs, this plastic yielding mechanism
61

is not present thereby making it difficult to obtain test article failure within a gage section.
Failure inside the gage section is required for accurate measurements and analysis of the
failure loads and mechanisms. Oftentimes failures in brittle thin-walled tubes occur outside
the gage section in either the transition zone or the gripping section.
A load spreadsheet was developed to determine biaxial (tension-torsion) test specimen
loads, independently, which was required for calculating stress based off of specimen gage
section geometry. This spreadsheet is shown in Figure 4.27.
Specimen(IDDesired(Stress,(τ((MPa)
Outer(Diameter,(Do((mm)
Inner(Diameter,(Di(
(mm)
Radius,(r((mm)
2d(Moment(of(Inertia,(J(
(m4)
Torque,(T((in@kip)
Desired(Stress,(σ((MPa)
Area,(A(
(m2)Force,(P((kip)
Thin%Wall)Tube)%)Specimen)X 2 41.08 39.18 20.54 4.82463E%08 0.042 2 0.00012 0.0543.5 41.08 39.18 20.54 4.82463E%08 0.073 3.5 0.00012 0.0945 41.08 39.18 20.54 4.82463E%08 0.104 5 0.00012 0.13510 41.08 39.18 20.54 4.82463E%08 0.208 10 0.00012 0.26920 41.08 39.18 20.54 4.82463E%08 0.416 20 0.00012 0.53925 41.08 39.18 20.54 4.82463E%08 0.520 25 0.00012 0.67380 41.08 39.18 20.54 4.82463E%08 1.663 80 0.00012 2.15450 41.08 39.18 20.54 4.82463E%08 1.039 50 0.00012 1.346100 41.08 39.18 20.54 4.82463E%08 2.079 100 0.00012 2.693150 41.08 39.18 20.54 4.82463E%08 3.118 150 0.00012 4.039200 41.08 39.18 20.54 4.82463E%08 4.158 200 0.00012 5.385250 41.08 39.18 20.54 4.82463E%08 5.197 250 0.00012 6.731300 41.08 39.18 20.54 4.82463E%08 6.237 300 0.00012 8.078350 41.08 39.18 20.54 4.82463E%08 7.276 350 0.00012 9.424400 41.08 39.18 20.54 4.82463E%08 8.316 400 0.00012 10.770
Torsion Axial
Figure 4.27: Biaxial (tension-torsion) load spreadsheet with independent axial load and
torsion torque calculations.
Axial loads recorded during testing were used to calculate axial engineering stress.
Calculation of axial stress from axial load was done using standard methods as shown in
Equation (4.3).
62

σ =PA
(4.3)
where
σ = Axial Stress (Pa)
P = Axial Force (N)
A = Cross-Sectional Area (m2)
For simplicity, for the remainder of the document, the term ”axial stress” will be used
to indicate ”axial engineering stress.” Axial displacement recorded during testing was used
to calculate strain. Calculation of axial strain from axial displacement was done using
standard methods as shown in Equation (4.4).
ε =∆LL0
(4.4)
where
ε = Axial Engineering Strain (mmmm
)
∆L = Axial Change in Length (mm)
L0 = Original Length (mm)
Torsional loads (torque) recorded during testing were used to calculate shear stress.
Calculation of shear stress from torque was done using standard methods as shown in
Equation (4.5).
63

τ =TρJ
(4.5)
where
τ = Engineering Shear Stress (Pa)
T = Torque (N-m)
ρ = Outer Radius (m)
J = Second Polar Moment of Inertia (m4)
The second polar moment of inertia is calculated as:
J =π
32(D4
O − D4I ) (4.6)
where
D4O = Outer Tube Diameter (m)
D4I = Inner Tube Diameter (m)
Time synchronization was required between the MTS loadframe and Aramis DIC
system for NextelTM 720/AS involute tube tests incorporating DIC, as in uniaxial tests.
Time synchronization was required for Aramis to accuratly record applied load data from
the MTS loadframe for use with displacement and strains data collected by Aramis. Since
the Aramis system only had two analog-to-digital recording channels, the MTS loadframe
digital-to-analog outputs were programmed to output axial load and torsion torque to the
MTS loadframe and Aramis system triggerbox for recording. Coaxial cables were used for
this connection. Synchronization was achieved via a 5V TTL signal connected via coaxial
cable from MTS loadframe to the Aramis trigger box. The 5V TTL trigger signal then was
started at the test start via the MTS Station Manager software and triggered every second
64

for the test duration. The Aramis system subsequently was set to receive the 5V TTL signal
and record an image set.
The torsion-to-failure test was carried out in torque control with loading rates of 1
MPa/sec to initiate fast fracture and ensure an adequate number of DIC image sets, or
stages, while not overloading the processing power of the DIC system. The 1 MPa/sec
loading with a target of 50 MPa yielded a 46.01 second test. From uniaxial testing, it was
expected that 1 MPa/sec loading would yield 20-30 Aramis stages due to the system lag
from the Aramis systems maximum of one (1) stage per second stage capturing ability. Data
was acquired at 102.40 Hz. Axial force, torsion torque, time, and all 11 strain gage data
was recorded. Strain gage data was recorded in Volts and transformed live into mm/mm.
Additionally, axial force command, axial force absolute error, torsion torque command,
torsion torque absolute error, and torsion angle were recorded for possible post-test error
analysis. This procedure can be seen in Appendix A, Figure 6.7.
The biaxial (tension-torsion) proportional load procedure was performed after the
torsion-to-failure test and was designed to initiate axial failure prior to torsion failure. The
predicted axial UTS was 228 MPa based on uniaxial dogbone specimen testing and the
predicted USS load of 32.6 MPa was observed from the pure torsion-to-failure test. Due to
the desire to observe axial failure prior to torsion failure, a target of 228 MPa axial stress
and 16.3 MPa shear stress was set. Axial load rates of 1 MPa/sec, which were desirable
to give a higher probability of the Aramis system capturing crack initiation and/or crack
propagation, yielded a test time of 455.83 seconds. Due to Aramis system limitations, an
axial loading of 4 MPa/sec was required to obtain a reasonable test time of 85.5 seconds.
Due to proportional loading, this related to a torsional loading of 0.143 MPa/sec. Data
was acquired at 102.40 Hz. Axial force, torsion torque, time, and all 11 strain gage data
was recorded. Strain gage data was recorded in Volts and transformed live into mm/mm.
Additionally, axial force command, axial force absolute error, torsion torque command,
65

torsion torque absolute error, and torsion angle were recorded for possible post-test error
analysis. This procedure can be seen in Appendix A, Figure 6.7.
66

V. Results and Discussion
In order to design components that meet life, cost, and performance goals, aerospace
structural designers must have a robust understanding of the materials options available to
them and must be able to estimate when and how candidate materials will fail under load.
Complex loading, such as the biaxial (tension-torsion) of the present study, make such an
estimate all the more challenging. Overestimation of failure onset can result in unexpected
component or system failure and could potentially lead to loss of life. Underestimation of
failure onset results in excessive factors of safety, unnecessarily heavy components, and
possibly a failure to achieve mission-specific goals. Failure criteria have been developed to
guide engineers in the design process and to ensure safety and performance.
For typical aerospace materials such as aluminum, steel, and titanium, the design
guidelines, failure criteria, and appropriate safety factors needed to meet program and
system life cycle costs are relatively well understood. The knowledge base for aerospace
alloys has been developed over many decades through an extensive use of metals in diverse
aerospace applications. Metals are typically characterized with an initial elastic response
followed by yield and a gradual transition toward plastic behavior. Designers typically
assume isotropic behavior and these assumptions generally hold true.
Several failure criterion were developed in large part for metals undergoing multiaxial
loading. Arguably the two most commonly-used criteria are the Tresca failure criterion
and the von Mises failure criterion. The Tresca failure criterion, also known as the
maximum shear stress criterion, assumes that failure of a material in multiaxial loading
occurs when the maximum shear stress that develops exceeds a limit value. This limit
value is the same as the shear stress that is developed under purely uniaxial tensile loading
at the point of tensile failure. The von Mises failure criterion takes a similar approach,
but evaluates maximum strain energy, rather than max shear stress. von Mises predicts
67

failure when the maximum multiaxial strain energy exceeds the maximum strain energy
at onset of uniaxial failure. Tresca is generally considered to be more conservative than
von Mises. Both these criteria provide useful estimates of the failure of typical isotropic,
ductile, monolithic aerospace alloys, but are less useful in evaluating anisotropic, laminate
composites, especially brittle CMCs.
Other failure criteria have been developed that better match the behavior of laminate
composites such as those in the present study. Since in most ceramics and CMCs, failure
occurs before yield stress is reached, Tresca and von Mises do not really apply. Tsai-
Hill and Tsai-Wu criteria, while not specifically designed for oxide-oxide CMCs, are more
applicable to laminate composite materials, and can be used to predict the onset of laminate
failure in a composite material that is undergoing a complex loading state. In order to
better predict the behavior of the CMC material and layup used in the present study, it was
considered useful to evaluate the test data in the context of these more applicable failure
criteria[15].
While the materials and test conditions in the present study were not an ideal match
for the Tsai-Hill or Tsai-Wu failure criteria, it was felt that Tsai-Hill and Tsai-Wu were
better suited than were Tresca and von Mises. Both, Tsai-Hill and Tsai-Wu were used to
estimate the failure envelope for the oxide-oxide CMC involute tubes. The equations for
Tsai-Hill theory are listed in Equation (5.1) below.
Aσ21 + Bσ2
2 + Cσ1σ2 + Dτ26 = 1 (5.1)
In a biaxial state with axial tension and in-plane shear stress, σ2 = 0 and thus the
Tsai-Hill criterion reduces to Aσ21 + Dτ2
6 = 1. With A = 1F2
1and D = 1
F26, Equation (5.1)
reduces to Equation (5.2).
σ21
F21
+τ2
6
F26
= 1 (5.2)
68

In the case of these tests, F21 represents F1t or UTS because σ1 > 0 and F2
6 represents
USS.
To obtain the values for UTS, dogbone specimens having a 0 fiber orientation were
tested. To obtain the values for USS, straightsided specimens with a 90 fiber orientation
were tested. A plot of the von Mises and Tresca along with the Tsai-Hill failure criterion is
shown in Figure 5.1.
0
50
100
150
200
250
0 20 40 60 80 100 120 140
Axi
al S
tres
s (M
Pa)
Shear Stress (MPa)
NextelTM 720/AS Biaxial Failure Envelopes
von Mises
Tresca (max shear stress)
Tsai-Hill
Figure 5.1: Biaxial (tension-torsion) failure envelope comparison
The results of tests conducted on the dogbone-shaped specimens are summarized in
Table 5.1. Due to the limited number of tests, the results represent a qualitative assessment
more than an explicit determination of properties. These tests, ultimately, were utilized to
assist with prediction of biaxial (tension-torsion) failure loads.
69

Specimen # Test Type Environment UTS Strain Notes
(MPa) (%)
12-110 Monotonic Tension Air - Room Temperature 211.95 0.422
12-112 Tension-Tension Air - Room Temperature 230.88 0.311 DIC Test
12-109 Tension-Tension Air - 1100C 238.56 0.268
12-111 Tension-Tension Air - 1100C 224.58 0.321
12-113 Monotonic Tension Air - 1100C 222.62 0.348
Table 5.1: Summary of dogbone (0) specimen tests
5.1 Dogbone Specimens
5.1.1 Monotonic Loading Tests
A monotonic loading test was run in tension both at room temperature and 1100C in
laboratory air. The results from these single tests are presented in Figure 5.2. While these
represent single data points, it should be noted that the test run at elevated temperature
displayed a higher UTS and lower strain to failure than the test at room temperature.
Figure 5.3 shows a ”fiber-pullout-like” behavior with definite fiber breakage, and a tortuous
fracture surface. These indicators, especially the non-planar fracture surface, indicate the
presence of satisfactory crack deflection mechanisms. As discussed previously in the
background, the tortuous surface indicates that the path length of each crack has been
lengthened which indicates that more work, or load, is required for the cracks to propagate
through the specimen. Additional fracture surface images of specimen 12-113 can be seen
in Figure 6.19 located in Appendix A. Of significant note is the similarities between both
specimen 12-113 and the failure of the oxide-oxide CMC involute tube specimen 12-064
seen in Figure 5.34 which was biaxially loaded to failure in combined tension-torsion and
discussed later.
70

0
50
100
150
200
250
0.0 0.1 0.2 0.3 0.4 0.5
Stre
ss (M
Pa)
Strain (%)
Nextel™ 720/AS Dogbone-Shaped Specimen, Monotonic Load
Air
211.95 MPa 12-110
Room Temperature
222.62 MPa 12-113 1100ºC
Figure 5.2: Stress vs. Strain curves obtained in monotonic tension tests of NextelTM 720/AS
dogbone-shaped specimens
The UTS of the dogbone monotonic tension test provided the first estimation point on
the failure curve in Figure 5.4.
5.1.2 Sequentially Loaded Tension Tests
Sequentially Loaded Tension tests were repeated in an effort to obtain data for
computational modeling with DIC. Results are presented in Figure 5.5. It should be noted
that the UTS average of the two elevated temperature tests exceed the UTS of the room
temperature test as was also observed in the monotonic tension tests. Additionally, failure
strains at higher UTSs yielded lower failure strains.
In addition to failure stresses used for biaxial (tension-torsion) failure predictions,
Figure 5.6 and Figure 5.7 present an interesting view of the build up to biaxial (tension-
torsion) testing. The uniaxial studies served to verify that useful displacement and strain
71

Figure 5.3: Fracture surface of NextelTM 720/AS dogbone specimen 12-113 tested in
monotonic tension to failure at 1100C in laboratory air, top, right side
data could be obtained with the use of DIC. Figure 5.6 presents the displacements
of NextelTM 720/AS dogbone-shaped specimen 12-112. The displacement measured in
the specimen resulted from the corresponding bottom-to-top movement of the hydraulic
actuator during specimen loading. The specimen is being held stationary at the top. The
images presented to the left of the full-field displacements (moving from far right to left),
are the individual Aramis DIC cameras’ field of regard. In these two images, the location
of the extensometer rods can be seen. This illustrates the limitation that extensometers
only provide strain data at one finite point. Unlike extensometers, DIC’s full field
displacement and strain measurement capability provides a higher probability of capturing
failure displacements and strains. Additionally, it can be seen that the displacement is not
symmetric in Figure 5.6. This asymmetry could be due to specimen misalignment. Seeing
72

0
50
100
150
200
250
0 50 100 150
Axi
al S
tres
s (M
Pa)
Shear Stress (MPa)
NextelTM 720/AS Biaxial Failure Envelopes
von Mises
Tresca (max shear stress)
Tsai-Hill
Uniaxial Tensile Test (0º)
Figure 5.4: Biaxial (tension-torsion) failure envelope with dogbone UTS point
this alignment issue is another advantage of DIC over a single point strain measurement
such as an extensometer or strain gage.
Figure 5.7 displays the specimen just after failure. When compared with failure
displacements seen in Figure 5.6, it appears that the DIC system correlates reasonably
well to failure initiation sites. The agreement between DIC stage points used as a
virtual extensometer and the actual extensometer mounted seen in Figure 5.5 provided the
necessary confidence to move forward with DIC use as a measurement technique during
biaxial (tension-torsion) testing.
Micrographs of the remaining dogbone specimens can be seen in Figure 6.17 through
Figure 6.21 in Appendix A.
73

0
50
100
150
200
250
0.0 0.1 0.2 0.3 0.4
Stre
ss (M
Pa)
Strain (%)
Nextel™ 720/AS Dogbone-Shaped Specimens
Air
230.88 MPa 12-112
Room Temperature
238.56 MPa 12-109 1100ºC
224.58 MPa 12-111 1100ºC
Aramis DIC 12-112
Room Temperature
Figure 5.5: Stress vs. Strain curves without hysteresis removed obtained in sequentially
loaded tension tests of NextelTM 720/AS dogbone-shaped specimens
Figure 5.6: NextelTM 720/AS dogbone specimen just before failure
74

Figure 5.7: NextelTM 720/AS dogbone specimen just after failure
75
5.2 Straightsided Specimens
Similar to the dogbone-shaped specimens, the straightsided specimens cut in the 90,
orientation tests are summarized in Table 5.2. Due to the limited number of tests, the results
represent a qualitative assessment more than an explicit determination of properties. These
tests, ultimately, were utilized to assist with prediction of biaxial (tension-torsion) failure
loads.
Specimen # Test Type Environment UTS Strain Notes
(MPa) (%)
12-099 Monotonic Tension Air - 1100C 46.36 0.051
12-100 Monotonic Tension Air - 1100C 45.88 N/A* *Extensometer Slip
12-098 Monotonic Tension Air 49.11 0.081 DIC Test
12-106 Monotonic Tension Air 39.44 0.066
Table 5.2: Summary of straightsided (90) specimen tests
The results of the straightsided specimens were complimentary to the results seen
with fiber-dominated properties in that higher temperatures yielded, on average, higher
UTS and lower failure strains than at room temperature. UTS was lower, as expected, than
dogbone-shaped specimens due to the matrix-dominated properties. Micrographs of the
straightsided specimens can be seen in Figure 6.22 through Figure 6.25 in Appendix A.
These tests yielded estimates to the shear stress values seen in Figure 5.25.
The higher values of USS are the values obtained in the monotonic straightsided
tests. A comparison to the DNS specimens was desired. DNS specimens measure a pure
ILSS matrix-dominated value. While the straightsided specimens did measure a matrix-
dominated shear strength, this was not a pure shear strength value. As a result a stress
76

0
10
20
30
40
50
60
0.00 0.02 0.04 0.06 0.08 0.10
Stre
ss (M
Pa)
Strain (%)
Nextel™ 720/AS
Straghtsided Specimen
39.44 MPa Specimen 12-106
Room Temperature
49.11 MPa 12-098
Room Temperature 46.36 MPa
12-099 1100ºC
Figure 5.8: Stress vs. Strain curves obtained in tension test of NextelTM 720/AS
straightsided specimens 12-098, 12-099, and 12-106
transformation had to be made. With the assumption that the angle between involute plies
was 7, the stress tensor rotations are as follows:
σ′x = σxcos2θ + σysin2θ − 2τxysinθ cosθ (5.3)
τ′xy = (σx − σy)sinθ cosθ + τxy(cos2θ − sin2θ) (5.4)
Equation (5.4) reduces to Equation (5.5) with the x-direction being the uniaxial load
direction and the y being the through thickness direction as follows:
τ′xy = σxsinθ cosθ (5.5)
With the angle here being from the horizontal, 90 - 7 or nominally 83,
Equation (5.5) equates to:
77

0
50
100
150
200
250
0 50 100 150
Axi
al S
tres
s (M
Pa)
Shear Stress (MPa)
NextelTM 720/AS Biaxial Failure Envelopes
von Mises
Tresca (max shear stress)
Tsai-Hill
Uniaxial Tensile Test (0º)
Uniaxial Tensile Test (90º)
SS Shear*
Figure 5.9: Biaxial (tension-torsion) failure envelope with monotonic UTS and USS
τ′xy = 0.12σx (5.6)
Thus, the comparative value of 5.31 MPa of shear stress can be compared to ILSS
values in the DNS specimens. The pure shear and monotonic ultimate strength values of
the straightsided specimens can be seen in Figure 5.25.
5.3 Double-Notch Shear (DNS) Specimens
The DNS specimen tests are summarized in Table 5.3. Due to the limited number of
tests, the results represent a qualitative assessment.
A total of three interlaminar shear monotonic compression tests were carried out at
1100C in laboratory air. The results from these tests are presented in Table 5.3. ILSS
results at 1100C represent values previously unpublished by COI Ceramics [3]. These
78

ILSS Failure Strain Creep Stress
Specimen # Test Type Environment (MPa) (%) (MPa)
1 Monotonic Compression Air - 1100C 7.43 0.102 -
2 Monotonic Compression Air - 1100C 7.60 0.238 -
3 Monotonic Compression Air - 1100C 7.60 0.078 -
5 Compressive Creep Air - 1100C - 0.317 6
6 Compressive Creep Air - 1100C - 0.384 5
7 Compressive Creep Air - 1100C - 0.471 4
8 Compressive Creep Air - 1100C - 0.072 2
9 Compressive Creep Steam - 1100C - 0.345 6
Table 5.3: Summary of DNS Specimen Tests
tests served to determine the appropriate 80% ILSS levels at which interlaminar shear creep
test could be performed. The selection of 6 MPa for initial high temperature interlaminar
shear creep tests represented a stress level of 79.5% observed ILSS values. The absolute
stress versus absolute strain of these three tests are plotted in Figure 5.10.
The results of the monotonic compression yielded the final estimate for potential
failure strengths of the biaxial oxide-oxide involute tube specimens. This estimate is plotted
on the biaxial failure envelope estimation. Of note is the relative closeness of value to that
of the shear stress transformed values of the straightsided specimens. DNS specimens
were tested at elevated temperature and the straightsided transformed shear strength value
was obtained at room temperature, thus, these values should not be used for quantitative
comparison. These points can all be seen in Figure 5.11.
Following the ILSS testing, interlaminar shear creep tests were performed at 1100C
in laboratory air. The results of these tests are seen in Figure 5.13. Runout was set at 100
79

0
1
2
3
4
5
6
7
8
0.00 0.05 0.10 0.15 0.20 0.25 0.30
AB
S St
ress
(MPa
)
ABS Strain (%)
Nextel™ 720/AS DNS Specimens T = 1100ºC
Specimen 2 7.60 MPa
Specimen 1 7.43 MPa
Specimen 3 7.60 MPa
Figure 5.10: ABS Shear Stress vs. ABS Strain curves obtained in compression test of
NextelTM 720/AS DNS specimens 1, 2, and 3 at 1100C
hours, but was never obtained. After failing to achieve runout at 4 MPa, an estimation
spreadsheet was created and a best fit curve was placed on the first three data points of
6, 5, and 4 MPa. A runnout time of 360,000 seconds, or 100 hours, was placed into the
equation, displayed in Figure 5.12, and solved for stress in MPa. A stress of 2.15 MPa was
determined and a 2 MPa test was accomplished. Unfortunately, while creep levels were
extremely low, the material still failed to achieve runout. Elevated temperatures in steam
for comparison to test results in air were then carried out. The first test of 6 MPa in steam at
1100C was carried out after a steam temperature calibration was carried out. The results
of the 6 MPa test in both air and steam are shown in Figure 5.14.
After specimen failure, micrographs of the fracture surfaces were taken. Micrographs
of specimen 1 are shown in Figure 5.15. Figure 5.14 shows the comparison of 6 MPa tests
80

0
50
100
150
200
250
0 50 100 150
Axi
al S
tres
s (M
Pa)
Shear Stress (MPa)
NextelTM 720/AS Biaxial Failure Envelopes
von Mises
Tresca (max shear stress)
Tsai-Hill
Uniaxial Tensile Test (0º)
Uniaxial Tensile Test (90º)
DNS*
SS Shear*
Figure 5.11: Biaxial (tension-torsion) failure envelope with monotonic UTS, USS, and
ILSS values
in both air and steam. Specimen 1, tested for ILSS exhibited fast fracture with a very clean
fracture surface and very little fiber breakage. Specimen 6, which was run in an interlaminar
creep test at 6 MPa, exhibited similar fracture surface properties as Specimen 1. However,
in steam, specimen 9, tested in interlaminar creep at 6 MPa in steam demonstrated rougher
fracture surfaces with even less fiber breakage. Additionally, despite no modification of the
failure detector which previously had worked flawlessly, fracture surfaces began to exhibit
breakage at the machined notches orthogonal to the shear surfaces. The remainder of the
fracture surfaces can be seen in Figure 6.26 through Figure 6.35 in Appendix A.
Specimens 10, 11, and 12 could have failed due to buckling from DNS specimen
notches failing to meet the -0 ASTM specified t/2 cut depth per Figure 3.11 and Table 3.1.
Images of this shortfall in Specimen 12 are pictured in Figure 5.17 and Figure 5.18 where
81

0
1
2
3
4
5
6
7
0 100,000 200,000 300,000 400,000
AB
S St
ress
(MPa
)
Time (seconds)
DNS Creep Runout Stress Estimation
y = -1.533ln(x)+21.7
Figure 5.12: DNS creep runout stress estimation spreadsheet with curve fit to 6, 5, and 5
MPa to estimate runout at 360,000 seconds (100 hours) used for NextelTM 720/AS in air at
1100C
one side fails to meet specification and one side appears to touch centerline. Failing to meet
the -0 t/2 specification would prevent ILSS failure as was intended and desired. It should
be noted that failing to achieve ILSS modes of failure only occurred in steam rather than
in both air and steam. Failing to achieve ILSS could be the result of many issues including
specimen geometry or changes to materials due to the environment.
82

0.0
0.1
0.2
0.3
0.4
0.5
0.6
0.7
0 5 10 15 20 25 30
AB
S St
rain
(%)
Time (hr)
2 MPa Nextel™ 720/AS DNS Specimen
Compressive Creep T = 1100°C, air
4 MPa
5 MPa
6 MPa
Figure 5.13: ABS Strain vs. Time curve for interlaminar shear creep tests on NextelTM
720/AS in air at 1100C
0
0.05
0.1
0.15
0.2
0.25
0.3
0.35
0.4
0 2 4 6 8 10 12
AB
S St
rain
(%)
Time (Hr)
Nextel™ 720/AS 6 MPa Compressive Creep
T = 1100ºC
Steam
Air
Figure 5.14: 6 MPa ABS Strain vs. Time curve comparison of interlaminar shear creep
tests on NextelTM 720/AS in air and steam at 1100C
83
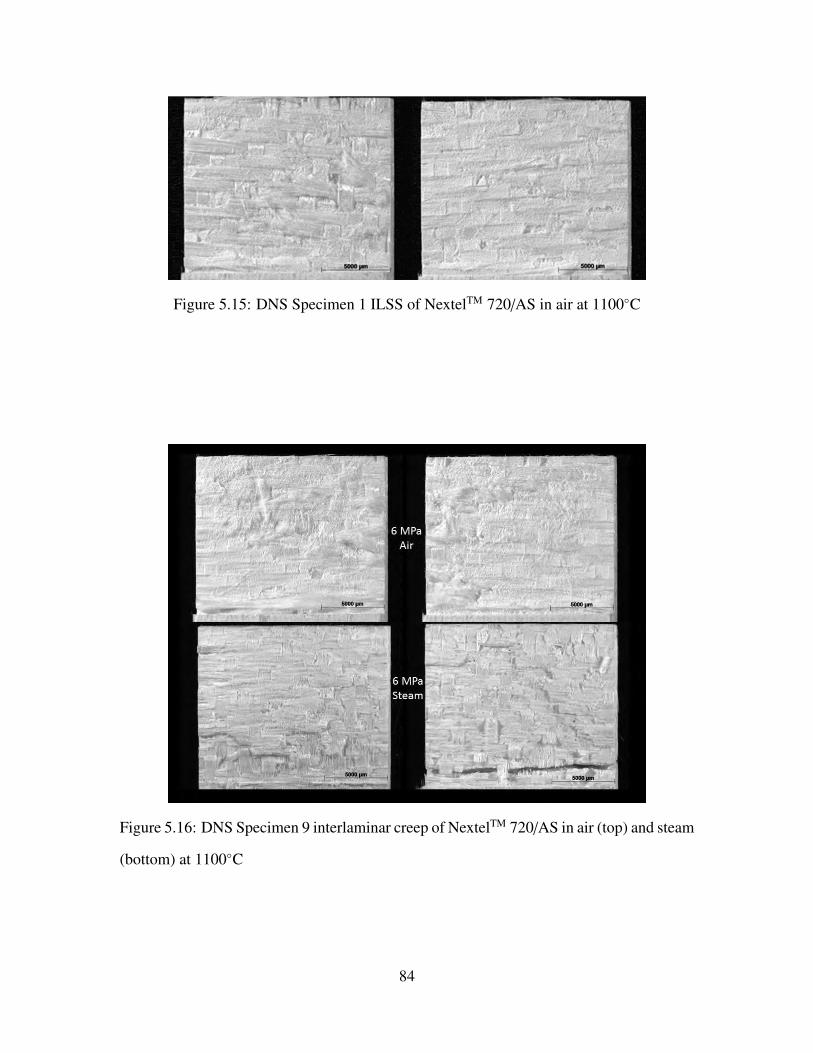
Figure 5.15: DNS Specimen 1 ILSS of NextelTM 720/AS in air at 1100C
Figure 5.16: DNS Specimen 9 interlaminar creep of NextelTM 720/AS in air (top) and steam
(bottom) at 1100C
84

Figure 5.17: DNS specimen 12 left side notch undercut by 51.19µm - specimen failed
unsatisfactorily under 4 MPa creep load at 1100C in steam
Figure 5.18: DNS specimen 12 right side cut to specification - specimen failed
unsatisfactorily under 4 MPa creep load at 1100C in steam
85

5.4 Thin-Wall Tube Specimens
All tests were accomplished at room temperature in laboratory air.
Specimen # Test Type UTS USS γxy γxy γxy γxy Failure Mode
Average Left Center Right
(MPa) (MPa) (%) (%) (%) (%)
12-063 Torsion to Failure ∼0 32.68 0.31 0.24 0.41 0.29 Torsion
12-064 Biaxial to Failure 171.74 11.83 0.32 0.28 0.37 0.31 Torsion
Table 5.4: Summary of oxide-oxide CMC involute tube specimen tests
Data reduction was accomplished on MTS and DIC acquired data. Shear strain data
was reduced from the three rectangular strain rosettes. The three rosettes each individually
measured εA, εB, and εC. The circumferential gage, εA was the 0 reading, εB was the 45
gage reading, and εC is the axial or lengthwise gage reading at 90. All three gages had units
of µε. These direct readings could be transformed into shear strain, γxy via the following
equations[14]:
εA = εxx εB =12
(εxx + εyy + γxy) εC = εyy where γxy = 2εB − εA − εC (5.7)
Once calculated, shear strain, could be plotted against the stress of interest.
Figure 5.19 is a plot of the applied shear stress during the pure torsion test of CMC
tube Specimen 12-063. Several factors influence the output of the stress/strain curves
when using strain gages. Due to human error, strain gages bond quality can vary from
installation to installation. The more iterations of installation and data collection that are
carried out, the more an individual’s techniques and processes for successful installation
can be refined and increase the probability of successful installation. In other words, strain
86

gage installation is a variable uncontrollable by machine and thus will have some variability
installation to installation. Differences in strain gage locations will also result in different
strains measured. In the case of specimen 12-063, the center rosette was the closest gage
to the failure sites as seen in the center image of Figure 5.20. This explained the higher
shear strains seen in Figure 5.19. Further, the left and right rectangular strain gage rosettes
(far left and far right, respectively of Figure 5.20) appeared to qualitatively show the next
highest and lowest, respectively, strains based on the distance from the specimen failure
site. Figure 5.19 shows, just like the dogbone specimen in Figure 5.3, ”fiber-pullout-like”
behavior with definite fiber breakage, and a tortuous fracture surface can be seen indicating
satisfactory crack deflection mechanisms are present.
0
5
10
15
20
25
30
35
0.0 0.1 0.2 0.3 0.4 0.5
Shea
r Str
ess
(MPa
)
Strain (%)
Nextel™ 720/AS Involute Oxide-Oxide CMC Tube
Specimen #12-063
γxy (Left Rosette)
γxy (Center Rosette)
γxy (Right Rosette)
Figure 5.19: Shear stress vs. shear strain for NextelTM 720/AS oxide-oxide involute tube
specimen 12-063 in pure torsion
87

Figure 5.20: Qualitative crack distance to left, center, and right rosettes (from left to right)
explaining differences in measured shear strains in NextelTM 720/AS oxide-oxide involute
tube specimen 12-063 in pure torsion
The Aramis DIC data can be presented in an infinite number of ways dependent on
items under study. Ultimately, DIC measures localized displacements or strains of the
article under test. The primary objective of this research was detection of crack initiation
and crack propagation within the involute tube to understand failure mechanisms beyond
UTS, USS, and failure strains.
88

Figure 5.21 shows the crack initiation and crack propagation of specimen 12-063. Of
significant interest is the location of this damage initiation site. Figure 5.22 shows where the
specimen damage propagated through the involute tube wall thickness. While the top two
images in Figure 5.21 show the failure location site near the bottom grip, Figure 5.22 shows
the separation of the two parts, closer to the top grip. Upon inspection of the specimen, it
appeared that the damage initiated near the bottom grip and propagated up through the
thickness of the tube before the crack propagated through the thickness of the tube. This
crack and crack propagation direction can be seen in the bottom of Figure 5.21.
Post failure analysis showed the possible path of the damage lengthwise through the
specimen could have been through the delamination between plies of the involute layup.
Figure 5.23 shows the separation of involute plies as a result of pure torsion loading.
This damage along the involute layup exhibits the fiber architecture shown previously in
Figure 3.12. Further ”fiber-pullout-like” behavior and definite fiber breakage along the
failure sites can be seen in Figure 5.24.
With the uniaxial tension test providing an estimate for the UTS and the pure torsion-
to-failure test providing the expected value of USS of the involute tube, estimates of the
failure loads could be made and a proportional load profile in load control could be planned
and executed on the final involute tube specimen.
Following the successful test in pure torsion to failure, a biaxial (tension-torsion)
test to failure was accomplished. The results of the uniaxial dogbone, straightsided, and
DNS specimens in addition to the procedures developed during the single PMC tube test,
alumina pure torsion test, alumina biaxial test, and oxide-oxide CMC involute tube in pure
torsion test all culminated with the final biaxial (tension-torsion) test of an oxide-oxide
CMC involute tube loaded proportionally in tension and torsion.
89

Figure 5.21: Aramis DIC showing crack propagation in NextelTM 720/AS oxide-oxide
involute tube specimen 12-063 in pure torsion
Specimen 12-064 was tested biaxially in tension and torsion to investigate the
influence of small torsional loads on an axially loaded specimen. Based on the desire of
an axial failure mode and the estimates of UTS of 228 MPa and USS of 32.6 MPa, a 50%
reduction of USS was targeted with 100% UTS. Target loading, thus, was τ = 7.15%σ
90

Figure 5.22: NextelTM 720/AS oxide-oxide involute tube specimen 12-063 in pure torsion
Figure 5.23: Involute Ply Failure - NextelTM 720/AS oxide-oxide involute tube specimen
12-063 in pure torsion
where τ = shear stress and σ = axial stress. Actual failure loads equated to τ = 6.89%σ
and the specimen failed torsionally, not axially as intended.
91

Figure 5.24: Closeup of NextelTM 720/AS oxide-oxide involute tube specimen 12-063
fracture damage from pure torsion
The difference in axial versus shear stresses is illustrated in Figure 5.26 where the
axial and shear stresses versus the shear strains are presented together. For uniaxial
results, generally, stress versus strain curves terminate with a drop in load of the specimen
indicating the ultimate load failure of the test specimen. In the case of specimen 12-064, the
oxide-oxide CMC involute tube failed torsionally, but still supported an axial load before
separating into two parts. Figure 5.27 plots shear stress versus shear strain independently
and illustrate this drop in stress in the last data points. A lower yield point is defined when
there is a maximum load point referred to as an upper yield point. Additionally, a lower
value at which continued deformation, in this case specimen separation, must be defined
and present. This later point is referred to as the lower yield point [23, 706-7].
While crack initiation and crack propagation were detectable in specimen 12-063
using DIC with εxy (γxy) processing, loading rates of specimen 12-064 precluded these
events from being detected. In this case, however, displacements were displayed in the X
(specimen length) and Y (specimen circumference) directions. Figure 5.28 and Figure 5.29
show the displacement gradients in the X and Y directions, respectively. Despite the
92

0
50
100
150
200
250
0 50 100 150
Axi
al S
tres
s (M
Pa)
Shear Stress (MPa)
NextelTM 720/AS Biaxial Failure Envelopes
von Mises
Tresca (max shear stress)
Tsai-Hill
Uniaxial Tensile Test (0º)
Uniaxial Tensile Test (90º)
DNS*
SS Shear*
Figure 5.25: Biaxial (tension-torsion) failure envelope with monotonic UTS and USS,
ILSS, and actual value of in-plane shear stress as seen in the pure torsion to failure oxide-
oxide CMC involute tube test
loading rate precluding crack detection, specimen failure sites can still be narrowed down
with the use of section lines to plot strain rates across a cross-section of the area of the
specimen being imaged. Figure 5.30 shows specimen 12-064 after failure.
While crack initiation or propagation was not detected, one of the major reasons for
the use of DIC on CMCs was exhibited. Figure 5.31 shows the strains on individual fiber
tows being detected. The fiber tows unpainted can be seen on the left image while the major
strains just before specimen failure can be seen in the right image. This resolution of strain
or displacement data is unrivaled by any other strain or displacement measuring system
available today. Further processing in Figure 5.32 is shown with the addition of a section
93
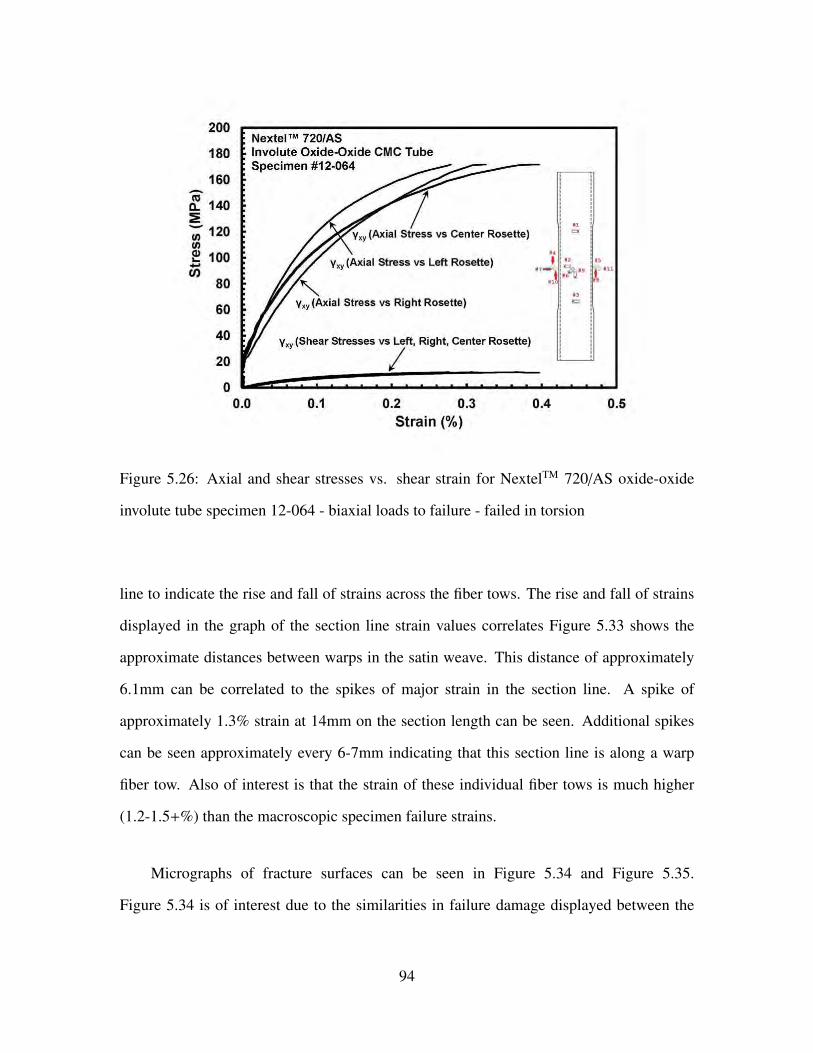
Figure 5.26: Axial and shear stresses vs. shear strain for NextelTM 720/AS oxide-oxide
involute tube specimen 12-064 - biaxial loads to failure - failed in torsion
line to indicate the rise and fall of strains across the fiber tows. The rise and fall of strains
displayed in the graph of the section line strain values correlates Figure 5.33 shows the
approximate distances between warps in the satin weave. This distance of approximately
6.1mm can be correlated to the spikes of major strain in the section line. A spike of
approximately 1.3% strain at 14mm on the section length can be seen. Additional spikes
can be seen approximately every 6-7mm indicating that this section line is along a warp
fiber tow. Also of interest is that the strain of these individual fiber tows is much higher
(1.2-1.5+%) than the macroscopic specimen failure strains.
Micrographs of fracture surfaces can be seen in Figure 5.34 and Figure 5.35.
Figure 5.34 is of interest due to the similarities in failure damage displayed between the
94

0
2
4
6
8
10
12
14
0.0 0.1 0.2 0.3 0.4 0.5
Shea
r Str
ess
(MPa
)
Strain (%)
Nextel™ 720/AS Involute Oxide-Oxide CMC Tube
Specimen #12-064
γxy (Right Rosette)
γxy (Center Rosette)
γxy (Left Rosette)
Figure 5.27: Shear stresses vs. shear strain (expanded) for NextelTM 720/AS oxide-oxide
involute tube specimen 12-064 - biaxial loads to failure - failed in torsion
involute tube and dogbone specimens as seen in Figure 5.3. Again, ”fiber-pullout-like”
behavior with definite fiber breakage, and a tortuous fracture surface can be seen indicating
satisfactory crack deflection mechanisms are present.
The Tsai-Wu, or interactive tensor polynomial theory, is a failure criterion that
accounts for the difference between tensile and compressive strengths in an anisotropic
material, similar to the CMC in this study. Tensile strength lies in the axial or length-
wise direction and compressive strength lies in the circumferential direction during biaxial
(tension-torsion) testing. In the case of the involute tubes, the axial strength was shown to
be much higher than the torsional strength. As such, it was appropriate to see what this
failure criterion would predict. The results of the proportionally loaded biaxial (tension-
torsion) test can be seen in Figure 5.36 along with the Tsai-Wu failure criterion fit curve.
95

Figure 5.28: NextelTM 720/AS oxide-oxide involute tube specimen 12-064 - biaxial loads
to failure - failed in torsion
The Tsai-Wu curve in Figure 5.36 incorporates only one biaxial (tension-torsion) data
point. More data points would be required before deriving more information to the
suitability of the Tsai-Wu failure criteria to the NextelTM 720/AS oxide-oxide CMC. The
Tsai-Hill and Tsai-Wu appear to provide a better failure strength estimation than von Mises
or Tresca.
The Tsai-Wu failure criteria is seen in Equation (5.8).
f1σ1 + f2σ2 + f11σ21 + f22σ
22 + f66τ
26 + 2 f12σ1σ2 = 1 (5.8)
Equation (5.8), for the biaxial (tension-torsion) loading condition, is reduced to
Equation (5.9) where f1 = 1F1t− 1
F1cand f11 = 1
F1tF1cand f66 = 1
F26
96

Figure 5.29: NextelTM 720/AS oxide-oxide involute tube specimen 12-064 - biaxial loads
to failure - failed in torsion
f1σ1 + f11σ21 + f66τ
26 = 1 (5.9)
From the uniaxial tests, F1t was determined to be 222.62 MPa and from the pure
torsion test, F66 was determined to be 132.682 MPa or 9.36x10⁻⁴ 1
MPa . These values along with
σ1 and τ6 of 171.74 MPa and 11.83 MPa, respectively, were placed into Equation (5.9) and
a value for F1c was determined to be -402.535 MPa. Because brittle structures tend to have
higher compressive failure strengths, the value for F1c seemed appropriate. Further, when
plotted, the data fit on the curve in an reasonable manner.
97

Figure 5.30: NextelTM 720/AS oxide-oxide involute tube specimen 12-064 just after failure
- biaxial loads to failure - failed in torsion
Figure 5.31: DIC measured strains of individual fiber tows on NextelTM 720/AS oxide-
oxide involute tube specimen 12-064 - biaxial loads to failure - failed in torsion
98

Figure 5.32: DIC measured strains of individual fiber tows on NextelTM 720/AS oxide-
oxide involute tube specimen 12-064 - biaxial loads to failure - failed in torsion
Figure 5.33: Distance between warps in 8H NextelTM 720 satin weave used in NextelTM
720/AS involute layup
99

Figure 5.34: Damage of NextelTM 720/AS oxide-oxide involute tube specimen 12-064
similar to that of dogbone specimen in Figure 5.3 - biaxial loads to failure - failed in torsion
Figure 5.35: Failure site damage in NextelTM 720/AS oxide-oxide involute tube specimen
12-064 - biaxial loads to failure - failed in torsion
100

0
50
100
150
200
250
0 50 100 150
Axi
al S
tres
s (M
Pa)
Shear Stress (MPa)
NextelTM 720/AS Biaxial Failure Envelopes
von Mises
Tresca (max shear stress)
Tsai-Hill
Tsai-Wu
Pure Torsion Failure
Uniaxial Tensile Test (0º)
Biaxial Failure
Uniaxial Tensile Test (90º)
DNS*
SS Shear*
Figure 5.36: Failure envelope of an oxide-oxide CMC thin-wall involute tube
101

VI. Conclusions and Recommendations
A biaxial (tension-torsion) testing and computational model verification and validation
procedure for oxide-oxide CMC involute tubes at room temperature was developed.
Uniaxial stress-strain responses were found to be useful in determining expected loads and
gripping pressures necessary for biaxial (tension-torsion) loading[28]. Both pure torsion
and combined tension-torsion of an oxide-oxide CMC involute tube at room temperature
was investigated. The oxide-oxide CMC involute tube exhibited USS of 32.68 MPa
in pure torsion and UTS of 171.74 MPa and USS of 11.83 MPa under tension-torsion.
Failure strains of 0.31% and 0.32% in pure torsion and tension-torsion, respectively, were
observed.
Computational model verification and validation data was obtained through the use of
DIC. This method of displacement and strain measurements offered the fidelity required
heterogeneous CMC materials. Crack initiation and crack propagation was detected in
addition to providing displacement and strain information down to the fiber tow level. The
spatial resolution of DIC systems is higher when implemented with a speckle pattern of
appropriate size.
As temperature increased, very little change in UTS or failure strain was seen. Relief
in residual stresses at elevated temperatures in combination with test specimen scatter could
explain test results[45].
The biaxial (tension-torsion) procedures developed can be used to generate a more
statistically significant series of test results for UTS and USS with incorporation of
Weibull analysis[22]. Additionally, composite microstructure and likely damage and failure
mechanisms can be studied.
Recommendations include biaxial (tension-torsion) loadframe tuning utilizing a brittle
material due to observed load outputs and careful consideration of DIC image acquisition.
102

Loadframe tuning can be accomplished with additional time and specimen quantities. Both
of these resources were scarce in the testing documented in this manuscript, but future
endeavors should consider this a priority before testing.
To gain more DIC resolution, starting DIC data acquisition once a desired load of 20-
50% of expected failure loads have been achieved, could be implemented with the same
DIC system and no additional costs. Along with careful speckling procedures, this brief
delay in image capture would allow for loading rates to remain at lower rates, like 1-2
MPa/second, and not require the acquisition of a large number of unneeded DIC stage
points. Had this been implemented in the biaxial (tension-torsion) test on specimen 12-
064, it is reasonable to assume that higher fidelity would have been achieved in the Aramis
DIC results.
103
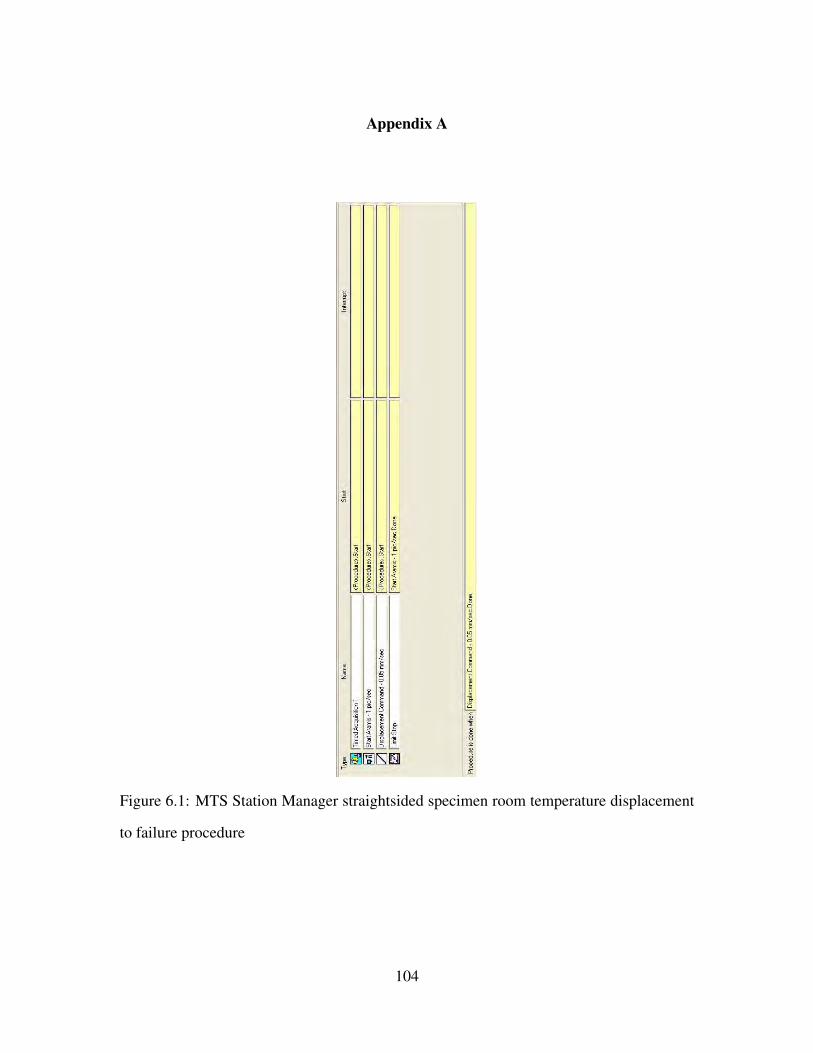
Appendix A
Figure 6.1: MTS Station Manager straightsided specimen room temperature displacement
to failure procedure
104

Figure6.2:N
extel TM
720/A
SD
NS
ILSS
monotonic
compression
tofailure
testprocedures
105
Type Narre Start Interrupt
~ joata Acquisition j <Pro~dure>.Start I I • •J [Z Jspecimen Zero Force Command ] <Procedure>.Start - I 8 jspecimen Zero Force Hold J Specimen Zero Force Command. Done Right Furnace to 1 063~C.Done j Left Furnace to 1 09~~C.Done
[I] jRight Furnace to 700~C j Specimen Zero Force Command. Done ·1 [I] !Left Furnace to 7002C j Specimen Zero Force Command. Done ' ,Ill- : I. [I] JRight Furnace to 1 0632C 1 Right Furnace to 7002C.Done ']I• - J
Left Furnace to 7002C.Done
[I] JLeft Furnace to 1 0922C Right Furnace to 700~C.Done j Left Furnace to 700iC.Done
I:ZJ JLoad to Failure Right Furnace to 1 0632C.Done Lcompression Failure )eteclor.Done J Left Furnace to 1 0922C.Done
~ Jcompression Failure Detector j <Procedure>.Start I [I] JLeft Oven Olf I Co~ession Failure Detector. Done - . ! t ,.. ·I [I] JRrght Oven Off I Compressron Farlure Detector.Done __.lJ _r~ - J
Lelt Oven Ofi.Done Procedure is done when _Right Oven Dfi.Done .!

Figure6.3:N
extel TM
720/A
SD
NS
interlaminarshearcreep
testprocedures
106
Type Name Start Interrupt
~ TempRamp I <Procedure>_Start I["R_oven to 1 264~C.Done ' ) [I] IR_ovento1264~C I <Procedure>.Start - J [I] IL_oven to 1239~C I <Procedure>.Start J ~ Load Up f ~oven to 1239~C.Done I[ Ramp to Creep Stress. Done - . J IZJ jRamp to Creep Stress [ L_oven to 1239~C.Done [ Cree~ Failure Detector. Done J ~ I creep Failure Detector [ L_oven to 1239~C.Done 1[ Hold Cree~ Stress.D_one J ~ !Displacement Detector [ L oven to 1239~C.Done - J EJ -~Hold Creep Stress f Ramp to Creep Stress. Done
1 [ Cree~ Failure Detector. Done J
~ Ominto 8 min I Ramp to Creep Stress. Done · J ~ 8minto1 hr [ 0 min to 8 min. Done J ~ 1 hrto2hr [a min to 1 hr. Done ' J ~ 2hr to 5hr [1 hr to 2 hr. Done . J ~ 5hrto 100 hr [2 hr to 5 hr. Done .. J ~ Unload Data [Hold Creep Stress. Done 1[ Hold at Zero Force. Done · J IZJ IRamptoZeroForce [Hold Cre:fl Stress. Done .. - -· J EJ I Hold at Zero Force [Ramp to Zero Force. Done J ~ I Load to Failure Data [Hold at Zero Force. Done 1[ Failure Detector. Done J ~ !Failure Detector [Hold at Zero Force. Done -~ J IZJ ILoad to Failure [Hold at Zero Fmce.Done 1[ Failure Detector. Done I
Procedure is done when Load to Failure. Done

Figure6.4:R
oomtem
peratureuniaxialtestincorporating
DIC
107
Type Name Start Interrupt
~ I start Aramis · 1 pic/sec I <Procedure> ~art - - ~ I__._ J ~ jTimedAcquisition 1 !_<Procedure> .Start . ~_J_- ~ IZI IRamp to 50 MPa I <Procedure> ~tart ~ ~- - j
IZI IUnload from 50 MPa to 0 MPa I Ramp to 50 MPa.Done_ ~ L ~ ---'- ~
IZI IRamp to 100 MPa I Unload from 50 MPa to 0 MPa.Done j j_· j IZI IUnload from 100 MPa to 0 MPa I Ramp to 100 MPa.Done >_J_~
~ ~ IZI IRamp to 150 MPa I Unload from 100 MPa to 0 MPa.Done j j_ j IZI IUnload from 150 MPa to 0 MPa I Ramp to 150 MPa.Done ~~-~ ~ IZI IRamp to 200 MPa I Unload from 150 MPa to 0 MPa.Done JL .. J IZI IUnload from 200 MPa to 0 MPa I Ramp to 200 MPa.Done •t'J_- "!J IZI IRamp to 250 MPa I Unload from 200 MPa to 0 MPa.Done Jl_ j IZI IUnload from 250 MPa to 0 MPa I Ramp to 250 MPa.Done ~~- j IZI IRamp to 300 MPa I Unload from 250 MPa to 0 MPa.Done Jl_ J IZI IUnload from 300 MPa to 0 MPa I Ramp to 300 MPa.Done .., ~ L ~ - j IZI IRamp to 350 MPa I Unload from 3~ MPa to 0 MPa.Done Jl_ J IZI IUnload from 350 MPa to 0 MPa I Ramp to 350 MPa.Done ~ ~-- j IZI IRamp to 400 MPa I Unload from 3~ MPa to 0 MPa.Done ~ I-'- J IZI IUnload from 400 MPa to 0 MPa I Ramp to ~0 MPa.Done • ~ L ~ !_, _ ~_j
~ jLimit Stop I <Procedure> ~tart - -II ~ ~
Procedure is done when I Unload from 400 MPa to 0 '<lPa.Done .. '
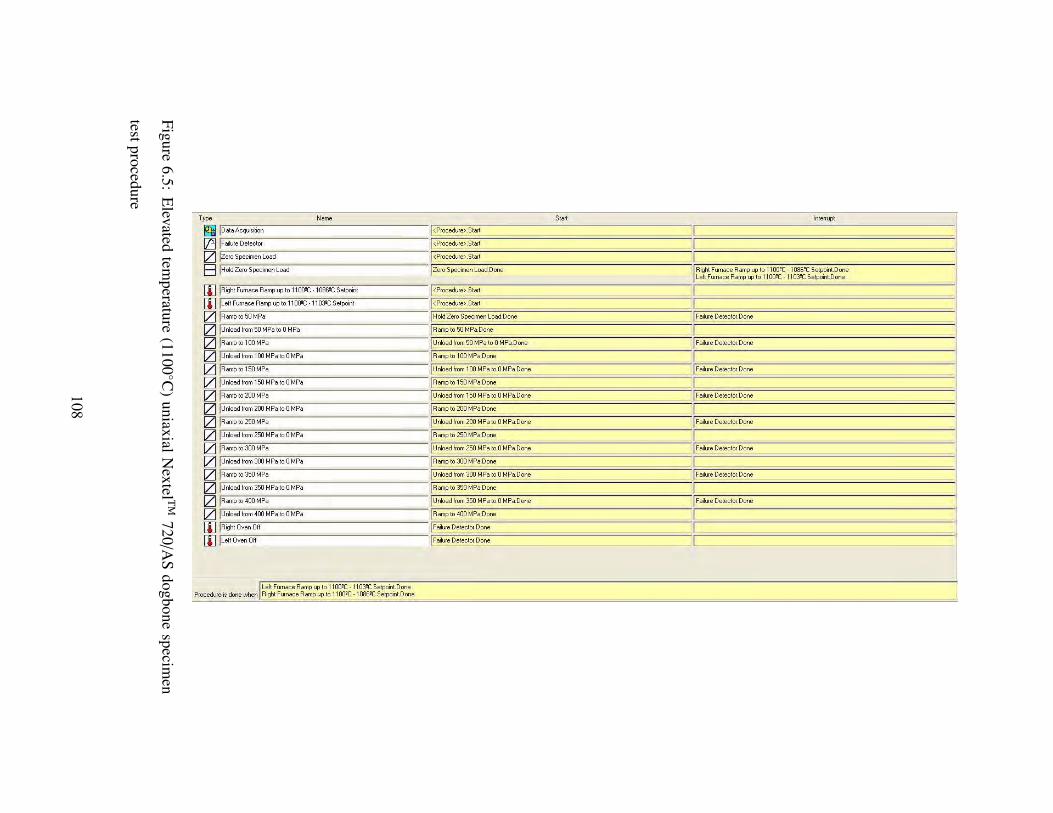
Figure6.5:
Elevated
temperature
(1100C
)uniaxialN
extel TM
720/A
Sdogbone
specimen
testprocedure
108
Type Name Start Interrupt
~ jData Acquisition f <Proce~e>.Start -·' -· ~ jFailure Detector I <~ocedure>.Start - . !Zl Jzero Specimen load I <Procedure>.Start
B I Hold Zero Specimen Load I Zero Specimen load. Done j Right Furnace Ramp up to 11 OO~C · 1 086~C Setpoint.Done left Furnace Ramp up to 11 OO~C ·11 03~C Setpoint.Done --
[I] jRightFurnaceRampupto11QQ9C 1086!:Setpoint I <Procedure>.Start -- . [I] jleft Furnace Ramp up to 11QQ9C -11039C Setpoint I <Procedure>.Start -· IZJ JRamp lo 50 MPa f Hold Zero Specimen load,Done I Failure Detector. Done . lZJ Junload from 50 MPa to 0 MPa I Ramp to 50 MPa.Done
IZJ JRamp lo 100 MPa f Unload from 50 MPa to 0 MPa.Done I Failure Detector. Done
IZJ JUnload from 100 MPa to 0 MPa I Ramp to 100 MPa.Done -IZJ JRamp lo 150 MPa I Unload from 100 MPi! to 0 MPa.Done I Failure Detector. Done
IZJ JUnload from 150 MPa to 0 MPa I Ramp to 150 MPa.Done
IZJ JRamp lo 200 MPa I Unload from 150 MPa to 0 MPa.Done [Failure Detector. Done . IZ] Junload from 200 MPa to 0 MPa I Ramp to 200 MPa . .Oone --- ----IZJ JRamp lo 250 MPa [Unload from 200 MPa to 0 MPa.Done - - I Failure Detector. Done . [ZJ Junload from 250 MPa to 0 MPa I Ramp to 250 MPa.Done . ~· IZJ JRamp lo 300 MPa I Unload from 250 MPa to 0 MPa,Done I Failure Detector. Done . IZJ Junload from 300 MPa to 0 MPa f Ramp to 300 MPa.Done
IZJ JRamp lo 350 MPa I Unload from 300 MPi! to 0 MPa,Done I Failure Detector. Done . -IZJ JUnload from 350 MPa to 0 MPa I Ramp to 350 MPa.Done . IZJ JRamp lo 400 MPa I Unload from 350 MPa to 0 MPa.Done I Failure Detector. Done ~
IZJ junload from 400 MPa to 0 MPa f Ramp to 400 MPa . .Oone - - --- -[I] jRight Oven Off f Failure Detector. Done - ------ . [I] jleft Oven Off f Failure Detector. Done J_
left Furnace Ramp up to 11 oo~c - 11 03~C Setpoint.Done Procedure is done when Right Furnace Ramp up to 11009C -1 086~C Setpoint.Done -- · ·-·-- ----·--·· --·--- ---· ------

Figure6.6:
Elevated
temperature
(1100C
)uniaxial
Nextel T
M720
/AS
straightsided
specimen
testprocedure
109
Type Narre Start Interrupt I ~ jData Acquisition I <Procedure>.Start "_] [Zl !zero Specimen Load J <Procedure>.Start Right Furnace Ramp up to 1 100~C.Done - ~! Lelt Furnace Ramp up to 1 100"C.Done
B jHold Zero Specimen load !_zero Specimen Load. Done - Right Furnace Ramp up to 1 lOO~C.Done - --- .] Left Furnace Ramp up to 1 1009C.Done
[I] JRight Furnace Ramp up to 11 OO!!C I <Procedure>.Start ~ [I] ILeh Furnace Ramp up to 11 OO!!C I <Procedure>.Start 'j : -1 [Zl jDisplacement 0.05 mm/sec l Hold Zero Specimen Load. Done ~ :Ji r- .;I
Procedure is done when DiSplacement 0.05 mm/ sec.Done ----

Figure6.7:
MT
SStation
Manager
oxide-oxideC
MC
involutetube
monotonic
torsionto
failureprocedure
with
Aram
isD
IC1/sec
trigger
110
Type Name Start lntenupt
~ )nmed .Acquisition I ~Procedure>.Start d I . ~ J.P.ramis Trigger Start I <~rocedure>.Start II ~ • lZ] Jr orsion Failure Load •.vith Zero Axial Force Hold I <Procedure>.Start Z:::l Ill Specimen Failure Load Protection.Done. ~ ....._.. : ~ )Specimen Failure Load Protection I Torsion Failure Load with Zero .Axial Force Hold.Done II . [Z] Junload from Failure Load Protection I Specimen Failure Load Protection.)one Jl - -'
Procedure -is done when I Unload from Failure Load Protect!on.Done - -

Figure6.8:M
TS
StationM
anageroxide-oxideC
MC
involutetube
biaxial(tension-torsion)
tofailure
procedurew
ithA
ramis
DIC
1/sec
trigger
111
Type Name Start lntell\.lpt
~ )Timed Acquisition I <.Procedure.>.Start - - - I ~ )Atamis Trigger Start I<Procedure.>.Start I ~ 1100%UTS Axial Load w<h 51~.USS Torsion Torque I <.Procedure.>.Start I -
Procedure is done •shen 110Q%UTS AYi~~d with 50~SS _Torsion To~o:_.Done !

Figure 6.9: DNS specimens before cleaning
Figure 6.10: DNS specimens during first cleaning
112

Figure 6.11: DNS specimens after first cleaning
Figure 6.12: DNS specimens during 25 minute ultrasonic acetone bath
113

Figure 6.13: Side 1 of DNS specimens before 100C 16 hour bakeout
Figure 6.14: Side 2 of DNS specimens before 100C 16 hour bakeout
114

Figure 6.15: DNS specimen bakeout furnace
Figure 6.16: DNS specimens bakeout setup
115

Figure 6.17: Dogbone Specimen 12-109 - 0 involute layup - 1100C in air - NextelTM
720/AS
Figure 6.18: Dogbone Specimen 12-111 - 0 involute layup - 1100C in air - NextelTM
720/AS
116
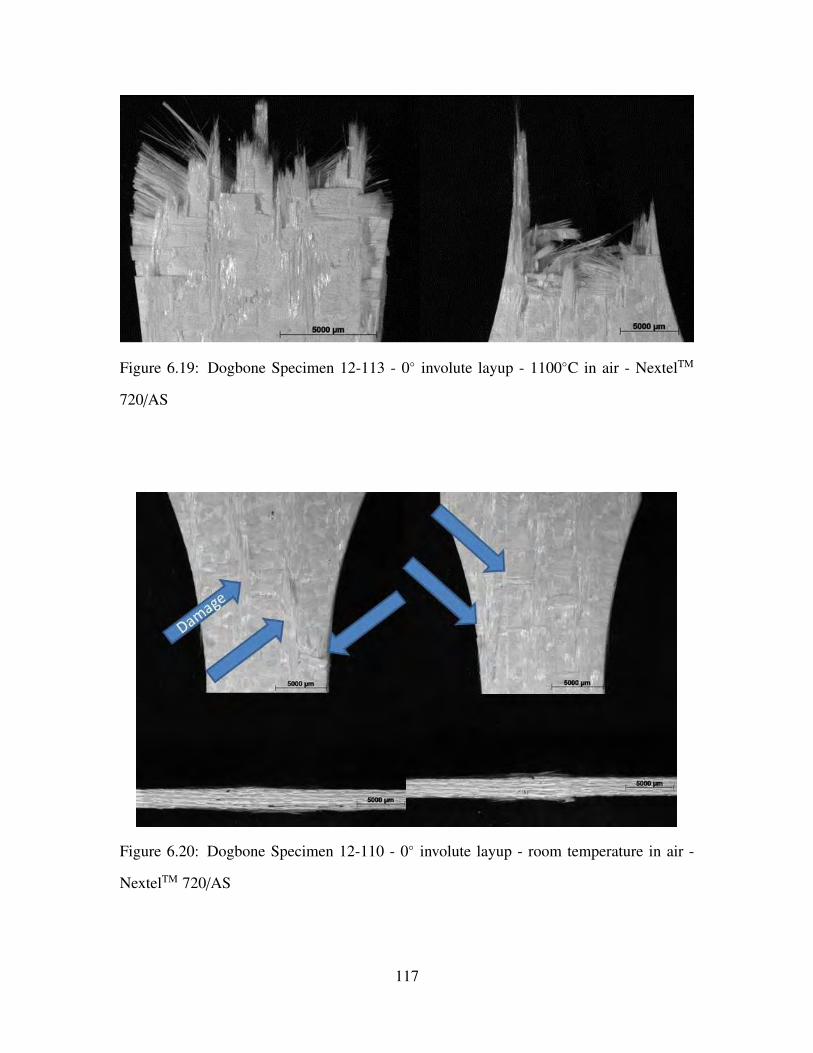
Figure 6.19: Dogbone Specimen 12-113 - 0 involute layup - 1100C in air - NextelTM
720/AS
Figure 6.20: Dogbone Specimen 12-110 - 0 involute layup - room temperature in air -
NextelTM 720/AS
117

Figure 6.21: Dogbone Specimen 12-112 - 0 involute layup - DIC test at room temperature
in air - NextelTM 720/AS
Figure 6.22: Straightsided Specimen 12-098 - 90 involute layup - DIC test at room
temperature in air - NextelTM 720/AS
118

Figure 6.23: Straightsided Specimen 12-106 - 90 involute layup - room temperature in air
- NextelTM 720/AS
Figure 6.24: Straightsided Specimen 12-099 - 90 involute layup - 1100C in air - NextelTM
720/AS
119

Figure 6.25: Straightsided Specimen 12-100 - 90 involute layup - 1100C in air - NextelTM
720/AS
Figure 6.26: DNS Specimen 2 - ILSS test at 1100C in air - NextelTM 720/AS
120

Figure 6.27: DNS Specimen 3 - ILSS test at 1100C in air - NextelTM 720/AS
Figure 6.28: DNS Specimen 4 - interlaminar creep at 1100C in air - 6 MPa - NextelTM
720/AS - failed
121

Figure 6.29: DNS Specimen 6 - interlaminar creep at 1100C in air - 5 MPa - NextelTM
720/AS
Figure 6.30: DNS Specimen 7 - interlaminar creep at 1100C in air - 4 MPa - NextelTM
720/AS
122

Figure 6.31: DNS Specimen 8 - interlaminar creep at 1100C in air - 2 MPa - NextelTM
720/AS
Figure 6.32: DNS Specimen 10 - interlaminar creep at 1100C in steam - 6 MPa - NextelTM
720/AS
123

Figure 6.33: DNS Specimen 11 - interlaminar creep at 1100C in steam - 6 MPa - NextelTM
720/AS
Figure 6.34: DNS Specimen 12 - interlaminar creep at 1100C in steam - 6 MPa - NextelTM
720/AS
124

Figure 6.35: DNS Specimen 13 - NextelTM 720/AS - failed prior to testing
125

Bibliography
[1] “2310 Instruction Manual”. 2300 System Strain Gage Conditioning Amplifier.Raleigh, NC: Vishay Measurements Group.
[2] “3M NextelTM Ceramic Fiber Typical Properties”. 3M NextelTM Ceramic TextilesTechnical Notebook. St. Paul, MN: 3M Corporation.
[3] “Average Physical, Mechanical, and Thermal Properties”. COI Ceramics, Inc. SanDiego, CA: COI Ceramics. Printed 8 April 2010.
[4] “Instruction Manual”. Model 1550A Strain Indicator Calibrator. Raleigh, NC: VishayMeasurements Group.
[5] “Series 646 Hydraulic Collet Grips Product Information: Model 646.10 and 646.25”.Manual Part Number 011-558-204 D. Eden Prairie, MN: MTS Systems Corporation.June 2001.
[6] “DMBZ polyimides provide an alternative to PMR-15 for high-temperature applica-tions”. NASA Technical Memorandum, (107111):55 – 55, 1996.
[7] Amijima, S., T. Fujii, and M. Hamaguchi. “Static and fatigue tests of a woven glassfabric composite under biaxial tension-torsion loading”. Composites, 22:281–289,July 1991.
[8] Ashby, M.F. Materials Selection in Mechanical Design. Burlington, MA:Butterworth-Heinemann, 2005.
[9] ASTM Standard C 1425-11, 2011. “Standard Test Method for InterlaminarShear Strength of 1D and 2D Continuous Fiber-Reinforced Advanced Ceramics atElevated Temperatures”. ASTM International, West Conshohocken, PA, 1999, DOI:10.1520/C1425-11, www.astm.org.
[10] ASTM Standard E 2207-08, 2008. “Standard Practice for Strain-Controlled Axial-Torsional Fatigue Testing with Thin-Walled Tubular Specimens”. ASTM Interna-tional, West Conshohocken, PA, 2002, DOI: 10.1520/E2207-08, www.astm.org.
[11] Boakye, E.E., R.S. Hay, P. Mogilevsky, and L.M. Douglas. “Monazite Coatings onFibers: II, Coating without Strength Degradation”. Journal of the American CeramicSociety, 84:2793–2801, December 2001.
[12] Bouchetou, M.L., M. Huger, D. Fargeot, and C. Gault. Effect of the Environmenton CMCs. In A.G. Evans, R. Naslain (eds.) High-Temperature Ceramic-MatrixCompsites I: Design, Durability, and Performance. Westerville, OH: The AmericanCeramic Society, 1995.
126

[13] Chawla, K.K. Ceramic Matrix Composites. Boston: Kluwer Academic, 2nd edition,2003.
[14] Dally, J.W. and W.F. Riley. Experimental Stress Analysis. New York: McGraw-Hill,3rd edition, 1991.
[15] Daniel, I.M. and O. Ishai. Engineering Mechanics of Composite Materials. NewYork: Oxford University Press, 2006.
[16] Dowling, N.E. Mechanical Behavior of Materials: Engineering Methods forDeformation, Fracture, and Fatigue. Upper Saddle River, NJ: Pearson/Prentice Hall,3rd edition, 2007.
[17] Duval, D.J., S. H. Risbud, and J. F. Shackelford. Chapter 2: Mullite. InJ.F. Shackelford, R.H. Doremus (eds.) Ceramic and Glass Materials: Structure,Properties and Processing. New York: Springer, 2008.
[18] Gadow, R. “Ceramic layer composites in advanced automotive engineering andbiomedical applications”. Key Engineering Materials, 333:177–194, 2007.
[19] Gower, M.R.L. and R.M. Shaw. “Towards a Planar Cruciform Specimen for BiaxialCharacterisation of Polymer Matrix Composites”. Applied Mechanics and Materials,24-25:115–120, June 2010.
[20] Green, D.J. An Introduction to the Mechanical Properties of Ceramics. Cambridge:Cambridge UP, 1998.
[21] Holmquist, M.G., T.C. Radsick, O.H. Sudre, and F.F. Lange. “Fabrication and testingof all-oxide CFCC tubes”. Composites, 34:163–170, October 2002.
[22] Kawai, N., T. Kotani, Y.Kakimoto, and E. Sato. “Fracture behavior of siliconnitride ceramics under combined compression-torsion stresses analyzed by multiaxialfracture statistics”. European Ceramic Society, 31:1827–1833, April 2011.
[23] Kingery, W. D., H. K. Bowen, and D. R Uhlmann. Introduction to Ceramics. NewYork: Wiley, 2nd edition, 1976.
[24] Laffey, P.D. The Effects of Environment on the Interlaminar Shear Performanceof an Oxide/Oxide Ceramic Matrix Composite at Elevated Temperature. MSthesis, AFIT/GAE/ENY/07-J11. School of Engineering and Management, Air ForceInstitute of Technology (AU), Wright-Patterson Air Force Base, OH, June 2007.
[25] Levi, C.G., J.Y. Yang, B.J. Dalgleish, F.W. Zok, and A.G. Evans. “Processing andPerformance of an All-Oxide Ceramic Composite”. Journal of the American CeramicSociety, 81:2077–86, August 1998.
127

[26] Liao, Kin, Eric R. George, and Kenneth L. Reifsnider. “Characterization of CeramicMatrix Composite Tubes Under Uniaxial/Biaxial Monotonic and Cyclic Loading”.ASTM, 1280:224–240, 1997.
[27] Mattingly, J.D. Elements of Propulsion: Gas Turbines and Rockets. Reston, VA:American Institute of Aeronautics and Astronautics, 2005.
[28] Nohut, S., A. Usbeck, H. Ozcoban, D. Krause, and G.A. Schneider. “Determinationof the multiaxial failure criteria for alumina ceramics under tension-torsion test”.European Ceramic Society, 30:3339–3349, August 2010.
[29] Pan, Bing, Kemao Qian, Huimin Xie, and Anand Asundi. “Two-dimensional digitalimage correlation for in-plane displacement and strain measurement: a review”.Measurement Science and Technology, 20:1–17, April 2009.
[30] Parlier, M., M.-H. Ritti, and A. Jankowiak. “Potential and Perspectives forOxide/Oxide Composites”. Aerospace Lab Journal, 1–12, November 2011.
[31] Petrovic, J.J. and M.G. Stout. “Fracture of Al2O3 in Combined Tension/Torsion: I,Experiments”. Journal of the American Ceramic Society, 64:656–660, May 1981.
[32] Pope, Matthew T. Creep Behavior in Interlaminar Shear of a CVI SIC/SIC Compositeat Elevated Temperature in Air and in Steam. MS thesis, AFIT/GMS/ENY/12-M02.School of Engineering and Management, Air Force Institute of Technology (AU),Wright-Patterson Air Force Base, OH, March 2012.
[33] Rajan, V.P., M.N. Rossol, and F.W. Zok. “Optimization of Digital Image Correlationfor High-Resolution Strain Mapping of Ceramic Composites”. ExperimentalMechanics, April 2012.
[34] Ray, Indrajit, George C. Parish, Julio F. Davalos, and An Chen. “Effect ofConcrete Substrate Repair Methods for Beams Aged by Accelerated Corrosion andStrengthened with CFRP”. Journal of Aerospace Engineering, 24(2):227–239, 2011.
[35] Ruggles-Wrenn, M. B. and T. Kutsal. “Effects of steam environment on creep be-havior of NextelTM 720/alumina-mullite ceramic composite at elevated temperature”.Composites Part A-Applied Science and Manufacturing, 41(12):1807–1816, Decem-ber 2010.
[36] Ruggles-Wrenn, M. B., A. T. Radzicki, S. S. Baek, and K. A. Keller. “Effect ofloading rate on the monotonic tensile behavior and tensile strength of an oxide-oxideceramic composite at 1200 C”. Materials Science and Engineering: A (StructuralMaterials: Properties, Microstructure and Processing), 492(1-2):88–94, September2008.
[37] Ruggles-Wrenn, M. B. and B. A. Whiting. “Cyclic creep and recovery behaviorof NextelTM 720/alumina ceramic composite at 1200C”. Materials Science and
128

Engineering: A (Structural Materials: Properties, Microstructure and Processing),528(3):1848–1856, January 2011.
[38] Ruggles-Wrenn, M.B. and J.C. Braun. “Effects of steam environment on creep behav-ior of NextelTM 720/alumina ceramic composite at elevated temperature”. MaterialsScience and Engineering: A (Structural Materials: Properties, Microstructure andProcessing), 497:101–10, December 2008.
[39] Ruggles-Wrenn, M.B., J. Delapasse, A.L. Chamberlain, J.E. Lane, and T.S. Cook.“Fatigue behavior of a Hi-NicalonTM/SiC−B4C composite at 1200C in air and insteam”. Materials Science and Engineering: A (Structural Materials: Properties,Microstructure and Processing), 534(0):119 – 128, 2012.
[40] Ruggles-Wrenn, M.B., S. Mall, C.A. Eber, and L.B. Harlan. “Effects of steamenvironment on high-temperature mechanical behavior of NextelTM 720/alumina(N720/A) continuous fiber ceramic composite”. Composites Part A (Applied Scienceand Manufacturing), 37:2029–40, November 2006.
[41] Ruggles-Wrenn, M.B. and M. Ozer. “Creep behavior of NextelTM 720/alumina-mullite ceramic composite with ±45deg fiber orientation at 1200C”. MaterialsScience and Engineering: A (Structural Materials: Properties, Microstructure andProcessing), 527:5326–34, July 2010.
[42] Stout, M.G. and J.J. Petrovic. “Multiaxial Loading Fracture of Al2O3 Tubes: I,Experiments”. Journal of the American Ceramic Society, 67:14–18, January 1984.
[43] Szweda, A., S. Butner, J. Ruffoni, C Bacalsk, J. Lane, J. Morrison, G Merrill, M. vanRoode, A Fahme, N. Miriyala, and D. Leroux. “Development and Evaluation ofHybrid Oxide/Oxide Ceramic Matrix Composite Combustor Liners”. ASME, 67:14–18, January 1984.
[44] Van Roode, M., J. Price, J. Kimmel, N. Miriyala, D. Leroux, A. Fahme, and K. Smith.“Ceramic Matrix Composite Combustor Liners: A Summary of Field Evaluations”.Journal of Engineering of Gas Turbine and Power. 129: 21-30 (January 2007).
[45] Venables, J.D. “High Temperature Structural Materials”. Encyclopedia of LifeSupport Systems. February 2013. www.eolss.net/Sample-Chapters/C05/E6-36-02-03.pdf.
[46] Yeh, Hsien-Yang, Sean V. Nguyen, and Hsien-Liang Yeh. “Failure analyses ofpolymer matrix composite (PMC) honeycomb sandwich joint panels”. Journal ofReinforced Plastics and Composites, 23(9):923 – 939, 2004. ISSN 07316844.
[47] Zawada, L.P. and S.S. Lee. “Evaluation of four CMCs for aerospace turbine enginedivergent flaps and seals”. Ceramic Engineering and Science Proceedings, 16:337–339, 1995.
129

[48] Zok, F.W. and C.G. Levi. “Mechanical Properties of Porous-Matrix CeramicComposites”. Advanced Engineering Materials, 3:15–23, 2001.
130

Vita
Captain Joseph M. DeRienzo is a 2002 graduate of West Florence High School
(Florence, SC) and 2006 graduate of the United States Air Force Academy (Colorado
Springs, CO). After earning his Bachelor of Science degree in General Engineering in May
of 2006 he was commissioned as a 2d LT in the world’s greatest air, space, and cyberspace
force; the United States Air Force. Captain DeRienzo served at Edwards Air Force Base,
CA planning and executing F-16 and T-38 avionics and engine flight test for four years.
It was there he met his future wife and solidified his love of experimentation, especially
flight test. After 10 months at the Compressor Research Facility within the Air Force
Research Lab’s Propulsion Directorate, Wright-Patterson, AFB, OH, he was assigned to
the Air Force Institute of Technology. After graduation Captain DeRienzo will be assigned
to the United States Air Force Space and Missile Command, Los Angeles AFB, CA.
131

REPORT DOCUMENTATION PAGE Form Approved OMB No. 0704–0188
The public reporting burden for this collection of information is estimated to average 1 hour per response, including the time for reviewing instructions, searching existing data sources, gathering and maintaining the data needed, and completing and reviewing the collection of information. Send comments regarding this burden estimate or any other aspect of this collection of information, including suggestions for reducing this burden to Department of Defense, Washington Headquarters Services, Directorate for Information Operations and Reports (0704–0188), 1215 Jefferson Davis Highway, Suite 1204, Arlington, VA 22202–4302. Respondents should be aware that notwithstanding any other provision of law, no person shall be subject to any penalty for failing to comply with a collection of information if it does not display a currently valid OMB control number. PLEASE DO NOT RETURN YOUR FORM TO THE ABOVE ADDRESS.
1. REPORT DATE (DD–MM–YYYY)
21–03–2013
2. REPORT TYPE
Master’s Thesis
3. DATES COVERED (From — To)
May 2010–Mar 2012
4. TITLE AND SUBTITLE
Biaxial (Tension-Torsion) Testing of an Oxide/Oxide Ceramic Matrix Composite
5a. CONTRACT NUMBER
5b. GRANT NUMBER
5c. PROGRAM ELEMENT NUMBER
6. AUTHOR(S)
DeRienzo, Joseph M., Captain, USAF
5d. PROJECT NUMBER
5e. TASK NUMBER
5f. WORK UNIT NUMBER
7. PERFORMING ORGANIZATION NAME(S) AND ADDRESS(ES)
Air Force Institute of Technology Graduate School of Engineering and Management (AFIT/EN) 2950 Hobson Way WPAFB, OH 45433-7765
8. PERFORMING ORGANIZATION REPORT NUMBER
AFIT-ENY-13-M-10
9. SPONSORING / MONITORING AGENCY NAME(S) AND ADDRESS(ES) Air Force Research Laboratory Attn: Larry Zawada 2230 10th Street Wright-Patterson AFB, OH 45433
10. SPONSOR/MONITOR’S ACRONYM(S)
AFRL/RXCC
11. SPONSOR/MONITOR’S REPORT NUMBER(S)
12. DISTRIBUTION / AVAILABILITY STATEMENT
DISTRIBUTION STATEMENT A: APPROVED FOR PUBLIC RELEASE; DISTRIBUTION UNLIMITED
13. SUPPLEMENTARY NOTES
This work is declared a work of the U.S. Government and is not subject to copyright protection in the United States.
14. ABSTRACT
High temperatures and structural loads in advanced aerospace structures often result in complex loading conditions. This study is focused on biaxial (tension-torsion) testing of an oxide-oxide porous matrix ceramic matrix composite (CMC)
(NextelTM 720/AS) thin wall tube with a novel involute layup. Tests included pure torsion and biaxial (tension- torsion) loading. Strain gages were used in addition to digital image correlation (DIC) to measure strains and to detect crack initiation and propagation. Room temperature and 1100C uniaxial tests were performed in a build up approach prior to biaxial (tension-torsion) testing. Double-notch shear (DNS) specimens were tested at 1100C in air to obtain interlaminar shear strength (ILSS).
15. SUBJECT TERMS
Ceramic Matrix Composites, Composite Materials, Ceramic Fibers, Ceramic Materials, Fiber Reinforced Composites,
Alumina, Aluminosilicate, Mullite, Creep, Oxides, NextelTM 720 Fiber, Tube, Biaxial, Involute, Tension-Torsion
16. SECURITY CLASSIFICATION OF: 17. LIMITATION OF ABSTRACT
UU
18. NUMBER OF PAGES
153
19a. NAME OF RESPONSIBLE PERSON
Dr. Marina B. Ruggles-Wrenn (ENY) a. REPORT
U
b. ABSTRACT
U
c. THIS PAGE
U 19b. TELEPHONE NUMBER (include area code)
(937)-255-3069 x 4641 [email protected]
Standard Form 298 (Rev. 8–98) Prescribed by ANSI Std. Z39.18