aim italia conference 2018, milan - ubibanca.com italia conference... · 1. alfio bardolla training...
TRANSCRIPT

AIM Italia Conference 2018, Milan
1 Servizio Studi – Equity Research

AIM Italia Conference 2018, Milan
2 Servizio Studi – Equity Research

AIM Italia Conference 2018, Milan
3 Servizio Studi – Equity Research
On Monday 28 May Borsa Italiana will hold the 2018 AIM Italia Conference
The following companies are attending (in bold the ones under our coverage):
1. Alfio Bardolla Training Group 14. Expert System 27. Mailup Group
2. Alkemy 15. Fervi 28. Masi Agricola
3. Biodue 16. Finlogic 29. Modelleria Brambilla
4. Bomi Italia 17. First Capital 30. Neodecortech
5. CDR Advance Capital 18. Fope 31. Notorious Pictures
6. Clabo 19. GPI 32. Orsero
7. DBA Group 20. Health Italia 33. Pharmanutra
8. Digital Magics 21. H-Farm 34. Safe Bag
9. Digitouch 22. ILLA 35. SIT
10. Dominion Hosting Holding 23. Iniziative Bresciane 36. SMRE
11. Energica Motor Company 24. Italian Wine Brands 37. SPAXS
12. ICF Group 25. KI Group 38. WIIT
13. Equita Group 26. Kolinpharma
On the companies that we cover we are presenting this report intended at helping investors in maximizing their time with the management.
At the same time, we took this occasion to look at the AIM market recent developments in terms of performances, valuation, earning trend and concluded that, while it may move sideways for a while, its fundamentals remain solid.
A look at performances: AIM Italia is the only Italian index down YTD
As we all know, the AIM Italia index is slightly down YTD but still was up more than 20% during 2017 when it benefitted from the PIR effect. What is more interesting though is that, when compared to Italian large caps and STAR companies, the AIM market has been underperforming YTD (by 6.4% vs. FTSE Italy and 2.4% vs. STAR). AIM Italia is up only by 2% since January 2016, massively underperforming the STAR:
FTSE AIM Italia – Performance comparison with Major Italian Indexes
Source: FactSet
The fact that the FTSE MIB includes a relevant number of banks may be a partial explanation. Another partial explanation of the AIM Italia YTD underperformance vs. FTSE Italy could have been the reversal to mean after the 2017’s overperformance but the same does not apply to the comparison with the STAR Index that has outperformed FTSE MIB in 2017 and is broadly aligned YTD.
The explanations of the underperformance are in our view liquidity and valuation, although we are inclined to believe that the former is more relevant, as we will explain in the next two paragraphs.
AIM Italia has been the worst performer also when compared to other European small cap indexes (although the average market cap of the components of those indexes is far higher and, as we will see later, also the liquidity):
FTSE AIM Italia – Performance comparison with Major European Small Cap Indexes
Source: FactSet
Liquidity evolution: improved but still not everyone’s market
Liquidity has massively improved on AIM Italia in 2017 vs. 2016 (five folds the average daily turnover per single stock and almost seven times the total yearly turnover) although it is worth to point out that liquidity has gone down during the first months of 2018 when compared to the year before:
AIM market: avg. Daily Traded Turnover (EURk) AIM market: total Traded Turnover (EURm)
Source: Bloomberg Source: Bloomberg
24
120
86
105
64 61
2016 2017 Jan-18 Feb-18 Mar-18 Apr-18
295
1.984
166 169 116 91
2016 2017 Jan-18 Feb-18 Mar-18 Apr-18
AIM Italia Conference 2018, Milan
4 Servizio Studi – Equity Research
Putting the liquidity picture together with the performance, it seems that the PIR effect is normalizing and, if anything, PIR flows are more inclined to go towards more liquid names (STAR) rather than AIM names. In our view, the change in paradigm has to do with an increased risk aversion from investors, which squares with the increase in volatility experienced on the market.
Volatility, which has been inexistent for the whole of 2015-17, ri-emerged vigorously at the end of January 2018 driven by two factors:
The end of the accommodative monetary policy from central banks: typically markets benefit from high liquidity levels in the form of easy money for M&A/ECM deals but also in terms of easy and cheap financing;
Trade-war driven tension on the geo-political front: the vast majority of the economist are ready to swear that global GDP growth will be lower in a high-barriers environment.
The rapid growth of high-frequency trading is, in our view, another factor that increased volatility: algorithms supply liquidity without taking into account fundamental information and, by the same token, they are forced to withdraw liquidity during period of market stress to avoid being adversely selected.
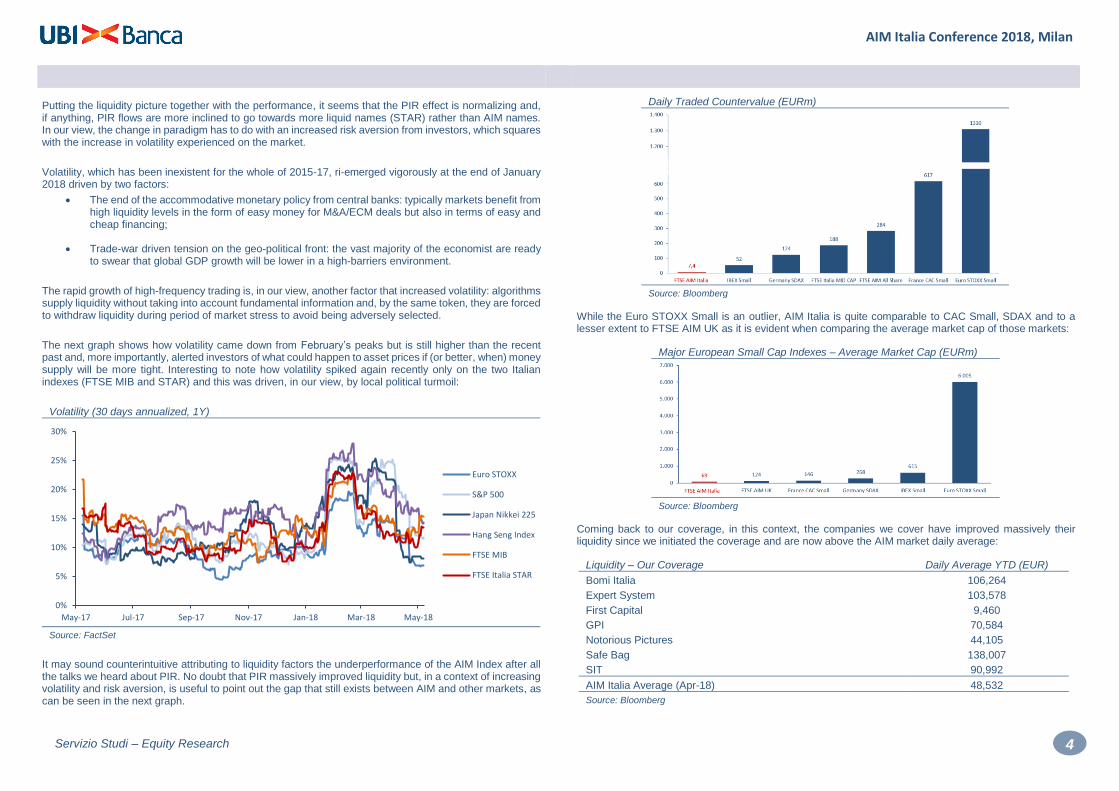
The next graph shows how volatility came down from February’s peaks but is still higher than the recent past and, more importantly, alerted investors of what could happen to asset prices if (or better, when) money supply will be more tight. Interesting to note how volatility spiked again recently only on the two Italian indexes (FTSE MIB and STAR) and this was driven, in our view, by local political turmoil:
Volatility (30 days annualized, 1Y)
Source: FactSet
It may sound counterintuitive attributing to liquidity factors the underperformance of the AIM Index after all the talks we heard about PIR. No doubt that PIR massively improved liquidity but, in a context of increasing volatility and risk aversion, is useful to point out the gap that still exists between AIM and other markets, as can be seen in the next graph.
Daily Traded Countervalue (EURm)
Source: Bloomberg
While the Euro STOXX Small is an outlier, AIM Italia is quite comparable to CAC Small, SDAX and to a lesser extent to FTSE AIM UK as it is evident when comparing the average market cap of those markets:
Major European Small Cap Indexes – Average Market Cap (EURm)
Source: Bloomberg
Coming back to our coverage, in this context, the companies we cover have improved massively their liquidity since we initiated the coverage and are now above the AIM market daily average:
Liquidity – Our Coverage Daily Average YTD (EUR)
Bomi Italia 106,264
Expert System 103,578
First Capital 9,460
GPI 70,584
Notorious Pictures 44,105
Safe Bag 138,007
SIT 90,992
AIM Italia Average (Apr-18) 48,532
Source: Bloomberg
0%
5%
10%
15%
20%
25%
30%
May-17 Jul-17 Sep-17 Nov-17 Jan-18 Mar-18 May-18
Euro STOXX
S&P 500
Japan Nikkei 225
Hang Seng Index
FTSE MIB
FTSE Italia STAR

AIM Italia Conference 2018, Milan
5 Servizio Studi – Equity Research
Valuation: not that expensive after all
In terms of valuation, AIM Italia is clearly more expensive than FTSE Italia and this is justified by the (theoretical) higher growth perspective of smaller companies, which are still in their development phase. However, it is cheaper than the STAR market and this has to do, in our view, with the difference in liquidity levels in a moment of risk aversion:
Major Italian Indexes – 2018 P/E based on current prices
Source: Bloomberg, FactSet
Obviously, in periods of increasing risk aversion, investors may be less willing to own more expensive assets, which are, in this specific case, less liquid too.
When compared to other European small cap indexes (although with average market caps not as low as the AIM Italia, as we showed before) the index seems fairly in line in terms of valuation, above all when considering the smaller size of AIM Italia companies:
Major European Small Cap Indexes – 2018 P/E based on current prices
Source: Bloomberg, FactSet
This is why we said earlier that liquidity, more than valuation, has been the reason for the underperformance vs. other indexes.
Earning trend evolution: +4.5% increase in consensus net income on a 3 months basis
Valuation and multiples have to be dealt together with the evolution of the earnings. When we compare the current estimates on aggregated-net income on the AIM Italia names we discover that consensus estimates on 2018 have been revised up by 4.5% in the past 3 months (source FactSet).
This was confirmed also from the analysis on our coverage (AIM + STAR): out of the 15 names that we cover 7 reported 2H17 figures above our expectations while 5 were below.
Our take: if volatility will moderate, the AIM market will be the first beneficiary. Clarity on the new government would help
Although the valuation gap plays against the AIM Italia index, when we put together earning trend and performances the picture seems to be tilting in favor of a rebound of the index vs. other stock indexes. We believe that increase risk aversion is the main factor that has pushed foreign investor to almost zero their exposure to AIM Italia and local investors to reduce it.
This was amplified by the recent political event where the formation of a government defined from foreign press sometimes as ”populist” and other times as “anti-Euro” reduced the willingness of foreign investors to put again money at work in Italy.
If and when volatility will decline, AIM Italia will be the main beneficiary. The stocks under our coverage have a liquidity that is higher than the market one and this supports our buy case on those names:
Liquidity – Our Coverage Daily Average YTD (EUR)
Bomi Italia 106,264
Expert System 103,578
First Capital 9,460
GPI 70,584
Notorious Pictures 44,105
Safe Bag 138,007
SIT 90,992
AIM Italia Average (Apr-18) 48,532
Source: Bloomberg
Hot themes
As we said, the limited amount of listed companies coupled with limited liquidity concentrated on few names drove the increase in valuation. To invert this process what could be beneficial to the performance of the AIM market is, in our view:
An increase in the average size of listed companies, to be obtained through the IPO flow;
More SPACs entering business combinations (given the average SPAC size target companies would have a size higher than average). This could also help in reducing IPO discounts and, in turn, increasing the IPO numbers;
A reduction in volatility;
Positive earnings trend to continue, regardless of macro conditions (as to show that quality companies, being very small, are uncorrelated to global macro trend);
An improvement in the financial communication attitude of some market participant (as to improve transparency and reduce the perceived risk in the investment).

AIM Italia Conference 2018, Milan
6 Servizio Studi – Equity Research
Other initiatives, to be taken by the regulators, would support liquidity.
Things like the eliminations of the minimum batch (only present today on the AIM market, removed long time ago from the main markets) and some moral suasion on PIR funds to increase the share of their “wallet” on the AIM market would help. M&A: deleveraging and double-voting schemes could support inorganic growth While the above analysis is based on undisturbed fundamentals, M&A could be a catalyst to do not underestimate. In addition, could be particularly positive as it could help to mitigate one of the major critical aspect of AIM companies: size. The forces that could facilitate M&A are three, in our view:
Liquidity is still high on the market, so financing of an acquisition is still easy;
Companies’ leverage is not too stretched (and has been coming down);
Double-voting right scheme began to be operational. This could imply paper coming to market
but also transformational mergers.
Major European Small Cap Indexes – Debt / EBITDA
Source: Bloomberg
AIM has been deleveraging massively as of late and, as can be seen from the graph above, has the lowest leverage of the group of indexes we analyzed (and this, when looking back at valuation, is a factor that plays in favor of the AIM Italia).
As for the double voting right, we present below a list of the AIM companies which approved in their by-laws the scheme through which, after two years from the EGM approval, voting rights (usually of the main shareholder) would double:
AIM Italia – Companies that adopted double voting right
Bomi Italia Fervi
Equita Group Italian Wine Brands
Source: Company data
Obviously, this facilitates mergers, capital raising but also placements on the market thus increasing liquidity (another critical aspect of AIM companies).
0
1
2
3
4
5
2017A 2018E 2019E
France CAC SMALL
IBEX Small
Germany SDAX
FTSE AIM Italia
Euro STOXX Small
FTSE Italia MID CAP
AIM Italia Conference 2018, Milan
7 Servizio Studi – Equity Research
CONTENTS
BOMI ITALIA 8
EXPERT SYSTEM 10
FIRST CAPITAL 12
GPI 14
NOTORIOUS PICTURES 16
SAFE BAG 18
SIT 20

AIM Italia Conference 2018, Milan
8 Servizio Studi – Equity Research
BOMI ITALIA Buy MARKET PRICE: EUR3.23 TARGET PRICE: EUR4.62
Healthcare Services
Data
Shares outstanding (m): 16.89
Market Cap. (EURm): 54.57
Enterprise Value (EURm): 92.41
Av. Daily Trad. Vol. (m): 0.01
Reuters/Bloomberg: BOMI.MI BOMI IM
52-Week Range (EUR): 2.1 3.7
Source: FactSet
Performance
1m 3m 12m
Absolute -6.4% 1.4% 48.4%
Rel. to FTSE IT -2.3% 0.6% 39.8%
Graph Area Absolute/Relative 12 M
Source: FactSet
Graph Shareholders’ Structure
Source: Company data
Hot Topics In our view the key issue for Bomi Italia is to understand future M&A
activity. With the EUR5 million upcoming rights issue and the establishment of “Loyalty Shares” the company will be plenty of tools to finalize new acquisition, including game-changing deals.
Brazil represented 38% of 2017 revenues and the rest of Latam a further 10%. The presence in this region is an opportunity but also a risk considering currency fluctuations and potential inflation and therefore a key issue for future earnings.
The exploitation of cross-selling synergies is a key tool to increase the average profitability of the group. Therefore, understanding the developments in this direction is a hot topic in our view.
Company profile
Bomi Italia is a leading provider of services to the healthcare industry that range from logistics for medical devices, homecare, solutions for managing hospital inventories, creation of virtual branches, kitting and labelling. The company has built a solid reputation over its 30-year life, can boast impressive client loyalty and has grown rapidly over the past few years through several acquisitions. It has expanded outside Italy, particularly in Latam (48% of 2017 revenues) but also in Europe (France, Holland, Spain, Portugal), Turkey, Russia, the US and China. Its wide network, healthy operating leverage and the quality of the services provided, has allowed the company to maintain its EBITDA margin at around 10% in the past few years and to generate a ROCE of 11% last year. The company is also a strong value creator given its high capital turnover (3.4x in 2017).
Investment case
In our view, the investment in the shares is attractive for the following reasons: 1) proactive management with an innovative vision of the medical device outsourcing market, which has prompted the company to enter new businesses, widening its product range and enabling Bomi Italia to gain impressive client loyalty among its large multinational clients, 2) an outstanding M&A track record, with several successful deals finalised in the past three years, 3) the EBITDA margin slowdown in 2016-17, caused by five acquisitions and the start-up phase of some important contracts (Turkey, Mexico, Peru), should reverse when the recent agreements should start to bear fruit, 4) a solid balance sheet with high capital turnover (>3x), 5) potential changing-game acquisition leveraging on the upcoming right issue, 6) significant undervaluation and an average discount to peers close to 40%. In our view, the main risk to the investment case is currency fluctuations, particularly the Brazilian real (BRL) and the Colombian peso (COP).
Recent developments
2017 results exceeded our expectations with solid organic growth (+12%) and an improvement in profitability driven by efficiencies and an improved geographical mix (strong growth in Brazil, Latam, Turkey and China). Lower taxes also helped boost net attributable profit by >300%, while net debt increased to EUR25.5 million due to the acquisition of minorities in Brazil and higher capex. The company also announced a new 2018-20 business plan forecasting CAGR in sales of 6.6% up to 2020 (+4.7% organic growth and +8.9% at fixed exchange rates) with an EBITDA margin that should increase to >11.0% in 2020 from 9.6% in 2017 and a capital increase of EUR5 million for 1.7 million new shares (10% dilution) at a price of EUR3.0 per share. Furthermore, the EGM approved the mandate to increase the share capital and issue convertible bonds for a total maximum amount of EUR12 million within five years and the establishment of “Loyalty Shares”, which imply double voting rights, increasing flexibility to take advantage of new M&A opportunities.
SWOT Analysis
Strengths Weaknesses
Leading position in a market with high barriers to entry
Wide geographic diversification and impressive client loyalty
Outstanding M&A track record with successful integration
Wide number of legal entities, currently under reorganization
High customer concentration, mitigated by the length of relationship
>EUR15 million of goodwill that could be written down
Opportunities Threats
Further expansion outside Italy, in particular in the US
Development of innovative services such as virtual branch, home care
Cross-selling opportunities within Bomi Italia’s network
Currency fluctuations, in particular BRL and COP
Geopolitical risk in emerging countries (Latin America, Turkey)
Potential entry of large international players
Incab & Co; 49,6%
Quaestio Capital; 7,2%
First Capital; 5,8%
Free float; 37,4%

AIM Italia Conference 2018, Milan
9 Servizio Studi – Equity Research
BOMI ITALIA
Income Statement Financial Ratios
(EURm) 2017 2018E 2019E 2020E (%) 2017 2018E 2019E 2020E
Net Revenues 117.89 132.95 141.24 148.76 ROE 29.0% 33.3% 35.0% 32.8%
EBITDA 11.29 13.47 15.90 17.28 ROI 15.1% 18.5% 25.0% 31.8%
EBITDA margin 9.6% 10.1% 11.3% 11.6% Net Fin. Debt/Equity (x) 2.9 2.3 1.2 0.5
EBIT 5.55 6.97 9.27 10.58 Net Fin. Debt/EBITDA (x) 2.3 1.9 1.2 0.5
EBIT margin 4.7% 5.2% 6.6% 7.1% Interest Coverage 3.5 3.8 5.0 8.0
Net financial income /expense -1.57 -1.84 -1.85 -1.32 NWC/Sales -0.3% 0.3% -0.6% -1.0%
Profit before taxes 3.98 5.13 7.43 9.27 Capex/Sales -6.1% -4.0% -1.6% -1.6%
Taxes -1.22 -1.67 -2.45 -2.97 Pay Out Ratio 0.0% 27.4% 26.1% 26.5%
Minorities & discontinuing ops -0.68 -0.38 -0.45 -0.57
Net Income 2.08 3.08 4.53 5.73 Per Share Data
(EUR) 2017 2018E 2019E 2020E
Balance Sheet EPS 0.14 0.18 0.27 0.34
(EURm) 2017 2018E 2019E 2020E DPS 0.00 0.05 0.07 0.09
Net working capital -0.37 0.37 -0.80 -1.44 Op. CFPS 0.67 0.55 0.76 0.81
Net Fixed assets 36.79 38.41 36.21 32.52 Free CFPS 0.20 0.05 0.48 0.62
M/L term funds -2.05 -2.06 -2.11 -2.22 BVPS 0.47 0.55 0.77 1.04
Capital employed 34.37 36.73 33.30 28.85
Shareholders' equity 7.18 9.27 12.95 17.50 Stock Market Ratios
Minorities 1.64 1.83 2.05 2.34 (x) 2017 2018E 2019E 2020E
Shareholders' funds 8.82 11.10 15.00 19.84 P/E 17.8 17.7 12.0 9.5
Net financial debt/(cash) 25.55 25.63 18.29 9.02 P/OpCFPS 3.6 5.9 4.3 4.0
P/BV 5.1 5.9 4.2 3.1
Cash Flow Statement Dividend Yield (%) 0.0% 1.5% 2.2% 2.8%
(EURm) 2017 2018E 2019E 2020E Free Cash Flow Yield (%) 8.2% 1.7% 15.0% 19.2%
Gross Cash Flow 7.28 9.96 11.61 13.00 EV/Sales 0.6 0.7 0.6 0.5
Change In Working Capital 2.97 -0.75 1.18 0.64 EV/EBITDA 6.4 6.9 5.2 4.2
Operating Cash Flow 10.25 9.22 12.78 13.64 EV/EBIT 13.0 13.3 8.9 6.8
Net Capex -7.22 -5.30 -2.20 -2.38 EV/Capital Employed 2.1 2.5 2.5 2.5
Other Investments 0.00 -3.00 -2.40 -0.80
Free Cash Flow 3.02 0.92 8.18 10.46 Growth Rates
Dividends Paid 0.00 0.00 -0.84 -1.18 (%) 2017 2018E 2019E 2020E
Other & Chg in Consolid. Area 0.80 -6.00 0.00 0.00 Growth Group Net Sales 16.9% 12.8% 6.2% 5.3%
Chg in Net Worth & Capital Incr. -13.42 5.00 0.00 0.00 Growth EBITDA 29.1% 19.3% 18.0% 8.7%
Change in NFP -9.60 -0.08 7.34 9.28 Growth EBIT 48.1% 25.5% 33.0% 14.1%
NFP End of Period 25.55 25.63 18.29 9.02 Growth Net Profit 348.7% 48.1% 46.9% 26.6%
Source: Company data, UBI Banca estimates 2017 Stock Market Ratios based on average 2017 price

AIM Italia Conference 2018, Milan
10 Servizio Studi – Equity Research
EXPERT SYSTEM Buy MARKET PRICE: EUR1.30 TARGET PRICE: EUR1.43
IT Services
Data
Shares outstanding (m): 35.7
Market Cap. (EURm): 46.4
Enterprise Value (EURm): 61.4
Av. Daily Trad. Vol. (m): 0.1
Reuters/Bloomberg: EXSY.MI EXSY IM
52-Week Range (EUR): 1.2 2.0
Source: FactSet
Performance
1m 3m 12m
Absolute 6.1% -4.1% -26.8%
Rel. to FTSE IT 10.9% -4.9% -31.0%
Graph Area Absolute/Relative 12 M
Source: FactSet
Graph Shareholders’ Structure
Source: Company data
Hot Topics Expert System’s proprietary platform “Cogito” ranks amongst the top
cognitive computing software worldwide (source: Gartner, Forrester) and the company is the largest European vendor of text analytics and cognitive computing. This position could be jeopardized by large IT developers that have much higher financial resources.
The US are by far the largest market for cognitive computing and Expert System has invested strongly in the country but revenues are still limited (EUR8.2 million in 2017, +11%) and operating losses huge. Therefore, it is crucial to understand the development in the US.
Insurance and banking sectors allowed the sharp revenues growth reported in 2H17 and a significant EBITDA margin increase. The penetration of these customers is a key factor for having a good visibility on Expert System’s P&L.
Company profile
Expert system is a leading provider of cognitive computing and text analytics software based on its proprietary, patented and multilingual platform “Cogito”, which covers 14 languages including Chinese, Japanese and Korean. It operates worldwide with 61% of revenues outside Italy and has 230 employees. Following the difficulties experienced in 2016 and the first part of 2017, the company began to react by reducing costs and improving its internal organization but also by adopting a new and more focused strategic approach: more recurring fees and fewer perpetual licenses and professional services, higher product standardization and economies of scale, concentration on a selected number of large international clients, focus on specific markets (Italy, UK, US, Germany, France, Spain) and sectors (insurance, banking, media, healthcare, financial services, security intelligence, public agencies), and partnerships with large IT vendors in order to supply its services through multinational and established vendors.
Investment case
Our investment case is based on its well-reputed innovative technology that makes Expert System an attractive target for large IT providers. Following two years of uncertainty, the cognitive computing industry has started to grow rapidly and is now seen as a “must have” by a wider range of potential customers (for example insurance and banking companies). Expert System was able to exploit this trend and in 2H17 reported positive results, with significant profitability improvements. Against this backdrop, the share continued to underperform making Expert System an attractive investment and a potential prey for large IT players. In our view, the main risk to the investment case is a technological breakthrough that would make “Cogito” obsolete, strongly impacting the value of the company and causing a write down of existing intangible assets (EUR17 million, or 38% of the current market cap).
Recent developments
2017 revenues increased by 11.9%, 10% above our estimates and the company’s guidance, and the EBITDA reached EUR1.0 million (vs. a loss of EUR2.2 million in 2016) including EUR0.7 million of non-recurring cost to incentivise staff turnover. After EUR7.5 million of D&A costs (of which EUR2.3 million for goodwill amortization), the EBIT was negative for EUR6.5 million (EUR8.5 million in 2016), whilst the EUR1.6 million of unrealized forex losses (EUR0.5 million in the second half of the year) led to a net loss of EUR8.3 million, or 32% of sales. Net invested capital remained broadly stable allowing an improvement of the capital turnover now at 0.85x vs. 0.78x in 2016. Expert System held two rights issues (at EUR1.30 per share) in November and December 2017 for a total of EUR10.6 million, both fully subscribed. The rights issues have been helped by the company’s classification as an innovative small company. Following the two rights issues the share number increased to 35.72 million with a dilution of 22.5%, and free float grew to 70.8% (65.3% before the rights issues).
SWOT Analysis
Strengths Weaknesses
Unique knowledge in cognitive computing
Fast growing addressable market
Wide customer base with leading companies
Cash burning in the past three years
Limited size and financial resources, compared with large IT developers
Huge net invested capital and low capital turnover
Opportunities Threats
Attractive prey for large IT developers
Expansion outside Italy (the US, Germany, Spain)
New clients (insurance, banking)
Technology breakthrough in the cognitive computing industry
Possible write down of existing goodwill and immaterial assets
Potential capital increase to offset cash burning and new investments
Mr. Lombardi; 8,6% Mr. Spaggiari; 8,5%
Mr. Varone; 8,1%
Luxid ; 3,6%
Treasury shares; 0,4%Free float; 70,8%

AIM Italia Conference 2018, Milan
11 Servizio Studi – Equity Research
EXPERT SYSTEM
Income Statement Financial Ratios
(EURm) 2017 2018E 2019E 2020E (%) 2017 2018E 2019E 2020E
Net Revenues 31.7 35.2 40.0 45.1 ROE -43.3% -26.1% -12.1% 0.7%
EBITDA 1.0 4.1 6.6 8.7 ROI -21.4% -11.7% -4.5% 2.0%
EBITDA margin 4.0% 14.1% 19.5% 22.9% Net Fin. Debt/Equity (x) 0.5 0.9 0.9 0.7
EBIT -6.5 -3.6 -1.3 0.5 Net Fin. Debt/EBITDA (x) 8.4 3.2 1.8 1.1
EBIT margin -20.5% -10.3% -3.4% 1.2% Interest Coverage -12.6 -10.3 -2.6 1.1
Net financial income /expense -0.5 -0.3 -0.5 -0.4 NWC/Sales 38.0% 39.2% 33.3% 29.7%
Profit before taxes -8.7 -4.4 -1.8 0.1 Capex/Sales -15.9% -17.9% -14.5% -12.9%
Taxes 0.3 0.4 0.2 -0.0 Pay Out Ratio -0.0% 0.0% 0.0% 0.0%
Minorities & discontinuing ops 0.0 0.0 0.0 0.0
Net Income -8.3 -4.0 -1.6 0.1 Per Share Data
(EUR) 2017 2018E 2019E 2020E
Balance Sheet EPS -0.26 -0.11 -0.05 0.00
(EURm) 2017 2018E 2019E 2020E DPS 0.00 0.00 0.00 0.00
Net working capital 12.0 13.8 13.3 13.4 Op. CFPS -0.10 0.05 0.19 0.23
Net Fixed assets 18.9 17.5 15.4 13.1 Free CFPS -0.18 -0.19 -0.09 -0.02
M/L term funds -2.8 -2.9 -3.0 -3.1 BVPS 0.61 0.43 0.38 0.38
Capital employed 28.1 28.4 25.8 23.4
Shareholders' equity 19.3 15.3 13.6 13.7 Stock Market Ratios
Minorities 0.0 0.0 0.0 0.0 (x) 2017 2018E 2019E 2020E
Shareholders' funds 19.3 15.3 13.6 13.7 P/E nm nm nm nm
Net financial debt/(cash) 8.8 13.1 12.1 9.7 P/OpCFPS -16.1 23.7 6.8 5.7
P/BV 2.8 3.0 3.4 3.4
Cash Flow Statement Dividend Yield (%) 0.0% 0.0% 0.0% 0.0%
(EURm) 2017 2018E 2019E 2020E Free Cash Flow Yield (%) -15.6% nm 2.2% 5.2%
Gross Cash Flow -0.8 3.7 6.3 8.3 EV/Sales 2.0 1.7 1.5 1.3
Change In Working Capital -2.5 -1.8 0.5 -0.1 EV/EBITDA 61.3 15.0 9.1 6.6
Operating Cash Flow -3.3 2.0 6.8 8.2 EV/EBIT nm nm nm nm
Net Capex -5.0 -6.3 -5.8 -5.8 EV/Capital Employed 2.3 2.2 2.3 2.5
Other Investments 0.0 0.0 0.0 0.0
Free Cash Flow -8.4 -4.3 1.0 2.4 Growth Rates
Dividends Paid 0.0 0.0 0.0 0.0 (%) 2017 2018E 2019E 2020E
Other & Chg in Consolid. Area -0.5 0.0 0.0 0.0 Growth Group Net Sales 9.1% 11.2% 13.4% 12.8%
Chg in Net Worth & Capital Incr. 11.2 0.0 0.0 0.0 Growth EBITDA nm 292.2% 61.2% 32.2%
Change in NFP 2.3 -4.3 1.0 2.4 Growth EBIT nm nm nm nm
NFP End of Period 8.8 13.1 12.1 9.7 Growth Net Profit nm nm nm nm
Source: Company data, UBI Banca estimates 2017 Stock Market Ratios based on average 2017 price

AIM Italia Conference 2018, Milan
12 Servizio Studi – Equity Research
FIRST CAPITAL Buy MARKET PRICE: EUR9.80 TARGET PRICE: EUR13.60
Financial Holding
Data
Shares outstanding (m): 2.55
Market Cap. (EURm): 25.0
Enterprise Value (EURm): 38.2
Av. Daily Trad. Vol. (k): <10
Reuters/Bloomberg: FICP.MI FICP IM
52-Week Range (EUR): 9.2 11.1
Source: FactSet
Performance
1m 3m 12m
Absolute -4.9% -6.7% 2.1%
Rel. to FTSE IT -0.6% -7.5% -4.1%
Graph Area Absolute/Relative 12 M
Source: FactSet
Graph Shareholders’ Structure
Source: Company data
Hot Topics The fate of the current portfolio (we believe that Eukedos and Triboo
need more time to generate value while Tecnoinvestimenti, LU-VE and Bomi Italia could be targeted for divestments) is a key point to be addressed with management.
An update on the fund raising of Value First SICAF and the upcoming investments of the funds are critical to understand the success of this initiative and the potential contribution of First Capital’s P&L.
The management thinks that buybacks are preferable to dividends in order to allow the share price to approach the NAVPS level and asked the AGM to acquire treasury shares up to 20% of the total capital (or up to EUR5.3 million at current market price). This strategy could be an interesting discussion topic.
Company profile First Capital is a financial holding company specialized in investing in listed Italian small cap companies and currently owns a portfolio worth around EUR37.9 million (or EUR14.9 NAVPS) split into 5 main investments (all listed companies: Tecnoinvestimenti, Eukedos, Triboo, LU-VE, Bomi Italia). First Capital is a long-term investor, with an active approach, into SMEs both public and private. Last September the company finalized the acquisition of Team Up Work SICAF (renamed Value First SICAF) through which it should launch an FIA (a closed investment compartment reserved for institutional and professional investors) and raise up to EUR100 million to be invested in Italian small caps (about ten companies with revenues of EUR30-150 million). In the long-term, these investments are expected to generate an annual return of 15% in line with its historical average. First Capital committed EUR20 million and is not expected to make any further direct investments but it should earn proceeds from the management of the SICAF.
Investment case Although First Capital’s strategic portfolio performance has not been brilliant in the past few months (+2.0% since the start of the year compared with +7.7% for FTSE All-share index and -2.4% of FTSE small caps), we remain buyers of the stock for the following reasons: 1) the current attractive discount to NAV (29.3%), 2) the quality of its strategic assets, 3) the opportunity offered by Value First SICAF which should provide the means of realizing the company’s 2017-21 business plan, 4) the underperformance of First Capital’s share price compared with its strategic portfolio. The NAV is currently EUR15.1 per share and our target price is EUR13.6 per share (after a holding company discount of 10% to NAV) which implies a potential upside of 27%. If we consider the target prices of the core assets, our NAV would increase to EUR20.0 per share, 87% above the current market price.
Recent developments In 2017 First Capital accelerated its investments turnover exiting from some of its historic investments: Cembre (capital gain of EUR6.0 million with an IRR of 26% and a cash multiple of 3.6x) and Servizi Italia (EUR1.4 million capital gain, 12% IRR and cash multiple of 1.5x). The capital gains realized pushed up the bottom line to EUR5.4 million, the highest historical level, leaving First Capital plenty of liquidity (EUR10.1 million net cash at Dec-17). Since the beginning of the year, First Capital left unchanged its shareholdings, but invested >EUR2 million in several SPACs. In particular, it entered eight new SPACs with an average investment of around EUR0.27 million per SPAC (the largest investment was in Crescita with >EUR0.5 million and the smallest was in VEI 1 with EUR0.15 million). Its 100% controlled Value First SICAF has begun operating and is launching an FIA raising up to EUR100 million to be invested in Italian small caps. Management scrapped the dividend in favor of a buyback program (up to 20% of the share capital).
SWOT Analysis
Strengths Weaknesses
Discount to NAV higher than other European holding companies
Well-balanced portfolio with cyclical and anti-cyclical investments
Outstanding divestment track record
Low visibility on future operations
Positive bottom line only thanks to capital gains
Dividends replaced by a buyback program
Opportunities Threats
Development of Value First SICAF
Fund raising of EUR100 million for FIA managed by Value First
Investments into SPACs (EUR3.5 million up to date)
Challenging fund raising target
Limited control on investments
Negative stock market momentum for small cap companies
Strategy Invest; 27,9%
Next Holding ;
25,0%CHUI; 8,7%
Free float; 38,3%

AIM Italia Conference 2018, Milan
13 Servizio Studi – Equity Research
FIRST CAPITAL
Income Statement Financial Ratios
(EURm) 2017 2018E 2019E 2020E (%) 2017 2018E 2019E 2020E
Dividends 0.65 0.42 0.43 0.44 Debt/Equity -0.27 -0.30 -0.32 -0.34
Other financial income 0.08 0.09 0.09 0.09 Cost/Income 27.6% 48.1% 48.8% 49.5%
Trading profit/(loss) 6.74 2.16 2.16 2.16 ROI 18.4% 4.0% 4.0% 4.1%
Total income 7.47 2.67 2.68 2.70 ROE 14.3% 2.6% 2.6% 2.6%
D&A -0.03 -0.03 -0.03 -0.03
Operating (cost)/income -2.07 -1.28 -1.31 -1.34
Financial charges -0.26 -0.28 -0.28 -0.28
Pre-tax profit 5.12 1.08 1.07 1.05
Taxes 0.30 -0.05 -0.05 -0.05
Net profit 5.42 1.02 1.01 1.00
Balance Sheet Per Share Data
(EURm) 2017 2018E 2019E 2020E (EUR) 2017 2018E 2019E 2020E
Net working capital 0.10 0.10 0.10 0.10 EPS 2.12 0.40 0.40 0.39
Net Fixed assets 0.05 0.04 0.04 0.04 DPS 0.00 0.40 0.45 0.50
M/L term funds 28.26 27.59 26.92 26.26 Op. CFPS 2.01 0.41 0.41 0.41
Capital employed -0.63 -0.67 -0.70 -0.73 BVPS 14.82 15.22 15.22 15.17
Shareholders' equity 27.77 27.07 26.36 25.66
Minorities 37.87 38.89 38.89 38.74
Shareholders' funds 37.87 38.89 38.89 38.74
Net financial debt/(cash) -10.10 -11.82 -12.52 -13.08
Cash Flow Statement Stock Market Ratios
(EURm) 2017 2018E 2019E 2020E (x) 2017 2018E 2019E 2020E
Gross Cash Flow 5.45 1.05 1.04 1.03 P/E 4.1 26.0 27.6 28.1
Change In Working Capital 0.00 0.00 0.00 0.00 P/BV 0.59 0.61 0.64 0.65
Operating Cash Flow 5.15 1.06 1.05 1.04 Dividend Yield (%) 0.0% 4.3% 4.6% 5.1%
Net Capex 4.64 6.67 6.67 6.67
Other Investments 0.00 -6.00 -6.00 -6.00
Free Cash Flow 9.79 1.73 1.72 1.70
Dividends Paid -1.07 0.00 -1.02 -1.14
Other & Chg in Consolid. Area 0.00 0.00 0.00 0.00
Chg in Net Worth & Capital Incr. 0.00 0.00 0.00 0.00
Change in NFP 8.72 1.73 0.70 0.56
NFP End of Period -10.10 -11.82 -12.52 -13.08
Source: Company data, UBI Banca estimates 2017 Stock Market Ratios based on average 2017 price

AIM Italia Conference 2018, Milan
14 Servizio Studi – Equity Research
GPI Buy MARKET PRICE: EUR10.40 TARGET PRICE: EUR14.25
Healthcare Services
Data
Shares outstanding (m): 15.91
Market Cap. (EURm): 165.46
Enterprise Value (EURm): 218.78
Av. Daily Trad. Vol. (m): 0.01
Reuters/Bloomberg: GPI.MI GPI IM
52-Week Range (EUR): 10.0 12.6
Source: FactSet
Performance
1m 3m 12m
Absolute -4.1% -2.3% 2.0%
Rel. to FTSE IT 0.1% -3.2% -4.0%
Graph Area Absolute/Relative 12 M
Source: FactSet
Graph Shareholders’ Structure
Source: Company data
Hot Topics In our view, it is important to understand the reasons behind the lack
of organic growth in the second half of 2017 and the strategic solutions undertaken for surpassing this phase.
After >EUR47 million capex (of which EUR40.5 million of new acquisitions) in 2017 GPI has now lower financial resources to acquire other competitors in order to expand its client base and its technology into new sectors (particularly in logistics and robotics). Understanding M&A strategy and its financing remains a key topic in our view.
GPI has just 7% of sales outside Italy (mostly in Austria), but expanding abroad could be a crucial step to lower the risk linked to the Italian public health sector. We wonder what could be GPI’s strategy in this direction.
Company profile
GPI is a leading provider of services to the healthcare industry that range from innovative IT solutions, logistics and robotics for pharmacies and hospitals, monetics, professional IT services to the outsourcing of contact centers and front-end services. The company, founded in 1988, has grown rapidly over the past few years due to several acquisitions and is now the Italian market leader in BPO (business process outsourcing) and the second most important company in IT for healthcare with an 11.9% market share. Its lean cost structure, healthy operating leverage and the quality of its products, has allowed the company to maintain its EBITDA margin >14% in the past five years. The company is also a strong value creator given its high capital turnover (1.5x in 2017). GPI was listed on the AIM market following the business combination with the SPAC Capital For Progress 1 in December 2016.
Investment case
In our view, GPI has several strengths: 1) proactive management with an innovative vision of the Italian healthcare system, which has prompted the company to enter new businesses, widening its product range and enabling GPI to cover almost the entire value chain of the healthcare industry, reaching a leading position in Italy, 2) GPI is quickly growing through external acquisitions, becoming a consolidator in its sector with an excellent track record for integrating new companies, 3) a solid balance sheet with a high capital turnover, 5) an attractive dividend policy offering around 3% dividend yield, 6) an average discount to peers close to 40%, which could narrow with the transfer of the shares to the MTA or STAR segments already this year. In our view, the main risks to the investment case are further cuts to the public health budget, a technological breakthrough that would make GPI’s IT platform obsolete, possible litigation with clients in the public sector that could result in strong delays in payments from public entities.
Recent developments
In 2017 sales rose 32.1% to EUR180 million with buoyant organic growth (+6%) and a contribution from the new companies acquired (+26%). The EBITDA was EUR25.9 million (+29% vs. 2016) but the margin declined slightly due to the integration process. Higher D&A costs reduced the operating margin to 8.8% (from 10.9%) but lower taxes lifted the net result by 27%. Net fixed assets and NWC nearly doubled compared to 2016, mainly due to the consolidation of the companies acquired in the last part of the year (full consolidation of the balance sheet but only a few weeks in the P&L) and the trade receivable increase associated with the higher turnover. In 2018 the impact of the companies acquired in the past twelve months will clearly be significant. Therefore, we believe revenues could grow by >10% even assuming no organic growth. 2018 should also be a further transition year dedicated to the integration of the new companies acquired and the EBITDA margin is therefore expected to remain broadly stable.
SWOT Analysis
Strengths Weaknesses
Leading position in a market with high barriers to entry
Wide and innovative product range
Excellent M&A track record (8 companies acquired in 2017)
High exposure to the Italian market (93% of sales)
Modest growth in the healthcare IT market (around 3% p.a.)
Shortage of adequate public funds to upgrade public healthcare system
Opportunities Threats
Cross-selling opportunities
Expansion outside Italy
Moving to MTA or Star segment already in 2018
Management under pressure following the recent M&A deals
Reduction of IT spend in public health
Increasing competition of large international entities
FM ; 63,4%
Treasury shares; 0,3%
Free float; 36,6%

AIM Italia Conference 2018, Milan
15 Servizio Studi – Equity Research
GPI
Income Statement Financial Ratios
(EURm) 2017 2018E 2019E 2020E (%) 2017 2018E 2019E 2020E
Net Revenues 179.88 200.51 209.32 217.06 ROE 12.6% 14.4% 15.9% 16.7%
EBITDA 25.90 28.52 31.23 33.50 ROI 15.1% 13.4% 15.7% 17.5%
EBITDA margin 14.4% 14.2% 14.9% 15.4% Net Fin. Debt/Equity (x) 0.8 0.6 0.5 0.3
EBIT 15.86 17.26 19.74 21.76 Net Fin. Debt/EBITDA (x) 2.0 1.5 1.2 0.8
EBIT margin 8.8% 8.6% 9.4% 10.0% Interest Coverage 5.7 5.8 7.6 9.8
Net financial income /expense -2.23 -2.35 -1.90 -1.47 NWC/Sales 16.2% 13.9% 13.5% 13.0%
Profit before taxes 13.63 14.92 17.83 20.29 Capex/Sales -26.3% -4.3% -4.3% -4.3%
Taxes -5.48 -5.05 -6.21 -7.19 Pay Out Ratio 59.6% 52.7% 50.3% 49.5%
Minorities & discontinuing ops -0.20 -0.22 -0.23 -0.24
Net Income 7.94 9.66 11.39 12.85 Per Share Data
(EUR) 2017 2018E 2019E 2020E
Balance Sheet EPS 0.50 0.61 0.72 0.81
(EURm) 2017 2018E 2019E 2020E DPS 0.30 0.32 0.36 0.40
Net working capital 29.09 27.93 28.26 28.13 Op. CFPS 0.61 1.37 1.40 1.53
Net Fixed assets 102.04 99.05 96.28 95.59 Free CFPS -2.39 0.83 0.83 0.94
M/L term funds -14.24 -14.66 -15.34 -18.16 BVPS 4.00 4.20 4.50 4.84
Capital employed 116.89 112.32 109.20 105.57
Shareholders' equity 63.20 66.85 71.64 77.03 Stock Market Ratios
Minorities 1.06 1.28 1.50 1.74 (x) 2017 2018E 2019E 2020E
Shareholders' funds 64.27 68.12 73.15 78.77 P/E 21.4 17.1 14.5 12.9
Net financial debt/(cash) 52.62 44.20 36.06 26.80 P/OpCFPS 17.8 7.6 7.4 6.8
P/BV 2.7 2.5 2.3 2.1
Cash Flow Statement Dividend Yield (%) 2.8% 3.1% 3.5% 3.8%
(EURm) 2017 2018E 2019E 2020E Free Cash Flow Yield (%) -22.2% 8.0% 8.0% 9.1%
Gross Cash Flow 17.32 20.60 22.56 24.26 EV/Sales 1.3 1.1 1.0 0.9
Change In Working Capital -7.76 1.16 -0.33 0.13 EV/EBITDA 8.9 7.7 6.8 6.0
Operating Cash Flow 9.56 21.76 22.23 24.39 EV/EBIT 14.6 12.7 10.7 9.3
Net Capex -47.33 -8.60 -9.00 -9.40 EV/Capital Employed 2.0 1.9 1.9 1.9
Other Investments 0.00 0.00 0.00 0.00
Free Cash Flow -37.78 13.16 13.23 14.99 Growth Rates
Dividends Paid -4.60 -4.74 -5.09 -5.73 (%) 2017 2018E 2019E 2020E
Other & Chg in Consolid. Area -0.62 0.00 0.00 0.00 Growth Group Net Sales 32.1% 11.5% 4.4% 3.7%
Chg in Net Worth & Capital Incr. 0.28 0.00 0.00 0.00 Growth EBITDA 28.9% 10.1% 9.5% 7.3%
Change in NFP -42.72 8.43 8.14 9.26 Growth EBIT 7.3% 8.9% 14.3% 10.2%
NFP End of Period 52.62 44.20 36.06 26.80 Growth Net Profit 25.4% 21.5% 18.0% 12.8%
Source: Company data, UBI Banca estimates 2017 Stock Market Ratios based on average 2017 price

AIM Italia Conference 2018, Milan
16 Servizio Studi – Equity Research
NOTORIOUS PICTURES Buy MARKET PRICE: EUR1.42 TARGET PRICE: EUR1.75
Entertainment
Data
Shares outstanding (m): 22.5
Market Cap. (EURm): 31.9
Enterprise Value (EURm): 26.7
Av. Daily Trad. Vol. (m): 0.01
Reuters/Bloomberg: NPI.MI NPI IM
52-Week Range (EUR): 1.1 1.7
Source: FactSet
Performance
1m 3m 12m
Absolute -2.1% 23.5% 22.4%
Rel. to FTSE IT 2.3% 22.5% 15.3%
Graph Area Absolute/Relative 12 M
Source: FactSet
Graph Shareholders’ Structure
Source: Company data
Hot Topics The traditional movie distribution business model is changing due to
the entrance of new content providers, new distribution technologies and a weaker admission trend of the Italian movie industry last year. Therefore, the re-thinking of the business model will be crucial to survive and expand revenues in the coming years.
The so called “Franceschini law” gives attractive incentives (basically tax credits) along the entire value chain of the movie industry, including international producers shooting in Italy. The upcoming new government could modify the state of the art strongly impacting the movie industry.
Notorious Pictures reported a net cash of EUR6.2 million at Dec-17 partially formed thanks to the cash-in stemming from the IPO and was expected to be used for M&A deals, not realized yet. An update on potential acquisitions could contribute to understand the strategy of Notorious Pictures.
Company profile
Notorious Pictures is a leading company in the Italian movie industry: it produces and distributes movies for both cinema and TV, acquires full rights of foreign movies, lasting 15-25 years, distributing them through all available channels (cinema, Pay TV, Free TV, home video, digital and new media), and has a library of almost 600 movies with an excellent box office track record and the control over the entire value chain (thanks to its partnership with UCI Cinemas and The Space and its agent network). Led by Mr. Marchetti, who controls 82% of the company and has more than 20 years of experience in the industry, in 2015 Notorious Pictures entered in the international production and co-production business (low EBITDA margin, but absence of risk and relevant tax credit), and in 2016 started the executive production activity. The company is now looking at TV series production and has already closed contracts with digital media broadcasters, anticipating the evolution of the industry in the near future. Notorious Pictures was listed in the AIM Italia market in June 2014.
Investment case
Notorious Pictures is appealing for several reasons: 1) the company is changing its strategy, enriching and expanding its product range to TV productions (TV series but also other TV formats): this segment should give Notorious Pictures greater sales visibility while lowering the overall risk, 2) development of executive productions could strongly increase revenues in the future while offering attractive tax credits, 3) excellent library and promising line up in the forthcoming months, 4) closing of forward-looking commercial agreements with OTT players like Netflix and Amazon, that are significantly increasing their market shares and number of subscriptions, 5) recent qualification as “PMI Innovativa” and consequent significant incentives to investors, 5) attractive dividend policy offering almost 4% dividend yield, 6) solid financial structure (net cash is currently equal to 20% of market capitalisation), 7) huge discount to peers: >55% on 2018-19 EV/EBITDA, 32% in P/E and 47% on EV/EBIT.
Recent developments
Sales went down to EUR18.1 million in 2017 (-21% vs. 2016), penalized by a challenging environment for the Italian movie industry (box office down 11.6%), by the lack of blockbusters and by the postponement of two movie releases due to the Weinstein scandal. EBITDA margin reached 33.2% (28.7% in 2016) but was down 9% in absolute term, while EBIT dropped by 41%, impacted by higher D&A costs. Net cash reached EUR6.2 million at Dec-17, after capex substantially in line with the previous year. The 2018 box office is impressive so far (EUR8.3 million receipts at May 20), more than 74% of the full 2017 result, mainly due to the success of “Belle & Sebastian, Friends for Life” (EUR2.7 million) and, above all, “Loving Pablo” which reached EUR3.4 million, leading the box office during the weekend following its release date. Notorious Pictures recently announced an agreement with an American producer for the executive production of “Lamborghini” a movie with Antonio Banderas worth EUR10.3 million (56% of 2017 revenues).
SWOT Analysis
Strengths Weaknesses
Positive track record in film distribution and wide library
Long-term experience of the management in the movie industry
Sizable net cash to grab investment opportunities
High volatility of box office revenues
Declining theatrical admissions in Italy (-12% in 2017)
The business is dependent on a small number of key personnel
Opportunities Threats
Entrance in the TV series production business
Long-term agreements with new digital media players
Potential listing on the STAR segment (management objective)
Increasing piracy due to the digitalization process
Sudden and unexpected film postponement (e.g. Weinstein scandal)
Progressive reduction of independent distributors in Italy
Mr. Marchetti;
82,0%
Treasury shares; 1,0%
Free float; 17,0%

AIM Italia Conference 2018, Milan
17 Servizio Studi – Equity Research
NOTORIOUS PICTURES
Income Statement Financial Ratios
(EURm) 2017 2018E 2019E 2020E (%) 2017 2018E 2019E 2020E
Net Revenues 18.1 30.4 32.5 34.1 ROE 7.0% 16.6% 18.7% 16.9%
EBITDA 6.0 10.0 11.3 11.7 ROI 9.0% 22.2% 25.4% 23.5%
EBITDA margin 33.1% 33.0% 34.8% 34.3% Net Fin. Debt/Equity (x) -0.3 -0.2 -0.2 -0.2
EBIT 1.9 4.8 6.2 6.3 Net Fin. Debt/EBITDA (x) -1.0 -0.5 -0.6 -0.6
EBIT margin 10.4% 15.8% 19.2% 18.6% Interest Coverage 24.0 240.5 312.4 317.3
Net financial income /expense -0.1 -0.0 -0.0 -0.0 NWC/Sales 33.8% 29.7% 31.1% 31.3%
Profit before taxes 1.8 4.8 6.2 6.3 Capex/Sales -39.5% -19.0% -20.2% -21.1%
Taxes -0.3 -0.9 -1.1 -1.1 Pay Out Ratio 82.7% 40.1% 35.2% 34.7%
Minorities & discontinuing ops 0.0 0.0 0.0 0.0
Net Income 1.5 3.9 5.1 5.2 Per Share Data
(EUR) 2017 2018E 2019E 2020E
Balance Sheet EPS 0.06 0.17 0.23 0.23
(EURm) 2017 2018E 2019E 2020E DPS 0.05 0.07 0.08 0.08
Net working capital 6.1 9.0 10.1 10.7 Op. CFPS 0.33 0.28 0.41 0.45
Net Fixed assets 13.8 14.3 15.8 17.5 Free CFPS 0.17 0.02 0.11 0.13
M/L term funds -5.2 -5.1 -5.0 -5.0 BVPS 0.93 1.05 1.21 1.36
Capital employed 14.8 18.2 20.8 23.2
Shareholders' equity 21.0 23.7 27.3 30.6 Stock Market Ratios
Minorities 0.0 0.0 0.0 0.0 (x) 2017 2018E 2019E 2020E
Shareholders' funds 21.0 23.7 27.3 30.6 P/E 17.4 8.1 6.3 6.2
Net financial debt/(cash) -6.2 -5.5 -6.4 -7.4 P/OpCFPS 2.4 5.1 3.5 3.2
P/BV 1.2 1.3 1.2 1.0 Cash Flow Statement Dividend Yield (%) 4.7% 4.9% 5.6% 5.6% (EURm) 2017 2018E 2019E 2020E Free Cash Flow Yield (%) 14.0% 1.5% 7.9% 8.6%
Gross Cash Flow 5.6 9.2 10.2 10.6 EV/Sales 1.1 0.9 0.8 0.7
Change In Working Capital 5.2 -2.9 -1.1 -0.6 EV/EBITDA 3.3 2.7 2.3 2.1
Operating Cash Flow 10.8 6.3 9.1 10.0 EV/EBIT 10.4 5.6 4.1 3.9
Net Capex -7.2 -5.8 -6.6 -7.2 EV/Capital Employed 1.3 1.5 1.2 1.1
Other Investments 0.0 0.0 0.0 0.0
Free Cash Flow 3.6 0.5 2.5 2.8 Growth Rates
Dividends Paid -1.2 -1.2 -1.6 -1.8 (%) 2017 2018E 2019E 2020E
Other & Chg in Consolid. Area -0.0 0.0 0.0 0.0 Growth Group Net Sales -21.1% 67.6% 6.9% 5.0%
Chg in Net Worth & Capital Incr. 0.0 0.0 0.0 0.0 Growth EBITDA -8.8% 67.0% 12.6% 3.6%
Change in NFP 2.4 -0.7 0.9 1.0 Growth EBIT -40.3% 154.0% 29.9% 1.6%
NFP End of Period -6.2 -5.5 -6.4 -7.4 Growth Net Profit -47.4% 166.1% 30.0% 1.6%
Source: Company data, UBI Banca estimates 2017 Stock Market Ratios based on average 2017 price

AIM Italia Conference 2018, Milan
18 Servizio Studi – Equity Research
SAFE BAG Buy MARKET PRICE: EUR4.48 TARGET PRICE: EUR6.68
Airport Services
Data
Shares outstanding (m): 15.5
Market Cap. (EURm): 69.4
Enterprise Value (EURm): 71.5
Av. Daily Trad. Vol. (m): 0.01
Reuters/Bloomberg: SB.MI SB IM
52-Week Range (EUR): 3.4 6.7
Source: FactSet
Performance
1m 3m 12m
Absolute -7.2% -11.3% 9.0%
Rel. to FTSE IT -3.1% -12.0% 2.7%
Graph Area Absolute/Relative 12 M
Source: FactSet
Graph Shareholders’ Structure
Source: Company data
Hot Topics SOSTRAVEL.COM has been spun off from Safe Bag and is expected
to be listed in July-18. Details are still pending but crucial considering that the company is still in a start-up phase (it is expected to report operating losses in the next two years and should reach EUR1.7 million sales in 2018 according to the business plan).
The acquisition of PackandFly will strongly increase the size of the group, could generate potential cross selling synergies but also increases its exposure to currency (RUB) and geopolitical risk. The strategy of Safe Bag against this backdrop is a key issue in our view.
Safe Bag won eight new concessions in the past twelve months and is about to finalize the acquisition of PackandFly, Therefore, we expect a lower bidding activity in future, but the strategy of safe Bag has not been defined yet.
Company profile
Safe Bag is a leading service company specialising in luggage wrapping and tracing for airline passengers. It operates in 28 airports with >440 million passengers per annum, in Italy (six airports including Rome), France (seven airports including Paris), Portugal (five airports including Lisbon), Switzerland (Zurich and Geneva), Poland (three airports including Warsaw), Canada (Montreal, Vancouver and Ottawa) and the US (Miami), managing about 100 wrapping machines with around 400 people. The average duration of its concessions is 3.3 years. Safe Bag also controls 100% of SOSTRAVEL.COM which distributes several innovative services (luggage tracking, refund, lost & found concierge, travel info) for airport passengers throughout the world which is expected to be listed in July-18. Safe Bag is 59.4% controlled by its founder, Mr. Rudolph Gentile, and was listed on the AIM market at EUR2.25 per share in September 2013.
Investment case
We see several reasons to invest in Safe Bag: 1) the company has completed a successful turnaround process (started in 2015 with the appointment of a new CEO, who acquired 6.4% stake in Safe Bag) and now presents attractive fundamentals (sales up 14.9% in 2017, 15.6% EBITDA margin, positive bottom line and net cash position), 2) last year Safe Bag won several new large airport concessions thus increasing the visibility on future revenues, 3) in our view, the acquisition of PackandFly represents a turning point for Safe Bag: we estimate that thanks to this acquisition the company will be able to generate in excess of EUR50 million revenues this year with a growth of >65% vs. 2017, 4) the company is upgrading its product range from a basic product (wrapping) to a “premium package” increasing in this way the average receipt and its profitability, 5) despite the positive news flow, the shares have not performed well in the past few months and the current share price does not reflect the fair value of the company in our view.
Recent developments
Following the completion of the due diligence process, Safe Bag signed a preliminary agreement to acquire 51% of the PackandFly Group, a leading wrapping and packaging protection company active in Russia and other countries with concessions in 24 airports. The deal (closing expected on July 12) values PackandFly 5.6x EV/EBITDA 2017, to be partially paid in shares (at the average price in the three months before the closing but within a range of EUR5-7) generating around 5% dilution for existing Safe Bag shareholders. Safe Bag also reported buoyant 1Q18 results (sales +15.9%, EBITDA +14.3%) with a growth rate above those of passengers (Europe +7.7%, the US +5.3% according to IATA) and has won several new concessions in 2017 (Vancouver, Ottawa, Warsaw, Lima, Katowice-Pyrzowice and Rome), well in excess of the two forecasted in the business plan. Moreover, since the beginning of the year, the company renewed the concessions in Genoa (3 years) and Bologna (4 years) and won the concession for Krakow airport in Poland.
SWOT Analysis
Strengths Weaknesses
Leading position in the wrapping sector
Wide geographical diversification
Launch of innovative products with higher value added
No presence in Asia where there is the highest passenger growth
Goodwill (EUR12.5 million at Dec-17) could be written down
Average duration of concessions is now relatively low (3.3 years)
Opportunities Threats
Acquisition of PackandFly
Strong air passengers growth expected in the coming years
Listing of SOSTRAVEL.COM
Currency fluctuations (mainly USD and RUB)
Strong competition for new concessions
Geopolitical risk (e.g. terrorism attacks)
RG Holding;
59,2%
AC Holding Inv.; 9,7%
Marchin Investments; 6,8%
Mr. Notari; 4,8%
Free float; 19,6%

AIM Italia Conference 2018, Milan
19 Servizio Studi – Equity Research
SAFE BAG
Income Statement Financial Ratios
(EURm) 2017 2018E 2019E 2020E (%) 2017 2018E 2019E 2020E
Net Revenues 30.5 50.8 58.3 62.6 ROE 11.3% 15.0% 18.8% 18.7%
EBITDA 4.8 8.0 10.1 11.0 ROI 27.5% 37.9% 41.2% 43.7%
EBITDA margin 15.6% 15.8% 17.3% 17.6% Net Fin. Debt/Equity (x) -0.1 -0.1 -0.2 -0.2
EBIT 3.9 6.9 8.8 9.5 Net Fin. Debt/EBITDA (x) -0.4 -0.2 -0.4 -0.6
EBIT margin 12.8% 13.6% 15.1% 15.2% Interest Coverage 7.2 13.8 18.0 21.2
Net financial income /expense -0.6 -0.5 -0.5 -0.4 NWC/Sales -9.6% -12.0% -11.5% -10.7%
Profit before taxes 3.3 6.4 8.3 9.1 Capex/Sales -5.3% -3.5% -3.5% -3.5%
Taxes -1.0 -2.2 -2.7 -2.9 Pay Out Ratio 63.7% 41.8% 38.5% 38.0%
Minorities & discontinuing ops -0.6 -1.1 -1.2 -1.3
Net Income 1.8 3.1 4.4 4.9 Per Share Data
(EUR) 2017 2018E 2019E 2020E
Balance Sheet EPS 0.12 0.20 0.29 0.32
(EURm) 2017 2018E 2019E 2020E DPS 0.08 0.09 0.11 0.12
Net working capital -2.9 -6.1 -6.7 -6.7 Op. CFPS 0.16 0.55 0.48 0.49
Net Fixed assets 18.1 27.3 28.1 28.8 Free CFPS 0.05 -0.12 0.35 0.35
M/L term funds -0.6 -0.6 -0.7 -0.6 BVPS 1.08 1.36 1.52 1.68
Capital employed 14.5 20.6 20.8 21.6
Shareholders' equity 16.0 21.0 23.5 26.1 Stock Market Ratios
Minorities 0.4 1.0 1.6 2.2 (x) 2017 2018E 2019E 2020E
Shareholders' funds 16.4 22.0 25.1 28.3 P/E 27.5 22.0 15.7 14.2
Net financial debt/(cash) -1.9 -1.4 -4.4 -6.7 P/OpCFPS 21.2 8.1 9.2 9.1
P/BV 3.1 3.3 2.9 2.7
Cash Flow Statement Dividend Yield (%) 2.3% 1.9% 2.5% 2.7%
(EURm) 2017 2018E 2019E 2020E Free Cash Flow Yield (%) 1.5% nm 7.9% 7.8%
Gross Cash Flow 3.2 5.4 6.9 7.7 EV/Sales 1.6 1.4 1.2 1.1
Change In Working Capital -0.9 3.2 0.6 -0.0 EV/EBITDA 10.4 8.9 7.0 6.3
Operating Cash Flow 2.3 8.5 7.5 7.6 EV/EBIT 12.7 10.4 8.0 7.2
Net Capex -1.6 -1.8 -2.0 -2.2 EV/Capital Employed 3.4 3.5 3.4 3.2
Other Investments 0.0 -8.6 0.0 0.0
Free Cash Flow 0.7 -1.8 5.5 5.4 Growth Rates
Dividends Paid -1.0 -1.2 -1.3 -1.7 (%) 2017 2018E 2019E 2020E
Other & Chg in Consolid. Area -0.9 -1.1 -1.2 -1.4 Growth Group Net Sales 14.9% 66.7% 14.6% 7.4%
Chg in Net Worth & Capital Incr. 3.5 3.6 0.0 0.0 Growth EBITDA 3.4% 68.4% 25.4% 9.3%
Change in NFP 2.4 -0.4 2.9 2.3 Growth EBIT 0.2% 76.9% 27.1% 8.6%
NFP End of Period -1.9 -1.4 -4.4 -6.7 Growth Net Profit -25.6% 74.2% 40.7% 10.4%
Source: Company data, UBI Banca estimates 2017 Stock Market Ratios based on average 2017 price

AIM Italia Conference 2018, Milan
20 Servizio Studi – Equity Research
SIT Buy MARKET PRICE: EUR10.95 TARGET PRICE: EUR13.34
Heating, Smart Gas Metering
Data
Shares outstanding (m): 24.01
Market Cap. (EURm): 262.88
Enterprise Value (EURm): 334.17
Av. Daily Trad. Vol. (m): 0.01
Reuters/Bloomberg: SIT.MI SIT IM
52-Week Range (EUR): 10.6 13.4
Source: FactSet
Performance
1m 3m 12m
Absolute 0.9% -5.2% -12.4%
Rel. to FTSE IT 5.4% -6.0% -17.5%
Graph Area Absolute/Relative 12 M
Source: FactSet
Graph Shareholders’ Structure
Source: Company data
Hot Topics Volumes are literally booming (sales in the Heating division were up
10.3% in 2H17, a stunning result for a mature market and the Smart Gas Metering division increased by 36.6% in the second half of the year) but this situation is causing production constraints and therefore extra costs. New production capacity should arrive in the coming months but understanding the state of the art is a key issue for profitability in future.
The Smart Gas Metering division should complete the substitution of Italian gas meters in the residential market at the end of this year and therefore future growth would be driven by the expansion in foreign markets on which we would like to have a higher visibility.
Potential acquisitions of companies with similar product ranges but with a presence in new markets (emerging countries) or with innovative technologies (patented) is a topic to investigate in our view.
Company profile
SIT is a leading producer of components designed for the safety, efficiency and performance of gas equipment with revenues of EUR324 million in 2017 (+12.5%), eight plants (of which four outside Italy), 10 commercial branches abroad, and >2,000 employees. Since 2009, it has also been present in the fast-growing niche segment of Smart Gas Metering. The group, founded and still managed by the De’ Stefani family, has reported average organic growth of about 6.6% since 2012. Because of its lean cost structure, healthy operating leverage and the quality of its products that is recognized by its customers, the company has maintained EBITDA margins close to 13% in the past ten years (13.6% in 2017). Almost 70% of SIT revenues are generated outside the domestic market, particularly in Europe (43% of sales) and in the US (15%) but it also has a solid presence in China (up 37% in 2017), driven by government incentives (so called “from coal to gas”) which should persist through to 2020. SIT was listed on the AIM market following the business combination with the SPAC Industrial Star for Italy 2 in July 2017 and should move to MTA market segment by July 2018.
Investment case
In our view, an investment in the shares is attractive for the following reasons: 1) strong organic growth (6.6% on average since 2012 and an increase of 12.5% in 2017) even in a mature market, made possible by its leading position (50% global market share in valves for the regulation and security of gas appliances), its product innovation and limited exposure to Italy (30% of sales); 2) low volatility of profitability: SIT has had an average EBITDA adj. margin of 14% over the past three years (14.2% in 2017); 3) presence in the Smart Gas Metering Business, a fast growing market (sales up 31% in 2017) that could be developed abroad; 4) strong operating cash flow generation (about EUR20 million p.a.) and a robust balance sheet with operating NWC less than 10% of revenues; 5) significant undervaluation with an average discount to peers of >30%. We believe the main risks to SIT are the large amount of goodwill (42% of capital employed), the attitude of the new President of the US, which could hinder the development of smart gas metering in UK.
Recent developments
Three main factors emerged from 2017 results: 1) a sharp volume growth for both Heating and Smart Gas Metering divisions that pushed up sales by 12.5% with an acceleration towards the end of the year (sales +14% in 2H17) which is continuing in the first part of 2018, 2) pressure on margins stemming from production bottlenecks caused by the fast volume rump up. SIT reacted promptly with additional investments for EUR15 million in order to increase production capacity by 30%, 3) a further reduction of NWC which is now 6.8% of sales (8.1% in 2016). Management anticipates double digit sales growth in 2018 but further pressure on EBITDA due the production bottlenecks which should be solved only in the second part of the year.
SWOT Analysis
Strengths Weaknesses
Market leader in the Heating market (50% market share worldwide)
Limited exposure to Italy (30% of sales)
High and stable profitability despite the economic crisis
Modest growth in the Heating market (around +3% p.a.)
Large component of goodwill (42% of capital employed)
Lengthy time to market for new products due to testing and homologation
Opportunities Threats
Fast growth of smart gas metering business
Upcoming new production capacity
Listing on MTA next July, and eventually on the STAR segment
Regulatory risk
Currency fluctuations (in particular GBP and USD)
Potential custom duties in the US and Brexit
SIT Technologies;
72,0%
Free float; 28,0%

AIM Italia Conference 2018, Milan
21 Servizio Studi – Equity Research
SIT
Income Statement Financial Ratios
(EURm) 2017 2018E 2019E 2020E (%) 2017 2018E 2019E 2020E
Net Revenues 323.46 357.86 370.86 381.31 ROE -22.1% 15.9% 16.1% 15.3%
EBITDA 44.09 49.10 53.11 55.37 ROI 11.8% 14.1% 15.9% 17.6%
EBITDA margin 13.6% 13.7% 14.3% 14.5% Net Fin. Debt/Equity (x) 0.6 0.6 0.4 0.2
EBIT 25.17 28.80 32.41 34.37 Net Fin. Debt/EBITDA (x) 1.5 1.3 0.9 0.5
EBIT margin 7.8% 8.0% 8.7% 9.0% Interest Coverage 0.5 6.7 8.8 9.8
Net financial income /expense -46.87 -4.30 -3.70 -3.50 NWC/Sales 0.7% 0.2% 0.9% 1.3%
Profit before taxes -21.36 24.50 28.71 30.87 Capex/Sales -5.4% -9.4% -4.3% -3.7%
Taxes -1.96 -5.63 -7.18 -8.03 Pay Out Ratio -25.7% 34.4% 33.4% 36.8%
Minorities & discontinuing ops 0.00 0.00 0.00 0.00
Net Income -23.33 18.86 21.53 22.85 Per Share Data
(EUR) 2017 2018E 2019E 2020E
Balance Sheet EPS -0.97 0.79 0.90 0.95
(EURm) 2017 2018E 2019E 2020E DPS 0.25 0.27 0.30 0.35
Net working capital 2.33 0.71 3.26 5.10 Op. CFPS 0.86 1.65 1.60 1.70
Net Fixed assets 198.05 207.04 197.58 185.47 Free CFPS 0.14 0.24 0.94 1.11
M/L term funds -29.52 -23.88 -18.16 -11.87 BVPS 4.41 4.94 5.57 6.22
Capital employed 170.86 183.87 182.68 178.70
Shareholders' equity 105.75 118.62 133.67 149.32 Stock Market Ratios
Minorities 0.00 0.00 0.00 0.00 (x) 2017 2018E 2019E 2020E
Shareholders' funds 105.75 118.62 133.67 149.32 P/E nm 13.9 12.2 11.5
Net financial debt/(cash) 65.10 65.25 49.01 29.38 P/OpCFPS 13.2 6.6 6.8 6.4
P/BV 2.6 2.2 2.0 1.8
Cash Flow Statement Dividend Yield (%) 2.2% 2.5% 2.7% 3.2%
(EURm) 2017 2018E 2019E 2020E Free Cash Flow Yield (%) 1.2% 2.2% 8.6% 10.2%
Gross Cash Flow 8.15 37.98 41.03 42.61 EV/Sales 1.1 0.9 0.9 0.8
Change In Working Capital 12.46 1.62 -2.55 -1.84 EV/EBITDA 7.8 6.8 6.0 5.4
Operating Cash Flow 20.60 39.60 38.47 40.78 EV/EBIT 13.7 11.6 9.8 8.7
Net Capex -17.34 -33.78 -15.82 -14.02 EV/Capital Employed 2.0 1.8 1.7 1.7
Other Investments 0.00 0.00 0.00 0.00
Free Cash Flow 3.27 5.82 22.65 26.76 Growth Rates
Dividends Paid 0.00 -6.00 -6.48 -7.20 (%) 2017 2018E 2019E 2020E
Other & Chg in Consolid. Area 0.00 0.00 0.00 0.00 Growth Group Net Sales 12.5% 10.6% 3.6% 2.8%
Chg in Net Worth & Capital Incr. 56.40 0.00 0.00 0.00 Growth EBITDA 0.8% 11.4% 8.2% 4.3%
Change in NFP 59.67 -0.18 16.17 19.56 Growth EBIT 7.2% 14.4% 12.5% 6.1%
NFP End of Period -65.10 -65.28 -49.11 -29.55 Growth Net Profit nm nm 14.2% 6.1%
Source: Company data, UBI Banca estimates 2017 Stock Market Ratios based on average 2017 price

AIM Italia Conference 2018, Milan
22 Servizio Studi – Equity Research
Disclaimer
Analysts Declaration
This research report (the “Report”) has been prepared by Marco Cristofori, Massimiliano Vecchio and Dario Fasani on behalf of UBI Banca S.p.A. (“UBI Banca”) in the context of the ancillary service provided by UBI Banca named “Investment research and financial analysis or other forms of recommendation relating to transactions in financial instruments” under Paragraph 5), Section B, Annex I of the Directive 2014/65/EU (“MiFID II”). UBI Banca is an Italian bank under art. 4 (1)(27) of MiFID II and it is supervised by the European Central Bank and duly authorised to provide investment services pursuant to Article 1, Paragraph 5, letter a), b), c), c-bis), e) and f) of the Legislative Decree 24 February 1998, n° 58 under the supervision of the Italian Authority for the financial markets (Consob). UBI Banca has its head office at Piazza Vittorio Veneto 8, 24122 Bergamo.
The analysts who prepared the Report certify that:
a. The views expressed on the companies, mentioned herein (the “Companies”) accurately reflect their personal views, but do not represent the views or opinions of UBI Banca, its management or any other company which is part of or affiliated with UBI Banca group (the “UBI Banca Group”). It may be possible that some UBI Banca Group officers may disagree with the views expressed in this Report;
b. They have not received, and will not receive any direct or indirect compensation in exchange for any views expressed in this Report;
c. The analysts do not own any securities and/or any other financial instruments issued by the Companies or any financial instrument which the price depends on, or is linked to any securities and/or any financial instruments issued by the Companies.
d. Neither the analysts nor any member of the analysts’ household serve as officers, directors or advisory board members of the Companies.
e. The remuneration of the analysts is not directly tied to transactions for services for investment firms or other types of transactions it or any legal person, part of the same group performs, or to trading fees it or any legal person that is part of the same group receives.
f. Marco Cristofori and Massimiliano Vecchio are members of AIAF.
General disclosure
This Report is for information purposes only. This Report (i) is not, nor may it be construed, to constitute, an offer for sale or subscription or of a solicitation of any offer to buy or subscribe for any securities issued or to be issued by the Companies, (ii) should not be regarded as a substitute for the exercise of the recipient’s own judgement. In addition, the information included in this Report may not be suitable for all recipients. Therefore the recipient should conduct their own investigations and analysis of the Companies and securities referred to in this document, and make their own investment decisions without undue reliance on its contents. Neither UBI Banca, nor any other company belonging to the UBI Banca Group, nor any of its directors, managers, officers or employees, accepts any direct or indirect liability whatsoever (in negligence or otherwise), and accordingly no direct or indirect liability whatsoever shall be assumed by, or shall be placed on, UBI Banca, or any other company belonging to the UBI Banca Group, or any of its directors, managers, officers or employees, for any loss, damage, cost, expense, lower earnings howsoever arising from any use of this Report or its contents or otherwise arising in connection with this Report.
The information provided and the opinions expressed in this Report are based upon information and data provided to the public by the Companies or news otherwise public, and refers to the date of publication of the Report. The sources (press publications, financial statements, current and periodic releases, as well as meetings and telephone conversations with the Companies’ representatives) are believed to be reliable and in good faith, but no representation or warranty, express or implied, is made by UBI Banca as to their accuracy, completeness or correctness. Past performance is not a guarantee of future results. Any opinions, forecasts or estimates contained herein constitute a judgement as of the date of this Report, and there can be no assurance that the future results of the Companies and/or any future events involving directly or indirectly the Companies will be consistent with any such opinions, forecasts or estimates. Any information herein is subject to change, update or amendment without notice by UBI Banca subsequent to the date of this Report, with no undertaking by UBI Banca to notify the recipient of this Report of such change, update or amendment.
Organizational and administrative arrangements to prevent conflicts of interests
UBI Banca maintains procedures and organizational mechanism (physical and non-physical barriers designed to restrict the flow of information between the unit which performs investment research activity, and other units of UBI Banca) to prevent and professionally manage conflicts of interest in relation to investment research in accordance with art. 23 of Directive 2014/65/EU and under art. 34 (3) and art. 37 of the Regulation 2017/565/EU.
More specifically, UBI Banca has established, implements and maintains an effective conflicts of interests policy aimed at preventing and managing the potential conflicts of interest that could occur during the performance of the investment research services.
Insofar as the above mentioned organizational and administrative arrangements established by UBI Banca to prevent or manage potential conflicts of interests are not sufficient to ensure, with reasonable confidence, that risks of damage to the interests of the client will be prevented, UBI Banca engages to provide a clear disclosure of the specific conflicts of interests arising from the performance of investment research services, including a description of the sources of those conflicts and the steps undertaken to mitigate them, taking into account the nature of the client to whom the disclosure is being made.
For further information please see UBI Banca’s website (www.ubibanca.com/equity-research - “Informativa sintetica sull’attività di ricerca”) and (www.ubibanca.com/Mifid - “Policy sintetica conflitti di interessi”). More details about the conflicts of interests policy will be provided by UBI Banca upon request.
Disclosure of interests and conflicts of interests pursuant to Delegated Regulation 2016/958/EU
In relation to the Companies the following interest/conflict of interest have been found:
UBI Banca acts as Specialist for Bomi Italia.
UBI Banca acts as Corporate Broker for Expert System.
UBI Banca acts as Nomad and Specialist for First Capital.
UBI Banca act as Specialist for GPI.
UBI Banca acts as Corporate Broker for Notorious Pictures.
UBI Banca acts as Specialist for Safe Bag.
UBI Banca acts as Nomad and Specialist for SIT.
UBI Banca may have long or short positions with the issuers.
On the basis of the checks carried out no other interest/conflict of interest arose.

AIM Italia Conference 2018, Milan
23 Servizio Studi – Equity Research
Frequency of updates
UBI Banca aims to provide continuous coverage of the companies in conjunction with the timing of periodical accounting reports and any exceptional event that occurs affecting the issuers’ sphere of operations and in any case at least twice per year. The companies for which UBI Banca acts as Sponsor or Specialist are covered in compliance with regulations of the market authorities.
For further information please refer to www.ubibanca.com/equity-research.
Valuation methodology
UBI Banca’s analysts value the Companies subject to their recommendations using several methods among which the most prevalent are: the Discounted Cash Flow method (DCF), the Economic Value Added method (EVA), the Multiple comparison method, the SOP method and the NAV method.
The analysts use the above valuation methods alternatively and/or jointly at their discretion. The assigned target price may differ from their fair value, as it also takes into account overall market/sector conditions, corporate/market events, and corporate specifics (i.e. holding discounts) reasonably considered to be possible drivers of the companies’ share price performance. These factors may also be assessed using the methodologies indicated above.
For further information please refer to www.ubibanca.com/equity-research.
Ranking system
UBI Banca’s analysts use an “absolute” rating system, not related to market performance. The explanation of the rating system is listed below:
Buy: if the target price is 10% higher than the market price, over the next 12 months.
Hold: if the target price is 10% below or 10% above the market price, over the next 12 months.
Sell: if the target price is 10% lower than the market price, over the next 12 months.
No Rating: the investment rating and target price have been suspended as there is not sufficient fundamental basis for determining an investment rating or target. The previous investment rating and target price, if any, are no longer in effect. Alternatively, No Rating is assigned in certain circumstances when UBI Banca is acting in any advisory capacity in a strategic transaction involving the Companies.
Target price: the market price that the analysts believe that the share may reach within a one-year time horizon.
Market price: closing price on the day before the issue date of the report, appearing on the first page.
Distribution
Italy: This document is intended for distribution in electronic form to “Professional Clients” and “Qualified Counterparties” as defined by Legislative Decree 24 February 1998, n. 58 and by Consob Regulation n. 16190 dated 29.10.2007, as further amended and supplemented.
IN THE UNITED KINGDOM, THIS DOCUMENT IS BEING DISTRIBUTED ONLY TO, AND IS DIRECTED ONLY AT PERSONS WHO (A) ARE (I) PERSONS FALLING WITHIN ARTICLE 19 OR ARTICLE 49 OF THE FINANCIAL SERVICES AND MARKETS ACT 2000 (FINANCIAL PROMOTION) ORDER 2005 (AND ONLY WHERE THE CONDITIONS CONTAINED IN THOSE ARTICLES HAVE BEEN, OR WILL AT THE RELEVANT TIME BE, SATISFIED) OR (II) ANY OTHER PERSONS TO WHOM IT MAY BE LAWFULLY COMMUNICATED; AND (B) ARE QUALIFIED INVESTORS WITHIN THE MEANING OF ARTICLE 2(1)(E) OF THE PROSPECTUS DIRECTIVE (DIRECTIVE 2003/71/EC), (ALL SUCH PERSONS BEING REFERRED TO AS "RELEVANT PERSONS"). THIS DOCUMENT MUST NOT BE ACTED ON OR RELIED ON BY PERSONS WHO ARE NOT RELEVANT PERSONS.
Copyright
This Report is being supplied solely for the recipients’ information and may not be reproduced, redistributed or passed on, directly or indirectly to any other person or published, in whole or in part, for any purpose without prior written consent of UBI Banca.
The copyright and intellectual property rights on the data are owned by UBI Banca Group, unless otherwise indicated. The data, information, opinions and valuations contained in this Report may not be subject to further distribution or reproduction, in any form or via any means, even in part, unless expressly consented by UBI Banca.
By accepting this Report the recipient agrees to be bound by all of the forgoing provisions.
Distribution of ratings
Equity rating dispersion in the past 12 months
Buy Hold Sell No Rating
88.1% 4.8% 0.0% 7.1%
Proportion on issuers to which UBI Banca has supplied investment banking services relating to the last 12 months
Buy Hold Sell No Rating
100% 100% - 100%
For further information regarding yearly and quarterly rating statistics and descriptions, please refer to www.ubibanca.com/equity-research.

AIM Italia Conference 2018, Milan
24 Servizio Studi – Equity Research
SERVIZIO STUDI Nomad – Key Executives Head of Research Department Marco Germano +39.02.7781 4651 Giovanni Barone [email protected] [email protected] Gisella Barisone +39.02.7781 4618 [email protected]
Industry Research Macroeconomic and Financial
Market Research
Equity Research
Carla Mattiussi Francesca Pascali Marco Cristofori [email protected] [email protected] +39.02.6275 3015 [email protected] Corporate Broking - Specialist Enza De Vita Vincenzo Petrignano [email protected] [email protected] Massimo Vecchio Roberta Pupeschi +39.02.6275 3016 +39.02.7781 4682 Anna Cristina Visconti Paolo Manzoni [email protected] [email protected] [email protected] [email protected] Dario Fasani Gisella Barisone Paolo Leoni +39.02.6275 3014 +39.02.7781 4618 [email protected] [email protected] [email protected] Quantitative Analysis Francesco Martinelli [email protected]