aid flows in somalia 1march - s3.eu-central … · i executive summary aid to somalia reached a...
TRANSCRIPT

Analysis of aid flow data
March 2018
Aid Flows in Somalia
Developed with the support of the World Bank and United Nations
Ministry of Planning, Investment and Economic DevelopmentFederal Republic of Somalia
www.somaliaaidflows.so

i
Executive Summary Aid to Somalia reached a record high in 2017. Reported official development assistance (ODA) for Somalia totaled US$ 1.75 billion for 2017. With an ODA to GDP ratio of nearly 26% for 2017, Somalia remains highly dependent on aid.
The increase in ODA was primarily driven by the surge in humanitarian support provided in response to the drought. Humanitarian aid for 2017 exceeded US$ 1 billion, based on donor reporting. This is a 66% increase compared with average humanitarian flows reported over the past three years (US$ 608 million annually). The frontloading of humanitarian support in 2017 likely played a significant role in staving off famine in Somalia.
Development aid continues to rise steadily. Reported development aid to Somalia totaled US$ 742 million, a 9% increase over the 2016 total (US$ 681). Total development aid has not declined since 2009, and the stability seen in recent years (notably since 2014) is unusual for a fragile state.
The share of aid delivered on treasury increased significantly. More than US$ 100 million in external grants (approx. 14% of development aid) was delivered through the treasury of the Federal Government of Somalia in 2017. A majority of on treasury grants (91%, US$ 94 million) were delivered through three channels: projects financed by donors through the World Bank Multi Partner Fund (MPF), general budget support provided by Saudi Arabia and sector budget support provided by Turkey
The use of the funds established under the Somalia Development Reconstruction Facility (SDRF) remains low but steady. A reported 20% of development aid was channeled through the funds in 2017, compared with 22% in 2015.
The report provides figures that break down project disbursements by location and pillar of Somalia’s National Development Plan (NDP). The 2017 aid mapping exercise was led by the Ministry of Planning, Investment and Economic Development (MoPIED), with the support of the World Bank and United Nations.
ii
Table of Contents 1 Introduction ................................................................................... 1 2 Overview of Flows .......................................................................... 2 3 On Treasury Aid ............................................................................. 9 5 Use of Pooled Funds .................................................................... 11 6 Breakdown by Sector .................................................................. 16
Inclusive Politics ........................................................................................ 18 Rule of Law............................................................................................... 20 Effective, Efficient Institutions ..................................................................... 22 Economic Growth ..................................................................................... 24 Infrastructure............................................................................................. 26 Social & Human Development ................................................................... 28 Resilience ................................................................................................. 30 Gender & Human Rights ............................................................................ 32
7 Breakdown by Location ............................................................... 34 Federal Government of Somalia ................................................................. 37 Benadir ..................................................................................................... 40 Galmudug................................................................................................. 43 Hiirshabelle ............................................................................................... 46 Jubaland .................................................................................................. 49 Puntland ................................................................................................... 52 South West ............................................................................................... 55 Somaliland ................................................................................................ 58
8 Cross-cutting Markers .................................................................. 61 Stabilization Marker ................................................................................... 61 Gender Marker .......................................................................................... 63 Capacity Development Marker ................................................................... 65 Durable Solutions Marker........................................................................... 67
Annex A. Acronyms & Abbreviations .................................................... 69 Annex B. Key Terms & Concepts ......................................................... 70

1
1 Introduction For the past four years, aid flows in Somalia have been tracked through an annual mapping exercise. This report presents figures and analysis based on the 2017 exercise, which was led by the Ministry of Planning, Investment and Economic Development (MoPIED) with the support of the World Bank and United Nations. Past exercises were led by the Aid Coordination Unit (ACU) in the Office of the Prime Minister.
The Federal Government of Somalia thanks all 45 participating partners for the high quality of their reporting in 2017 (Table 1). The Ministry of Finance provided data on external grants delivered on treasury. Additional data was collected from OCHA’s Financial Tracking Service.
Table 1. Reporting Status of Partners Participating Partners
Bilaterals Multilaterals 1. Australia 13. AfDB 26. UNESCO 2. Canada 14. European Commission 27. UNFPA 3. Denmark 15. FAO 28. UNHCR 4. Finland 16. IFC 29. UNICEF 5. Germany 17. ILO 30. UNIDO 6. Italy 18. IMF 31. UNMAS 7. Netherlands 19. IOM 32. UNODC 8. Norway 20. UN RCO 33. UNOPS 9. Sweden 21. UN WOMEN 34. UNSOM 10. Switzerland 22. UN-Habitat 35. UNSOS 11. UK 23. UNAIDS 36. WFP 12. USA 24. UNCDF 37. WHO 25. UNDP 38. World Bank Funds 39. AfDB Somali Infrastructure Fund 43. UN Peacebuilding Fund 40. Somalia Stability Fund 44. WB Multi-Partner Fund 41. The Global Fund 45. WB State- and Peace-building Fund 42. UN Multi Partner Trust Fund
Non-Reporting Partners 1. Arab League 2. China 3. France
4. Islamic Development Bank 5. Japan
6. Qatar 7. Saudi Arabia
8. Turkey 9. United Arab Emirates

2
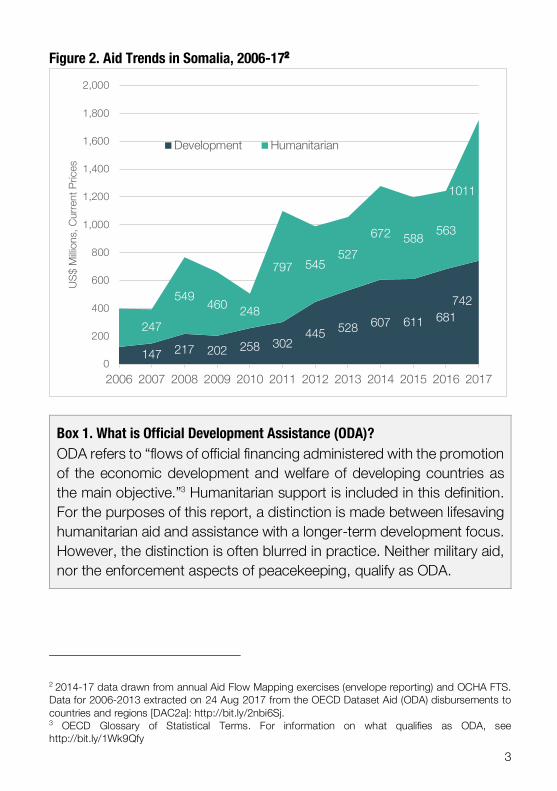
2 Overview of Flows Aid to Somalia reached a record high in 2017. Reported official development assistance (ODA) for Somalia totaled US$ 1.75 billion for 2017 (Table 2). This marks a 41% increase compared with the past three year of aid flows, which averaged US$ 1.24 billion per year. With an ODA to GDP ratio of nearly 26% for 2017, Somalia remains highly dependent on aid as well as remittances relative to other financial flows (Figure 1).
The increase in ODA was primarily driven by the surge in humanitarian support provided in response to the drought. Humanitarian aid for 2017 totaled US$ 1 billion, based on donor reporting. This is a 66% increase compared with average humanitarian flows reported over the past three years (US$ 608 million annually). Together, the United States, United Kingdom and European Commission provided two thirds (US$ 702.2 million, 69%) of all humanitarian aid to Somalia in 2017 (Figure 3).
Figure 1. Financial Flows as % of GDP, 20171
1 Figure uses latest estimates available for each category. Whereas ODA, domestic revenue and the GDP are based on 2017 estimates and figures, the latest estimates for FDI and remittances at the time of report writing were from 2016 and 2015 respectively.
27.0%21.5%
11.6%
2.2%0%
10%
20%
30%
ODA Remittances FDI DomesticRevenue
% o
f GDP
Table 2. Reported ODA, 2016-18, US$ Millions
2016 2017 2018 Total
Development 681 742 326 1749
Humanitarian 563 1011 93 1667
Total ODA 1244 1753 419 3416
3
Figure 2. Aid Trends in Somalia, 2006-172
Box 1. What is Official Development Assistance (ODA)? ODA refers to “flows of official financing administered with the promotion of the economic development and welfare of developing countries as the main objective.”3 Humanitarian support is included in this definition. For the purposes of this report, a distinction is made between lifesaving humanitarian aid and assistance with a longer-term development focus. However, the distinction is often blurred in practice. Neither military aid, nor the enforcement aspects of peacekeeping, qualify as ODA.
2 2014-17 data drawn from annual Aid Flow Mapping exercises (envelope reporting) and OCHA FTS. Data for 2006-2013 extracted on 24 Aug 2017 from the OECD Dataset Aid (ODA) disbursements to countries and regions [DAC2a]: http://bit.ly/2nbi6Sj. 3 OECD Glossary of Statistical Terms. For information on what qualifies as ODA, see http://bit.ly/1Wk9Qfy
147 217 202 258 302445 528 607 611 681
742
247
549 460 248
797 545527
672 588 563
1011
0
200
400
600
800
1,000
1,200
1,400
1,600
1,800
2,000
2006 2007 2008 2009 2010 2011 2012 2013 2014 2015 2016 2017
US$
Milli
ons,
Cur
rent
Pric
es
Development Humanitarian

4
The frontloading of lifesaving humanitarian support in 2017 likely played a significant role in staving off famine in Somalia. Whereas humanitarian aid also surged in response to the 2011 drought, levels of support did not increase until after a famine was declared.4 In comparison, humanitarian flows as of April 2017 (US$ 614 million) had already exceeded the previous year’s total (US$ 563), demonstrating a significant frontloading of support that enabled a scale up of famine prevention activities.
Total humanitarian aid captured in the aid mapping is less than the total reported to OCHA’s Financial Tracking Service (FTS) due to the different ways in which donors report and categorize their aid flows. Partners reported US$ 1.25 billion in humanitarian aid to the FTS for 2017.5 However, some of these flows are for activities that could also be classified as having a development focus.6
In the period 2016-2017, US$ 83.1 million was channeled the through the United Nations-managed Somalia Humanitarian Fund (SHF) by 13 governmental donors (Australia, Azerbaijan, Canada, Denmark, United Kingdom, Germany, Ireland, Republic of Korea, the Netherlands, Norway, Sri Lanka, Sweden, Switzerland). The SHF is not featured in Figure 3 or Table 3, as these contributions are captured under their respective donors.
4 According to a 2014 Feinstein International Center report, the famine response in 2011 was appropriate in terms of scale; however, the response was too late to actually prevent famine. The slow response was attributed to the fact that “political risk preferences, donor geopolitical concerns, and domestic political concerns appear to have outweighed humanitarian concerns, until the declaration of famine forced a response.” Available at: http://bit.ly/2EMl4qp. 5 Data extracted from OCHA FTS on 4 January 2018. 6 For example, the World Bank allocation of US$ 54.8 million from the International Development Association (IDA) Crisis Response Window tackles both development and humanitarian objectives. A large portion of this allocation was reported to the OCHA FTS but is considered by the reporting agency to be slightly more geared towards longer-term resilience and development goals. As such, it is counted as development aid for the purposes of this aid mapping exercise to avoid double counting.

5
Figure 3. Top 10 Providers of Humanitarian Aid, 2016-18 Listed in order of total reported humanitarian aid for 2016-18
131
126
53
84
17
21
25
13
22
12
388
182
133
24
23
30
23
33
22
14
53
3
19
14
100 200 300 400
USA
UK
EC
Germany
Denmark
Canada
Japan
CERF
Sweden
Switzerland
US$ Millions
2016
2017
2018

6
Table 3. Reported Humanitarian Aid by Partner7 US$ Millions, listed in order of magnitude of total aid reported for 2016-18
2016 2017 2018 TOTAL, 2016-18
1 United States of America 131.0 388.0 519.0 2 United Kingdom 126.4 181.6 52.6 360.6 3 European Commission 53.3 132.7 186.0 4 Germany 84.1 24.0 2.8 110.9 5 Denmark 16.6 22.7 19.4 58.6 6 Canada 20.8 30.2 51.0 7 Japan8 25.4 23.2 48.6 8 CERF*9 12.9 33.0 45.9 9 Sweden 22.2 22.4 44.7 10 Switzerland 11.5 14.3 14.0 39.8 11 Saudi Arabia* 17.4 10.6 28.1 12 Australia 5.4 20.6 26.0 13 Norway 4.8 17.0 21.8 14 Italy 3.9 7.6 4.4 12.2 15 Netherlands 3.9 11.3 15.2 16 Ireland* 7.3 6.2 13.5 17 Finland 6.5 6.6 13.1 18 China* 2.0 11.0 13.0 19 Private, individuals & organizations* 0.7 8.0 8.7 20 Other10 7.0 39.7 46.7
Total 563.0 1010.7 93.3 1666.9 *Data collected from OCHA FTS.
7 Based on donor reporting to the 2017 mapping exercise, supplemented by data from OCHA FTS. 8 Based on reporting to the 2016 aid mapping exercise. Japan did not report updated data in 2017. 9 The CERF is a global pooled fund. Its largest donors in 2017 were Germany, Sweden, the United Kingdom, the Netherlands and Norway. As the funds are pooled at the global level, a breakdown of donor contributions for Somalia is not possible. Details on donor contributions to the CERF are found here: www.unocha.org/cerf/donors/donorspage. 10 Other includes aid provided by 37 other partners providing US$ 6 million or less for 2016-18 combined. A full list of contributions by donor is accessible on the OCHA FTS: https://fts.unocha.org/countries/206/donors/2017

7
Development aid continues to rise steadily. Reported development aid to Somalia totaled US$ 742 million in 2017, a 9% increase over the 2016 total (US$ 681). Four donors provided 52% of development aid in 2017: the European Commission, Germany, the United Kingdom and the United States (Figure 4). Total development aid has not declined since 2009, and the stability seen in recent years (notably since 2014) is unusual for a fragile state. Projections for development aid in 2018 are lower than in past years due to a lower response rate from donors on their forward-looking envelopes.
Figure 4. Top 10 Providers of Development Aid, 2016-18
153
89
97
48
41
56
29
34
19
22
156
76
46
115
41
46
27
36
21
16
102
63
50
14
19
23
21
50 100 150
EC
UK
USA
Germany
Sweden
Global Fund
Denmark
Norway
Italy
AfDB
US$ Millions
2016
2017
2018

8
Table 4. Development Aid by Partner11 US$ Millions, listed in order of magnitude of total aid reported for 2016-18
2016 2017 2018 TOTAL, 2016-18 1 European Commission 153.4 155.9 309.3 2 United Kingdom 88.7 76.3 102.0 267.0 3 United States of America 97.2 45.5 63.3 206.1 4 Germany 48.4 114.9 163.4 5 Sweden 41.5 41.4 50.0 132.9 6 Global Fund 56.1 46.3 13.6 116.1 7 Denmark 29.4 26.9 18.5 74.8 8 Norway 34.0 35.8 69.8 9 Italy 19.1 20.6 23.2 62.8
10 African Development Bank 22.1 15.6 20.8 58.6 11 World Bank 54.8 54.8 12 Saudi Arabia* 20.0 30.0 50.0 13 Netherlands 17.4 15.5 10.5 43.4 14 Turkey* 10.0 29.8 39.8 15 Finland 14.2 10.4 9.1 33.8 16 Switzerland 11.2 6.6 14.0 31.8 17 UN PBF 13.4 13.4 18 Japan12 5.3 5.3 19 Australia 1.9 2.7 4.6 20 Other13 3.1 7.6 1.0 11.7
681.2 742.1 326.0 1749.4 * On treasury aid reported by the Ministry of Finance. These countries did not report their activities as part of the aid mapping exercise.
11 Based on donor reporting to the 2017 mapping exercise, supplemented by reporting of on-treasury grants by the Ministry of Finance. 12 Based on reporting to the 2016 aid mapping exercise. Japan did not report updated data in 2017. 13 Other includes development aid reported by partners providing US$ 3 million or less for 2016-18 combined. It mainly consists of core funding reported by UNESCO, UNDP, IFC and ILO, as well as contributions from GAVI (as reported by WHO) and the United Arab Emirates (which includes only on treasury aid reported by MoF).

9
3 On Treasury Aid The share of aid delivered on treasury has increased significantly. More than US$ 100 million in external grants (approx. 14% of development aid) was delivered through the treasury of the Federal Government of Somalia (FGS) in 2017. While it falls short of the 15% target set in the Use of Country Systems Roadmap,14 it represents a significant improvement from 2016 when US$ 55.3 million (8% of development aid) was delivered on treasury.
A majority of on treasury grants (91%, US$ 94 million) were delivered through three channels: projects financed by donors through the World Bank Multi Partner Fund (MPF), general budget support provided by Saudi Arabia and sector budget support provided by Turkey (Figure 5).
Figure 5. Largest Channels of On Treasury Aid, 2017
14 Through the Use of Country Systems Roadmap government and development partners set a collective target for 15% of external development spending be channeled through the treasury. The Roadmap is available for download at: http://bit.ly/2sufvme.
WB MPF, 4.6%
Saudi Arabia, 4.0%
Turkey, 4.0%
Other, 1.3%
Off treasury development aid, 86.0%

10
Table 5. Budgeted and Disbursed “On Treasury” Grants, 2016-201715
External Grants (US$ Millions) 2016 BUDGET
2016 ACTUALS
2017 BUDGET
2017 ACTUALS
WB Multi Partner Fund 58.7 20.4 68.4 34.2 Saudi Arabia 20.0 20.0 0.0 30.0 Turkey 14.0 10.0 28.1 29.8 European Commission 5.9 1.4 8.9 4.9 UN Multi Partner Trust Fund 4.8 0.8 3.5 2.0 United Arab Emirates 0.0 2.0 African Development Bank 3.0 1.5 3.7 0.9 Qatar 10.0 0.0 Norway 1.3 1.3
Total External Grants 107.6 55.3 122.6 103.9 Total Development Aid 681.2 742.1
% of Development Aid Channeled on Treasury
8% 14%
Box 2. What does “On Treasury” mean in Somalia?16 Disbursement through TSA: External financing is disbursed into the FGS Treasury Single Account (TSA), recorded on the Somalia Financial Management Information System (SFMIS), and managed through the government’s financial systems. In Somalia, a looser definition of “On Treasury” is applied to include funds disbursed into the TSA with additional safeguards.
Use of pooled funds: Pooled funding instruments can promote risk sharing, coordinated support and reduced overhead costs. If delivering at scale, risk can also be distributed across the portfolio through a range of projects with varying levels of risk.
15 Based on data provided by the Federal Ministry of Finance. 16 For more information on the diversity of ways in which international partners can use Somalia’s systems, please see the Use of Country Systems Roadmap, available at: http://bit.ly/2sufvme.

11
5 Use of Pooled Funds The use of pooled funding instruments in Somalia declined between 2015 and 2017. Whereas 29% of development aid was channeled through pooled funds in 2015, the share was only 24% in 2017 (Figure 6).
Figure 6. Share of Development Aid Channeled through Funds, 2015-17
The use of the funds established under the Somalia Development Reconstruction Facility (SDRF) remains low but steady. A reported 20% of development aid was channeled through the funds in 2017. This figure is higher than earlier estimates, having received a boost from large contributions made in late 2017.
Figure 7. Share of Development Aid Channeled through SDRF Funds, 2015-17
29%22% 24%22%18% 20%
0%
10%
20%
30%
40%
2015 2016 2017
% o
f Dev
elopm
ent A
id
% through allpooled funds% throughSDRF funds
WB MPF 10%
UN MPTF 10%
AfDB SIF 1%
Development aid channeled outside
of SDRF Funds79%
Other 21%
12
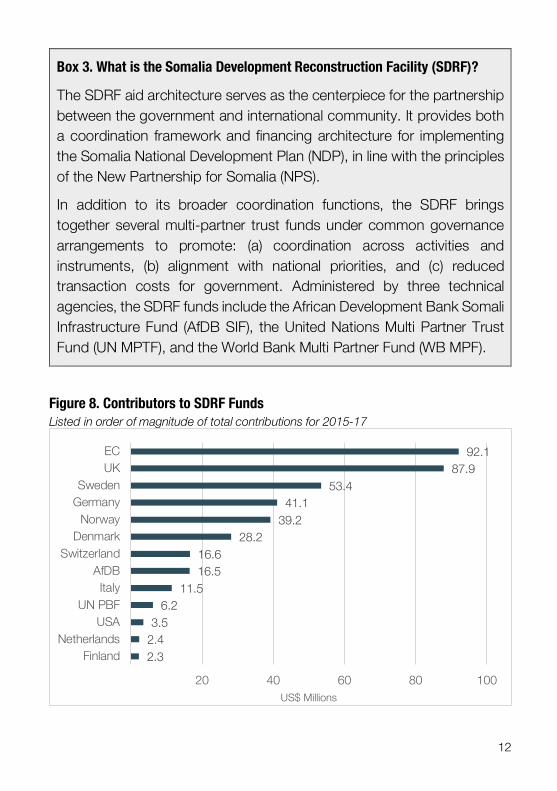
Box 3. What is the Somalia Development Reconstruction Facility (SDRF)?
The SDRF aid architecture serves as the centerpiece for the partnership between the government and international community. It provides both a coordination framework and financing architecture for implementing the Somalia National Development Plan (NDP), in line with the principles of the New Partnership for Somalia (NPS).
In addition to its broader coordination functions, the SDRF brings together several multi-partner trust funds under common governance arrangements to promote: (a) coordination across activities and instruments, (b) alignment with national priorities, and (c) reduced transaction costs for government. Administered by three technical agencies, the SDRF funds include the African Development Bank Somali Infrastructure Fund (AfDB SIF), the United Nations Multi Partner Trust Fund (UN MPTF), and the World Bank Multi Partner Fund (WB MPF).
Figure 8. Contributors to SDRF Funds Listed in order of magnitude of total contributions for 2015-17
2.32.43.5
6.211.5
16.516.6
28.239.241.1
53.487.9
92.1
20 40 60 80 100
FinlandNetherlands
USAUN PBF
ItalyAfDB
SwitzerlandDenmark
NorwayGermanySweden
UKEC
US$ Millions

13
Figure 9. Contributors to SDRF Funds, as % of Development Envelopes, 2016-17
Table 6. Contributors to SDRF Funds, as % of Development Envelopes, 2016-17
Contributions to SDRF Funds
Total Development Aid
% Channeled via SDRF Funds
SWITZERLAND 9.1 17.8 51% AFDB 16.5 37.8 44% NORWAY 29.7 69.8 43% SWEDEN 32.2 82.9 39% DENMARK 21.6 56.3 38% UNITED KINGDOM 53.5 165.0 32% GERMANY 41.1 163.4 25% ITALY 8.6 39.7 22% UN PBF 2.1 13.4 15% EUROPEAN COMMISSION
42.5 309.3 14%
FINLAND 2.3 24.6 9% NETHERLANDS 2.4 32.9 7% USA 3.5 142.7 2%
0%10%20%30%40%50%60%70%80%90%
100%
Switzerlan
dAfDB
Norway
Sweden
Denmark UK
German
yIta
ly
UN PBF ECFin
land
Netherla
nds
USA
Development aid delivered outside of SDRF Funds
Contributions to SDRF Funds

14
Table 7. Aid Channeled through SDRF Funds, 2015-1817 US$ Millions 2015 2016 2017 2018 TOTAL AFDB SIF
2.2 18
20.2
African Development Bank
16.5 16.5 Italy
1.6 0.2 1.8
United Kingdom
0.6 1.3 1.9 UN MPTF 66.2 65.0 52.5 14.2 197.9
Denmark 2.5 9.7 5.5 2.8 20.5 European Commission 28.0 8.4 9.5 5.2 51.1 Germany 8.4 3.8 12.2 Italy 0.7 4.2 2.7 7.5 Netherlands 2.4 2.4 Norway 4.7 5.3 3.7 13.7 Sweden 13.1 7.5 14.4 35.0 Switzerland 2.3 4.9 2.3 2.5 12.0 United Kingdom 10.8 14.1 8.2 3.7 36.8 UN Peacebuilding Fund 4.1 2.1 6.2 United States of America 0.5 0.5
WB MPF 69.7 52.6 74.7 29.8 226.8 Denmark 4.1 2.6 3.8 10.5 European Commission 21.6 9.7 14.9 26.2 72.4 Finland 2.3 1.1 3.4 Germany 28.9 28.9 Italy 2.2 2.2 Norway 4.9 6.0 14.6 25.5 Sweden 8.1 4.3 6.0 18.4 Switzerland 5.2 1.9 2.5 9.6 United Kingdom 23.6 22.8 6.5 52.9 United States of America 3.0 3.0
17 Based on Donor reporting to 2017 Aid Mapping Exercise.
15
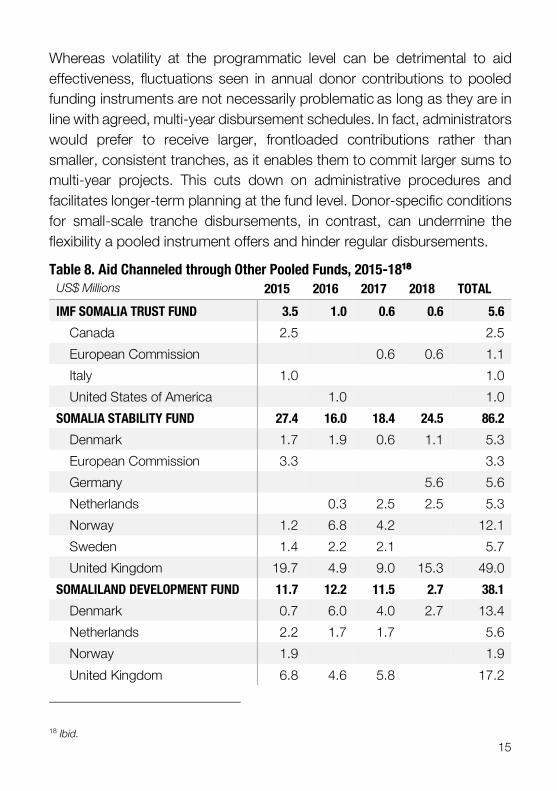
Whereas volatility at the programmatic level can be detrimental to aid effectiveness, fluctuations seen in annual donor contributions to pooled funding instruments are not necessarily problematic as long as they are in line with agreed, multi-year disbursement schedules. In fact, administrators would prefer to receive larger, frontloaded contributions rather than smaller, consistent tranches, as it enables them to commit larger sums to multi-year projects. This cuts down on administrative procedures and facilitates longer-term planning at the fund level. Donor-specific conditions for small-scale tranche disbursements, in contrast, can undermine the flexibility a pooled instrument offers and hinder regular disbursements.
Table 8. Aid Channeled through Other Pooled Funds, 2015-1818 US$ Millions 2015 2016 2017 2018 TOTAL IMF SOMALIA TRUST FUND 3.5 1.0 0.6 0.6 5.6
Canada 2.5
2.5 European Commission
0.6 0.6 1.1
Italy 1.0
1.0 United States of America
1.0
1.0
SOMALIA STABILITY FUND 27.4 16.0 18.4 24.5 86.2 Denmark 1.7 1.9 0.6 1.1 5.3 European Commission 3.3
3.3
Germany
5.6 5.6 Netherlands
0.3 2.5 2.5 5.3
Norway 1.2 6.8 4.2
12.1 Sweden 1.4 2.2 2.1
5.7
United Kingdom 19.7 4.9 9.0 15.3 49.0 SOMALILAND DEVELOPMENT FUND 11.7 12.2 11.5 2.7 38.1
Denmark 0.7 6.0 4.0 2.7 13.4 Netherlands 2.2 1.7 1.7
5.6
Norway 1.9
1.9 United Kingdom 6.8 4.6 5.8
17.2
18 Ibid.
16
6 Breakdown by Sector This section provides a breakdown of aid flows against the pillars of Somalia’s National Development Plan (NDP). The figures draw on actual and projected project-level disbursement data. It should not be assumed that activities are aligned to the NDP priorities simply because they are mapped to a specific priority. The extent of programmatic alignment should be discussed within Pillar Working Groups.
This section draws on reported data on both development and humanitarian projects. This the first year that a significant amount of humanitarian data has been reported and included in the sector analysis. The increase in humanitarian reporting accounts for the substantial increase in reporting against the Resilience Pillar for 2017 and 2018. This data has been collected with the aim of improving coordination between development and humanitarian actors at the pillar level.19
The project level data collected in 2017 captures an estimated 77% of financed development and humanitarian activities in Somalia, compared with 68% of total ODA in 2016. It does not include activities financed through military aid or the enforcement aspects of peacekeeping.
19 For the 2017 aid mapping, partners were encouraged to report any activities deemed of relevance to the NDP, regardless of the funding source. This resulted in increased reporting by humanitarian partners compared with past years.

17
Figure 10. Share of Aid by NDP Pillar, 2016-2018 Combined20 Figure includes reported development and humanitarian aid
Figure 11. Share of Aid by NDP Pillar and Year, 2016-18
20 The Gender and Human Rights Pillar is not included in Figures 10 and 11 as many activities related to these themes are mainstreamed across other pillars; therefore, disbursements reported against this pillar underrepresent the true scale of engagement in these areas. For information on cross-cutting markers, see Section 7. Activities reported as “other” are also excluded as they represent less than 1% of disbursements for this period.
Peace, Inclusive Politics, Security & Rule of Law
13.9%
Effective, Efficient
Institutions14.2%
Economic Growth6.3%
Infrastructure4.1%
Social & Human Development
19.4%
Resilience42.0%
193155
7539
196165151 167
64 51
254
639
4577
36 2594
373
100
200
300
400
500
600
700
Peace,InclusivePolitics,
Security &Rule of Law
Effective,Efficient
Institutions
EconomicGrowth
Infrastructure Social &Human
Development
Resilience
US$
Milli
ons
2016 2017 2018

18
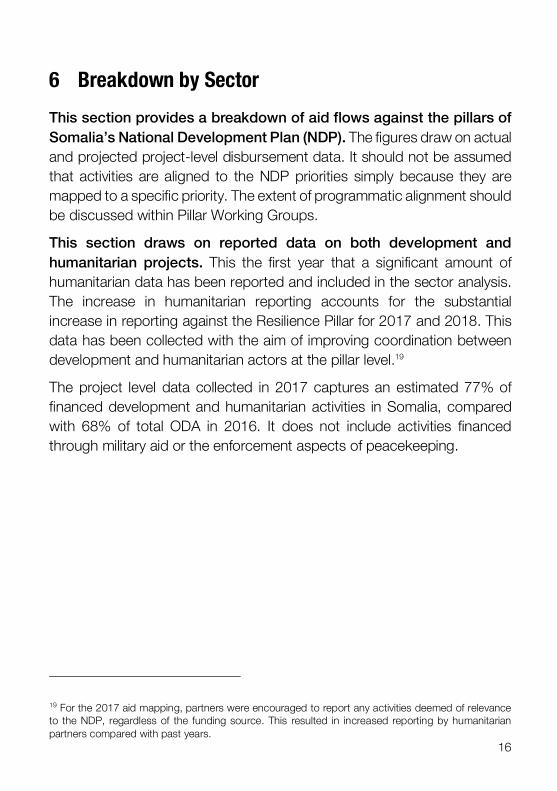
Inclusive Politics Figure 12. Inclusive Politics: Project Disbursements Reported in 2017 2018 projections may not reflect latest planned disbursements.
Figure 13. Inclusive Politics: Key Implementers Breakdown of total project disbursements (2016-18) by reported category of implementer
"Other" includes unclear / TBD (2%), mix of implementers - no government (1.9%), IFIs (1.4%), academic / research organizations (1%), government (1%), regional actors (0.5%), mix of implementers involving government (0.2%).
96.1
65.7
28.3
20
40
60
80
100
2016 2017 2018
US$
Milli
ons
NGOs43%
UN30%
Private Sector19%
Other8%
19
Figure 14. Inclusive Politics: Project Disbursements by Location
FGS
Bena
dir
Galm
udug
Hiirs
habe
lle
Juba
land
Punt
land
Sout
h W
est
Som
alilan
d
Unat
tribu
ted
Pilla
r Tot
al 2016 17.6 6.2 8.3 6.5 15.9 6.7 7.0 18.0 9.9 96.1 2017 12.8 3.3 2.1 2.8 9.4 4.0 9.7 9.7 11.9 65.7 2018 4.0 1.0 0.4 1.1 4.6 1.8 4.7 4.0 6.7 28.3
34.4 10.6 10.8 10.4 29.9 12.5 21.4 31.7 28.4 190.2
510152025303540
FGS
Benad
ir
Galmud
ug
Hiirsha
belle
Juba
land
Puntlan
d
South
West
Somalil
and
Unattri
buted
US$
Milli
ons
2016 2017 2018
20
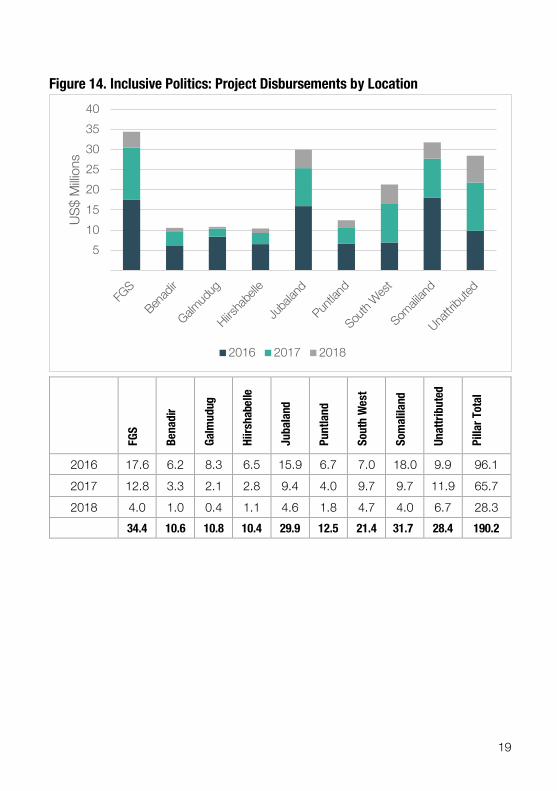
Rule of Law Figure 15. Rule of Law: Project Disbursements 2018 projections may not reflect latest planned disbursements.
Figure 16. Key Implementers of Rule of Law Projects Breakdown of total project disbursements (2016-18) by reported category of implementer
65.5
48.3
4.710
20
30
40
50
60
70
80
2016 2017 2018
US$
Milli
ons
UN67%
NGOs7% Unclear / TBD
5%
Private Sector5%
Government4%
Mix of implementers -no government
4%Military
4%
Mix of implementers -involving government
4%
Other26%

21
Figure 17. Rule of Law: Project Disbursements by Location
FGS
Bena
dir
Galm
udug
Hiirs
habe
lle
Juba
land
Punt
land
Sout
h W
est
Som
alilan
d
Unat
tribu
ted
Pilla
r Tot
al 2016 25.2 5.6 0.1 3.2 4.2 7.9 4.0 9.0 6.3 65.5
2017 17.5 3.5 0.6 4.4 4.4 3.3 4.5 3.3 6.7 48.3
2018 0.2 0.9 0.6 0.6 0.7 0.1 0.7 0.4 0.5 4.7
42.9 10.1 1.3 8.2 9.3 11.3 9.3 12.7 13.5 118.5
5101520253035404550
FGS
Benad
ir
Galmud
ug
Hiirsha
belle
Juba
land
Puntlan
d
South
West
Somalil
and
Unattri
buted
US$
Milli
ons
2016 2017 2018

22
Effective, Efficient Institutions Table 9. Effective, Efficient Institutions: Reported Project-Level Disbursements
2016 2017 2018 155.2 166.7 76.9
Figure 18. Effective, Efficient Institutions: Project Disbursements by Sector 2018 projections may not reflect latest planned disbursements.
Figure 19. Key Implementers of Effective, Efficient Institutions Projects Breakdown of total project disbursements (2016-18) by reported category of implementer
"Other" includes donor agencies (1.2%), mix of implementers involving government (0.8%), unclear / TBD (0.7%), and academic / research organizations (0.1%).
17.9 20.7 10.49.9 14.1
13.2
63.9
86.8
52.1
63.5
45.2
1.1
20
40
60
80
100
120
140
160
180
2016 2017 2018
US$
Milli
ons
State and LocalGovernancePublic FinancialManagementPlanning, M&E andStatisticsCivil Service Reform /Public Administration
Government43%
Private Sector27%
UN20% NGOs
5%
IFIs3%Other2%
Other10%

23
Figure 20. Effective, Efficient Institutions: Project Disbursements by Location Disbursements for 2016-18 combined
FGS
Bena
dir
Galm
udug
Hiirs
habe
lle
Juba
land
Punt
land
Sout
h W
est
Som
alilan
d
Unat
tribu
ted
Pilla
r Tot
al Civil Service Reform / Public Administration
19.9 2.6 0.8 0.7 1.3 5.2 6.8 5.9 5.7 48.9
Planning, M&E and Statistics
9.8 3.0 0.5 0.5 5.4 1.2 3.1 1.5 12.1 37.2
Public Financial Management
146.1 0.0 3.6 3.5 7.9 15.9 4.9 12.8 8.3 202.8
State and Local Governance
10.5 3.5 11.9 2.9 14.7 17.5 21.1 18.3 9.4 109.8
186.4 9.2 16.7 7.6 29.3 39.8 36.0 38.5 35.4 398.8
20406080
100120140160180200
FGS
Benad
ir
Galmud
ug
Hiirsha
belle
Juba
land
Puntlan
d
South
West
Somalil
and
Unattri
buted
US$
Milli
ons
State and Local GovernancePublic Financial ManagementPlanning, M&E and StatisticsCivil Service Reform / Public Administration

24
Economic Growth Table 10. Economic Growth: Reported Project-Level Disbursements
2016 2017 2018 75.0 65.5 36.4
Figure 21. Economic Growth: Project Disbursements by Sector 2018 projections may not reflect latest planned disbursements.
Figure 22. Key Implementers Breakdown of total project disbursements (2016-18) by reported category of implementer
"Other" includes IFIs (1.7%), regional actors (0.6%), and mix of implementers involving government (0.2%).
57.041.7
28.1
18.0
22.7
8.3
1020304050607080
2016 2017 2018
US$
Milli
ons Productive Sectors
(Agriculture, Fisheries,Livestock)Private SectorDevelopment
Private Sector32%
UN23%
NGOs22%
Mix of implementers -
involving government
11% Donor Agencies5%
Government5%
Other2%
Other12%

25
Figure 23. Economic Growth: Project Disbursements by Location Disbursements for 2016-18 combined
FGS
Bena
dir
Galm
udug
Hiirs
habe
lle
Juba
land
Punt
land
Sout
h W
est
Som
alilan
d
Unat
tribu
ted
Pilla
r Tot
al
Private Sector Development 8.5 10.9 4.8 11.8 13.9 15.4 10.5 42.6 8.4 126.8
Productive Sectors 5.4 0.6 0.6 3.1 4.3 4.3 5.6 16.9 8.1 49.0
13.9 11.5 5.4 14.9 18.2 19.7 16.2 59.5 16.5 175.8
10
20
30
40
50
60
70
FGS
Benad
ir
Galmud
ug
Hiirsha
belle
Juba
land
Puntlan
d
South
West
Somalil
and
Unattri
buted
US$
Milli
ons
Productive Sectors (Agriculture, Fisheries, Livestock)
Private Sector Development

26
Infrastructure Table 11. Infrastructure: Reported Project-Level Disbursements
2016 2017 2018 39.1 50.9 25.0
Figure 24. Infrastructure: Project Disbursements by Sector 2018 projections may not reflect latest planned disbursements.
Figure 25. Key Implementers of Infrastructure Projects Breakdown of total project disbursements (2016-18) by reported category of implementer
"Other" includes unclear / TBD (3%) and IFIs (1%)
5.310.7 7.7
13.013.6
5.7
9.7
14.0
3.5
11.1
12.7
8.1
10
20
30
40
50
60
2016 2017 2018
US$
Milli
ons
Water and Sanitation(Urban)Transport: Roads, Ports,AirportsMixed Infrastructure
Energy and ICT
UN27%
Government23%
Mix of implementers -involving government
16%
Private Sector14%
NGOs11%
Donor Agencies6%
Other3%

27
Figure 26. Infrastructure: Project Disbursements by Location Disbursements for 2016-18 combined
FGS
Bena
dir
Galm
udug
Hiirs
habe
lle
Juba
land
Punt
land
Sout
h W
est
Som
alilan
d
Unat
tribu
ted
Pilla
r Tot
al
Energy and ICT 5.4 0.4 0.5 1.4 0.5 1.2 0.5 11.0 2.8 23.7 Mixed Infrastructure 5.9 1.4 1.1 1.6 2.6 8.1 6.1 5.5 32.3
Transport: Roads, Ports, Airports 0.5 3.2 1.1 6.4 15.7 0.2 27.1
Water and Sanitation (Urban) 0.7 0.4 1.7 1.0 1.7 4.6 1.7 20.2 31.9
12.5 5.4 3.3 4.0 5.8 20.4 8.3 52.4 2.9 115.0
10
20
30
40
50
60
FGS
Benad
ir
Galmud
ug
Hiirsha
belle
Juba
land
Puntlan
d
South
West
Somalil
and
Unattri
buted
US$
Milli
ons
Energy and ICTMixed InfrastructureTransport: Roads, Ports, AirportsWater and Sanitation (Urban)
28
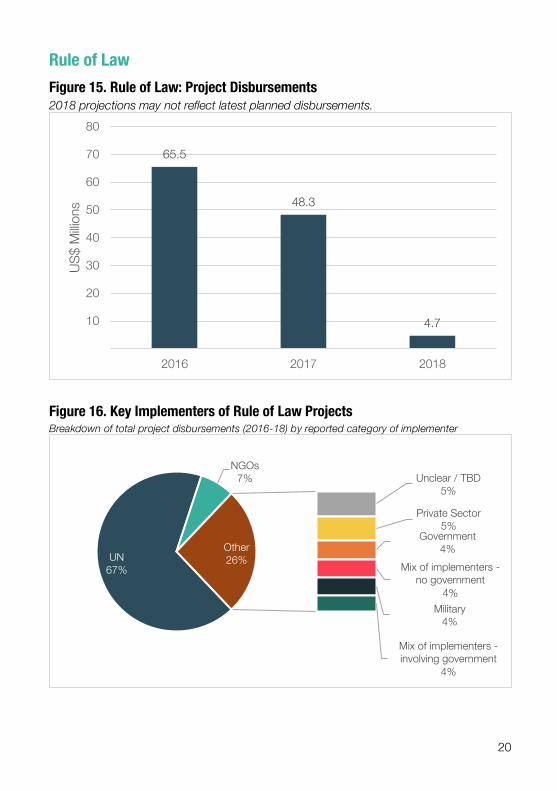
Social & Human Development Table 12. Social & Human Development: Reported Project-Level Disbursements
2016 2017 2018 195.7 253.5 94.0
Figure 27. Social & Human Development: Project Disbursements by Sector 2018 projections may not reflect latest planned disbursements.
Figure 28. Key Implementers of Social & Human Development Projects Breakdown of total project disbursements (2016-18) by reported category of implementer
"Other" includes unclear / TBD (2.3%), mix of implementers - no government (1.5%), academic / research organizations (0.7%), IFIs (0.1%) and intergovernmental organizations (0.04%)
55.4 53.39.4
138.5176.3
84.1
1.8
23.9
0.5
50
100
150
200
250
2016 2017 2018
US$
Milli
ons
WASH
Health
Education
NGOs40%
Mix of implementers -
involving government
34%UN
12%Private Sector
4%Donor Agency
3%Government2%
Other5%
Other14%

29
Figure 29. Social & Human Development: Project Disbursements by Location Disbursements for 2016-18 combined
FGS
Bena
dir
Galm
udug
Hiirs
habe
lle
Juba
land
Punt
land
Sout
h W
est
Som
alilan
d
Unat
tribu
ted
Pilla
r Tot
al
Education 9.3 5.4 9.0 12.0 9.7 15.3 9.3 24.1 24.0 118.1
Health 10.4 53.0 32.2 38.3 40.1 58.4 32.8 65.6 67.9 398.9
WASH 5.0 2.5 2.5 2.6 5.9 2.5 5.0 26.2
19.6 63.5 43.7 52.8 52.5 79.6 44.6 94.8 92.0 543.2
102030405060708090
100
FGS
Benad
ir
Galmud
ug
Hiirsha
belle
Juba
land
Puntlan
d
South
West
Somalil
and
Unattri
buted
US$
Milli
ons
Education Health WASH

30
Resilience Table 13. Resilience: Reported Project-Level Disbursements
2016 2017 2018 164.8 639.3 372.6
Figure 30. Resilience: Project Disbursements by Sector 2018 projections may not reflect latest planned disbursements.
Figure 31. Key Implementers of Resilience Projects Breakdown of total project disbursements (2016-18) by reported category of implementer
"Other" includes unclear / TBD (2.6%), government (1.7%), donor agencies (1.6%), private sector (1.3%), Intergovernmental agencies (1.1%), and regional actors (0.4%).
2016 2017 2018Multi-sectoral resilience 37.5 43.5 15.7Lifesaving humanitarian -
cross-cutting 20.4 74.4 13.2
Food Security 41.7 400.3 298.4Social Protection 5.5 5.0 3.0Natural Resources
Management 38.3 49.0 22.0
Migration, Displacement,Refugees and Durable
Solutions21.3 66.9 20.4
100200300400500600700
US$
Milli
ons
Mix of implementers -
involving government
62%
NGOs22%
UN7%
Other9%
31
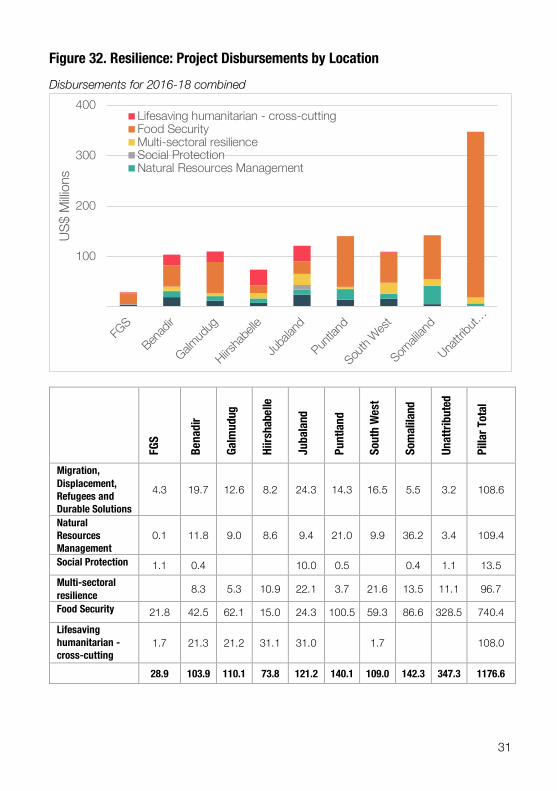
Figure 32. Resilience: Project Disbursements by Location Disbursements for 2016-18 combined
FGS
Bena
dir
Galm
udug
Hiirs
habe
lle
Juba
land
Punt
land
Sout
h W
est
Som
alilan
d
Unat
tribu
ted
Pilla
r Tot
al Migration, Displacement, Refugees and Durable Solutions
4.3 19.7 12.6 8.2 24.3 14.3 16.5 5.5 3.2 108.6
Natural Resources Management
0.1 11.8 9.0 8.6 9.4 21.0 9.9 36.2 3.4 109.4
Social Protection 1.1 0.4 10.0 0.5 0.4 1.1 13.5 Multi-sectoral resilience 8.3 5.3 10.9 22.1 3.7 21.6 13.5 11.1 96.7
Food Security 21.8 42.5 62.1 15.0 24.3 100.5 59.3 86.6 328.5 740.4 Lifesaving humanitarian - cross-cutting
1.7 21.3 21.2 31.1 31.0 1.7 108.0
28.9 103.9 110.1 73.8 121.2 140.1 109.0 142.3 347.3 1176.6
100
200
300
400
FGS
Benad
ir
Galmud
ug
Hiirsha
belle
Juba
land
Puntlan
d
South
West
Somalil
and
Unattri
but…
US$
Milli
ons
Lifesaving humanitarian - cross-cuttingFood SecurityMulti-sectoral resilienceSocial ProtectionNatural Resources Management

32
Gender & Human Rights The figures in this section underrepresent the scale of project disbursements related to gender and human rights as many of the activities related to these themes are mainstreamed across other pillars. The gender marker in Section 7 provides more detail on activities across pillars with a gender component. There is currently not a marker for human rights.
Figure 33. Gender & Human Rights: Project Disbursements 2018 projections may not reflect latest planned disbursements.
Figure 34. Key Implementers of Gender & Human Rights Projects Breakdown of total project disbursements (2016-18) by reported category of implementer
"Other" includes unclear / TBD (2.3%), mix of implementers - no government (1.5%), academic / research organizations (0.7%), IFIs (0.1%) and intergovernmental organizations (0.04%)
16.013.0
7.15
10
15
2016 2017 2018
US$
Milli
ons
NGOs87%
Mix of implementers -
involving government
10%
Private Sector2%
Government1%

33
Figure 35. Gender & Human Rights: Project Disbursements by Location Disbursements for 2016-18 combined
FGS
Bena
dir
Galm
udug
Hiirs
habe
lle
Juba
land
Punt
land
Sout
h W
est
Som
alilan
d
Unat
tribu
ted
Pilla
r Tot
al 2016 0.7 5.0 0.2 0.2 0.3 2.2 1.8 3.9 1.7 16.0
2017 0.1 4.5 0.3 0.3 0.5 2.5 1.6 2.9 0.3 13.0
2018 0.1 3.7 0.1 0.1 0.2 0.9 0.7 1.1 0.2 7.1
0.8 13.1 0.6 0.6 1.0 5.7 4.1 7.9 2.1 36.1
2
4
6
8
10
12
14
FGS
Benad
ir
Galmud
ug
Hiirsha
belle
Juba
land
Puntlan
d
South
West
Somalil
and
Unattri
buted
US$
Milli
ons
2016 2017 2018

34
7 Breakdown by Location In this section, project-level spending has been disaggregated based on reported locations. The location data in this section is presented to show breakdowns by year, pillar and sector. As with the previous section, these figures include some humanitarian disbursements, notably under the Resilience Pillar. However, it does not include the much of the lifesaving humanitarian aid disbursed in Somalia. The aid mapping exercise was focused primarily on the collection of project-level aid related to the National Development Plan (NDP), and therefore, lifesaving humanitarian aid was not the main focus of data collection at the project-level data.
Figure 36. Breakdown of Aid by Location and Year, 2016-18 Based on project-level reporting of development and some humanitarian flows.
FGS
Bena
dir
Galm
udug
Hiirs
habe
lle
Juba
land
Punt
land
Sout
h W
est
Som
alilan
d
Unat
tribu
ted
All lo
catio
ns
2016 147.5 73.0 52.8 62.1 93.0 93.4 78.4 153.9 95.5 849.5 2017 163.9 100.7 89.4 81.1 133.0 146.8 117.0 192.1 319.3 1343.3 2018 60.8 54.9 52.2 31.9 52.9 92.4 64.9 95.9 151.6 657.5 Total 372.2 228.6 194.4 175.1 278.9 332.6 260.3 441.8 566.4 2850.3
0
50
100
150
200
250
300
350
FGS
Benad
ir
Galmud
ug
Hiirsha
belle
Juba
land
Puntlan
d
South
West
Somalil
and
Unattri
buted
US$
Milli
ons
2016 2017 2018

35
Figure 37. Breakdown of Aid by Location and Pillar, 201721
FGS
Bena
dir
Galm
udug
Hiirs
habe
lle
Juba
land
Punt
land
Sout
h W
est
Som
alila
nd
Unat
tribu
ted
Peace, Inclusive Politics, Security & Rule of Law*
41.5 7.2 3.5 8.1 21.1 8.5 21.2 13.3 26.9
Effective, Efficient Institutions
86.3 2.9 6.5 2.9 11.7 16.6 12.7 16.0 11.3
Economic Growth 5.7 2.3 1.8 5.1 7.7 5.8 5.8 23.4 6.8
Infrastructure 4.8 3.1 1.1 1.0 2.7 8.3 4.6 22.3 2.9
Social & Human Development
10.3 31.5 22.1 23.6 23.9 42.8 20.2 47.5 31.6
Resilience 15.1 48.8 54.1 40.0 65.3 62.2 50.7 66.5 236.5
21 The Gender and Human Rights Pillar is not included as many activities related to these themes are mainstreamed across other pillars; therefore, disbursements reported against this pillar underrepresent the true scale of engagement in these areas. For information on cross-cutting markers, see Section 7.
50
100
150
200
250
300
350
FGS
Benad
ir
Galmud
ug
Hiirsha
belle
Juba
land
Puntlan
d
South
West
Somalil
and
Unattri
buted
US$
Milli
ons
Resilience
Social & HumanDevelopmentInfrastructure
Economic Growth
Effective, EfficientInstitutionsPeace, Inclusive Politics,Security & RoL

36
Figure 38. Changes in Reported Share of Aid by Location, 2016-18 Excluding project-level disbursements that were not attributed to a specific location
Box 4. About the Location Breakdowns
The following pages break down project disbursements by location and pillar. Aid for the FGS has been disaggregated from aid to Benadir Region to provide a clearer picture of aid that benefits national vs. local institutions and beneficiaries.
In the overview figures for each location, reporting against inclusive politics, security and rule of law has been merged using the original language from the NDP to provide a simple overview comparison across pillars. The sectors are broken down further in the following figures. Security disbursements only include projects that qualify as development assistance. Military aid is not included in the aid mapping.
The Gender and Human Rights Pillar is not included in the breakdowns as many activities related to these themes are mainstreamed across other pillars; therefore, disbursements reported against this pillar underrepresent the true scale of engagement in these areas. For information on cross-cutting markers, see Section 7.
20% 16% 12%
10% 10% 11%
7% 9% 10%
8% 8% 6%
12% 13%10%
12% 14% 18%
10% 11% 13%
20% 19% 19%
0%
10%
20%
30%
40%
50%
60%
70%
80%
90%
100%
2016 2017 2018FGS
Benadir
Galmudug
Hiirshabelle
Jubaland
Puntland
South West
Somaliland
37
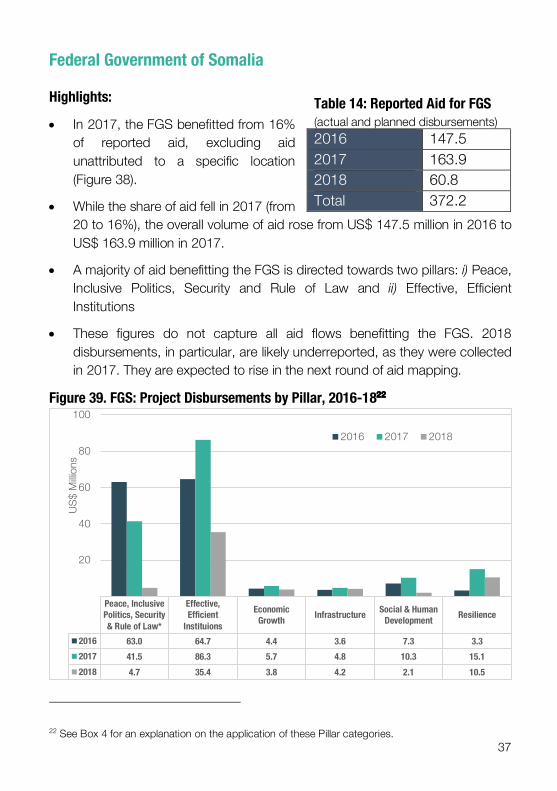
Federal Government of Somalia Highlights:
• In 2017, the FGS benefitted from 16% of reported aid, excluding aid unattributed to a specific location (Figure 38).
• While the share of aid fell in 2017 (from 20 to 16%), the overall volume of aid rose from US$ 147.5 million in 2016 to US$ 163.9 million in 2017.
• A majority of aid benefitting the FGS is directed towards two pillars: i) Peace, Inclusive Politics, Security and Rule of Law and ii) Effective, Efficient Institutions
• These figures do not capture all aid flows benefitting the FGS. 2018 disbursements, in particular, are likely underreported, as they were collected in 2017. They are expected to rise in the next round of aid mapping.
Figure 39. FGS: Project Disbursements by Pillar, 2016-1822
22 See Box 4 for an explanation on the application of these Pillar categories.
Peace, InclusivePolitics, Security& Rule of Law*
Effective,Efficient
Instituions
EconomicGrowth Infrastructure Social & Human
Development Resilience
2016 63.0 64.7 4.4 3.6 7.3 3.32017 41.5 86.3 5.7 4.8 10.3 15.12018 4.7 35.4 3.8 4.2 2.1 10.5
20
40
60
80
100
US$
Milli
ons
2016 2017 2018
Table 14: Reported Aid for FGS (actual and planned disbursements) 2016 147.5 2017 163.9 2018 60.8 Total 372.2
38
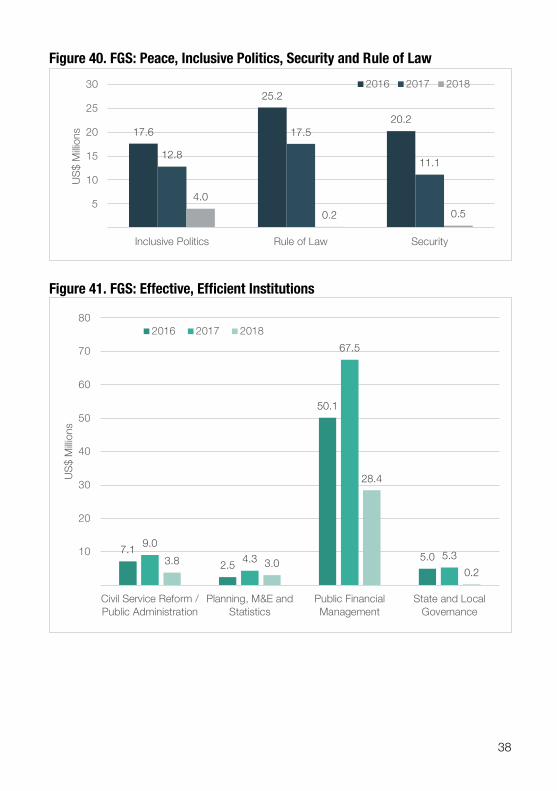
Figure 40. FGS: Peace, Inclusive Politics, Security and Rule of Law
Figure 41. FGS: Effective, Efficient Institutions
17.6
25.2
20.2
12.8
17.5
11.1
4.00.2 0.5
5
10
15
20
25
30
Inclusive Politics Rule of Law Security
US$
Milli
ons
2016 2017 2018
7.12.5
50.1
5.09.0
4.3
67.5
5.33.8 3.0
28.4
0.2
10
20
30
40
50
60
70
80
Civil Service Reform /Public Administration
Planning, M&E andStatistics
Public FinancialManagement
State and LocalGovernance
US$
Milli
ons
2016 2017 2018

39
Figure 42. FGS: Economic Growth
Figure 43. FGS: Infrastructure
Figure 44. FGS: Social & Human Development
Figure 45. Project Disbursements for FGS: Resilience
1.8 2.73.0 2.73.7
0.1
5
10
15
Private Sector Development Productive Sectors (Agriculture, Fisheries, Livestock)
US$
Milli
ons
2016 2017 2018
1.2 2.30.1
2.2 2.20.2 0.2
2.1 1.50.2 0.5
5
10
15
Energy and ICT Mixed Infrastructure Transport: Roads,Ports, Airports
Water and Sanitation(Urban)
US$
Milli
ons 2016 2017 2018
4.82.4
4.06.3
0.41.6
5
10
15
Education Health
US$
Milli
ons
2016 2017 2018
1.1 0.01.4 0.7
2.50.1 1.1
10.4
1.00.7
9.9
5
10
15
Migration,Displacement,Refugees and
Durable Solutions
NaturalResources
Management
Social Protection Food Security Lifesavinghumanitarian -cross-cutting
US$
Milli
ons 2016 2017 2018

40
Benadir
Highlights:
• In 2017, Benadir benefitted from 10% of reported aid, excluding aid unattributed to a specific location (Figure 38).
• While the share of aid remained stable in 2017, the overall volume of aid rose from US$ 73 million in 2016 to US$ 100.7 million in 2017 (an increase of 38%).
• A majority of aid benefitting Benadir is directed towards two pillars: i) Resilience and ii) Social and Human Development.
• These figures do not capture all aid flows benefitting Benadir. 2018 disbursements, in particular, are likely underreported, as they were collected in 2017. They are expected to rise in the next round of aid mapping.
Figure 46. Benadir: Project Disbursements by Pillar, 2016-1823
23 See Box 4 for an explanation on the application of these Pillar categories.
Peace,InclusivePolitics,
Security &Rule of Law*
Effective,Efficient
Instituions
EconomicGrowth Infrastructure
Social &Human
DevelopmentResilience
2016 11.9 4.6 7.1 1.5 20.9 21.62017 7.2 2.9 2.3 3.1 31.5 48.82018 2.1 1.7 2.1 0.8 11.2 33.4
10
20
30
40
50
60
US$
Mill
ions
2016 2017 2018
Table 15: Reported Aid for Benadir (actual and planned disbursements) 2016 73.0 2017 100.7 2018 54.9 Total 228.6

41
Figure 47. Benadir: Peace, Inclusive Politics, Security and Rule of Law
Figure 48. Benadir: Effective, Efficient Institutions
Figure 49. Benadir: Economic Growth
Figure 50. Benadir: Infrastructure
6.2 5.6
0.1
3.3 3.5
0.41.0 0.90.1
2
4
6
8
10
Inclusive Politics Rule of Law Security
US$
Milli
ons
2016 2017 2018
1.2 1.10.0
2.30.7 1.0 0.0
1.20.8 0.9
5
10
Civil Service Reform /Public Administration
Planning, M&E andStatistics
Public FinancialManagement
State and LocalGovernance
US$
Milli
ons 2016 2017 2018
6.8
0.32.2
0.12.0
0.1
5
10
Private Sector Development Productive Sectors (Agriculture, Fisheries,Livestock)
US$
Milli
ons
2016 2017 2018
0.1 0.3 0.9 0.10.2 1.0 1.80.10.2 0.0 0.5 0.1
5
10
Energy and ICT Mixed Infrastructure Transport: Roads,Ports, Airports
Water and Sanitation(Urban)
US$
Milli
ons
2016 2017 2018
42
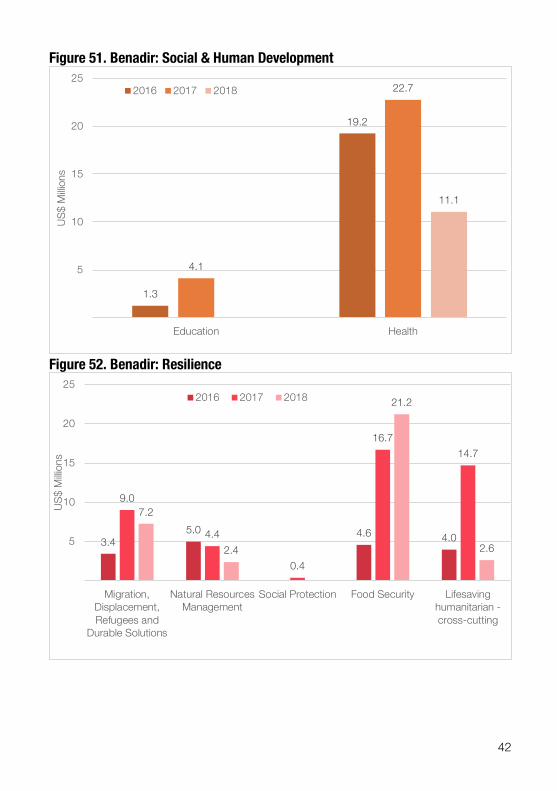
Figure 51. Benadir: Social & Human Development
Figure 52. Benadir: Resilience
1.3
19.2
4.1
22.7
11.1
5
10
15
20
25
Education Health
US$
Milli
ons
2016 2017 2018
3.45.0 4.6 4.0
9.0
4.4
0.4
16.714.7
7.2
2.4
21.2
2.65
10
15
20
25
Migration,Displacement,Refugees and
Durable Solutions
Natural ResourcesManagement
Social Protection Food Security Lifesavinghumanitarian -cross-cutting
US$
Milli
ons
2016 2017 2018

43
Galmudug Highlights:
• In 2017, Galmudug benefitted from 9% of reported aid, excluding aid unattributed to a specific location (Figure 38).
• The overall volume of aid to Galmudug rose significantly between 2016 and 2017, from US$ 52.8 million to US$ 89.4 million respectively (an increase of 69%).
• A majority of aid benefitting Galmudug is directed towards two pillars: i) Resilience and ii) Social and Human Development.
• These figures do not capture all aid flows benefitting Galmudug. 2018 disbursements, in particular, are likely underreported, as they were collected in 2017. They are expected to rise in the next round of aid mapping.
Figure 53. Galmudug: Project Disbursements by Pillar, 2016-1824
24 See Box 4 for an explanation on the application of these Pillar categories.
Peace,InclusivePolitics,
Security &Rule of Law*
Effective,Efficient
Instituions
EconomicGrowth Infrastructure
Social &Human
DevelopmentResilience
2016 8.7 7.7 2.5 0.4 14.3 18.52017 3.5 6.5 1.8 1.1 22.1 54.12018 1.8 2.6 1.1 1.7 7.3 37.6
10
20
30
40
50
60
US$
Mill
ions
2016 2017 2018
Table 16: Reported Aid for Galmudug (actual and planned disbursements)
2016 52.8 2017 89.4 2018 52.2 Total 194.4

44
Figure 54. Galmudug: Peace, Inclusive Politics, Security and Rule of Law
Figure 55. Galmudug: Effective, Efficient Institutions
Figure 56. Galmudug: Economic Growth
Figure 57. Galmudug: Infrastructure
8.3
0.1 0.32.1
0.6 0.80.4 0.6 0.8
5
10
Inclusive Politics Rule of Law Security
US$
Milli
ons
2016 2017 2018
0.3 0.21.2
6.0
0.3 0.2 0.8
5.1
0.2 0.11.5 0.8
5
10
Civil Service Reform /Public Administration
Planning, M&E andStatistics
Public FinancialManagement
State and LocalGovernance
US$
Milli
ons
2016 2017 2018
2.20.3
1.60.1
1.00.1
5
10
Private Sector Development Productive Sectors (Agriculture, Fisheries,Livestock)
US$
Milli
ons
2016 2017 2018
0.1 0.2 0.10.2 0.4 0.50.2 0.5 1.0
5
10
Energy and ICT Mixed Infrastructure Transport: Roads,Ports, Airports
Water and Sanitation(Urban)
US$
Milli
ons 2016 2017 2018

45
Figure 58. Galmudug: Social & Human Development
Figure 59. Galmudug: Resilience
2.6
11.6
4.9
14.9
1.5
5.85
10
15
20
Education Health
US$
Milli
ons
2016 2017 2018
2.64.9 6.1
3.9
7.9
3.4
25.3
14.6
2.20.6
30.7
2.65
10
15
20
25
30
35
Migration,Displacement,Refugees and
Durable Solutions
NaturalResources
Management
Social Protection Food Security Lifesavinghumanitarian -cross-cutting
US$
Milli
ons
2016 2017 2018

46
Hiirshabelle Highlights:
• In 2017, Hiirshabelle benefitted from 8% of reported aid, excluding aid unattributed to a specific location (Figure 38).
• While the share of aid remained steady in 2017, the overall volume of aid to Hiirshabelle rose from US$ 62.1 million in 2016 to US$ 81.1 million in 2017 (an increase of 31%)
• A majority of aid benefitting Hiirshabelle is directed towards two pillars: i) Resilience and ii) Social and Human Development.
• These figures do not capture all aid flows benefitting Hiirshabelle. 2018 disbursements, in particular, are likely underreported, as they were collected in 2017. They are expected to rise in the next round of aid mapping.
Figure 60. Hiirshabelle: Project Disbursements by Pillar, 2016-1825
25 See Box 4 for an explanation on the application of these Pillar categories.
Peace,InclusivePolitics,
Security &Rule of Law*
Effective,Efficient
Instituions
EconomicGrowth Infrastructure
Social &Human
DevelopmentResilience
2016 10.0 2.9 6.3 1.6 20.2 20.52017 8.1 2.9 5.1 1.0 23.6 40.02018 2.6 1.8 3.6 1.4 9.0 13.3
51015202530354045
US$
Mill
ions
2016 2017 2018
Table 17: Reported Aid for Hiirshabelle (actual and planned disbursements)
2016 62.1 2017 81.1 2018 31.9 Total 175.1

47
Figure 61. Hiirshabelle: Peace, Inclusive Politics, Security and Rule of Law
Figure 62. Hiirshabelle: Effective, Efficient Institutions
Figure 63. Hiirshabelle: Economic Growth
Figure 64. Hiirshabelle: Infrastructure
6.5
3.2
0.3
2.84.4
1.01.1 0.6 0.9
5
10
Inclusive Politics Rule of Law Security
US$
Milli
ons
2016 2017 2018
0.3 0.21.1 1.3
0.3 0.2 0.8 1.50.2 0.1
1.55
10
Civil Service Reform /Public Administration
Planning, M&E andStatistics
Public FinancialManagement
State and LocalGovernance
US$
Milli
ons
2016 2017 2018
4.7
1.63.6
1.53.5
0.1
5
10
Private Sector Development Productive Sectors (Agriculture, Fisheries,Livestock)
US$
Milli
ons
2016 2017 2018
1.40.1 0.10.1 0.6 0.30.8 0.6
5
10
Energy and ICT Mixed Infrastructure Transport: Roads,Ports, Airports
Water and Sanitation(Urban)
US$
Milli
ons
2016 2017 2018

48
Figure 65. Hiirshabelle: Social & Human Development
Figure 66. Hiirshabelle: Resilience
6.9
13.2
4.7
16.7
0.4
8.5
5
10
15
20
Education Health
US$
Milli
ons
2016 2017 2018
2.4
5.03.1
5.65.7
3.24.4
21.5
0.1 0.4
7.5
3.95
10
15
20
25
Migration,Displacement,Refugees and
Durable Solutions
NaturalResources
Management
Social Protection Food Security Lifesavinghumanitarian -cross-cutting
US$
Milli
ons
2016 2017 2018

49
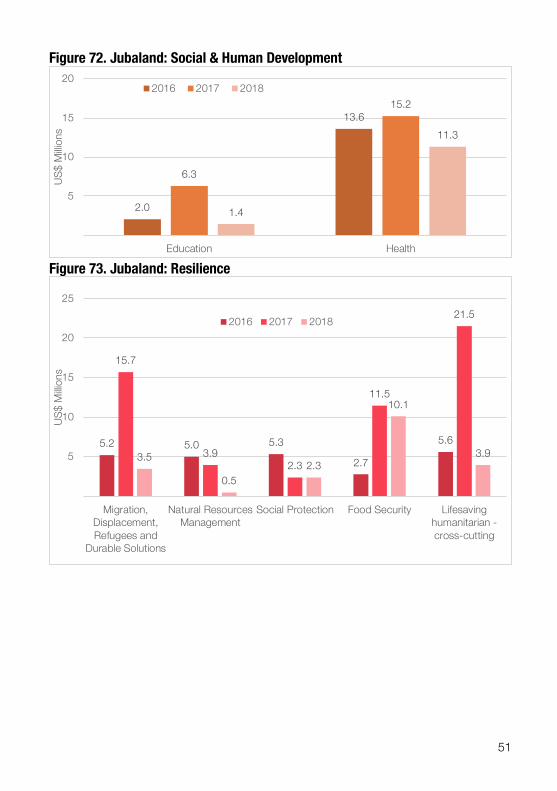
Jubaland Highlights:
• In 2017, Jubaland benefitted from 13% of reported aid, excluding aid unattributed to a specific location (Figure 38).
• The overall volume of aid to Jubaland rose from US$ 93 million in 2016 to US$ 133 million in 2017 (an increase of 43%).
• A majority of aid benefitting Jubaland is directed towards three pillars: i) Resilience; ii) Social and Human Development; and Peace, Inclusive Politics, Security and Rule of Law.
• These figures do not capture all aid flows benefitting Jubaland. 2018 disbursements, in particular, are likely underreported, as they were collected in 2017. They are expected to rise in the next round of aid mapping.
Figure 67. Jubaland: Project Disbursements by Pillar, 2016-1826
26 See Box 4 for an explanation on the application of these Pillar categories.
Peace,InclusivePolitics,
Security &Rule of Law
Effective,Efficient
Instituions
EconomicGrowth Infrastructure
Social &Human
DevelopmentResilience
2016 21.5 12.6 7.6 0.6 15.8 34.22017 21.1 11.7 7.7 2.7 23.9 65.32018 7.8 5.0 2.9 2.5 12.7 21.6
10203040506070
US$
Mill
ions
2016 2017
Table 18: Reported Aid for Jubaland (actual and planned disbursements)
2016 93.0 2017 133.0 2018 52.9 Total 278.9

50
Figure 68. Jubaland: Peace, Inclusive Politics, Security and Rule of Law
Figure 69. Jubaland: Effective, Efficient Institutions
Figure 70. Jubaland: Economic Growth
Figure 71. Jubaland: Infrastructure
15.9
4.21.4
9.4
4.47.2
4.6
0.72.65
10
15
20
Inclusive Politics Rule of Law Security
US$
Milli
ons
2016 2017 2018
0.5 1.9 2.5
7.7
0.7 1.8 2.46.8
0.2 1.7 3.00.2
5
10
15
20
Civil Service Reform /Public Administration
Planning, M&E andStatistics
Public FinancialManagement
State and LocalGovernance
US$
Milli
ons
2016 2017 2018
6.7
0.9
4.82.92.3
0.65
10
15
20
Private Sector Development Productive Sectors (Agriculture, Fisheries,Livestock)
US$
Milli
ons
2016 2017 2018
0.1 0.3 0.10.2 1.7 0.3 0.50.2 0.6 0.8 1.05
10
15
20
Energy and ICT Mixed Infrastructure Transport: Roads,Ports, Airports
Water and Sanitation(Urban)
US$
Milli
ons
2016 2017 2018
51
Figure 72. Jubaland: Social & Human Development
Figure 73. Jubaland: Resilience
2.0
13.6
6.3
15.2
1.4
11.3
5
10
15
20
Education Health
US$
Milli
ons
2016 2017 2018
5.2 5.0 5.3
2.7
5.6
15.7
3.92.3
11.5
21.5
3.5
0.52.3
10.1
3.95
10
15
20
25
Migration,Displacement,Refugees and
Durable Solutions
Natural ResourcesManagement
Social Protection Food Security Lifesavinghumanitarian -cross-cutting
US$
Milli
ons
2016 2017 2018

52
Puntland Highlights:
• In 2017, Puntland benefitted from 14% of reported aid, excluding aid unattributed to a specific location (Figure 38).
• The overall volume of aid to Puntland rose from US$ 93.4 million in 2016 to US$ 146.8 million in 2017 (an increase of 57%)
• A majority of aid benefitting Puntland is directed towards two pillars: i) Resilience and ii) Social and Human Development.
• These figures do not capture all aid flows benefitting Puntland. 2018 disbursements, in particular, are likely underreported, as they were collected in 2017. They are expected to rise in the next round of aid mapping.
Figure 74. Puntland: Project Disbursements by Pillar, 2016-1827
27 See Box 4 for an explanation on the application of these Pillar categories.
Peace,InclusivePolitics,
Security &Rule of Law*
Effective,Efficient
Instituions
EconomicGrowth Infrastructure
Social &Human
DevelopmentResilience
2016 15.3 15.9 8.7 7.9 26.1 16.92017 8.5 16.6 5.8 8.3 42.8 62.22018 3.2 7.3 5.2 4.2 10.7 60.9
10
20
30
40
50
60
70
US$
Mill
ions
2016 2017 2018
Table 19: Reported Aid for Puntland (actual and planned disbursements) 2016 93.4 2017 146.8 2018 92.4 Total 332.6

53
Figure 75. Puntland: Peace, Inclusive Politics, Security and Rule of Law
Figure 76. Puntland: Effective, Efficient Institutions
Figure 77. Puntland: Economic Growth
Figure 78. Puntland: Infrastructure
6.77.9
0.7
4.0 3.3
1.21.80.1
1.3
5
10
Inclusive Politics Rule of Law Security
US$
Milli
ons
2016 2017 2018
1.30.2
5.0
9.4
2.40.4
5.6
8.1
1.40.6
5.35
10
Civil Service Reform /Public Administration
Planning, M&E andStatistics
Public FinancialManagement
State and LocalGovernance
US$
Milli
ons
2016 2017 2018
6.7
2.0
4.7
1.1
3.9
1.3
5
10
Private Sector Development Productive Sectors (Agriculture, Fisheries,Livestock)
US$
Milli
ons
2016 2017 2018
0.2
5.2
1.4 1.10.52.1
4.2
1.60.5 0.8 0.9
2.05
10
Energy and ICT Mixed Infrastructure Transport: Roads,Ports, Airports
Water and Sanitation(Urban)
US$
Milli
ons
2016 2017 2018

54
Figure 79. Puntland: Social & Human Development
Figure 80. Puntland: Resilience
6.4
19.3
7.4
30.0
1.5
9.1
5
10
15
20
25
30
35
Education Health
US$
Milli
ons
2016 2017 2018
2.4 3.40.1
9.88.9 9.6
0.4
41.6
3.0
8.1
49.1
5
10
15
20
25
30
35
40
45
50
Migration,Displacement,Refugees and
Durable Solutions
NaturalResources
Management
Social Protection Food Security Lifesavinghumanitarian -cross-cutting
US$
Milli
ons
2016 2017 2018
55
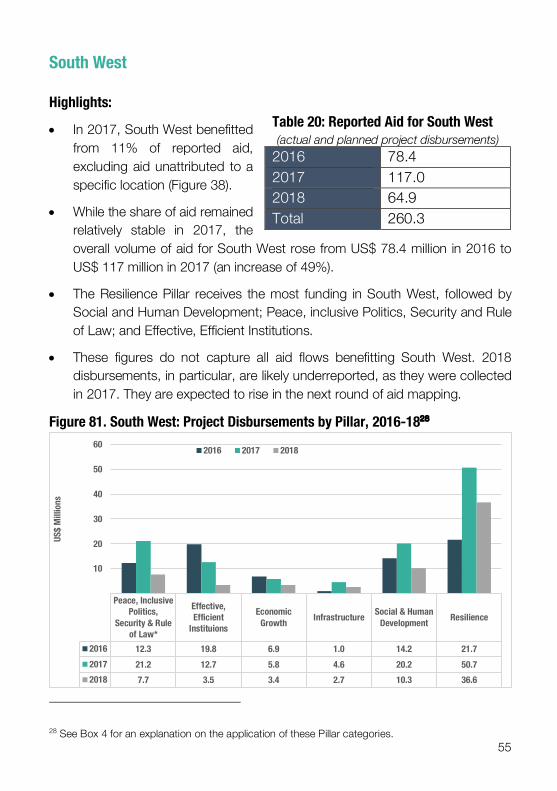
South West Highlights:
• In 2017, South West benefitted from 11% of reported aid, excluding aid unattributed to a specific location (Figure 38).
• While the share of aid remained relatively stable in 2017, the overall volume of aid for South West rose from US$ 78.4 million in 2016 to US$ 117 million in 2017 (an increase of 49%).
• The Resilience Pillar receives the most funding in South West, followed by Social and Human Development; Peace, inclusive Politics, Security and Rule of Law; and Effective, Efficient Institutions.
• These figures do not capture all aid flows benefitting South West. 2018 disbursements, in particular, are likely underreported, as they were collected in 2017. They are expected to rise in the next round of aid mapping.
Figure 81. South West: Project Disbursements by Pillar, 2016-1828
28 See Box 4 for an explanation on the application of these Pillar categories.
Peace, InclusivePolitics,
Security & Ruleof Law*
Effective,Efficient
Instituions
EconomicGrowth Infrastructure Social & Human
Development Resilience
2016 12.3 19.8 6.9 1.0 14.2 21.72017 21.2 12.7 5.8 4.6 20.2 50.72018 7.7 3.5 3.4 2.7 10.3 36.6
10
20
30
40
50
60
US$
Mill
ions
2016 2017 2018
Table 20: Reported Aid for South West (actual and planned project disbursements)
2016 78.4 2017 117.0 2018 64.9 Total 260.3

56
Figure 82. South West: Peace, Inclusive Politics, Security and Rule of Law
Figure 83. South West: Effective, Efficient Institutions
Figure 84. South West: Economic Growth
Figure 85. South West: Infrastructure
7.0
4.0
1.3
9.7
4.57.0
4.7
0.72.3
5
10
15
Inclusive Politics Rule of Law Security
US$
Milli
ons
2016 2017 2018
3.10.9 1.6
14.2
3.51.0 1.3
6.9
0.2 1.3 2.05
10
15
Civil Service Reform /Public Administration
Planning, M&E andStatistics
Public FinancialManagement
State and LocalGovernance
US$
Milli
ons
2016 2017 2018
4.22.83.0 2.83.3
0.1
5
10
15
Private Sector Development Productive Sectors (Agriculture, Fisheries,Livestock)
US$
Milli
ons 2016 2017 2018
0.1 0.8 0.10.2
3.8
0.50.21.5 1.0
5
10
15
Energy and ICT Mixed Infrastructure Transport: Roads,Ports, Airports
Water and Sanitation(Urban)
US$
Milli
ons 2016 2017 2018

57
Figure 86. South West: Social & Human Development
Figure 87. South West: Resilience
2.6
11.4
4.5
13.4
2.1
8.1
5
10
15
Education Health
US$
Milli
ons
2016 2017 2018
2.95.0 5.1
0.7
10.9
4.5
26.0
1.02.7
0.4
28.2
5
10
15
20
25
30
Migration,Displacement,Refugees and
Durable Solutions
NaturalResources
Management
Social Protection Food Security Lifesavinghumanitarian -cross-cutting
US$
Milli
ons
2016 2017 2018

58
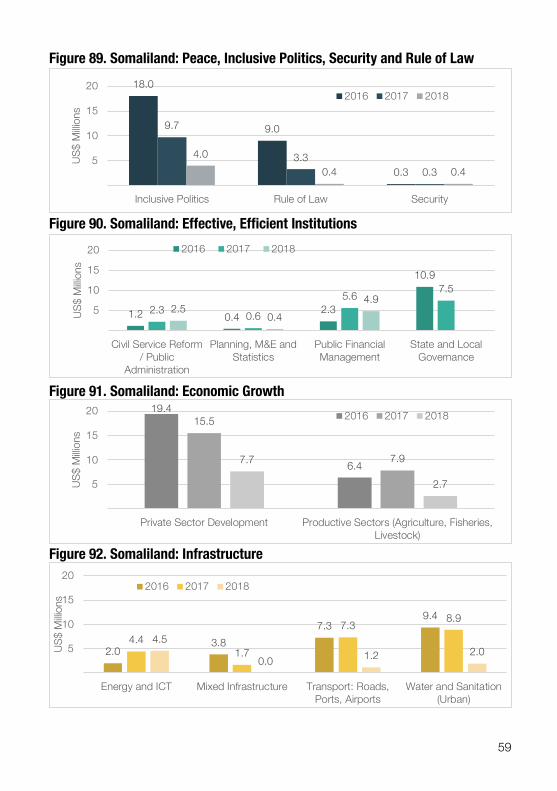
Somaliland Highlights:
• In 2017, Somaliland benefitted from 19% of reported aid, excluding aid unattributed to a specific location (Figure 38).
• While the share of aid to Somaliland fell by 1% point, the overall volume of aid rose from US$ 153.9 million in 2016 to US$ 192.1 million in 2017 (an increase of 25%).
• Half of aid to Somaliland is directed towards resilience (32%) and social and human development (22%). A breakdown of the aid flows for each pillar is provided in the figures on the following pages.
• These figures do not capture all aid flows benefitting Somaliland 2018 disbursements, in particular, are likely underreported, as they were collected in 2017. They are expected to rise in the next round of aid mapping.
Figure 88. Somaliland: Project Disbursements by Pillar, 2016-1829
29 See Box 4 for an explanation on the application of these Pillar categories.
Peace,InclusivePolitics,
Security &Rule of Law*
Effective,Efficient
Instituions
EconomicGrowth Infrastructure
Social &Human
DevelopmentResilience
2016 27.3 14.8 25.8 22.5 37.2 21.72017 13.3 16.0 23.4 22.3 47.5 66.52018 4.7 7.7 10.4 7.6 10.1 54.1
10
20
30
40
50
60
70
US$
Mill
ions
2016 2017 2018
Table 21: Reported Aid for Somaliland (actual and planned project disbursements) 2016 153.9 2017 192.1 2018 95.9 Total 441.8
59
Figure 89. Somaliland: Peace, Inclusive Politics, Security and Rule of Law
Figure 90. Somaliland: Effective, Efficient Institutions
Figure 91. Somaliland: Economic Growth
Figure 92. Somaliland: Infrastructure
18.0
9.0
0.3
9.7
3.30.3
4.00.4 0.4
5
10
15
20
Inclusive Politics Rule of Law Security
US$
Milli
ons
2016 2017 2018
1.2 0.42.3
10.9
2.3 0.6
5.6 7.5
2.50.4
4.95
10
15
20
Civil Service Reform/ Public
Administration
Planning, M&E andStatistics
Public FinancialManagement
State and LocalGovernance
US$
Milli
ons
2016 2017 2018
19.4
6.4
15.5
7.97.7
2.75
10
15
20
Private Sector Development Productive Sectors (Agriculture, Fisheries,Livestock)
US$
Milli
ons
2016 2017 2018
2.03.8
7.39.4
4.41.7
7.3 8.9
4.5
0.0 1.2 2.05
10
15
20
Energy and ICT Mixed Infrastructure Transport: Roads,Ports, Airports
Water and Sanitation(Urban)
US$
Milli
ons
2016 2017 2018

60
Figure 93. Somaliland: Social & Human Development
Figure 94. Somaliland: Resilience
12.3
24.5
11.2
31.7
0.6
9.5
5
10
15
20
25
30
35
Education Health
US$
Milli
ons
2016 2017 2018
0.2
9.4
0.1
8.5
4.7
19.1
0.3
36.0
0.6
7.7
42.1
5
10
15
20
25
30
35
40
45
Migration,Displacement,Refugees and
Durable Solutions
NaturalResources
Management
Social Protection Food Security Lifesavinghumanitarian -cross-cutting
US$
Milli
ons
2016 2017 2018

61
8 Cross-cutting Markers Partners reported on cross-cutting issues using markers designating the extent to which issues are relevant to their reported projects. Partners used the following categories to designate the significance of a marker’s issue.
• Principal: The marker’s issue is the primary purpose of the project.
• Significant: The marker’s issue is an important aspect of the project but does not represent its primary purpose.
• Not Targeted / Not Screened: The marker’s theme is not a significant aspect of the project or the field was left blank by the reporting agency.
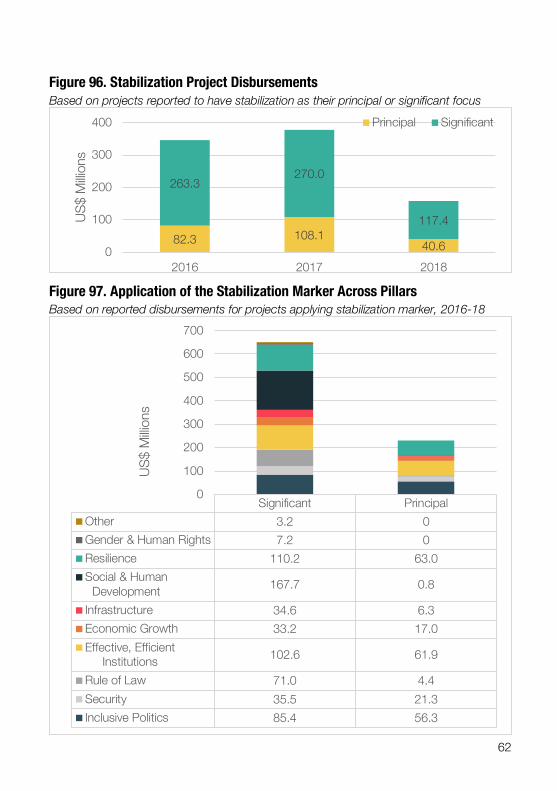
Stabilization Marker30 • Stabilization was reported to be a
significant component of 20% of project financing and the principal purpose of 8% of financing in 2017.
• The share of aid with a stabilization component appears to decrease in 2017 and 2018; however, this could be due to increased reporting of humanitarian projects in this period.
• Total financing for projects with a stabilization component increased in 2017 relative to 2016.
• 2018 disbursements are likely underreported, as they were collected in 2017. They are expected to rise in the next round of aid mapping.
30 The interpretation of stabilization as a concept was left to the discretion of the reporting agencies. Different definitions and criteria were likely applied for this marker’s application. For the next round of aid mapping, the Stabilization Working Group will be asked to provide a set of criteria to guide partners when reporting against this marker.
Figure 95. Share of Project Disbursements Targeting Stabilization
10% 8% 6%
31%20% 18%
59%72% 76%
0%
20%
40%
60%
80%
100%
2016 2017 2018
Not Targeted / Not ScreenedSignificantPrincipal
62
Figure 96. Stabilization Project Disbursements Based on projects reported to have stabilization as their principal or significant focus
Figure 97. Application of the Stabilization Marker Across Pillars Based on reported disbursements for projects applying stabilization marker, 2016-18
82.3 108.140.6
263.3270.0
117.4
0
100
200
300
400
2016 2017 2018
US$
Milli
ons
Principal Significant
Significant PrincipalOther 3.2 0Gender & Human Rights 7.2 0Resilience 110.2 63.0Social & Human
Development 167.7 0.8
Infrastructure 34.6 6.3Economic Growth 33.2 17.0Effective, Efficient
Institutions 102.6 61.9
Rule of Law 71.0 4.4Security 35.5 21.3Inclusive Politics 85.4 56.3
0
100
200
300
400
500
600
700
US$
Milli
ons

63
Gender Marker • Gender was reported to be a
significant component of 77% of project financing in 2017.
• The share of project disbursements with a significant gender component increased between 2016-2018. However, the share of disbursements targeting gender as the principal purpose for programming fell over the same period.
• More than half of financing disbursed for projects with significant gender components was reported under the Resilience Pillar.
• 2018 disbursements are likely underreported, as they were collected in 2017. They are expected to rise in the next round of aid mapping.
Figure 99. Gender: Project Disbursements Based on projects reported to have gender as their principal or significant focus
73.7 54.2 12.5
574.9
1027.7
533.4
0
200
400
600
800
1000
1200
2016 2017 2018
US$
Milli
ons
Principal
Significant
9% 4% 2%
68% 77% 81%
24% 19% 17%
0%
20%
40%
60%
80%
100%
2016 2017 2018Not Targeted / Not ScreenedSignificantPrincipal
Figure 98. Share of Project Disbursements Targeting Gender

64
Figure 100. Application of the Gender Marker Across Pillars Based on reported disbursements for projects applying the gender marker, 2016-18
Significant PrincipalOther 10.1Gender & Human Rights 5.0 31.1Resilience 1112.6 18.2Social & Human Development 419.3 34.9Infrastructure 57.2 2.6Economic Growth 141.7 4.5Effective, Efficient Institutions 195.0 15.0Rule of Law 25.0 21.0Security 30.5Inclusive Politics 139.5 13.3
0
200
400
600
800
1000
1200
1400
1600
1800
2000
2200
US$
Milli
ons

65
Capacity Development Marker • Capacity development was
reported to be a significant component of 53% of project financing in 2017.
• 12% of project financing was reported for dedicated capacity development projects in 2017 and 2018.
• Half of financing for dedicated capacity development projects was reported under the Effective, Efficient Institutions Pillar.
• 2018 disbursements are likely underreported, as they were collected in 2017. They are expected to rise in the next round of aid mapping.
Figure 102. Capacity Development Project Disbursements Based on projects reported to have capacity development as principal or significant focus
147.5 162.2 81.1
529.8711.0
402.6
0
200
400
600
800
1000
2016 2017 2018
US$
Milli
ons
Principal Significant
Figure 101. Share of Project Disbursements Targeting Capacity
17% 12% 12%
62%53% 61%
20%35% 26%
0%
20%
40%
60%
80%
100%
2016 2017 2018
Not Targeted / Not Screened
Significant
Principal

66
Figure 103. Application of the Capacity Development Marker Across Pillars Based on reported disbursements for projects applying the capacity development marker, 2016-18
Significant PrincipalOther 12.4Gender & Human Rights 23.5 7.1Resilience 591.1 71.0Social & Human
Development 429.8 38.8
Infrastructure 91.0 16.6Economic Growth 133.7 29.9Effective, Efficient
Institutions 122.1 196.1
Rule of Law 71.1 13.6Security 21.8 5.4Inclusive Politics 146.9 12.2
0
200
400
600
800
1000
1200
1400
1600
1800
US$
Milli
ons

67
Durable Solutions Marker • Durable solutions were reported
to be a significant component of 4% of project financing and the principal purpose of 5% of financing in 2017.
• Although the share of aid remained stable, total financing for projects with a durable solutions component increased in 2017 relative to 2016.
• 2018 disbursements are likely underreported, as they were collected in 2017. They are expected to rise in the next round of aid mapping.
Figure 105. Durable Solutions Project Disbursements Based on projects reported to have durable solutions as their principal or significant focus
23.1
63.831.8
61.8
59.9
36.0
0
50
100
150
2016 2017 2018
US$
Milli
ons
Principal Significant
Figure 104. Share of Project Disbursements Targeting Durable Solutions
3% 5% 5%7% 4% 5%
90% 91% 90%
0%
20%
40%
60%
80%
100%
2016 2017 2018
Not Targeted / Not Screened
SignificantPrincipal

68
Figure 106. Application of the Durable Solutions Marker Across Pillars Based on reported disbursements for projects applying durable solutions marker, 2016-18
Significant PrincipalOther 0 0Gender & Human Rights 0.8 2.2Resilience 48.5 106.2Social & Human
Development 25.6 0
Infrastructure 10.0 0Economic Growth 31.7 6.2Effective, Efficient
Institutions 39.4 0
Rule of Law 0.4 0.2Security 0 0.4Inclusive Politics 1.2 3.6
0
20
40
60
80
100
120
140
160
180
US$
Milli
ons

69
Annex A. Acronyms & Abbreviations ACU Aid Coordination Unit AfDB African Development Bank FAO Food and Agriculture Organization of the United Nations FDI Foreign Direct Investment FGS Federal Government of Somalia FTS Financial Tracking Service (Managed by OCHA) GDP Gross Domestic Product ILO International Labour Organization IMF International Monetary Fund IOM International Organization for Migration MoF Ministry of Finance MoPIED Ministry of Planning, Investment, and Economic Development MPF Multi Partner Fund for Somalia (World Bank administered) MPTF Multi Partner Trust Fund for Somalia (UN Administered) ODA Official Development Assistance OECD Organisation for Economic Co-operation and Development PFM Public Financial Management SDRF Somalia Development and Reconstruction Facility SIF Somali Infrastructure Fund (AfDB administered) SFF Special Financing Facility SPF WB State- and Peace-building Fund SSF Somalia Stability Fund UN Women United Nations Organization for Gender Equality and the Empowerment
of Women UN-Habitat United Nations Human Settlements Programme UNAIDS Joint United Nations Programme on HIV and AIDS UNDP United Nations Development Programme UNESCO United Nations Educational, Scientific and Cultural Organization UNFPA United Nations Population Fund UNHCR United Nations Refugee Agency UNICEF United Nations Children’s Fund UNMAS United Nations Mine Action Service UNODC United Nations Office on Drugs and Crime UNOPS United Nations Office for Project Services UNSOM United Nations Assistance Mission in Somalia WFP WHO
World Food Programme World Health Organization

70
Annex B. Key Terms & Concepts CAPACITY DEVELOPMENT: UNDP defines capacity development as the process through which individuals, organizations and societies obtain, strengthen and maintain the capabilities to set and achieve their own development objectives over time.
DURABLE SOLUTIONS INITIATIVE: Since 2016, the government-led and community focused “Durable Solutions Initiative” (DSI), developed in collaboration with the UN, the World Bank, NGOs and the donor community, provides a collective framework to address issues around displacement and voluntary returns and for harmonizing durable solutions approaches and programming in Somalia.
HUMANITARIAN ASSISTANCE: “Aid and action designed to save lives, alleviate suffering and maintain and protect human dignity during and in the aftermath of emergencies.”31
OFFICIAL DEVELOPMENT ASSISTANCE (ODA): “Flows of official financing administered with the promotion of the economic development and welfare of developing countries as the main objective.”32 Humanitarian assistance is considered a sector of ODA.
ON TREASURY: Aid disbursed into the government’s main revenue funds and managed through the government’s systems.
RESILIENCE: “The capacity of a system, community or society potentially exposed to hazards to resist, adapt, and recover from hazard events, and to restore an acceptable level of functioning and structure.”33 Assistance supporting resilience bridges humanitarian and development fields of work.
31 Global Humanitarian Assistance Initiative, http://bit.ly/2C0Ilng. 32 OECD Glossary of Statistical Terms. 33 ReliefWeb Glossary of Humanitarian Terms, www.who.int/hac/about/reliefweb-aug2008.pdf.

Analysis of aid flow data
March 2018
Aid Flows in Somalia
Developed with the support of the World Bank and United Nations
Ministry of Planning, Investment and Economic DevelopmentFederal Republic of Somalia
www.somaliaaidflows.so