agrometeorological monitoring and forecasts for pest … · and forecasts for pest and ... italy...
TRANSCRIPT

AgrometeorologicalAgrometeorological Monitoring Monitoring and Forecasts for Pest and and Forecasts for Pest and
Disease ControlDisease ControlSimone Orlandini
Department of Plant, Soil and Environmental Science
University of Florence
International Workshop on Addressing the Livelihood Crisis of FarmersBelo Horizonte, Brazil, 12-14 July 2010

OutlineOutline
o Background
o Input data
o Models for crop protection
o Use and application
o Dissemination of information

OutlineOutline
o Background
o Input data
o Models for crop protection
o Use and application
o Dissemination of information

BackgroundBackgroundWidening of biological
knowledge

BackgroundBackgroundDevelopment of
computer science and telecommuncations
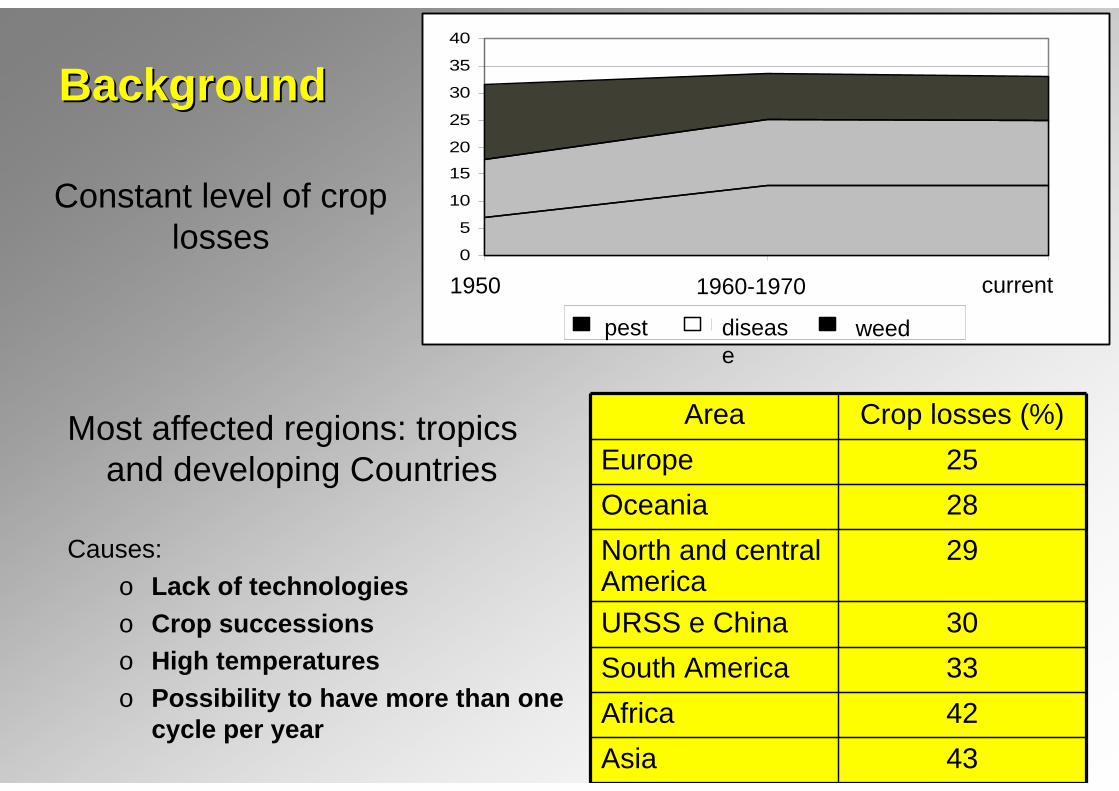
Most affected regions: tropics and developing Countries
Causes:o Lack of technologieso Crop successionso High temperatureso Possibility to have more than one
cycle per year
Area Crop losses (%)Europe 25Oceania 28North and central America
29
URSS e China 30South America 33Africa 42Asia 43
BackgroundBackground
Constant level of crop losses
0
5
10
15
20
25
30
35
40
anni 50 anni 60-70 oggi
insetti malattie infestantipest disease
weed
1960-19701950 current
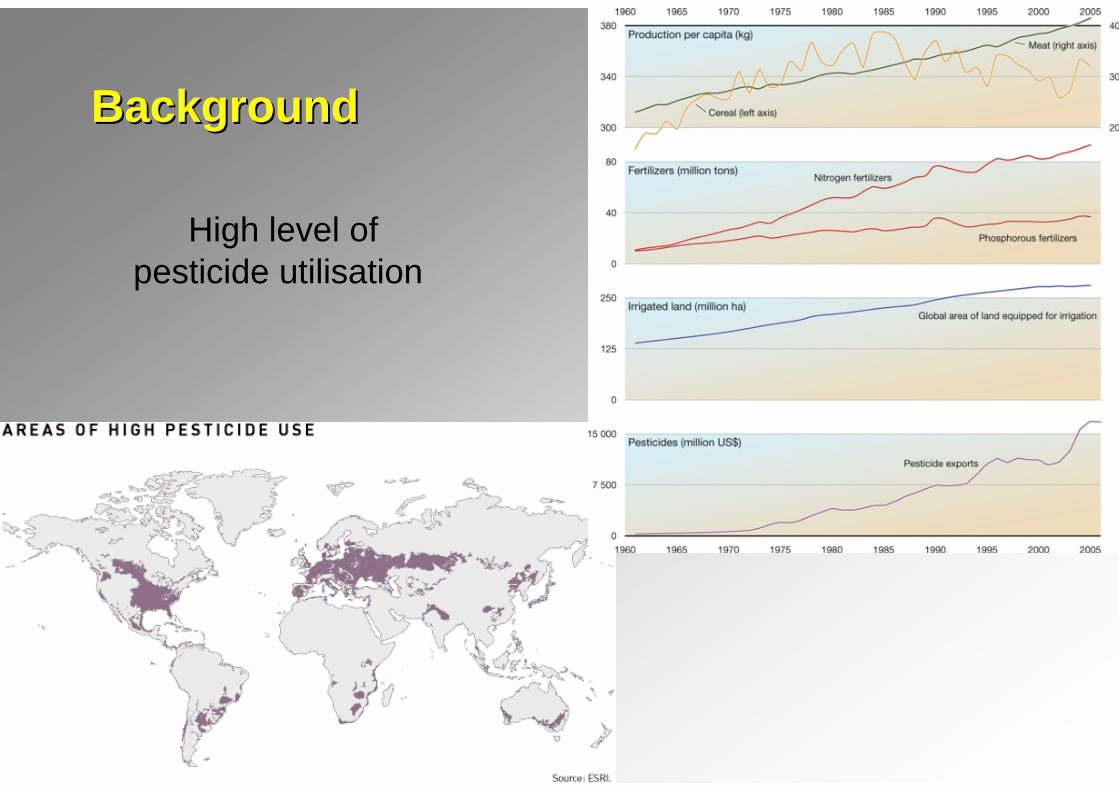
High level of pesticide utilisation
BackgroundBackground
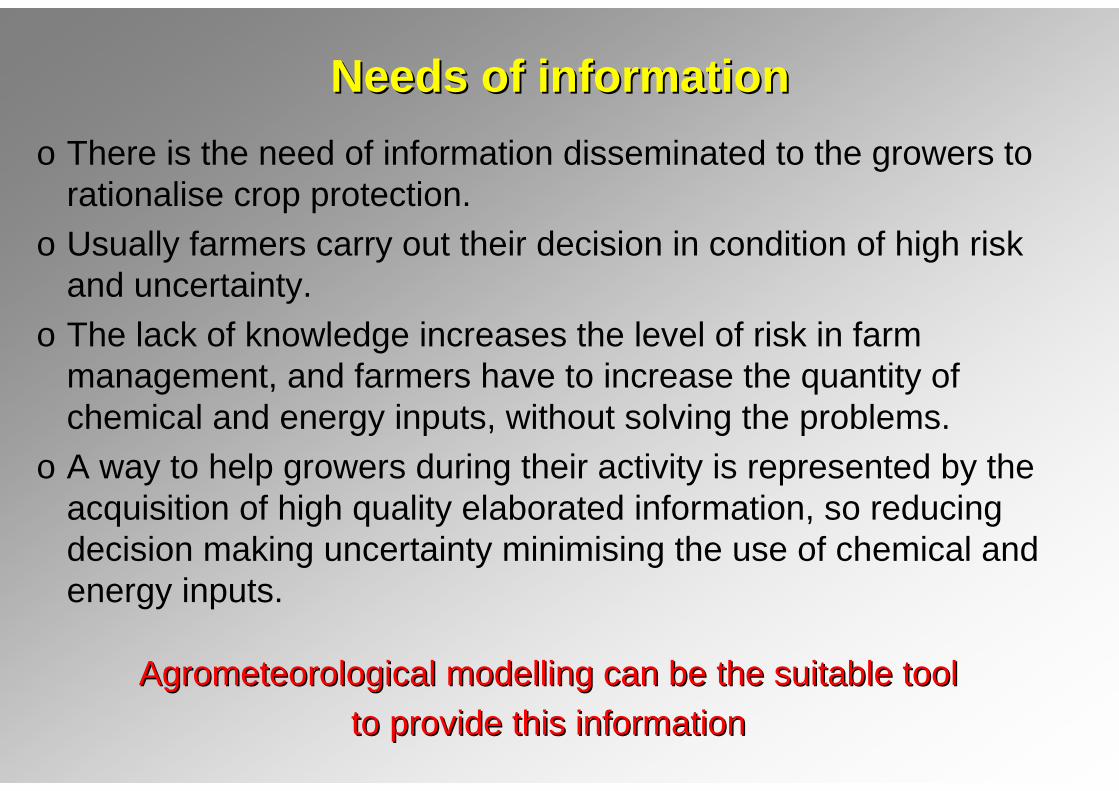
NeedsNeeds of informationof informationo There is the need of information disseminated to the growers to
rationalise crop protection.o Usually farmers carry out their decision in condition of high risk
and uncertainty.o The lack of knowledge increases the level of risk in farm
management, and farmers have to increase the quantity of chemical and energy inputs, without solving the problems.
o A way to help growers during their activity is represented by the acquisition of high quality elaborated information, so reducing decision making uncertainty minimising the use of chemical and energy inputs.
AgrometeorologicalAgrometeorological modelling can be the suitable tool modelling can be the suitable tool to provide this informationto provide this information

OutlineOutline
o Background
o Input data
o Models for crop protection
o Use and application
o Dissemination of information
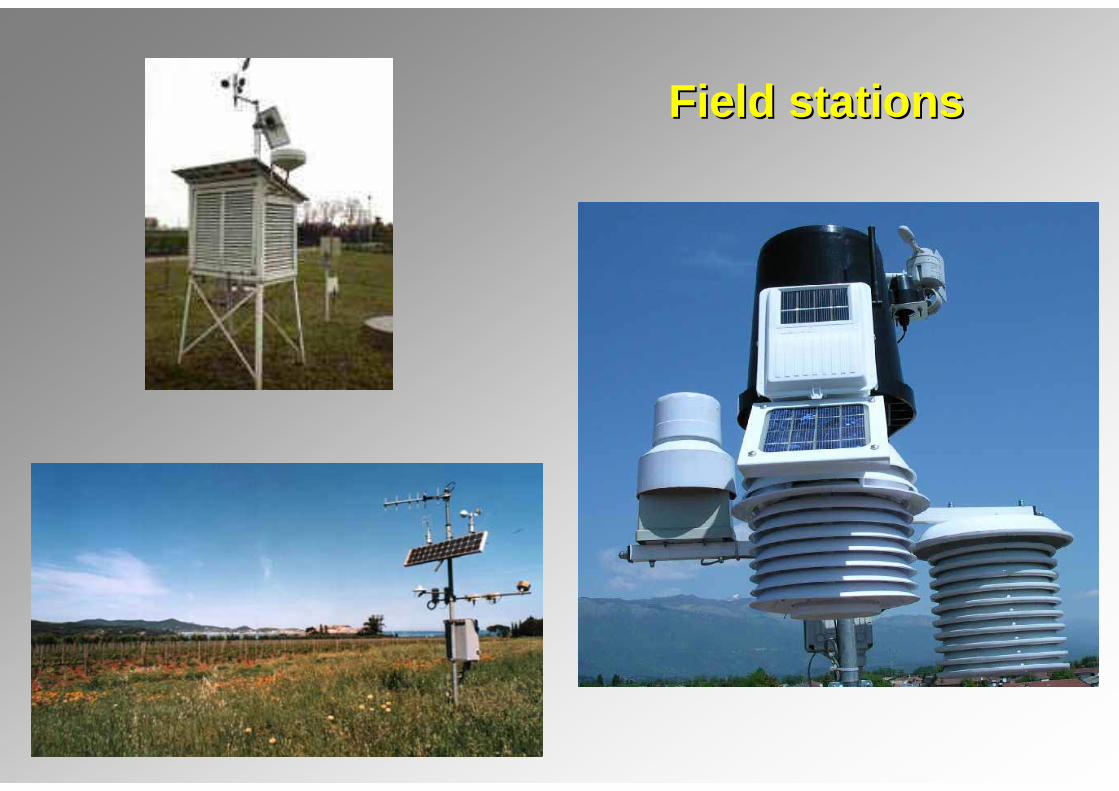
Field stationsField stations

Leaf Leaf wetness wetness sensorssensors

Remote sensing Remote sensing –– input datainput data
maps of downy mildew maps of downy mildew infectioninfection
1.00E+001.00E+011.00E+021.00E+031.00E+041.00E+05
1.00E+061.00E+071.00E+081.00E+091.00E+10
06.0
5.11
.05.
16.0
5.
21.0
5.26
.05.
31.0
5.05
.06.
10.0
6.15
.06.
20.0
6.25
.06.
30.0
6.
05.0
7.10
.07.
15.0
7.
measured LW
dropben LW
sweb LW
control LW
Radar (RAINFALL)
Epidemiological model
Ground stations
LWD model

Remote sensing Remote sensing –– identification of symptoms identification of symptoms on crop canopies using on crop canopies using multispectralmultispectral imagesimages

Numerical weather Numerical weather modelsmodels

Seasonal forecastSeasonal forecast

GISGIS
Map of number of days for the outbreak of the current infection
Number of generation of Bactrocera oleae

Simulated impacts Simulated impacts of leafof leaf--damaging damaging
pest infestation on pest infestation on maize yield at maize yield at
regional scale (30regional scale (30--arcminute grids in arcminute grids in
Tanzania). Leaf Tanzania). Leaf damages was damages was implemented implemented
through a leaf area through a leaf area coupling point in coupling point in the the DSSAT model DSSAT model
www.regional.org.au
Crop modelsCrop models

OutlineOutline
o Background
o Input data
o Models for crop protection
o Use and application
o Dissemination of information

Mechanistic Mechanistic EmpiricalEmpirical
http://www.ipm.ucdavis.edu
Cornell University in Geneva, New York
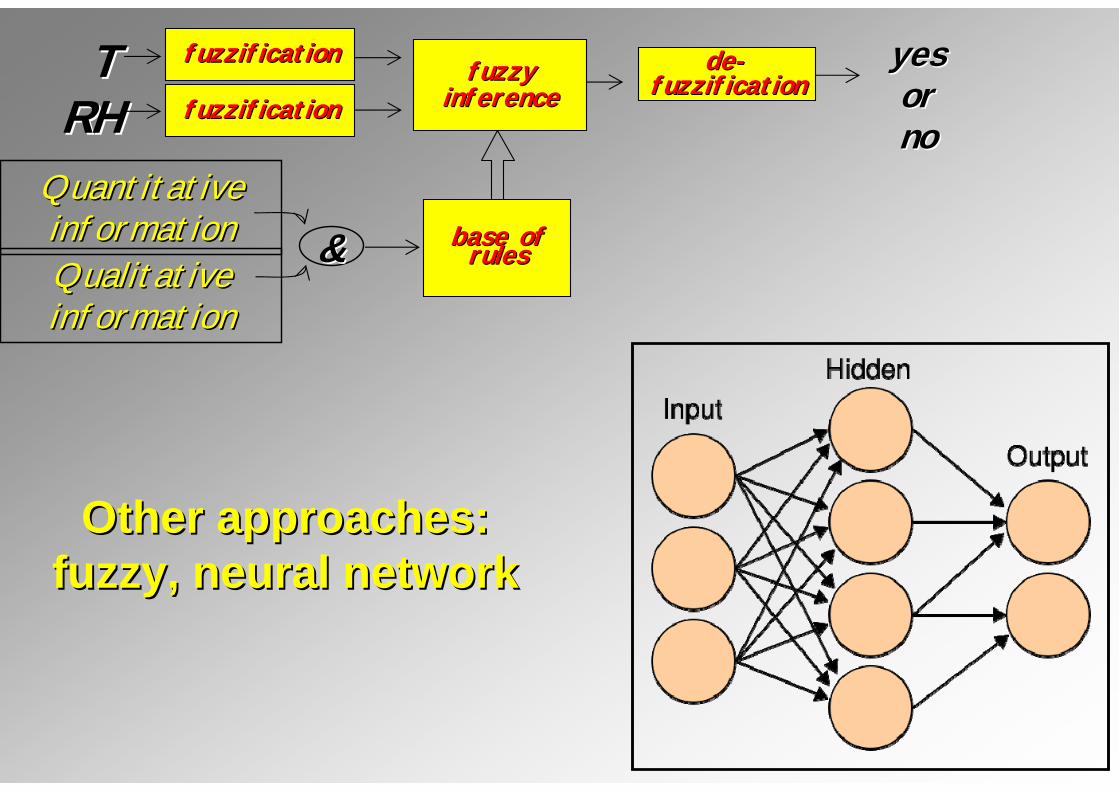
Other approaches: Other approaches: fuzzy, neural networkfuzzy, neural network
fuzzy fuzzy inferenceinference
dede--fuzzificationfuzzification
yes yes or or nono
TTRHRH
fuzzificationfuzzification
fuzzificationfuzzification
base of base of rulesrules
Quantitative Quantitative informationinformationQualitative Qualitative informationinformation
&&

R. D. Magarey, T. B. Sutton, and C. L. ThayerDepartment of Plant Pathology, North Carolina State University, Raleigh 27696..

Main modelsMain models
Coltura Malat. Mod.ABETE 3 3AGRUMI 1 1AVENA 2 2AVOCADO 1 1BANANA 2 4BARBABIET. 2 2BEGONIA 1 1CACAO 1 1CAFFÈ 1 1CANNA ZUC. 1 1CAROTA 2 2CASTAGNO 1 1CAUCCIÙ’ 2 3CAVOLO 2 3CEREALI 4 6CILIEGIO 2 2CIPOLLA 2 2COCOMERO 1 1COTICO ERB. 1 1COTONE 3 4CRESCIONE 1 1DUGLASIA 1 1FAGIOLO 4 4FRAGOLA 4 5GINEPRO 1 1GIRASOLE 2 2WHEAT 10 58LUPPOLO 1 3
Coltura Malat. Mod.MAIS 4 4MANDORLO 1 1MANGO 1 1MEDICA 2 3APPLE 4 18MELONE 1 1PEANUT 5 13NOCCIOLO 1 1OLMO 1 1BARLEY 5 13POTATO 4 21PESCO 1 1PINO 4 4PIOPPO 3 3PISELLO 1 1POMODORO 4 6QUERCIA 1 1RAPA 2 4RICE 4 17SEDANO 1 1SEGALE 1 1SOIA 5 9SORGO 7 7SPINACI 1 1SUSINO 1 1TABACCO 2 2TRIFOGLIO 1 1GRAPEVINE 4 17

Source: Erick D. DeWolf and Scott A. Isard, 2007. Disease Cycle Approach to Plant Disease PredictionAnnu. Rev. Phytopathol. 2007. 45:203–20

Year of formulationYear of formulation

ContinentContinent
0
10
20
30
40
50Eu
r.
Asia
Afr
ica
S. A
m.
N. A
m.
Oce
ania

Input example: Input example: PlasmoparaPlasmopara viticolaviticolasimulation modelssimulation models
Type Model Temp. Precip. RH LWDGoidanich G GRule of 3 10 G GDM CAST O O O OEPI Winter M 10 G
Empirical EPI Summer G 3 O dPOM GPCOP G GDyonis G 3 O dMILVIT 3 O 3 OVINEMILD O O O
O d O d O dMechanistic 15 MI n 15 MI n 15 MI n
Freiburg O O O OPLASMO O O O O
Rules
PRO O

Output example: Output example: PlasmoparaPlasmopara
viticolaviticolasimulation simulation
modelsmodels
Model OutputGoidanich SINGLE INFORMATIONReg. 3 10dm CAST INFECTION POTENTIALEPI Inv.EPI Est.POMPCOPDyonisMILVIT SPECIFIC BIOLOGICAL ANDVinemild EPIDEMIOLOGICAL DATAPROFreiburgPLASMODM sim.

Example of variables included into different kinds of modelsExample of variables included into different kinds of models
L. M. Contreras-Medina, I. Torres-Pacheco, R. G. Guevara-González, R. J. Romero-Troncoso, I. R. Terol-Villalobos, R. A. Osornio-Rios, 2009. Mathematical modeling tendencies in plant pathology. African Journal of Biotechnology Vol. 8 (25), pp. 7399-7408

OutlineOutline
o Background
o Input data
o Models for crop protection
o Use and application
o Dissemination of information

Condition of applicationCondition of application
o Climatic classification
o Future climatic scenario for climate change and variability analysis
o Field monitoring and forecast for crop protection

Climatic Climatic classificationclassification

Potato late blight riskPotato late blight risk
Climatic risk for potato late blight in the Andes region of Venezuela (Beatriz Ibet Lozada Garcia; Paulo Cesar Sentelhas; Luciano Roberto Tapia; Gerd Sparovek, 2008)

Predicted severity of phoma stem Predicted severity of phoma stem canker (L. maculans) at harvest canker (L. maculans) at harvest (Sc) on winter oilseed rape crops.(Sc) on winter oilseed rape crops.
a)1960-1990
d) 2050 LO
c)2020 HI
b)2020 LO
e) 2050 HI
Zhou et al. 1999)
Climate change Climate change impactimpact


Probable number of Probable number of generations of leaf generations of leaf miner (Leucoptera miner (Leucoptera coffeella) on coffee coffeella) on coffee
plant in Brazilplant in Brazil
Source: Ghini R. et al., 2008. Risk analysis of climate change on coffee nematodes and leaf miner in Brazil. Pesq. agropec. bras. vol.43 n.2.

To treatTo treat
Not to treatNot to treat
Field monitoring and forecast for crop Field monitoring and forecast for crop protectionprotection

Information utilisation Information utilisation
For using information obtained by models or by decision making systems in order to define the field treatment epochs, different aspects have to be highlighted
Necessary to treat when• the pathogen is present• the crop is susceptible• the treatment is efficaciousTo avoid treatments• in advance, for losses of efficacy due to the product degradation and to the
growth of plants• late, for losses of efficacy due to a too developed infective processFactors to consider• character of the farmer• need to have all the information concerning the disease and the crop• position of the threshold of action and damage• application with strategic or tactical aims


State Disease Crop Pathogen Benefit
UK Stem canker, light leaf spot
oil rape Leptosphaeria maculans
Pyrenopeziza brassicae
increase average yields by up to 0.5 t/ha (equivalent to £75/ha or £15 million/annum if benefits occur on 200,000ha)
1
Virginia (USA)
leaf spot peanut growers
Cercospora arachidicola 1987‐1990: input costs reduced by 33% or $57 per ha
1990‐1995: input costs reduced by 43% or $66 per ha
2
Italy Grapevine downy mildew
grapevine Plasmopara viticola The threshold for an economical convenience in the adoption of the agrometeorological system is about 6 ha.
3
Florida Brown spot citrus Alternaria alternata 4
1. Dr Peter Gladders, ADAS Boxworth, Cambridge. LK0944: Validation of disease models in PASSWORD integrated decision support for pests and diseases in oilseed rape. HGCA conference 2004: Managing soil and roots for profitable production
2. Phipps PM, Deck SH,Walker DR. 1997.Weather-based crop and disease advisories for peanuts in Virginia. Plant Dis. 81:236–443. L. Massetti, A. Dalla Marta and S. Orlandini, Preliminary economic evaluation of an agrometeorological system for Plasmopara viticola infections management.4. Alka Bhatia, P. D. Roberts, L. W. Timmer, 2003. Evaluation of the Alter-Rater Model for Timing of Fungicide Applications for Control of Alternaria Brown Spot of
Citrus. Plant Disease / September 2003.
Model application economic benefitsModel application economic benefits

Costs and benefits of Costs and benefits of AlterAlter--Rater Model Rater Model

Benefits from the Benefits from the IPM impact IPM impact
studiesstudies
Economic Impacts of Integrated Pest Management in Developing Countries:Evidence from the IPM CRSPTatjana HristovskaThesis submitted to the faculty of the Virginia Polytechnic Institute and State University, 2009

Other benefitsOther benefits
reduction of chemical inputs in the ecosystemsoil fertility conservationsmaller amount of chemical residuals in food work quality improvementreduction in the development of resistant formssafeguarding of natural predatoryreduction of new diseases

ImplementationImplementation of the modelof the modelTables for manual calculationsSimplicity of application, difficulty to obtain information for an
efficacious useElectronic plant stationsCollocation in field, complete automation, imprecise results,
frequent damagesComputerRapidity of intervention (tactic), possibility to analyse past
conditions, possible simulation with future scenarios (strategic), automatic collection of data, use for different aims, precision of results

Manual calculation: Mills table (apple scab)Manual calculation: Mills table (apple scab)LEAF WETNESS HOURS
Temperature Light Medium Severe8 18 23 349 15.5 20.5 30
10 12.5 19 2811 11.5 17 2612 10.5 16 2413 10 14 22.514 9.5 13 2115 9 12.5 2016 9 12.5 1917 9 12.5 1818 9 12.5 1819 9 12.5 1820 9 12.5 1821 9 12.5 1822 9 12.5 1823 9 12.5 1824 9.5 12.5 1925 10.5 14 21

Electronic Electronic plant plant
stationstation

Personal computer and Personal computer and network of network of
meteorological sensors meteorological sensors and stationsand stations

OutlineOutline
o Background
o Input data
o Models for crop protection
o Use and application
o Dissemination of information

Conditions of applicationConditions of application
Farm: in this case the model is applied directly by farmers, with evident benefits in the evaluation of real epidemiological condition and microclimate evaluation. On the other hand, the management of the simulations and the updating of the systems represent big obstacles.
Territory: it is probably preferable because it allows a better management and updating of the system. This solution requires the application of suitable methods for the information dissemination among the users.

Information dissemination: the bulletinsInformation dissemination: the bulletins
o Advises and information to the users can be disseminated by using: personal contact, newspaper and magazines, radio and television, videotel, televideo, telefax, mail, phone, INTERNET, SMS.
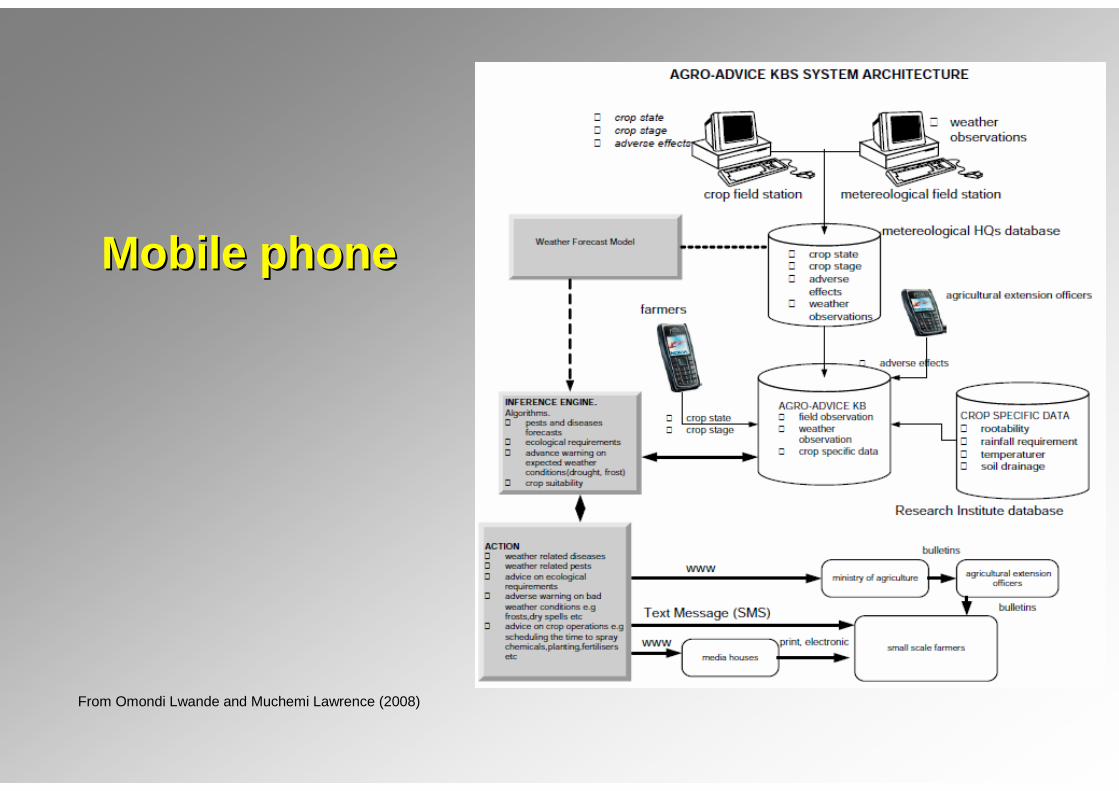
Mobile phone Mobile phone
From Omondi Lwande and Muchemi Lawrence (2008)

Powdery mildew Powdery mildew riskrisk
http://www.apsnet.org/online/feature/pmildew/

Veneto (Italy) Veneto (Italy) –– infection rainfall mapinfection rainfall map
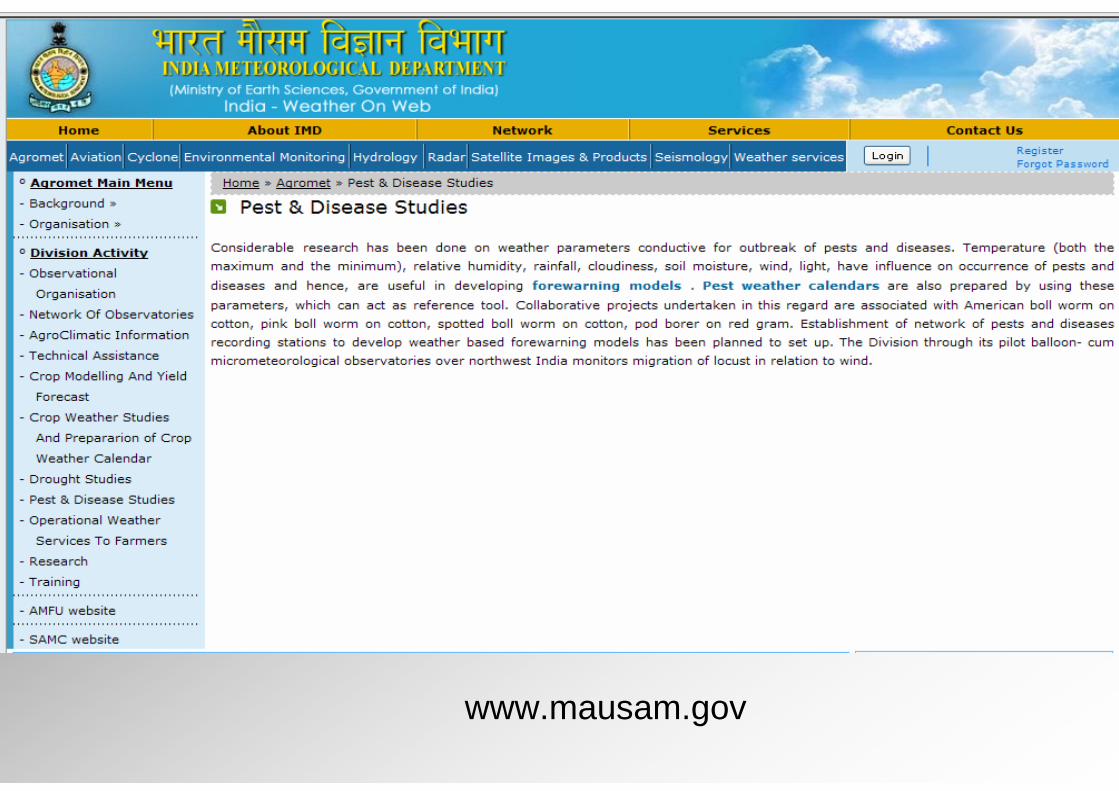
www.mausam.gov

In Florida AgroClimate.org provides a set of tools to help producers reduce risks associated with climate variability.
In particular, the Strawberry Diseases Tool can help you with recommendations for timing fungicide applications for Anthracnose and Botrytis fruit rot.

Maps of light leaf spot forecast Maps of light leaf spot forecast http://www.rothamsted.bbsrc.ac.ukhttp://www.rothamsted.bbsrc.ac.uk

Lupin bean yellow mosaic virus Lupin bean yellow mosaic virus (BYMV) Forecast(BYMV) Forecast

www.syngenta-crop.co.uk/brassica-alert.aspx
Syngenta Crop Syngenta Crop Protection UK LtdProtection UK Ltd
Growers and agronomists already registered on the Syngenta website will automatically have free access to Brassica Alert
AgrometeorologicalAgrometeorological Monitoring Monitoring and Forecasts for Pest and and Forecasts for Pest and
Disease ControlDisease Control
Simone OrlandiniDepartment of Plant, Soil and Environmental Science
University of FlorenceInternational Workshop on Addressing the Livelihood Crisis of Farmers
Belo Horizonte, Brazil, 12-14 July 2010
Thank you for your attention!!!Thank you for your attention!!!