agroforestry: an attractive redd+ policy...
TRANSCRIPT
worldagroforestry.org unep-wcmc.org un-redd.org teebweb.org
Agroforestry: an attractive REDD+ policy option?
AGROFORESTRY – TEEBAGRIFOOD
[Exploratory Study]

2
Agroforestry: an attractive REDD+ policy option?
Authors ICRAF: Sara Namirembe, Scott McFatridge, Lalisa Duguma, Florence Bernard, Peter Minag UNEP WCMC: Marieke Sassen, Arnout van Soersbergen, Eyerusalem Akalu Edited by: Salman Hussain (UNEP TEEB), Kavita Sharma (UNEP TEEB) and Ivo Mulder (UNEP) Disclaimer The contents of this report do not necessarily reflect the views or policies of UNEP, contributory organisations or editors. The designations employed and the presentations of material in this report do not imply the expression of any opinion whatsoever on the part of UNEP or contributory organisations, editors or publishers concerning the mention of a commercial entity or product, the legal status of any country, territory, city area or its authorities, or concerning the delimitation or designation of its frontiers or boundaries or the designation of its name, frontiers or boundaries.
October 2015

3
TABLE OF CONTENTS
SUMMARY……………………………………………………………………………………………………………………………………… 8
1. Introduction ............................................................................................................................................................... 23 1.1. Selection of case studies…………………………………………………………………………………………………………..…..24
2. Methods for Ecosystem Services Quatification, Valuation & Scenarios Analysis ... 24 2.1. Information acquisition and management ..................................................................................................................... 24 2.1.1 Valuation of provisioning services ........................................................................................................................... 24 2.1.2 Valuation of regulating services ................................................................................................................................ 25 2.1.3 Use of a total economic value framework, and net present value parameters .................................... 27 2.2 GDP of the Poor ............................................................................................................................................................................ 29
3. Ecosystem Services in case study Agroforestry ............................................................................... 39 3.1. Coffee agroforestry in Ethiopia ............................................................................................................................................ 39 3.1.1 Background Description…………………………………………………………………………………………………......40 3.1.2 Baseline Quantification and valuation of ecosystem services in coffee agroforestry ...................... 41 Baseline ecosystem services and values identification in coffee agroforestry .................................... 50 3.1.3 Gross Margin Estimation of Coffee agroforestry compared to maize monocrop ............................... 50 3.1.4 GDP of the poor ................................................................................................................................................................ 52 3.1.5 Trends, potential scenarios and impact on ecosystem services ................................................................ 54
General remarks on results for coffee in Ethiopia ........................................................................................... 63 3.1.6 Implications for policy and incentives for REDD+ .......................................................................................... 63 3.2 Cocoa agroforestry in Ghana .................................................................................................................................................. 66 3.2.1 Background Description of the cocoa agroforestry system ........................................................................ 66 3.2.2 Baseline quantification and valuation of ecosystem services in cocoa agroforestry ...................... 68 3.2.4 Scenarios analysis and impact on ecosystem services .................................................................................. 84
General remarks on Scenarios 1 and 2 .................................................................................................................. 90 Input Costs and Gross Margin in intensively managed cocoa systems ................................................... 93
3.2.4 Implications for policy and incentives for REDD+ .......................................................................................... 96 3.3 Ngitili agroforestry systems in Tanzania ....................................................................................................................... 100 3.3.1 Description of the Ngitili system.......................................................................................................................... 101 3.3.2 Baseline quantification and valuation of ecosystem services in Ngitili.............................................. 103 Regulating Services ..................................................................................................................................................... 108 Biodiversity .................................................................................................................................................................... 110
Summary of Ngitili ecosystem services and value identification ........................................................... 114 3.3.1 GDP of the poor ............................................................................................................................................................. 114 3.3.3 Trends, potential scenarios and impact on ecosystem services ............................................................. 117 3.3.4 Policies and incentives for promoting Ngitili in production landscapes ............................................ 122
4 .CONCLUSION ............................................................................................................................................................................... 124 Policy options going forward: .................................................................................................................................................. 128 Including agroforestry in the national policy REDD+ framework ........................................................................... 128 Areas for further research ......................................................................................................................................................... 128
REFERENCES ...................................................................................................................................................................................... 131

4
LIST OF TABLES
Table 1: Selected agroforestry systems ...................................................................................................................................10
Table 2: Changes in ecosystem service values different scenarios in coffee agroforestry, Ethiopia ............14
Table 3: Changes in ecosystem service values different scenarios in cocoa agroforestry, Ghana .................15
Table 4: Changes in ecosystem service values under different scenarios in Ngitili Tanzania .........................17
Table 5: Agroforestry area extent (km2) between 2008 and 2010 .............................................................................20
Table 6: Population (millions of people) living in areas with agroforestry .............................................................20
Table 7: Selected agroforestry systems ...................................................................................................................................23
Table 8: Available data for the three selected agroforestry systems and chosen valuation method ...........27
Table 9: Overview of the analysis of coffee agroforestry in Ethiopia .........................................................................39
Table 10: Key characteristics of coffee agroforestry districts in Ethiopia ...............................................................41
Table 11: Annual per hectare quantities and values of provisioning services from
coffee agroforestry systems .....................................................................................................................................43
Table 12: Regulating Services from Coffee Agroforestry in Ethiopia (per hectare per year) ..........................46
Table 13: Carbon values in coffee agroforestry systems in Ethiopia (per hectare) .............................................48
Table 14: Ssummary of results for baseline ..........................................................................................................................50
Table 15: Input costs and gross margin per year ................................................................................................................51
Table 16: GDP of the poor calculations for coffee agroforestry in Ethiopia ............................................................54
Table 17: Percentage distribution of population by region (2007) ............................................................................58
Table 18: Biophysical results for Scenario 1 .........................................................................................................................59
Table 19: Valuation of changes in regulating services ($) for Scenario 1 .................................................................59
Table 20: Biophysical changes for Scenario 2 ......................................................................................................................61
Table 21: Valuation of changes in regulating services ($) for Scenario 2 .................................................................61
Table 22: Biophysical results for Scenario 3 .........................................................................................................................62
Table 23: Valuation results regulating services for Scenario 3 .....................................................................................62
Table 24: Overview of the analysis of cocoa agroforestry in Ghana ...........................................................................66
Table 25: Key characteristics of the case study cocoa agroforestry districts in Ghana
for which scenario modelling was implemented ...........................................................................................67
Table 26: Provisioning services for cocoa agroforestry in Ghana (per hectare per year) ................................70
Table 27: Regulating ecosystem services per hectare per year in cocoa agroforestry in Ghana ...................73
Table 28: Vegetation diversity in cocoa systems in Ghana .............................................................................................75
Table 29: Baseline assessment - carbon stocks of cocoa agroforestry in Ghana ...................................................76
Table 30: Baseline services in for cocoa agroforestry ......................................................................................................77
Table 31: Input costs for cocoa production systems .........................................................................................................80
Table 32: GDP of the poor estimates for cocoa agroforestry in Ghana ......................................................................83
Table 33: Biophysical changes for Scenario 1 ......................................................................................................................87
Table 34: Valuation of changes ($) for Scenario 1 ..............................................................................................................87
Table 35: Biophysical changes for Scenario 2 ......................................................................................................................89
Table 36: Valuation of changes ($) for Scenario 2 ..............................................................................................................90
Table 37: Provisioning services per hectare per year in intensive cocoa agroforestry
in Ghana (per hectare/year) ...................................................................................................................................91
Table 38: Quantities and values of regulating services per hectare per year in intensive
cocoa agroforestry in Ghana* .................................................................................................................................92
Table 39: Intensive cocoa agroforestry carbon stocks (Mg C/ha) ...............................................................................93
Table 40: Input costs for cocoa production systems in intensively managed cocoa ...........................................94
Table 41: Overview of the analysis of Ngitili agroforestry in Tanzania ................................................................. 100
Table 42: key characteristics of Ngitili agroforestry districts in Tanzania ........................................................... 101
Table 43: Annual quantities and values of provisioning services in Ngitili agroforestry in Tanzania...... 104
Table 44: Annual provisioning service value from Ngitili systems in Tanzania ($/ha) .................................. 106
Table 45: Soil nutrient stocks in Ngitili agroforestry systems in Tanzania (per hectare per year) ........... 109

5
Table 46: Carbon stocks in Ngitili agroforestry and maize-grazing rotation in Tanzania (Mg C/ha/y) .. 111
Table 47: Model generated regulating services for Ngitili baseline ......................................................................... 112
Table 48: GDP of the poor calculations for Ngitili agroforestry in Tanzania ....................................................... 116
Table 49: Biophysical results for Scenario 1 ...................................................................................................................... 119
Table 50: Regulating service valuation ($) for Scenario 1 ........................................................................................... 120
Table 51: Biophysical ES changes in Scenario 2 ............................................................................................................... 121
Table 52: Regulating service valuation ($) for Scenario 2 ........................................................................................... 121
6
LIST OF FIGURES
Figure 1: Changes in ecosystem service values different scenarios in coffee agroforestry, Ethiopia ..........15
Figure 2: Changes in ecosystem service values different scenarios in cocoa agroforestry, Ghana ...............16
Figure 3: Changes in ecosystem service values under different scenarios in Ngitili Tanzania .......................17
Figure 4: Tree cover on agricultural land in Africa (Zomer et al. 2009) ........... Error! Bookmark not defined.
Figure 5: Coffee agroforestry districts, location and elevation in Ethiopia .............................................................41
Figure 6: Provisioning service values from coffee agroforestry ($/ha/yr) .............................................................45
Figure 7: Carbon stock a) quantity (t C/ha) and b) values ($/ha) for coffee agroforestry. ..............................48
Figure 8: Baseline runoff in sub basins overlapping with coffee agroforestry in
study districts in Ethiopia ..........................................................................................................................................49
Figure 9: Gross Margin and Labour costs from coffee agroforestry ($/ha/yr) ......................................................51
Figure 10: Net present value of coffee agroforestry systems carbon prices per tonne
of CO2eq of a) $6.5 and b) $40.3 and various discount rates in Ethiopia ............................................52
Figure 11: Scenarios for coffee agroforestry systems in Ethiopia ...............................................................................56
Figure 12: Potential scenarios for cocoa agroforestry in Ghana ..................................................................................66
Figure 13: Location and elevation of cocoa growing districts in Ghana....................................................................67
Figure 14: Cocoa yields from national average, full sun, moderate shade, heavy shade
and high-tech cocoa (kg/ha). ..................................................................................................................................70
Figure 15: Provisioning service values from cocoa agroforestry ($/ha/yr). ..........................................................72
Figure 16: Carbon stocks in cocoa agroforestry systems in Ghana (Mg C/ha). .....................................................76
Figure 17: Water run-off within sub-basins that overlapped most with the study areas .................................77
Figure 18: a) Carbon stock values ($/ha) and b) Net C stock values ($/ha/yr)
from cocoa agroforestry from cocoa agroforestry systems in Ghana ............................................78
Figure 19: Input cost and gross margin of cocoa agroforestry ($/ha/y). .................................................................80
Figure 20: NPV for cocoa agroforestry under carbon prices of a) $6.5/tonne CO2eq
and b) $40.3/tonne CO2eq across different discount rates. ....................................................................81
Figure 21: Potential scenarios for cocoa agroforestry in Ghana ..................................................................................85
Figure 22: Yields of intensified cocoa agroforestry (kg/ha) ..........................................................................................91
Figure 23: Provisioning service values in intensive cocoa agroforestry. ..................................................................92
Figure 24: a) carbon stocks ($/ha) and b) net carbon stocks ($/ha/yr) in
intensively managed cocoa agroforestry .........................................................................................................93
Figure 25: Scenarios analysis -- input cost and gross margin of cocoa agroforestry. .........................................94
Figure 26: NPV for intensified cocoa agroforestry under carbon prices of .............................................................95
Figure 27: Scenarios for Ngitili systems in Tanzania ..................................................................................................... 100
Figure 28: Location of Ngitili agroforestry study district elevation ........................................................................ 102
Figure 29: Baseline runoff in sub basins overlapping with Ngitili agroforestry
in study districts in Tanzania ............................................................................................................................. 105
Figure 30: Baseline -provisioning service values from Ngitili & maize-grazing rotation ($/ha/year) .... 107
Figure 31: Nutrient content and total nutrient values in Ngitili compared to maize-grazing rotation .... 109
Figure 32: Carbon stocks (Mg/ha) from Ngitili agroforestry and maize-grazing rotation (Mg C/ha). ..... 111
Figure 33: a) Carbon stocks ($/ha) and b) net carbon stocks ($/ha/year) in
Ngitili agroforestry and maize-grazing rotation. ........................................................................................ 112
Figure 34: NPV under different discount rates for ecosystem services in Ngitili agroforestry
and maize-grazing rotation at carbon price of a) $6.5/tonne CO2eq
and b) $40.3/tonne CO2eq .................................................................................................................................. 114
Figure 35: A simplified sketch of two pathways through which agroforestry
contributes to the REDD+ mechanism: ........................................................................................................... 126
7
LIST OF ACRONYMS
BCR Benefit-Cost Ratio
CDM Clean Development Mechanism
CSA Central Statistical Agency of Ethiopia
CRIG Cocoa Research Institute of Ghana
COCOBOD Ghana Cocoa Board
ECX Ethiopian Commodity Exchange
ES Ecosystem services
ETB Ethiopian birr
FAOSTAT Food and Agriculture Organization of the United Nation Statistics Division
GDP Gross domestic product
IITA International Institute of Tropical Agriculture
IRR
IPCC
Internal Rate of Return
Intergovernmental Panel on Climate Change
LEV
NCRC
Land Expectation Value
Nature Conservation Research Centre
NPK Nitrogen, Phosphorous, and Potassium
NPV Net present value
OCFCU Oromia Coffee Farmers Cooperatives Union
OECD Organization for Economic Co-operation and Development
PAMs Policies and measures
REDD Reducing Emissions from Deforestation and Forest Degradation
RPP Readiness Preparation Proposal
TIP Tree Investment Policy
UNFCCC UN Framework Convention on Climate Change
US EPA
VCF
United States Environmental Protection Agency
Vegetation Continuous Fields
VSS
WTP
Voluntary sustainability standard
Willingness to pay
YCFCU Yirga cheffe Coffee Farmers Cooperative Union
8
SUMMARY Agroforestry is a practice involving the deliberate integration of trees or shrubs in farming landscapes involving crops or livestock in order to obtain benefits from the interactions between trees and/or shrubs the tree and crop or livestock component. The most up-to-date study of tree cover in agricultural landscape by Zomer et al. (2014), estimates the global extent of agroforestry, considering agricultural landscapes with at least 10% tree cover, as over 1 billion hectares of land (more that 43% of all agricultural land area), supporting more than 900 million people, mostly in the tropical and sub-tropical regions inhabited by poorer populations. The same study shows an overall increase in the extent of agroforestry (>10% tree cover) between 2000 and 2010 by about 1.85% of all agricultural land in sub-Saharan Africa, 12.6% in South America, 2.7% south east Asia and by 1.6% in central America. Over the same period, there is a large increase in the number of people living in landscapes with greater than 10% tree cover, from 746 million to over 837 million. Agroforestry is important in rural livelihoods as it provides a range of ecosystem services with additional benefits such as keeping farmers more food secure through more diversified food and cash crop outputs (fruit tree products, other non-timber forest products, food crops) and resilient to environmental or socio-economic shocks by on-farm livelihood diversification and enhancement of regulating ecosystem services for yield stability. As the growing population demands for food and other agricultural products, there is a tendency to replace agroforestry with monoculture intensified systems, which leads to increased yield of a few provisioning services and tradeoffs of ecosystem services, of critical value at local, national and global levels. However, if ecosystem values in agroforestry are better understood and integrated into formal decision-making processes, potential exists for making agroforestry an economically attractive option for farmers, land owners and governments. Within reducing emissions from deforestation and forest degradation in developing countries and the role of conservation, sustainable management of forests and enhancement of forest carbon stocks (REDD+) under the United Nations Framework Convention on Climate Change (UNFCCC), the recognition of the role of trees in contributing to global climate mitigation provides scope for agroforestry to contribute to carbon sequestration. This study aims to shed light on the value of ecosystem services agroforestry systems provide and the attractiveness of agroforestry in terms of the ability to remove carbon emissions compared to monoculture cropping. The study is part of a broader project of the TEEB for Agriculture and Food (TEEBAgFood) study. At the same time the study is relevant for UN-REDD partner countries as they identify what policies and measures (PAMs) to undertake as part of REDD+ implementation. The report uses cases studies from Ethiopia (coffee), Tanzania (Ngitili) and Ghana (cocoa). Based on the literature reviewed, total carbon stocks are over 300% higher coffee agroforestry than monoculture maize systems, approximately 33-100% higher in cocoa agroforestry, depending on shade density, than full sun cocoa systems, and over 200% higher in Ngitli (grazing exclosures) than maize-grazing rotation system. Ongoing trends in Ghana and Ethiopia involve forest conversion to smallholder agriculture and the adoption (sometimes with the Governments’ active promotion) of intensive and less
9
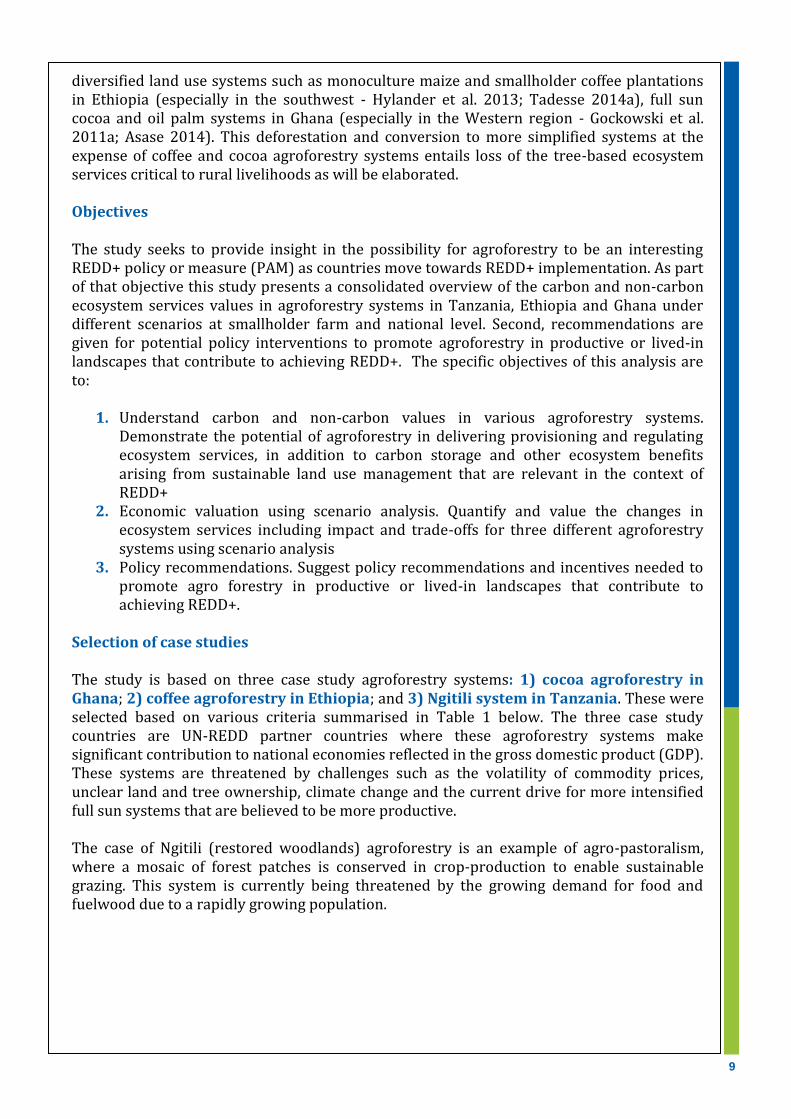
diversified land use systems such as monoculture maize and smallholder coffee plantations in Ethiopia (especially in the southwest - Hylander et al. 2013; Tadesse 2014a), full sun cocoa and oil palm systems in Ghana (especially in the Western region - Gockowski et al. 2011a; Asase 2014). This deforestation and conversion to more simplified systems at the expense of coffee and cocoa agroforestry systems entails loss of the tree-based ecosystem services critical to rural livelihoods as will be elaborated. Objectives The study seeks to provide insight in the possibility for agroforestry to be an interesting REDD+ policy or measure (PAM) as countries move towards REDD+ implementation. As part of that objective this study presents a consolidated overview of the carbon and non-carbon ecosystem services values in agroforestry systems in Tanzania, Ethiopia and Ghana under different scenarios at smallholder farm and national level. Second, recommendations are given for potential policy interventions to promote agroforestry in productive or lived-in landscapes that contribute to achieving REDD+. The specific objectives of this analysis are to:
1. Understand carbon and non-carbon values in various agroforestry systems. Demonstrate the potential of agroforestry in delivering provisioning and regulating ecosystem services, in addition to carbon storage and other ecosystem benefits arising from sustainable land use management that are relevant in the context of REDD+
2. Economic valuation using scenario analysis. Quantify and value the changes in ecosystem services including impact and trade-offs for three different agroforestry systems using scenario analysis
3. Policy recommendations. Suggest policy recommendations and incentives needed to promote agro forestry in productive or lived-in landscapes that contribute to achieving REDD+.
Selection of case studies The study is based on three case study agroforestry systems: 1) cocoa agroforestry in Ghana; 2) coffee agroforestry in Ethiopia; and 3) Ngitili system in Tanzania. These were selected based on various criteria summarised in Table 1 below. The three case study countries are UN-REDD partner countries where these agroforestry systems make significant contribution to national economies reflected in the gross domestic product (GDP). These systems are threatened by challenges such as the volatility of commodity prices, unclear land and tree ownership, climate change and the current drive for more intensified full sun systems that are believed to be more productive. The case of Ngitili (restored woodlands) agroforestry is an example of agro-pastoralism, where a mosaic of forest patches is conserved in crop-production to enable sustainable grazing. This system is currently being threatened by the growing demand for food and fuelwood due to a rapidly growing population.
10
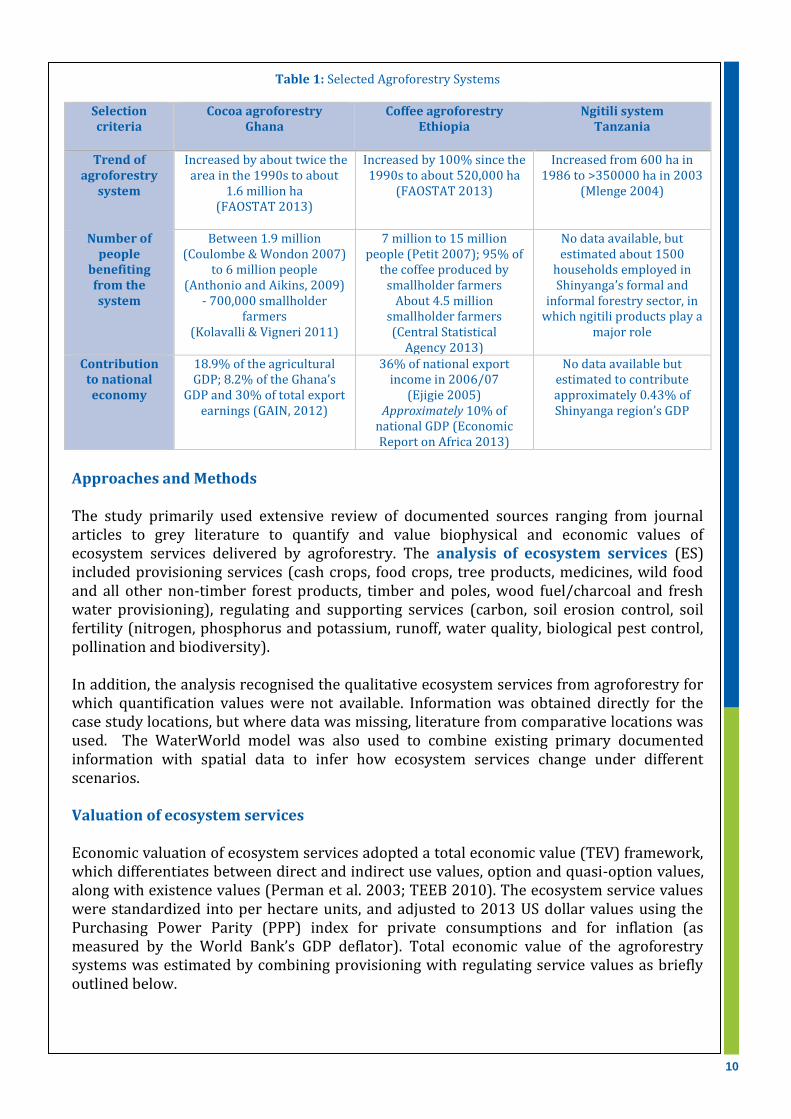
Table 1: Selected Agroforestry Systems
Selection criteria
Cocoa agroforestry Ghana
Coffee agroforestry Ethiopia
Ngitili system Tanzania
Trend of agroforestry
system
Increased by about twice the area in the 1990s to about
1.6 million ha (FAOSTAT 2013)
Increased by 100% since the 1990s to about 520,000 ha
(FAOSTAT 2013)
Increased from 600 ha in 1986 to >350000 ha in 2003
(Mlenge 2004)
Number of people
benefiting from the system
Between 1.9 million (Coulombe & Wondon 2007)
to 6 million people (Anthonio and Aikins, 2009)
- 700,000 smallholder farmers
(Kolavalli & Vigneri 2011)
7 million to 15 million people (Petit 2007); 95% of
the coffee produced by smallholder farmers
About 4.5 million smallholder farmers (Central Statistical
Agency 2013)
No data available, but estimated about 1500
households employed in Shinyanga’s formal and
informal forestry sector, in which ngitili products play a
major role
Contribution to national economy
18.9% of the agricultural GDP; 8.2% of the Ghana’s
GDP and 30% of total export earnings (GAIN, 2012)
36% of national export income in 2006/07
(Ejigie 2005) Approximately 10% of
national GDP (Economic Report on Africa 2013)
No data available but estimated to contribute approximately 0.43% of Shinyanga region’s GDP
Approaches and Methods The study primarily used extensive review of documented sources ranging from journal articles to grey literature to quantify and value biophysical and economic values of ecosystem services delivered by agroforestry. The analysis of ecosystem services (ES) included provisioning services (cash crops, food crops, tree products, medicines, wild food and all other non-timber forest products, timber and poles, wood fuel/charcoal and fresh water provisioning), regulating and supporting services (carbon, soil erosion control, soil fertility (nitrogen, phosphorus and potassium, runoff, water quality, biological pest control, pollination and biodiversity). In addition, the analysis recognised the qualitative ecosystem services from agroforestry for which quantification values were not available. Information was obtained directly for the case study locations, but where data was missing, literature from comparative locations was used. The WaterWorld model was also used to combine existing primary documented information with spatial data to infer how ecosystem services change under different scenarios. Valuation of ecosystem services Economic valuation of ecosystem services adopted a total economic value (TEV) framework, which differentiates between direct and indirect use values, option and quasi-option values, along with existence values (Perman et al. 2003; TEEB 2010). The ecosystem service values were standardized into per hectare units, and adjusted to 2013 US dollar values using the Purchasing Power Parity (PPP) index for private consumptions and for inflation (as measured by the World Bank’s GDP deflator). Total economic value of the agroforestry systems was estimated by combining provisioning with regulating service values as briefly outlined below.

11
The total asset value of each system was estimated as its net present value at maturity (i.e. full yield capacity) at a 10% real1 discount rate over a twenty-year time horizon. A 10% rate was chosen as the principal rate for cost-benefit analysis because it accords with previous cost-benefit analyses studies for agroforestry systems in the country case studies (e.g. Monela et al. 2005; Obiri et al. et al. 2007; Reichuber et al. 2012; Asare et al. 2014), and it also is in line with the opportunity cost of loanable funds from multilateral development banks such as the Wold Bank. In the sensitivity analysis, a lower-bound rate of 2.5% and an upper-bound rate of 20% were used. Valuation of provisioning services was done using recent price data in relation to the physical units (e.g. $/headload of fuel wood). No price premiums were used. Where gaps existed, datasets from comparable situations were considered using the benefit transfer method, which increases uncertainty. Provisioning services were valued through their estimated gross margin (value of output less variable cost). Valuation of regulating services was done using various methods depending on the ecosystem service. Carbon stocks (above and belowground biomass and soil carbon pools, excluding litter and dead wood), were valued by considering both private financial benefits to farmers through possible payments from carbon markets for agroforestry/sustainable agricultural land management at US$6.50/ton (Forest Trends, 2013)2, and as a global public good, using the social cost of carbon as estimated by the United States Environmental Protection Agency (2013)3 at $40.3/ton. The US EPA social cost of carbon estimate was used in order to remain conservative in estimating the social cost, and to better approximate the likely upper bound of developed countries’ willingness to pay for emissions offsets in developing countries (eg. Beltran et al. 2013). The resulting estimations provided the lower and upper bounds of the carbon stock value in a sensitivity analysis for the cost-benefit analysis. However, only the lower bound estimates were used for the scenarios analyses and calculations of GDP of the poor. Regulating services, such as soil erosion control and maintenance of soil fertility, biological control of pests and pollination can be understood as intermediate ecosystem services which contribute to the final benefit of crop production. As such, they were not valued additively (i.e. in addition to the value of the crop provisioning services), but in terms of their incremental contribution to the final provisioning service as separate set of environmental service “flow” accounts. Pollination and biological pest control services, were valued as their percent contribution to the the gross margin of the final crop, supplemented by replacement cost and avoided cost estimates where relevant. Soil fertility and erosion control values were estimated using the replacement costs approach, valuing the differences in nitrogen (and, where available, phosphorous and potassium) stocks by multiplying the additional soil nutrients by the cost of urea and/or NPK fertilizer.
1 i.e, inflation-adjusted. 2 Forest Trends (2014) gives $4.2/tonne CO2eq for REDD+ credits, $16.1/tonne CO2eq for agroforestry/sustainable agricultural land management credits, and an average value (across all credit types) of $5.2/tonne CO2eq. The 2013 values for agroforestry credits were used since they are more conservative. 3 The cost of one ton of emissions for the year 2015, expressed in 2011 dollars under a 3% discount rate was estimated at USD 39/tonne of CO2 equivalent emissions. Adjusting for two years of inflation gives a value of USD 40.3/tonne.

12
SCENARIOS ANALYSIS The future gains and tradeoffs in agroforestry ecosystem services likely to occur due to different land use scenarios were analysed for the three case studies, under an array of possible future situations that may arise when the course set by current and emerging trends is altered due to uncertain external factors. These scenarios were therefore inspired by emerging trends and policy contexts in each study country, and chosen to be consistent with existing scenarios developed for West and East Africa by the CGIAR programme on Climate Change, Agriculture and Food Security (CCAFS). Scenario analysis was done on the following sample area extent: 206,000 ha for cocoa agroforestry, 202,432 ha for Coffee agroforestry and 1.3 million ha for Ngitili. Coffee agroforestry in Ethiopia Globally coffee covers an area of 10.2 million ha, supporting 15-20 million households. Of this area, 40% is produced with no shade, 35% with light-moderate shade and 25% with traditional diverse shade. Coffee was responsible for 10-12 million ha of deforestation over the past 1-1.5 century (Vaast et al. 2015). In Ethiopia, the rate of deforestation is estimated at 1-1.5% per year (Teferi et al. 2013), mostly driven by smallholder coffee expansion (Davis et al. 2012). Coffee profitability is very low in smallholder agroforestry systems in Ethiopia, mostly due to volatility in global market prices. In the 1990s-2000s, loss in income was about $200 per household (Charveriat 2001) and between 1998 and 2003 (Petit 2007) the Ethiopia government estimated a loss of about $814 million in revenue. Climatic predictions show that areas bioclimatically suitable for coffee production may reduce by 65% under the most optimistic projections (Davis et al. 2012). The following scenarios were considered.
1) Conversion to an alternative agricultural crop. Conversion of all areas identified as under coffee agroforestry to a maize mono cropping system. This could be caused by ongoing trends of low profitability of coffee due to occasionally low global prices, climate change, which might render many areas bioecologically unsuitable for coffee growing (Davis et al. 2012) or the allocation of land to agricultural investors for biofuel generation.
2) Conversion existing agroforestry coffee to heavy shade grown coffee. Conversion of all areas identified as under coffee agroforestry to a heavy shade coffee agroforestry system. This is alternative scenario that could result from the ongoing Climate Resilience Green Growth Strategy, the national REDD+ program, certification programs and improvements in land tenure conditions.
3) Conversion and further expansion of heavy shade grown coffee. Conversion of
all areas identified as under coffee agroforestry to a heavy shade agroforestry system and expansion into all areas identified as non-agroforestry land use outside urban and other priority land uses. This can be the case if the above processes in (2) turn out to be successful and profitable for farmers.

13
Cocoa agroforestry in Ghana
Globally cocoa covers an area of 9.9 million ha, supporting 10-15 million households. Of this area, 30% is produced with no shade, 50% with light-moderate shade and 20% with traditional diverse shade. Cocoa production was responsible for 6 million ha of deforestation over the past 50 years (Vaast et al. 2015). In Ghana, cocoa area expanded in 1984 to 2006 due to promotion of full sun varieties under Ghana Cocoa Board (COCOBOD) High Tech and CODAPEC program (HTP) targeting to increase and stabilize cocoa production to one million tonnes per year (Gockowski et al. 2013). This affected the last remnants of the West African Guinea Forest. Since shade removal can result in doubling of yields (Acheampong et al., 2014), cocoa agroforests are decreasing across West Africa (Ruf et al. 2006; Ruf 2011). Per hectare stocking of large trees >10 m tall in farms was 50 in the 1970s; 4.7 in 1989 and 3.4 in 1991 (STCP 2008). The following scenarios were considered.
1) Conversion to an alternative agricultural crop. Conversion of all cocoa agroforestry systems to a full sun/lightly shaded system. This is an ongoing trend mainly driven by the promotion of full sun varieties under COCOBOD High Tech and CODAPEC program (HTP) targeting to increase and stabilize cocoa production to one million tonnes per year. Insecure land tenure and the barriers to ownership of naturally growing trees also contribute to this.
2) Conversion existing cocoa agroforestry to heavy share cocoa system. Conversion of all cocoa agroforestry areas to moderate to heavy shade cocoa systems. This is an alternative scenario that could be driven by the fact that the productivity of full sun hybrids declines after short cycles (10-15 years) and may not be sustainable if subsidies for agrochemical inputs are removed. The ongoing REDD+ program and cocoa certification options may also contribute to this.
3) Agronomic improvement. This concerns use of fertilizer, herbicide and other inputs in not just under full sun, but in cocoa agroforestry systems. This is already practiced in some systems and could be scaled up.
Ngitili in Tanzania
The rapid growth in human and livestock population is leading to increasing demand for land to grow food crops especially maize (Fisher 2005; National Bureau of Statistics and Shinyanga Regional Commissioner’s Office 2007), leading to fragmentation of Ngitili. Ngitli is also becoming degraded due to overgrazing and overharvesting of fuel wood for charcoal due to growing urban demand (World Agroforestry Centre 2010). Despite the rapid expansion in Ngitili up to 2003, tree cover on agricultural land largely decreased in Tanzania between 2002 and 2010 (Zomer et al. 2014). The following scenarios were considered.
1) Conversion to an alternative agricultural crop. Conversion of all Ngitili areas to a maize system. This could be driven by ongoing growing demand for land for food cultivation (maize is the major crop) and pressure on existing Ngitili for charcoal and fuel wood due to the growing population.
2) Conversion existing Ngitili to heavy shade Ngitili system. Enhancement of shade levels in Ngitili agroforestry system.

14
RESULTS Coffee agroforestry In the baseline scenario, coffee agroforestry in Ethiopia stores carbon stocks ranging from 49 to 150 t/ha with an overall monetary value of $865 million over the current total area coverage. The system produces provisioning services including coffee yield, food, fuelwood and non-timber forest products (NTFP) worth an annual per hectare value of $1,100-2,500. This is compared to production in the alternative maize systems, which has a value of only $450/ha/y. The agroforestry system also provides regulating ecosystem services including soil fertility enhancement, pollination, biodiversity, soil erosion control, enhancement of water quality and water flows. The overall net present value (NPV) of baseline coffee agroforestry comes to $2,750-29,300/ha compared to only $900/ha-$3000/ha in maize systems. Converting coffee to maize would result in overall increase in maize, worth about $90 million a year. However, this entails loss of $116 million worth of coffee production, as well as $2.7 million and $10 million worth of wood fuel and honey production, totalling approximately $38 million of foregone provisioning services. In addition, it leads to regulating services losses (Table 2 and Figure 1) due to decreased water yield, loss in carbon stocks, increased soil erosion and runoff. Conversely, increasing canopy cover in coffee agroforestry systems would not affect provisioning services significantly compared to the baseline, yet it can potentially generate regulating service gains in terms of increased carbon stocks, increased water yield and reduces soil erosion and runoff. If such a system is expanded (scenario 3), it would increase the gains in regulating services even more while generating a net increase in provisioning services. Overall, there is substantial potential benefit in increasing tree cover in coffee agroforestry systems.
Table 2: Changes in ecosystem service values different scenarios in coffee agroforestry, Ethiopia
Ecosystem service4 Scenario 1 Converting to maize (million $/y)
Scenario 2: Canopy cover ≥ 30% (million $/y)
Scenario 3: Canopy cover ≥ 30% & expansion (million $/y)
Increase in system extent (ha)
202,342 0 286,852
Provisioning5 -$38.4 No change 73.4
Coffee -115.9 No change 143.9
Maize 90.5 No change -128.3
Other ES (fuel wood, honey)
-13 No change 57.9
Carbon regulation -435 292 655
Other regulating -19.0 74.5 54.3
Water yield -34.9 58.6 10.7
Soil erosion 15.9 15.9 43.6
4 All ecosystem services listed are in principle compatible with the System of National Accounts, meaning that these can either be directly reflected in the value added by the agricultural sector, or are hidden in the value added of other sectors. 5 Assuming no price effects from increased and decreased production

15
Figure 1: Changes in ecosystem service values different scenarios in coffee agroforestry, Ethiopia
Cocoa agroforestry
Cocoa agroforestry in Ghana stores about 23.4 million tonnes of carbon over the current total area coverage, worth about $565 million. However, the value of provisioning services including cocoa yield, food fuelwood and NTFP from shaded cocoa systems comes to an annual per hectare value of only $2300/ha compared to the full sun option worth about $3100/ha and the high input (‘high-tech’) option worth $6400/ha. The overall NPV of baseline cocoa agroforestry comes to $600/ha, compared to over $4100/ha in the full sun system and $14,000/ha in the high tech system. The shade cocoa systems also provide regulating ecosystem services including soil fertility enhancement, pollination, biodiversity, enhancement of water quality and water flows. Water quality is potentially quite high in cocoa agroforestry systems due to the high tree cover, although effects from pollution from agrochemical inputs were not considered in the model used.
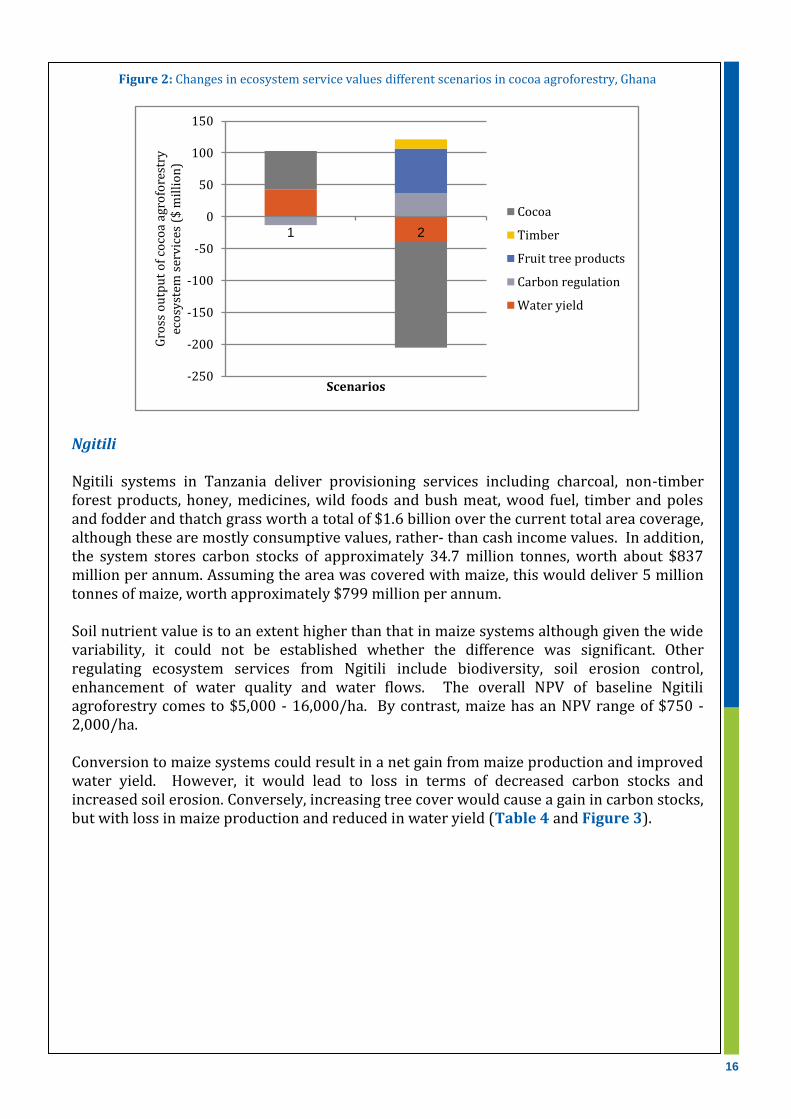
Conversion of cocoa agroforestry to full sun leads to 10,300 tonnes increase in cocoa production and gains in water yield, but causes carbon stock losses (Table 3 and Figure 2). Conversely, increasing tree cover in cocoa agroforestry leads to carbon stock gains, but with losses in cocoa and water yield. Intensification of moderate and heavy shade systems using maximum recommended agro-input levels results in overall increase in value of the system, but agroforestry systems have a lower value than full sun.
Table 3: Changes in ecosystem service values different scenarios in cocoa agroforestry, Ghana
Ecosystem service4 Scenario 1 Converting to full sun (million $/y)
Scenario 2 Converting to moderate shade
Increase in system extent (ha) 55,482 151,154 Provisioning5 60.86 -81.4 Cocoa 60.86 -165.8 Timber6 0 14.6 Fruit tree products 0 70.2 Carbon regulation -12.9 36.6 Other regulating 42.3 -39.4
Water yield 42.3 -39.4 Soil erosion ND ND
6 Undiscounted timber yield at Year 20, divided over a twenty year period.
-$800
-$600
-$400
-$200
$-
$200
$400
$600
$800
$1,000
1 2 3
Gro
ss o
utp
ut
of
coff
ee
agro
fore
str
y e
cosyste
m s
erv
ices
($ m
illio
n)
Scenarios
Maize
Coffee
Other provisioning ES(fuel wood, honey)
Carbon regulation
Water yield
Erosion control
16
Figure 2: Changes in ecosystem service values different scenarios in cocoa agroforestry, Ghana
Ngitili Ngitili systems in Tanzania deliver provisioning services including charcoal, non-timber forest products, honey, medicines, wild foods and bush meat, wood fuel, timber and poles and fodder and thatch grass worth a total of $1.6 billion over the current total area coverage, although these are mostly consumptive values, rather- than cash income values. In addition, the system stores carbon stocks of approximately 34.7 million tonnes, worth about $837 million per annum. Assuming the area was covered with maize, this would deliver 5 million tonnes of maize, worth approximately $799 million per annum. Soil nutrient value is to an extent higher than that in maize systems although given the wide variability, it could not be established whether the difference was significant. Other regulating ecosystem services from Ngitili include biodiversity, soil erosion control, enhancement of water quality and water flows. The overall NPV of baseline Ngitili agroforestry comes to $5,000 - 16,000/ha. By contrast, maize has an NPV range of $750 - 2,000/ha. Conversion to maize systems could result in a net gain from maize production and improved water yield. However, it would lead to loss in terms of decreased carbon stocks and increased soil erosion. Conversely, increasing tree cover would cause a gain in carbon stocks, but with loss in maize production and reduced in water yield (Table 4 and Figure 3).
-250
-200
-150
-100
-50
0
50
100
150
1 2
Gro
ss o
utp
ut
of
coco
a ag
rofo
rest
ry
eco
syst
em s
erv
ices
($
mil
lio
n)
Scenarios
Cocoa
Timber
Fruit tree products
Carbon regulation
Water yield

17
Table 4: Changes in ecosystem service values under different scenarios in Ngitili Tanzania
Figure 3: Changes in ecosystem service values under different scenarios in Ngitili Tanzania
Implications for REDD+ In all the three systems analysed, there is scope to increase ecosystem service benefits to rural farmers and national economies by increasing the tree component and expanding the coverage of agroforestry systems although this requires substantial investment. However, at present most of the benefits delivered by agroforestry are externalised from formal market systems and do not translate into tangible gains at the farm or national level. Given the potential for agroforestry systems to store and sequester larger amounts carbon than
-2000
-1000
0
1000
2000
3000
4000
5000
1 2
Gro
ss o
utp
ut
of
Ngi
tili
agr
ofo
rest
ry e
cosy
stem
se
rvic
es
(
$ m
illi
on
)
Scenarios
Maize
Timber and poles
Charcoal
Wood fuel
Other NTFP (honey,medicine, fodder, bush meat,etc.)Grazing land rentals
Carbon regulation
Ecosystem service4 Scenario 1 Converting to maize
(million $/y)
Scenario 2: Canopy cover ≥ 20% and
conversion from maize (million $/y)
Increase in system extent (ha) 1,316,504 2,039,867 Provisioning5 -1,160.1 1,798.2 Maize 273.8 -424.3 Timber and poles -148.1 229.5 Charcoal -463.9 718.9 Wood fuel -102.8 159.3 Other NTFP (honey, medicine, fodder, bush meat, etc.)
-782.7 1,212.7
Grazing land rentals 63.19 -97.9 Carbon regulation -176 1,464
Carbon (REDD+)
Other regulating 0.98 -0.94
Water yield 0.95 -0.95 Soil erosion .031 0.009

18
conventional agriculture, there is scope to include it as a means of ‘enhancement of forest carbon stocks’ thereby being one of the five accepted ‘REDD+ activities’ under the UN Framework convention on Climate Change (UNFCCC). Besides the carbon removal potential of agroforestry systems, these systems also provide non-carbon ecosystem service benefits that can be beneficial for the countries in question. Technically agroforests and agroforestry can be as a direct target of REDD+ programs, or be included indirectly as part of the necessary conditions for success. Whether or not it can be a core element of REDD+ depends on the country’s forest definition as well the economic realities of production systems. Serious considerations would have to be given to how REDD+ addresses the trade-offs between economically driven policies that encourage more productive low-to open coffee and cocoa systems in African countries that harbour these systems. Agroforestry sequestration capacity is quite low compared to the amount of carbon that can be stored in forests, with average aboveground biomass stock values from literature review being around 45-50% for forest coffee systems compared to Afromontane forests in Ethiopia (Tadesse 2014; Vanderhaegan et al. 2015). For Ghana, aboveground biomass C stocks compared to secondary and old-growth forests are about 23% and 18% (Sandker et al. 2009) for moderate shade cocoa, and about 34% and 42% for heavy shade cocoa. However, it should be noted that in some instances, carbon stocks from cocoa agroforestry systems have been estimated to be as high as 84% of carbon stored in secondary forests (Wade et al. 2010). Ngitili has total biomass carbon7 stocks equivalent to 39% of the value for degraded miombo woodlands and 22% the value for ‘pristine’ miombo woodlands in Tanzania (Burgess et al. 2010). As such, REDD+ payments for agroforestry are likely to offer only a small fraction of farm revenue except when aggregated across landscapes or in combination with forest-based REDD+ projects or payments for avoided deforestation. However, the situation is of course broader; while forests store more carbon, they may not provide the other economic benefits that agroforestry systems provide. When these benefits are considered, agroforestry can deliver higher value to national economies. Hence, a government might decide to use REDD+ as a vehicle to finance the transition from monoculture to agroforestry as opposed to "setting aside land" for de-facto conservation, which can be quite expensive in terms of lost opportunity costs (unless a government already had plans to set aside certain areas for conservation). Minang et al, (2014) found that 40 of the African countries involved in REDD+ mention agroforestry as a strategy in implementing REDD. However, it is important for UN-REDD partner countries and forest-rich nations that consider agroforestry an interesting policy or measure (PAM) to start operationalizing it through REDD+ National Strategies/Action Plans and/or investment plans.
Agroforestry can be included in REDD+ strategies, as ways to reduce drivers of deforestation through 1) shifting demand for land (land sparing) as a sustainable intensification pathway, 2) providing alternative sources of products otherwise derived from forest over-exploitation or conversion, and 3) as opportunities for profitable labour absorption in a sustainable intensification pathway. On-farm timber and fuelwood production can avoid leakage from forest protection efforts. 7 Referring to both above and belowground biomass. Total biomass carbon stocks are compared here because that is the manner in which the miombo woodlands comparator values were reported.
19
From a review of emerging REDD+ sub-national projects across various countries, Alemagi et al. (2014) observe a number of challenges for integrating agroforestry such as getting good quality planting material, agronomical understanding of optimal shade, unclear rights to land, trees and carbon, poor market infrastructure, long waiting periods for recovery of investments (sometimes up to 3 years) and labour shortages. It is crucial to have a broader enabling environment in place to make implementation a success. Land and tree tenure need to be made more secure and road-blocks against marketing of tree products including timber and charcoal need to be replaced by provisions that work together with key stakeholders.
Other financial incentive options for promoting agroforestry Beyond potential REDD+ results-based payments for the carbon removed through agroforestry systems, mechanisms of internalising the other ecosystem values from agroforestry can be explored. Some examples are outlined below.
Payments for ecosystem services (apart from REDD+) can be used to promote agroforestry in watershed uplands using payments from downstream water users such as power generating companies, irrigation schemes and water utility companies. However, given the low coverage of downstream companies with capacity and willingness to pay, these mechanisms may require joint financing or co-investment including private sector, government and development funds. Due to difficulties in implementing direct buyer-seller PES in Africa, systems of incentivising of agroforestry in watersheds have evolved to pilot more multi-stakeholder approaches such as the Nairobi Water Fund by the Nature Conservancy aimed at improving land use in the upper Tana watershed.
Sustainable certification schemes, which are already in operation for coffee and cocoa also offer some scope for incentivising agroforestry. However, the barriers to their expansion need to be addressed e.g., the high upfront costs and difficulty in sustaining the required controls and inclusion of smallholder and remotely located farmers.
Using fiscal instruments to improve profitability of agroforestry systems. The analysis in this report has shown that agroforestry systems provide a range of non-carbon ecosystem service benefits to the national economy. Without economic incentives it will be difficult to convince farmers and landholders to change their land use in favour of agroforestry. Fiscal incentives (tax exemptions or input subsidies) or grants could be used to incentivize public and private actors that manage land to move towards agroforestry enhancing sustainable intensification aimed at improving productivity and profitability not only of the main crops, but also of tree products such as timber and fruits.

20
1. INTRODUCTION Agroforestry is a deliberate integration and managing of trees or shrubs in farming landscapes for their economic and/or ecological interactions with the non-woody system components (crops and/or livestock). Farming landscapes with trees qualify as agroforestry with no specification of a cut-off percent tree cover as this varies widely under different environments. Agroforestry can be the intimate mixture of trees with crop cultivation or livestock keeping at the field level or at a broad landscape level where natural or planted woodlots are separated in space from field crops, but are managed in an integrated way by individual households or communities. Trees can be in linear, scattered or clustered configuration in the field or across landscapes (Nair 1985a; Sinclair 1999; Jama and Zeila 2005). According to Zomer et al. (2014), the global extent of agroforestry, considering agricultural landscapes with at least 10% tree cover, is over 1 billion hectares of land (more that 43% of all agricultural land area); with more than 900 million people (Zomer et al. 2014). The extent of agroforestry and the population of people in agroforestry landscapes according to tree cover are presented in Tables 5 and 6. The same study shows an overall increase in the extent of agroforestry (>10% tree cover) between 2000 and 2010, by about 1.85% of all agricultural land in sub-Saharan Africa, 12.6% in South America, 2.7% south east Asia and by 1.6% in central America. However, in sub-Saharan Africa, there is about 0.6% reduction in land area with tree cover >30% in the wetter locations. Over the same period, there is a large increase in the number of people living in landscapes with greater than 10% tree cover, from 746 million to 837 million. The increase in populations in landscapes with agroforestry is greatest in tropical regions by over 55 million people in southern and eastern Asia, about 7 million people in South America and about 3 million people in sub-Saharan Africa.
Table 5: Agroforestry area extent (km2) between 2008 and 2010
Region >10% tree cover >20% tree cover >30% tree cover
Global 9,625,303 5,130,893 3,140,819
Sub-Saharan Africa 1,207,656 595,334 334,492
South east Asia 1,316,106 1,039,249 823,783
Latin America 2,552,178 1,235,601 687,135
Table 6: Population (millions of people) living in areas with agroforestry
Region >10% tree cover >20% tree cover >30% tree cover
Global 837.6 340.9 172.3
Sub-Saharan Africa 70.1 28.8 12.1
South east Asia 170.1 105.9 69.0
South America 31.7 15.3 8.3
Central America 14.8 12.2 8.3
Source for Tables 5&6: Zomer et al. 2014. Average values based on annual data sets
Agroforestry is important in rural livelihoods and national economies and compared to annual crop or livestock systems, it is known to be resilient to climate and market shocks (Tscharnke et al. 2011; Kerr 2012; Nguyen et al. 2013), ensuring ecosystem benefits such as carbon storage, soil improvement and biodiversity conservation in addition to food and fibre. It can be a viable way of ensuring sustained flow of tree-based ecosystem services as demand for agricultural production expands with the growing population. Based on

21
ecological and socio economic conditions, potential exists to expand agroforestry, for example, in areas bordering the Sahara desert, West African low coastlands and, to a moderate extent, some patches in East Africa (Zomer et al 2009). However, besides timber and crop harvests, other agroforestry benefits do not feature directly in markets and therefore tend to be excluded in formal planning in preference for alternative pure cropping systems. This ignores its critical support functions in changing climate conditions especially amongst low-resource populations and may result in loss of its overall contribution to national economies.
A change from the present or default agricultural system towards an agroforestry system that combines sustainable crop yields with the potential to remove greenhouse gas emissions as well as additional ecosystem services that are provided in the agroforestry systems as opposed to monoculture systems could potentially be an economically attractive option for farmers, land owners and governments. The results below highlight for different scenarios whether agroforestry systems are economically attractive. From a REDD+ perspective, agroforestry can be regarded as one of the five REDD+ activities considered under the UN Framework Convention on Climate Change (UNFCCC), namely ‘enhancement of forest carbon stocks’.
With the growing literature on ecosystem services and methods on how these can be valued, it is possible to systematically consolidate agroforestry ecosystem service values in such a way that enables its formal inclusion in national planning and development decisions. In this study, we analyze findings from literature supported with modelling to establish the quantity and value of ecosystem services of select agroforestry systems in Africa and implications to local livelihoods, national economies and REDD+ under different land use change scenarios. The study demonstrates the value of ecosystem services in agroforestry in order to bring to the fore their true value in local livelihoods and national economies especially in landscapes with low-income smallholder farmers. The with-without scenarios analysis is aimed at demonstrating aspects that are often externalized in land use decisions in order to recommend optimal options that minimize trade-offs at local and national levels.
Assessments of ecosystem service values according to TEEB include methods which recognize ecosystem service values, demonstrate values, and propose means of capturing ecosystem service values. Recognizing values entails that society acknowledges (in some broad sense) that an ecosystem and its services possess some kind of value to them, whether direct or indirect use values, or cultural and spiritual values (TEEB 2010b). Demonstrating values means identifying how given ecosystem services augment economic and other human values for different groups of beneficiaries (eg. famers, the national economy, the global community), which can “be an important aid in achieving more efficient use of natural resources … even if it does not result in specific measures that capture the value” (TEEB 2010b), since this information can guide investment decisions and enable the evaluation of tradeoffs. Details of this Capturing values refers to the creation of public, customary or private property rights to benefit from the service, along with the provisioning of incentives or enhanced price signals to encourage ecosystem conservation and restoration (TEEB 2010b).
This analysis is an input to TEEB for its Agriculture and Food Study Project and aims to:
a) Quantitatively demonstrate the potential for agroforestry to deliver provisioning and regulating ecosystem services, in relation to carbon storage and other ecosystem benefits arising from sustainable land use management, that are relevant in the context of REDD+ and TEEB for Agriculture and Food for three geographical areas in Africa.

22
b) Quantify and value (in monetary terms where possible, and non-monetary terms where appropriate) the changes in ecosystem services including impacts and trade-offs for three geographical areas and three agroforestry systems using scenario analysis.
c) Recommend policy and incentives approaches for promoting agroforestry in productive or lived-in landscapes that contribute to achieving REDD+.
The report is organized as follows: Section 1 the introduction provides the background, key concepts and the process followed in selecting case studies and their ecosystem services. Section 2 presents the general methodology followed in quantifying and valuing the ecosystem services and conducting the scenario analysis. Section 3, 4 and 5 respectively focus on coffee agroforestry in Ethiopia, cocoa agroforestry in Ghana and Ngitili agroforestry in Tanzania. For each of the case studies, there is a characterization of the focus agroforestry systems and trends, followed by a quantitative demonstration of the ES related to carbon storage and other benefits arising from agroforestry as well as a valuation of any tradeoffs that may occur as a result of land use change. In particular, the case studies consider implications of agroforestry land use change to non-agroforestry scenario, and the other way around, by converting from a less shaded to a more shaded system. Furthermore, the report presents the implications of such changes for policies and incentives for promoting agroforestry as a contribution to REDD+. Finally, section 6 presents a synthesis of the key messages coming from the three case studies in comparison to similar analyses elsewhere. Agricultural land in sub-Saharan Africa covers about 3.9 million km2 (Zomer et al. 2009) out of a total surface area of 24 million km2 (Livingston et al. 2011). About 8 million km2 of uncultivated land has potential for rain-fed crop production (Livingston et al 2011). Out of the total population of about 800 million people, around 500 million (63%) live in rural areas (Livingston et al. 2011). The major economic activity is rain-fed smallholder agriculture (< 2 ha) practiced on about 80% of all farms (Wiggins 2009). Agroforestry is a significant component of rural farms in sub-Saharan Africa. According to Zomer et al. (2014), about 1.3 million km2 is under at least 10% tree cover supporting over 100 million people. In humid areas, almost all agricultural land has at least 20% tree cover compared to drylands where almost half of the agricultural land has at least 5% tree cover (Figure 4). Agroforestry is commonly practiced with mixed cropping and low mechanization and exists in various typologies or systems shaped by climate, culture and market conditions.
Figure 4: Tree cover on agricultural land in
Africa (Zomer et al. 2009)
23
1.1. Selection of case studies
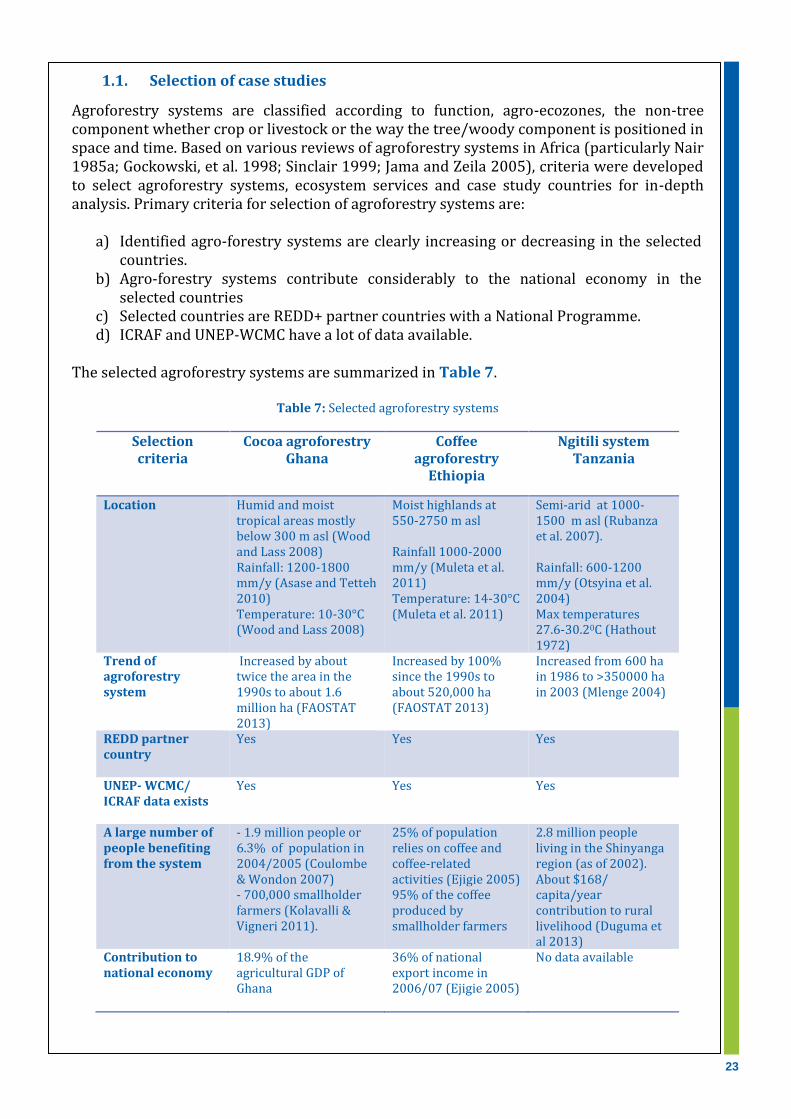
Agroforestry systems are classified according to function, agro-ecozones, the non-tree component whether crop or livestock or the way the tree/woody component is positioned in space and time. Based on various reviews of agroforestry systems in Africa (particularly Nair 1985a; Gockowski, et al. 1998; Sinclair 1999; Jama and Zeila 2005), criteria were developed to select agroforestry systems, ecosystem services and case study countries for in-depth analysis. Primary criteria for selection of agroforestry systems are:
a) Identified agro-forestry systems are clearly increasing or decreasing in the selected countries.
b) Agro-forestry systems contribute considerably to the national economy in the selected countries
c) Selected countries are REDD+ partner countries with a National Programme. d) ICRAF and UNEP-WCMC have a lot of data available.
The selected agroforestry systems are summarized in Table 7.
Table 7: Selected agroforestry systems
Selection criteria
Cocoa agroforestry Ghana
Coffee agroforestry
Ethiopia
Ngitili system Tanzania
Location Humid and moist tropical areas mostly below 300 m asl (Wood and Lass 2008) Rainfall: 1200-1800 mm/y (Asase and Tetteh 2010) Temperature: 10-30°C (Wood and Lass 2008)
Moist highlands at 550-2750 m asl Rainfall 1000-2000 mm/y (Muleta et al. 2011) Temperature: 14-30°C (Muleta et al. 2011)
Semi-arid at 1000-1500 m asl (Rubanza et al. 2007). Rainfall: 600-1200 mm/y (Otsyina et al. 2004) Max temperatures 27.6-30.20C (Hathout 1972)
Trend of agroforestry system
Increased by about twice the area in the 1990s to about 1.6 million ha (FAOSTAT 2013)
Increased by 100% since the 1990s to about 520,000 ha (FAOSTAT 2013)
Increased from 600 ha in 1986 to >350000 ha in 2003 (Mlenge 2004)
REDD partner country
Yes Yes Yes
UNEP- WCMC/ ICRAF data exists
Yes Yes Yes
A large number of people benefiting from the system
- 1.9 million people or 6.3% of population in 2004/2005 (Coulombe & Wondon 2007) - 700,000 smallholder farmers (Kolavalli & Vigneri 2011).
25% of population relies on coffee and coffee-related activities (Ejigie 2005) 95% of the coffee produced by smallholder farmers
2.8 million people living in the Shinyanga region (as of 2002). About $168/ capita/year contribution to rural livelihood (Duguma et al 2013)
Contribution to national economy
18.9% of the agricultural GDP of Ghana
36% of national export income in 2006/07 (Ejigie 2005)
No data available

24
2. METHODS FOR ECOSYSTEM SERVICES QUANTIFICATION, VALUATION
AND SCENARIOS ANALYSIS
2.1 Information acquisition and management
Documented sources were used to compile ES quantitative data and values in coffee, cocoa and Ngitili agroforestry systems in Ethiopia, Ghana and Tanzania, respectively. Search methodology consisted of targeted search strings with uniform key words for ecosystem services in online databases such as Google Scholar (see Appendix X for examples of search strings), complemented by forward and backward citation searches, as well as expert referrals to published and unpublished articles. The study mostly considered systems where trees existed on the same parcel of land with other agricultural components at the field or farm level, as opposed to a landscape level where crops are grown alone and tree benefits are accessed from a different land parcel. Biophysical and economic values of agroforestry ES were obtained directly for the case studies where available, however, when data was missing, literature from comparative locations was considered, accompanied with underlying assumptions and justifications. Information sources ranged from journal articles to grey literature and quality also varied from well-structured values with statistical details in terms of ranges and standard deviations, to percentages and qualitative descriptions of ‘increases’, ‘decreases’ or ‘no change’. Information was sometimes provided as means of the agroforestry system or as marginal difference in comparison to non-agroforestry system. Information on ecosystem service values was also supplemented by what could be estimated by using WaterWorld model. The values are presented on a per hectare basis in order to enable projections of changes in area coverage under different scenarios. Where values varied widely, different criteria and assumptions were used to determine a more credible range and mean. The baseline assessment assumed traditional practices, which often involved minimum external inputs; this was contrasted with scenarios of different levels of intensification as presented in the literature. Of the approximately 1400 potential studies found for coffee, cocoa and Ngitili agroforestry systems, approximately were 750 retained, for further screening based on relevance of reported outcomes. The second round of screening was based on relevance with regards to ecosystem services coming from association with trees especially within the case country as well as geographic and system plausibility for benefit transfer. These references based on the core subject were supplemented with documents on pricing, certification and institutional information. This final set of used studies was not documented but essentially coincides with the references listed for each system at the end of this study. Valuation of ecosystem services
2.1.1 Valuation of provisioning services For provisioning services, recent price data was used in relation to the physical units for the valuation estimates (e.g. $/headload of fuel wood). In cases where recent data did not exist or where values were only estimated, the closest approximation was obtained by adjusting reported prices from older publications for inflation and PPP (Brander et al. 2006; Brander et al. 2007; TEEB 2010; Costanza et al. 2014). Valuation data including market prices,

25
participatory valuation surveys, and the replacement cost approach was obtained from in-country studies. No price premiums were used in the baseline assessment. Where gaps existed, datasets from comparable situations were considered using benefit transfer, in which quantities of provisioning services from agroforestry systems in other countries (eg. Cameroon) were multiplied by local farm gate prices as estimated by FAOSTAT8. We note that this transfer approach can potentially lead to inaccurate estimates of ecosystem benefit values resulting from differences in contexts despite adjusting for PPP and inflation. Provisioning services were valued through their estimated gross margin (value of output less variable cost such as labour and input expenditures).
2.1.2 Valuation of regulating services
Carbon storage Carbon stocks were obtained from values of biomass (above and belowground) and soil carbon pools, but excluded litter and dead wood, which are very rarely quantified in literature. Most studies estimated biomass carbon directly. However where this was not the case, the biomass weight was multiplied by 0.5 to estimate biomass carbon in accordance with standard practice (Albrecht and Kandji, 2003; Glenday, 2006). Studies did not always consistently report across biomass carbon sources (e.g. only above ground biomass, or only total biomass of shade trees without quantifying that from the crop component) or soil depths. This led to challenges in comparing across systems. Wherever possible, biomass carbon sources were disaggregated into above and belowground pools, as well as separate biomass (cacao, coffee, and shade tree) pools. When belowground biomass values were not provided, values were imputed as 13% of the total value of biomass9 for cocoa (Norgrove and Hauser 2013) and based on above to belowground biomass estimates for coffee and fruit trees, derived from a study by Negash et al. (2015) of coffee ensete (a food crop in the banana family) and coffee-fruit tree agroforestry systems in the Gedeo zone of Ethiopia. Carbon stocks were valued by considering both private financial benefits to farmers through possible payments from carbon markets at $6.50/ton (Forest Trends 2013) 10, and as a global public good, using the social cost of carbon as represented by, inter alia, the United States Environmental Protection Agency (2013), the Stern Review on the Economics of Climate Change (2007), and Moore et al. (2015). The resulting estimation provided the lower and upper bounds of the carbon stock value in a sensitivity analysis. For the upper-bound carbon valuation estimates, the relatively low US EPA carbon social cost estimate of $39/ton11 was used, both in order to remain conservative12 and to better approximate the likelihood of developed countries’ willingness to pay for avoided emissions and emissions offsets in developing countries (eg. Beltran et al. 2013)). In order to ensure additionally of carbon stocks and results-based payment for REDD+, only additional carbon stocks relative to the baseline system (e.g. monoculture maize in Tanzania and Ethiopia, full sun/low shade cacao in Ghana) were monetized. The additional carbon stock was multiplied by the C-CO2eq conversion factor of 3.67, followed by the lower and upper bound values of the carbon price. Carbon C-CO2eq values were modelled as payments equally spread over a 20 year period. As
8 See http://faostat3.fao.org/download/P/PP/E. 9 Based on a biomass patitioning model from Zuidema et al. (2005). 10 Forest Trends (2014) gives $4.2/tonne CO2eq for REDD+ credits, $16.1/tonne CO2eq for agroforestry/sustainable agricultural land management credits, and an average value (across all credit types) of $5.2/tonne CO2eq. The 2013 values for agroforestry credits were used since they are more conservative. 11 The cost of one ton of emissions for the year 2015, expressed in 2011 dollars under a 3% discount rate was estimated at USD 39/tonne of CO2 equivalent emissions. Adjusting for two years of inflation gives a value of USD 40.3/tonne. 12 A recent study by Stanford University put the social cost of carbon at $ 200/tCO2-eq
26
such, the total value of the additional C stock in mature stands was divided by 20 to estimate annual results-based REDD+ payments per hectare. Estimates of implementation, transaction and institutional costs are needed in order for the valuation analysis to realistically depict the extent to which the value of carbon stocks could be captured by smallholders. A study of the cost components of four REDD+ pilot projects in Tanzania (LTS International and Unique Forestry 2012), estimated these combined costs at approximately $7.69 per hectare13. These cost estimates are more optimistic than those found elsewhere in the literature14, and mainly reflect a pilot project situation, and as such they may not show reductions due to institutional learning and economies of scale in National REDD+ Programmes. Intermediate regulating services Regulating services, such as erosion control and maintenance of soil fertility, biological control of pests and pollination services can be understood as intermediate ecosystem services which contribute to the final benefit of crop production. As such, they were not valued additively (i.e. in addition to the value of the crop provisioning services), but in terms of their incremental contribution to the final provisioning service as separate set of environmental service “flow” accounts. Different approaches used for valuation of these services are detailed in the subsections for each agroforestry system.
Pollination and pest control services
For pollination services, one of the preferred methods is the net attributable income method, in which the gross margin (value of output less variable costs) of the lost output and the net value of management measures to reduce further losses due to pollination failure are summed. This combines elements of both the change in productivity method (estimating contribution to production based on pollinator dependence of the crop) and the replacement cost method. However, since commercial markets do not exist for midges (principal pollinator of cocoa) or for social bees (for coffee pollination) in Ethiopia, it was decided to only value the percentage share of the gross margin of the final crop. This was also the approach for valuing the pest control services, supplemented by replacement cost and avoided cost estimates where relevant15. In order not to double-count the ecosystem service with labour and other inputs, for pest control and pollination only the contribution to the gross margin of the final crop service was estimated. Due to the nature of most of the information available, the average value (rather than the marginal value) of pollination and pest control services was assessed.
Soil fertility
This combines elements of both the change in productivity method (estimating contribution to production based on pollinator dependence of the crop) and the replacement cost method. Soil fertility and erosion control values were estimated using the replacement costs approach, valuing the differences in nitrogen (and, where available, phosphorous and potassium) stocks by multiplying the additional soil nutrients by the cost of urea and/or
13 Average of four projects with values of USD 5.9/ha, USD 8.9/ha, USD 6.2/ha and USD 3.9/ha respectively, giving
an average value of USD 6.23/ha in 2012 dollars. Adjusting these values to 2013 dollars using the GDP deflator for
Tanzania gives a value of USD 7.69/ha. 14 For example, based on information transaction costs information from Indonesia, Sandker et al. (2009), assume that
transaction costs for REDD+ measures in Indonesia could be as high as 75% of total REDD+ credit revenues. 15 Cost-based methods however do not necessarily measure preferences (Bockstael et al. 2001; Barbier 2007).
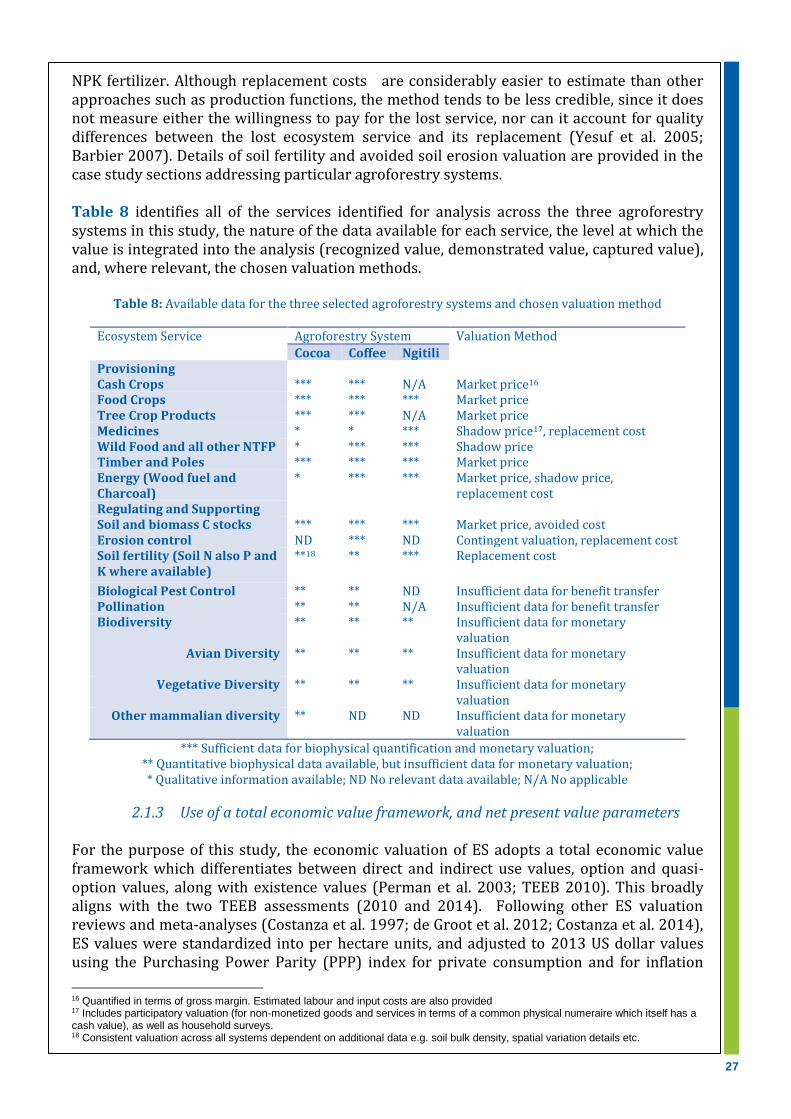
27
NPK fertilizer. Although replacement costs are considerably easier to estimate than other approaches such as production functions, the method tends to be less credible, since it does not measure either the willingness to pay for the lost service, nor can it account for quality differences between the lost ecosystem service and its replacement (Yesuf et al. 2005; Barbier 2007). Details of soil fertility and avoided soil erosion valuation are provided in the case study sections addressing particular agroforestry systems. Table 8 identifies all of the services identified for analysis across the three agroforestry systems in this study, the nature of the data available for each service, the level at which the value is integrated into the analysis (recognized value, demonstrated value, captured value), and, where relevant, the chosen valuation methods.
Table 8: Available data for the three selected agroforestry systems and chosen valuation method
Ecosystem Service Agroforestry System Valuation Method
Cocoa Coffee Ngitili Provisioning Cash Crops *** *** N/A Market price16 Food Crops *** *** *** Market price Tree Crop Products *** *** N/A Market price Medicines * * *** Shadow price17, replacement cost Wild Food and all other NTFP * *** *** Shadow price Timber and Poles *** *** *** Market price Energy (Wood fuel and Charcoal)
* *** *** Market price, shadow price, replacement cost
Regulating and Supporting Soil and biomass C stocks *** *** *** Market price, avoided cost Erosion control ND *** ND Contingent valuation, replacement cost Soil fertility (Soil N also P and K where available)
**18 ** *** Replacement cost
Biological Pest Control ** ** ND Insufficient data for benefit transfer Pollination ** ** N/A Insufficient data for benefit transfer Biodiversity ** ** ** Insufficient data for monetary
valuation Avian Diversity ** ** ** Insufficient data for monetary
valuation Vegetative Diversity ** ** ** Insufficient data for monetary
valuation Other mammalian diversity ** ND ND Insufficient data for monetary
valuation
*** Sufficient data for biophysical quantification and monetary valuation; ** Quantitative biophysical data available, but insufficient data for monetary valuation; * Qualitative information available; ND No relevant data available; N/A No applicable
2.1.3 Use of a total economic value framework, and net present value parameters For the purpose of this study, the economic valuation of ES adopts a total economic value framework which differentiates between direct and indirect use values, option and quasi-option values, along with existence values (Perman et al. 2003; TEEB 2010). This broadly aligns with the two TEEB assessments (2010 and 2014). Following other ES valuation reviews and meta-analyses (Costanza et al. 1997; de Groot et al. 2012; Costanza et al. 2014), ES values were standardized into per hectare units, and adjusted to 2013 US dollar values using the Purchasing Power Parity (PPP) index for private consumption and for inflation
16 Quantified in terms of gross margin. Estimated labour and input costs are also provided 17 Includes participatory valuation (for non-monetized goods and services in terms of a common physical numeraire which itself has a cash value), as well as household surveys. 18 Consistent valuation across all systems dependent on additional data e.g. soil bulk density, spatial variation details etc.

28
using the GDP deflators from the World Bank’s World Development Indicators database (World Bank 2015d; 2015e). Purchasing Power Parity equivalencies are preferable because they properly correct for differences in the buying power of a given currency between jurisdictions (Ready and Navrud 2006). Total economic value of the agroforestry systems is estimated by combining provisioning with regulating service values. The total asset value of each system is estimated as its net present value at maturity (i.e. full yield capacity) in real 2013 prices19 at a 10% real discount rate over a twenty-year time horizon. A 10% rate is chosen as the principal rate for sensitivity analysis because it accords with previous valuation studies for agroforestry systems in the country case studies (e.g. Monela et al. 2005; Obiri et al. et al. 2007; Reichuber et al. 2012; Asare et al. 2014), it is in line with the opportunity cost of loanable funds from multilateral development banks such as the Wold Bank. In the sensitivity analysis of the discount rate, this study used lower-bound rates of 2.5% and 7.5%, the former representing an ‘ethical’20 or ‘precautionary’ discount rate, and the latter approximates the estimated lower bound for the opportunity cost of capital in developing countries (Gockowski et al. 2013b). For the upper-bound estimate, a discount rate of 20% was used, which in Ghana “is the value which currently best reflects the time value of money” according to Gockowski et al. (2013). Sensitivity of key parameters was computed by calculating the standard deviation of the pooled means for each ecosystem service.21
The net present value was calculated using the standard formula:
In which “Bt” refers to benefits (total gross value of the provisioning and carbon services) for each year, “Ct” refers to costs for each given year, “t” refers to the entire sequence ranging from 1,2,….n, “n” refers to the number of years in the production cycle (20 years), and “i” refers to the discount rate. Put differently, the net present value is the gross margin for each year, subject to a (compounded) annual discount rate. The benefits-cost ratio was also computed using the standard formula of:
The internal rate of return (discount rate at which net benefits for a given land use equal zero) was also estimated for each system via the conventional formula:
19 i.e, inflation-adjusted. 20 Implying a near-zero rate of pure time preference (as in Stern et al. 2007), a relatively low elasticity rate for marginal utility of consumption, as well as a relatively low projected economic growth rate. 21 Excepting cases where only one pertinent study was found.

29
Economic and financial assessment of different cocoa production systems is is complicated by the fact that these systems oftentimes differ from each other in terms of both biophysical and economic rotation lengths. The net present value indicator has shortcomings in this situation as it“cannot be used to directly compare the profitability over rotations of
different lengths nor of a series of rotations” (Obiri et al. 2007), but the land expectation value indicator can be used to assess systems with differing rotation lengths or ove multiple rotations instead. It is computed via the formula below:
Where ecosystem values were provided as such in literature, these were used to check the accuracy of the calculated value. Where discrepancies were found, it was decided that studies outside the range of plausible values for the relevant system as assessed by expert opinion would not be retained for the analysis. While TEV can be used to identify all possible values from ecosystem services for a given land use, including non-marketed values, marginal valuation between land uses is also important as this is a critical influence on farm-level adoption decisions. Marginal values were assessed through pairwise or trinary comparisons of the gross margin from agroforestry systems on the one hand, and more conventional production systems (simplified cash crop or monoculture staple crop systems) on the other.
2.2 GDP of the Poor
GDP of the poor is a metric designed to provide a holistic measure of the incomes and livelihoods of poor natural resource-dependent (NRD) communities, relative to ‘conventional’ GDP. It integrates economic, environmental and equity considerations, by incorporating the values of non-marketed provisioning, regulating and supporting services, and by incorporating equity weights into national accounts statistics (TEEB 2010b). Computing the GDP of the poor involves a stepwise process of: (1) Identifying the country’s GDP; (2) Estimating the contribution of agriculture, forestry, livestock and fishing to GDP; (3) Identifying the relative contribution from poor NRD communities (in this case,
smallholder agroforestry) to GDP; (4) Identifying the total population of smallholder agroforestry farmers; (5) Estimating the per capita GDP of the smallholder agroforestry farmers by multiplying the
output values from the agroforestry system by the fraction of the total agroforestry system hectarage managed by smallholder agroforestry farmers;
(6) Incorporating the value of non-marketed provisioning and regulating services to the GDP of the poor estimate;
(7) Dividing the adjusted GDP of the poor estimate by the population of smallholder agroforestry farmers to estimate the per capita GDP of the poor;
(8) Adjusting these values in accordance with equity weights, to capture the higher utility that low income communities derive from consumption and income via sale of agroforestry-related ecosystem goods and services;
Following TEEB (2010b), this study uses the ratio of the ‘top of pyramid’22 to the ‘bottom of pyramid’ expenditures on food (approximately $3000 and $500 per household per year respectively according to Hammond et al. (2007) for various sub-Saharan African countries.
22 i.e. lower-income households.

30
The indicators used to identify the population set of poor smallholder agroforestry farmers, as well as the equity weights used to adjust the per capita GDP of the poor estimates, are country-specific and will be discussed in more detail within the country case studies. The GDP of the poor calculations are meant to be illustrative and are not without limitations. First among these is that the gross output values of the systems are used to compute the GDP of the poor, whereas a strict accounting for GDP requires deducting for intermediate consumption and subsidies, as well as accounting for values of indirect taxes. We were unable to do so due to limitations in the available data. Even more importantly, accounting for GDP of the poor from agroforestry systems should only estimate the net value of gains and losses from ecosystem services from land use change (eg. forest clearing for agriculture; or transition from more simplified to multifunctional systems). Otherwise the GDP of the poor accounts may in fact by obscuring a net loss to ecosystem services from deforestation, be highly misleading. Assessing how net gains and losses from land use change to agroforestry would affect GDP of the poor is highly important, but also context specific and requiring large amounts of data on land use change, and hence was beyond the scope of this report. Moreover, assessing net gains and losses in ecosystem services depends on a multitude of factors, such as the baseline or point of reference for the assessment of net gains or losses. To take the instance of Ghana, if the reference year is taken as 1900, this would arguably imply that most cocoa and other cash crop land uses in the past century entailed a net loss of ecosystem services, given that so much forest frontier was cleared for extensive agriculture (eg. Gockowski et al. 2011a). Nonetheless, despite the limitations in the analysis, the GDP of the poor calculations still provide important insights on how marketed and non-marketed ecosystem services contribute to the well-being and livelihoods of poor NRD communities.
Trends and scenarios
Understanding ES values from agroforestry systems is more complete when viewed within the context of the gains and tradeoffs likely to occur under different potential land uses, and can be explored using scenarios. Scenarios are “coherent, internally consistent storylines that explore plausible future states of the world or alternate states of a system” (adapted from IPCC 2013). In the context of this study, scenarios are considered in two different ways. First, existing variations of the agroforestry systems under consideration (e.g. contrasting full sun and high shade cacao agroforestry systems) or alternative land uses are explored and the value the ES in and from these systems quantified from literature review (as described above). Second, a number of possible alternative future states for existing areas under agroforestry are considered for each case study area and the consequences for the ecosystem services in and from these systems is modelled. Developing the pathways and timelines that would allow reaching any of these future states can be done afterwards to help support policy and decision-making using a so-called “anticipatory scenarios” development process. Anticipatory scenarios, or decision-support scenarios, develop paths to pre-determined futures that vary according to their desirability (van Notten et al. 2003). Scenarios considered for the different systems fell under the following major categories, which are elaborated more specifically for each case study context where underlying assumptions and justifications are provided.
31
Baseline: ES in target system in its current state in the case-study country (all three countries)
Increase of % (shade) trees cover in the existing system (all three countries) Expansion of agroforestry into all areas currently under other cropping or grazing
(Ethiopia and Tanzania) land use Reverse scenario where all areas currently under agroforestry are turned into
monocultures (of the dominant food/cash crops in the region for example, or an emerging cash crop) (Ethiopia and Tanzania).
Modelling The WaterWorld model was used to analyze scenario-driven changes in tree cover (to represent expansion or reduction in area under agroforestry vs other covers) and their implications for the following ecosystem services: freshwater provision and runoff, increased water quality, above ground carbon stock and reduction of soil erosion. Data and pre-processing steps include:
MODIS VCF (vegetation continuous field) based on Landsat satellite imagery at 30 metre resolution (Sexton et al. 2013)
Landsat based data on built up areas at 25 metre resolution (JRC-GHSL; Pesaresi et al. 2012)
Maps of target agroforestry systems in the case-study countries, digitized from satellite imagery and ancillary information.
Maps of watersheds/sub-basins overlaid with the case study areas in order to assess changes in water provision and runoff based on Hydrobasins data (Lehner and Grill, 2013)
Translation of the target agroforestry system in each country into a "typical" or average ratio of tree/other vegetation/bare cover based on data from literature (as parameters in the model)
Equations describing the relationship between tree-, canopy- and/or crown cover with carbon stock based on data from literature.
The WaterWorld model (Mulligan, 2011) v3 is a fully distributed, process-based hydrological model that utilizes remotely sensed and globally available datasets but can be supplemented with local data. In order to simulate the total extent of the case study areas in each country, the model was implemented at 1-ha resolution for one degree square tiles (the maximum simulation extent at this resolution). The simulation includes seven tiles for coffee, six for cacao and seven for Ngitili under each scenario. This meant 28 models runs for coffee in Ethiopia, 18 for cacao in Ghana and 21 for Ngitili in Tanzania. For each tile, baseline and scenario land cover and use data was prepared for the three fractional functional land use types tree cover, bare cover and herbaceous cover at 30 metre resolution and introduced to the model. Scenarios for conversion to monoculture where prepared using the WaterWorld's built-in land use change model which allows for the conversion of existing land cover to different agricultural systems by setting values for the three functional land use types. These changes were applied to areas identified as agroforestry and for some scenarios also for areas classified as non-agroforestry land use. To obtain representative values for tree and bare cover for maize mono cropping in Ethiopia and Tanzania, VCF values were compared with areas where maize is grown in the year 2000 based on fractional data from Monfreda et al (2008) using a threshold of 0.10. Since this dataset is fairly coarse (~10km), the higher resolution dataset of Fritz et al (2015) was used to refine this analysis by identifying cropland areas within the maize growing areas. Converted areas were set to cropping use in

32
the model which impacts the Human Footprint Index (Mulligan, 2011) of potential water pollution. Values for fractional tree cover for the increased shade tree scenarios were based on representative values from the literature. The results of the scenario modelling are in form of maps of pixel values (biophysical units or indices) for each ecosystem service, aggregated for the case-study area districts. The model requires tree cover to be expressed in terms of canopy cover. However, classifications of coffee, cocoa or Ngitili agroforestry systems in relation to shade or canopy cover are not consistent in literature. In coffee systems terms such as “filtered shade” and “shade cover” are used, which in this study are assumed to refer to canopy cover. In cocoa, shade tree density is often used to indicate the level of shading, but this does not always correlate with actual shade provided (Acheampong et al. 2014). For coffee in Ethiopia, no consistent standard ranges were found for the different systems, and a minimum canopy cover of 60% was chosen for the modelled increased shade scenario, which represents semi-forest coffee systems based on field measures by Aerts et al (2011). For cocoa in Ghana, the minimum canopy cover for full shade systems was set to 30% (equivalent to approximately 37.5% crown cover) to match the recommendations for crown cover (30-40%) by the Cocoa Research Institute of Ghana (CRIG) (Acheampong et al. 2014). For Ngitili, little consistent data on existing and preferred canopy cover was found, so an increase of existing canopy cover to a minimum of 20% was chosen for the increased tree cover scenario, based on values found for private Ngitili in Shinyanga region by Selemani (2015). There is no timeline set for scenarios in the modelling, rather, the scenario analysis is based on a static modelling approach where a modelled baseline can be compared to a future state situation. The time to achieve these changes depend on growth rates of trees (for the tree cover increase scenarios) or on the time needed to convert a tree-based system into a monoculture annual crop, but also on the speed at which the factors driving these changes operate. Further analysis of interventions that may lead to the changes as modelled under these scenarios can provide information on the time required to reach the modelled end-states. This can help inform policy development towards the more desired outcomes. Mapping of case study areas for model analysis The models used to quantify implications of various scenarios on ecosystem services were spatially explicit. As no recent national level maps of agroforestry could be obtained, spatial mapping of cocoa agroforestry locations was conducted based on areas that could be identified as cocoa agroforestry systems using the following method. This approach ended up with a smaller area than what is provided in more recent literature, however given the limitation of the mapping sources such as cloud cover and some vegetation indices that could not be explicitly differentiated from agroforestry cover), this smaller area was assumed, for modelling purposes, to be a sample of the larger area. By using Landsat8 images from USGS Glovis for the years 2013/14 as per availability of quality images for each agroforestry system, raster stacked layers to the Area of Interest (specific districts), identified according to literature reviews (Ghana Child Labour Study report 2006; Davis et al. 2012; Monela et al. 2005 etc.), were clipped. Ghana Cocoa agroforestry areas were identified through a team discussion using polygon shape files from Google Earth by first eliminating what was clearly not agroforestry (Non-AF) then an assumption of what could be cocoa, classified as agroforestry cocoa, full sun Cocoa or shrub land. This was done by saving polygon shape files from Google Earth, which

33
are picked at the exact pixel for the non-agroforestry (NonAF) land use such as settlements, roads, croplands, and palm oil (identified clearly by the regularity of grid plantation) and overlaying it on the satellite maps. Cocoa agroforestry area is assumed to be what is other than any other visible land use outside forest reserve areas. It was assumed that cocoa agroforestry would be unlikely to be inside forest reserves, even though we might have some pixels inside the forest reserve as well as some other land covers. Maps scales ranged between 1:150000 and 1:200000. For coffee agroforestry in Ethiopia, sample GPS points were collected from “Gedeo Zone” and used to identify coffee agroforestry and NonAF landuse, Google Earth images used to identify other landscapes then created signature file for Maximum likelihood supervised classification using ArcGIS finally classified the clipped image in to four classes; coffee agroforestry, Forest, nonAF Land use and No Data. For Ngitili in Tanzania, sample GPS waypoints were collected from some districts in Shinyanga region to identify Ngitili systems (grazing shrub land enclosed during rainy season), Non Ngitili land use (classified as and Google Earth images used to identify other landscapes then created signature file for maximum likelihood supervised classification used to classify the clipped satellite image using ArcGIS to different classes Ngitili system, forest and game reserve, non Ngitili land use and no data. The results are presented as raster datasets tiff and jpeg images. Within Ngitili. Large treeless spaces, were termed as open Ngitili. The area extent of maps did not match what was obtained in literature and differed as outlined below. Therefore, these areas were considered to be samples used for baseline areas in model-based analysis. Ngitili with only shrubs (roughly 2 m high, and packed together) and no trees was explained as Ngitili with open shrubs.
Cocoa agroforestry: Sample area of AF system extent using GIS data is 206,000 ha from the various districts where cocoa agroforestry occurs. This is 13% the estimated area of 1.6 million ha under cocoa cultivation in Ghana by FAOSTAT (2013). Coffee agroforestry: Sample area of AF system extent using GIS data is 202,432 ha from the various districts where coffee agroforestry occurs. This is about 39% the estimated area of 520,000 under coffee cultivation in Ethiopia by FAOSTAT (2013). Ngitili: Sample area of AF system extent using GIS data is 1.3 million ha from the various districts where Ngitili occurs. This is about 3.56 times the Ngitili extent area of 300,000-500,000 ha (median 370,000 ha) reported in literature.

34
The modelled ecosystem services: Freshwater provision and runoff Freshwater provision is simulated through the water yield or the quantity of water which can be collected for a given use from surface or groundwater sources in a basin in a given time interval. Runoff is that part of the precipitation that appears in surface streams. It is the same as stream flow unaffected by artificial diversions, storage, or other works of man in or on the stream channels. WaterWorld simulates a hydrological baseline as a mean for the period 1950-2000. Water yield in the model is calculated as wind-driven rainfall plus fog inputs minus actual evapo-transpiration according to climate and remotely sensed vegetation cover. Values for (wind-driven) precipitation and evapotranspiration are calculated at pixel level. This means that water yield can be calculated for each area of interest. Runoff is that part of the water balance that remains after vegetative use and ends up in streams. Water yield in a district therefore provides information on impacts on water within a district, whereas impacts on runoff depend on the position of the district relative to basins and rivers. Changes in the provision of freshwater are calculated for each case study area by summing the mean change in water yield (mm/year) over the total area of the agroforestry districts. Water yield is cumulated downstream along a terrain-derived flow network to obtain runoff. This analysis was conducted at the sub-basin level. Sub basins were selected from the Hydrobasins dataset based on those that overlapped most with the study areas to maximize the likelihood that changes in run-off were related to changes in tree cover in the study areas. Changes in water yield in m3 are reported for each district and in mm so that districts can be compared. Water quality Water quality is simulated through an indicator of the potential level of contamination of water by human activities. The WaterWorld model generates this indicator as a so-called human footprint on water quality index (Mulligan 2009), which is an index of the extent to which water is affected by upstream and local human activities, including changes in vegetation. The model takes into account point source polluting activities such as mining, oil and gas, roads and urban areas and agricultural areas. The index is calculated based on the assumption that higher proportions of bare ground including areas without vegetation such as rocks, roads, urban areas etc., have higher human influence and therefore lead to higher levels of contamination. In addition, land use is included as a potential source of pollution. E.g. agricultural use leads to higher levels of potential pollution than more natural vegetation cover. Soil erosion Soil erosion (the total amount of soil loss per unit area) within WaterWorld is modelled for each pixel, taking into account deposition and transport, by using an erosion equation according to Thornes (1990):
E=kQmSn*e-0.07*Vc
Where: E= erosion (mm/month) , k= soil erodability, Q= runoff (mm/month), m = Manning's m (value of 1.66),
S = tangent of slope, n = slope constant (2.0) and Vc = vegetation cover (%)

35
The model output values in mm (for soil erosion and water) were used to calculate the mean value for the whole district, which was then multiplied by the total area in hectares of the district to get the total value in the district. Since the focus was on district areas it made more sense to report the soil erosion in tonnes/ha for the district, rather than the sediment yield as that is confined to basins. The area considered includes all land use types both within and outside agroforestry areas for the baseline and scenarios. In practice, only areas of agroforestry are of interest, but since the same was done for baseline as well, the total value of the change is not affected, although the values per ha would be different. The mean values only for areas under agroforestry (for scenarios where only changes in that extent take place) were not calculated for this study, but can be considered for future assessments as this would allow incorporation of modelled estimates into the cost-benefit analysis. Carbon stocks in trees in cocoa systems in Ghana To estimate carbon stock for each district carbon values based on ground-based measurements from Acheampong et al. (2014) are used. This report estimates values of average carbon stocks in shade trees in cocoa agroforestry systems in Ghana at 8.32 ±1.15 Mg C ha-1 and average carbon stocks in cocoa trees at 7.45 ±0.41 Mg C ha-1 (range 5.84 ±0.91 to 8.65 Mg C ha-1).The report also notes that carbon stocks in cocoa trees were similar across the study districts and that distribution of carbon stocks between cocoa and shade trees averaged 48% and 52% respectively. Landsat VCF data detects canopy cover for tree heights of 5 metres or more, so only these trees are modelled in WaterWorld. Since it is not possible to distinguish between shade tree and cocoa trees that are more than 5 m high in the Landsat VCF data, and the average tree height in cocoa agroforestry systems in Ghana is 6.2 metres (Acheampong et al. 2014), the study averaged the mean carbon stock for shade trees (8.32) and the mean carbon stock for cocoa trees (7.45) to obtain an average value of 7.89 Mg C ha-1. This implies an assumption that the distribution of canopy forming trees among cocoa and shade trees is approximately equal. In reality this may vary, but is likely still within the ranges of possible values. Information on what percentage of cocoa trees is above 5 metres height would allow for a more precise estimation. For cocoa systems, belowground or root biomass for tree and cocoa components was estimated to be 13% of total biomass based on Norgrove and Hauser (2013). The percentage crown cover in each grid cell was calculated by dividing the percentage VCF canopy cover value with 0.8 to obtain the percentage crown cover (capped at 100%) (Hansen et al. 2003; Powell et al. 2012). This allowed for the calculation of the total aboveground carbon stock in each grid cell using the highly significant relationship between (shade) tree crown cover and carbon stocks found by Acheampong et al (2014) as:
C stock (Mg C /ha) = 0.8566 * crown cover % - 0.5507 * (1+0.13)23 This represents the carbon stock for all trees, including shade trees and cocoa, above 5 metres height. Carbon stocks in trees in coffee systems in Ethiopia and Ngitili in Tanzania No equation describing the relationship between crown cover and carbon stock or biomass such as the one for cacao was found for coffee and Ngitili agroforestry systems. The study therefore adapted the methodological tool to estimate carbon stocks of trees by
23 Ratio of aboveground to belowground biomass from Norgrove and Hauser (2013). Note that belowground carbon stocks were note estimated in the scenarios analysis, and hence are omitted from the equation in that instance.

36
proportionate crown cover developed for use in afforestation and reforestation (A/R) clean development mechanism (CDM) project activities published by the UNFCCC (UNFCCC, n.d.), where:
C stock (Mg C/ha) = (44/12) * CFtree * bforest * (1 + Rtree) * CCtree
Where: CFtree= carbon fraction of tree biomass (default value of 0.47), bforest= mean above ground biomass in
the country or region where the assessment takes place, Rtree= shoot-root ratio, and CCtree= tree crown cover in %
The value of bforest for Tanzania and Ethiopia was obtained from published tables on mean above ground biomass for countries from the IPCC Good Practice Guidance for Land Use, Land use change and Forestry (GPG-LULUCF; IPCC, 2003). The mean value for Tanzania is 60 t of dry matter per hectare (d.m /ha) and for Ethiopia is 79 t d.m./ha. In order for the scenarios analysis to remain consistent with the estimates for cocoa agroforestry which are only based on above ground carbon, the value for shoot-root ratio was kept at zero as to not include root carbon. However, for the cost-benefit analysis, a root-shoot ratio of 0.25 was used for coffee agroforestry in Ethiopia (based on Negash and Starr (2014) and Ngitili (based on the UNFCCC default value for Tanzania). As for Ghana, the carbon stock values estimated here represent the carbon stock for all trees, above 5 metres height, and similarly, this approach does not account for changes in other carbon stocks such as leaf litter, dead wood etc. To estimate carbon stock for each district, the study used the CDM methodological tool developed by UNFCCC (AR-AM tool 14-v4.1) which estimates carbon stock by proportionate crown cover using this equation:
CTREE BSL,i = 44/12 x CFTREE x bFOREST x (1+RTREE) x CCTREE BSLi x Ai where: CTREE BSL,i = Carbon stock in pre-project tree biomass stratum i; t CO2e CFTREE = Carbon fraction of tree biomass; t C (t.d.m)-1.
A default value of 0.47 t C (t.d.m.)-1 is used. bFOREST = Mean above-ground biomass in forest in the region or country where A/R CDM project
is located; t.d.m. ha-1. Values from Table 3A. 1.4 of IPCC GPG-LULUCF 2003 are used unless transparent and verifiable information can be provided to justify different values.
RTREE = Root-shoot ratio for trees in the baseline; dimensionless. A default value of 0.25 is used unless transparent and verifiable information can be provided to justify a different value.
CCTREE BSLi = Crown cover of trees in baseline stratum i, at the start of the A/R CDM project activity,
expressed as a fraction (e.g., 10% crown cover implies CCTREE BSLi = 0.10); dimensionless
Ai = Area of baseline stratum i, delineated on the basis of tree crown cover at the start of the
A/R CDM project activity; ha

37
For Tanzania the bforest value is 60 and for the area of baseline stratum the study employed a value of 1 (hectare). To be consistent with estimates of tree carbon change under scenarios for other agroforestry regions (cocoa, Ghana) the root shoot ratio to account for carbon stored in roots was not included. Implications on food security and resilience The implication of diversified or multifunctional agroforestry systems for food security and resilience is discussed. The United Nations Food and Agriculture Organization defines food security as “all people, at all times…[enjoying] physical and economic access to sufficient, safe and nutritious food to meet their dietary needs and food preferences for an active and healthy life” (FAO 1996). It encompasses not only sufficient kilocalories per day, but also micronutrient sufficiency and dietary diversity. Food security is typically analyzed in terms of four dimensions, namely food availability, accessibility, utilization and stability (FAO 2008; Mohamed-Katerere and Smith 2012). Food security is also closely connected to the concept of ecosystem stability, a property where ecological systems can return to a previous equilibrium or level of functioning following a perturbation to the system (eg. Holling 1973). It also has close connections to the concept of resilience, a feature of social-ecological systems wherein a system is capable of “absorb[ing] …[a] disturbance and reorganize while undergoing change so as to still retain essentially the same function, structure, identity, and feedbacks” (Walker et al. 2004). Applying the resilience concept to the farm and household levels, this implies the ability of households to adapt to changing socio-economic and ecological circumstances and maintain a diverse livelihood portfolio. Thus, managing agroecosystems for yield stability and household livelihoods for resilience implies placing emphasis not solely on maximizing productivity, but on maintaining the underpinning regulating and supporting ecosystem services (Mohamed-Katerere and Smith 2012; Méthot 2012) as well as livelihood diversifcation.
Limitations and caveats of modelling results Agroforestry systems are typically highly diverse which means that all values in the baseline and modelled outputs have large variances. The results of the modelling exercise should therefore only be used to assess change between the baseline and alternative scenarios and not to infer actual values of the systems themselves. For some changes that are calculated on a per pixel basis we can assume linearity over larger areas (e.g. carbon). For others this is not possible as the relationships are not linear or values are dependent on the flow of services from upstream (e.g. soil erosion, run-off etc.). Data gaps Inconsistency in definitions of agroforestry systems and criteria used to classify them.
An important factor affecting the implementation of the scenarios analysis in this study,
was the lack of spatial data on agroforestry systems. For agroforestry systems, detailed spatial analysis is incredibly hard to capture since especially with woody perennials, it is not always easy to tell shaded from full sun systems. Due to the heterogeneity in these systems, there will be large variation in ecosystem services values. Therefore a robust assessment of agroforestry benefits for ecosystem services are best assessed using ground based measurements. Efforts for on the ground or expert-opinion based mapping of these systems help to support more accurate scenario modelling. However, higher resolution RS data is becoming available and newer techniques such as LIDAR based
38
measurements provide opportunities for better assessment and modelling of ecosystem services in agroforestry landscapes.
Lack of established relationships between data used or produced by models able to link land cover and land use to ecosystem services, with the biophysical characteristics of the systems under consideration. Such as for example the relationship between above ground carbon stocks and canopy cover.
Key regulating services such as pollination, pest control, soil improvements and
biodiversity could not be quantified or monetized, which means the estimates made in this study are much lower than the true of agroforestry systems. Bringing together data generated in different contexts and at different scales also introduced error in the estimates made.
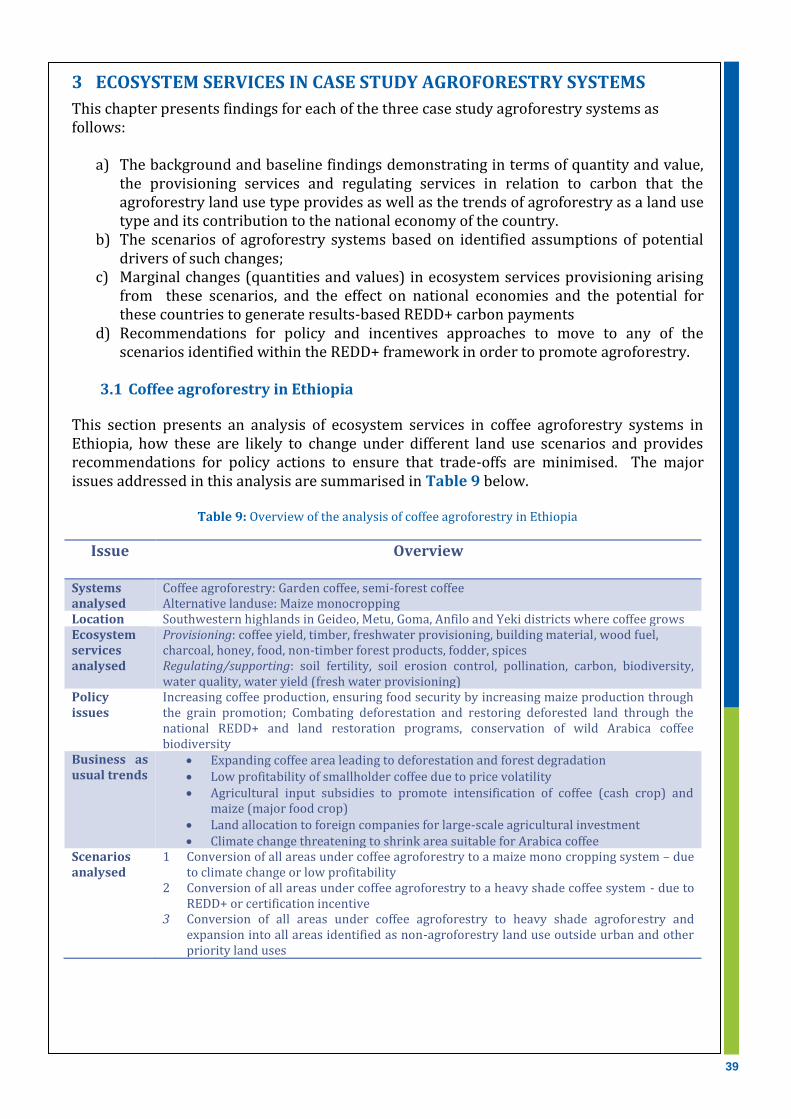
39
3 ECOSYSTEM SERVICES IN CASE STUDY AGROFORESTRY SYSTEMS
This chapter presents findings for each of the three case study agroforestry systems as follows:
a) The background and baseline findings demonstrating in terms of quantity and value, the provisioning services and regulating services in relation to carbon that the agroforestry land use type provides as well as the trends of agroforestry as a land use type and its contribution to the national economy of the country.
b) The scenarios of agroforestry systems based on identified assumptions of potential drivers of such changes;
c) Marginal changes (quantities and values) in ecosystem services provisioning arising from these scenarios, and the effect on national economies and the potential for these countries to generate results-based REDD+ carbon payments
d) Recommendations for policy and incentives approaches to move to any of the scenarios identified within the REDD+ framework in order to promote agroforestry.
3.1 Coffee agroforestry in Ethiopia
This section presents an analysis of ecosystem services in coffee agroforestry systems in Ethiopia, how these are likely to change under different land use scenarios and provides recommendations for policy actions to ensure that trade-offs are minimised. The major issues addressed in this analysis are summarised in Table 9 below.
Table 9: Overview of the analysis of coffee agroforestry in Ethiopia
Issue
Overview
Systems analysed
Coffee agroforestry: Garden coffee, semi-forest coffee Alternative landuse: Maize monocropping
Location Southwestern highlands in Geideo, Metu, Goma, Anfilo and Yeki districts where coffee grows Ecosystem services analysed
Provisioning: coffee yield, timber, freshwater provisioning, building material, wood fuel, charcoal, honey, food, non-timber forest products, fodder, spices Regulating/supporting: soil fertility, soil erosion control, pollination, carbon, biodiversity, water quality, water yield (fresh water provisioning)
Policy issues
Increasing coffee production, ensuring food security by increasing maize production through the grain promotion; Combating deforestation and restoring deforested land through the national REDD+ and land restoration programs, conservation of wild Arabica coffee biodiversity
Business as usual trends
Expanding coffee area leading to deforestation and forest degradation Low profitability of smallholder coffee due to price volatility Agricultural input subsidies to promote intensification of coffee (cash crop) and
maize (major food crop) Land allocation to foreign companies for large-scale agricultural investment Climate change threatening to shrink area suitable for Arabica coffee
Scenarios analysed
1 Conversion of all areas under coffee agroforestry to a maize mono cropping system – due to climate change or low profitability
2 Conversion of all areas under coffee agroforestry to a heavy shade coffee system - due to REDD+ or certification incentive
3 Conversion of all areas under coffee agroforestry to heavy shade agroforestry and expansion into all areas identified as non-agroforestry land use outside urban and other priority land uses
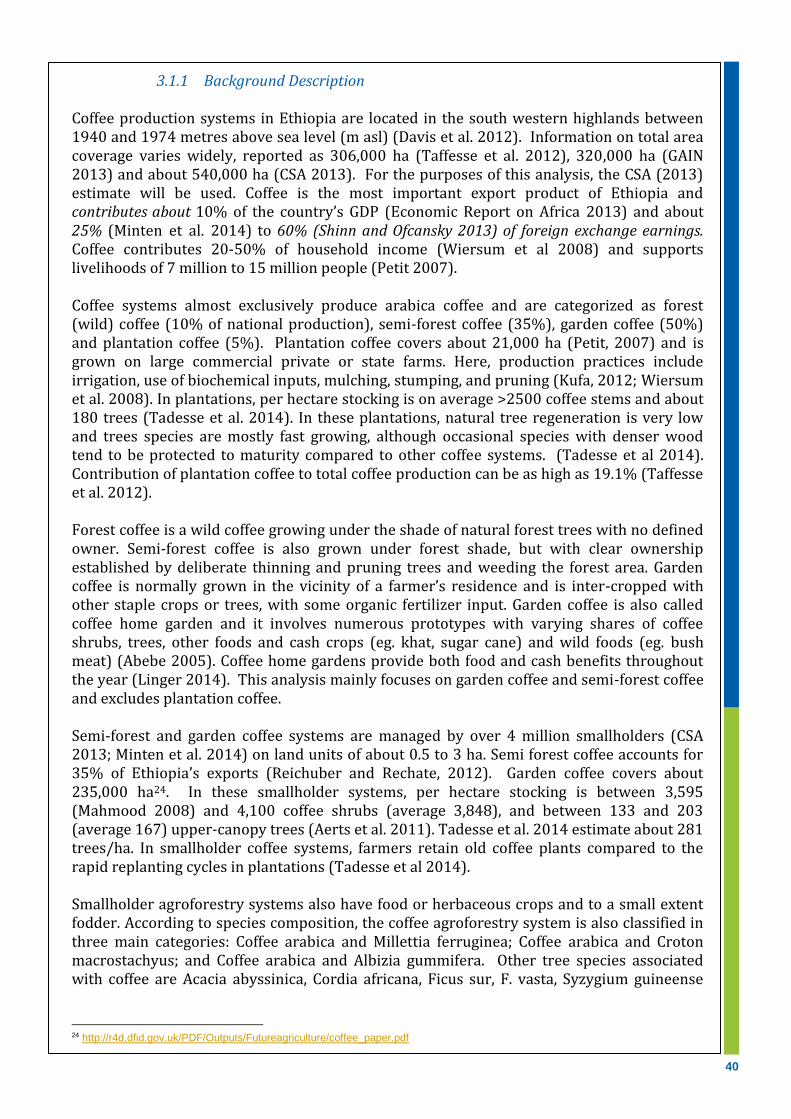
40
3.1.1 Background Description Coffee production systems in Ethiopia are located in the south western highlands between 1940 and 1974 metres above sea level (m asl) (Davis et al. 2012). Information on total area coverage varies widely, reported as 306,000 ha (Taffesse et al. 2012), 320,000 ha (GAIN 2013) and about 540,000 ha (CSA 2013). For the purposes of this analysis, the CSA (2013) estimate will be used. Coffee is the most important export product of Ethiopia and contributes about 10% of the country’s GDP (Economic Report on Africa 2013) and about 25% (Minten et al. 2014) to 60% (Shinn and Ofcansky 2013) of foreign exchange earnings. Coffee contributes 20-50% of household income (Wiersum et al 2008) and supports livelihoods of 7 million to 15 million people (Petit 2007). Coffee systems almost exclusively produce arabica coffee and are categorized as forest (wild) coffee (10% of national production), semi-forest coffee (35%), garden coffee (50%) and plantation coffee (5%). Plantation coffee covers about 21,000 ha (Petit, 2007) and is grown on large commercial private or state farms. Here, production practices include irrigation, use of biochemical inputs, mulching, stumping, and pruning (Kufa, 2012; Wiersum et al. 2008). In plantations, per hectare stocking is on average >2500 coffee stems and about 180 trees (Tadesse et al. 2014). In these plantations, natural tree regeneration is very low and trees species are mostly fast growing, although occasional species with denser wood tend to be protected to maturity compared to other coffee systems. (Tadesse et al 2014). Contribution of plantation coffee to total coffee production can be as high as 19.1% (Taffesse et al. 2012). Forest coffee is a wild coffee growing under the shade of natural forest trees with no defined owner. Semi-forest coffee is also grown under forest shade, but with clear ownership established by deliberate thinning and pruning trees and weeding the forest area. Garden coffee is normally grown in the vicinity of a farmer’s residence and is inter-cropped with other staple crops or trees, with some organic fertilizer input. Garden coffee is also called coffee home garden and it involves numerous prototypes with varying shares of coffee shrubs, trees, other foods and cash crops (eg. khat, sugar cane) and wild foods (eg. bush meat) (Abebe 2005). Coffee home gardens provide both food and cash benefits throughout the year (Linger 2014). This analysis mainly focuses on garden coffee and semi-forest coffee and excludes plantation coffee. Semi-forest and garden coffee systems are managed by over 4 million smallholders (CSA 2013; Minten et al. 2014) on land units of about 0.5 to 3 ha. Semi forest coffee accounts for 35% of Ethiopia’s exports (Reichuber and Rechate, 2012). Garden coffee covers about 235,000 ha24. In these smallholder systems, per hectare stocking is between 3,595 (Mahmood 2008) and 4,100 coffee shrubs (average 3,848), and between 133 and 203 (average 167) upper-canopy trees (Aerts et al. 2011). Tadesse et al. 2014 estimate about 281 trees/ha. In smallholder coffee systems, farmers retain old coffee plants compared to the rapid replanting cycles in plantations (Tadesse et al 2014). Smallholder agroforestry systems also have food or herbaceous crops and to a small extent fodder. According to species composition, the coffee agroforestry system is also classified in three main categories: Coffee arabica and Millettia ferruginea; Coffee arabica and Croton macrostachyus; and Coffee arabica and Albizia gummifera. Other tree species associated with coffee are Acacia abyssinica, Cordia africana, Ficus sur, F. vasta, Syzygium guineense
24 http://r4d.dfid.gov.uk/PDF/Outputs/Futureagriculture/coffee_paper.pdf

41
(Geyid et al., 2005) and others (FAO 1968; Taye, 2001). The common alternative land use in the coffee areas is maize monocultures. The five districts where coffee is grown in Ethiopia (Table 10 and Figure 5) were the focus of the baselines and scenarios analysis.
Table 10: Key characteristics of coffee agroforestry districts in Ethiopia
District Elevation min (m.a.s.l.)
Elevation max (m.a.s.l.)
Total agroforestry Area ( km2)
District area (km2)
Mean canopy
cover (%)
Geodeo 1491 3,086 1,417 1366 32.6
Metu 856 2061 765 1422 35.2 Goma 1386 2698 1,593 1155 31.7
Anfilo 450 2574 1,169 1651 28.7
Yeki 927 2587 878 621 51.0
Figure 5: Coffee agroforestry districts, location and elevation in Ethiopia
3.1.2 Baseline Quantification and valuation of ecosystem services in coffee agroforestry
Quantities and values of the various ecosystem services of coffee agroforestry systems were obtained from literature, but the categorization of the systems did not always conform to those adopted by this study. Some studies identified agroforestry systems as simply shaded coffee or coffee agroforestry without distinguishing between semi-forest, forest, shaded plantation or garden coffee. Where coffee agroforestry was not explicitly identified, the system was identified as homegarden, which is the most common form of coffee agroforestry. Where appropriate, the numbers given for these systems were used to check the accuracy of the best average estimate of quantity of each ecosystem service from different sources. The valuation process described above was used to convert the estimated quantities into monetised or other values. Ecosystem services from semi-forest and garden coffee were compared with those of monoculture maize.

42
Coffee Agroforestry Provisioning Services Coffee yields vary widely both within and between production systems due to variation in management practices (Schmitt et al. 2009). From literature, average annual coffee yield was approximately 300 kg/ha for semi-forest and around 343 kg/ha for garden coffee systems. Coffee agroforestry yields are lower than the national average coffee yields as estimated by FAOSTAT (approx. 520 kg/ha), which are likely to be skewed upwards by inclusion of plantation coffee yields. At the national level, using the 201225 production value of around 275,000 tonnes (United Nations Food and Agriculture Organization, 2015) and multiplying it by the percent shares of coffee agroforestry, gives about 96,000 and 137,000 tonnes of coffee produced under semi-forest and garden coffee. Given the coffee 2014/2015 export revenues of $862 million26, the 85% contribution from agroforestry comes to an export value of $732.7 million. Total coffee output in the modelled agroforestry system extent ranges from 60,000 to 69,000 tonnes, with a monetary value ranging from $101 million to $115 million per annum (which is about 39% of the total value due to the sample area used in modelling). Coffee agroforestry provisioning ES values are presented in Figure 6. In addition, these agroforestry systems produce per annum approximately $2 million to $29 million in consumptive value of fuelwood as estimated by the scenarios analysis, and contribute approximately $6.8 million to $7 million to GDP through honey production. Honey is also important component of the Ethiopian agricultural economy, and is harvested in both semi-forest and home garden systems. Ethiopia ranks among the ten largest honey producers in the world, and produced just under 40 million kilograms in 2011, with a total export value of $4 million in 2007-2011 (USAID, AGPAMD, 2012). Honey production per household per year is about 33 kg/ha27 from semi-forest coffee (Reichuber et al. 2012; Sutcliffe et al. 2012) worth approximately $ 54 per hectare per year, whereas garden coffee systems produce around $51 per hectare per year worth of honey. Approximately 34%28 is assumed to be consumed domestically (Miklyaev et al. 2012), with the remainder sold in formal market. Multiplying this value by the overall hectarage of coffee agroforestry systems as modelled in the scenarios gives the $6.829 to $7 million30 contribution to GDP estimate. Provisioning service values in coffee systems are presented in Table 11. Freshwater provision Annual fresh water yield values were generated using modelling based on the five coffee growing districts. These vary between 1,018 mm (Anfilo) and 1,880 mm (Goma). In absolute terms, cumulative water yield was approximately 9 billion m3 across all modelled basins in the five districts, with an average of approximately 14,690 m3/ha across all land uses in the districts.
25 The most recent year for which official statistics are available 26 http://ethioagp.org/ethiopian-coffee-exports-to-hit-record-in-2015/ 27 Average from 42.12 kg/ha (Sutcliffe et al. 2012) and 24.26 kg/ha (Reichuber and Rechate 2012). 28 10 kg consumed out of 29.25 kg of honey produced by a household (Miklyaev et al. 2012) = 34%. 29 ($51/ha X 202,342 ha) X (1 – 0.34) = $ 6,836,201. 30 ($54/ha X 202,342 ha) X (1 – 0.34) = $ 7,214,135.

43
Table 11: Annual per hectare quantities and values of provisioning services from coffee agroforestry systems
Service System Quantity Source Value ($) Source
Coffee yield (kg) Semi-forest
150 Wiersum et al. 2008
- -
31 Schmitt et al. 2009
- -
2020 Aerts et al. 2011 - - 450 Agrisystems Ltd.
2001 - -
Average 300** 500 Estimate @ $1.67/kg
Garden
2130 Bote et al. 2014 - - 260 Abebe 2005 - - 450 Wiersum et al.
2008 20,484.64 Ayele et al. 2014
318 Tadesse 2013 532.32 Tadesse 2013 Average 342.67** 642.27 Estimate
@1.67/kg Timber (m3 sustainable harvest)
NS 1.44 Sutcliffe et al. 2012
165.37 Sutcliffe et al. 2012
4 Reichuber and Rechate 2012
459.36 Reichuber and Rechate 2012
Average 2.72 312.36 Fresh water provision (m3)
14.69 Waterworld Model
Building material BM (m3 timber, poles, mats)
Garden
- - 889.76 Ayele et al. 2014 - - 3.0631 Tadesse 2013
Average 381.27 Wood fuel (m3
sustainable harvest) Semi-forest
4 Reichuber & Rechate 2012
277.67 Reichuber & Rechate 2012
3.12 Sutcliffe et al. 2012
18.07 Sutcliffe et al. 2012
Average 3.56 208.76 Charcoal & fuelwood Garden - - 4.6 Tadesse 2013
21.69 Ayele et al. 2014 Average - - 13.19
Honey Semi-forest
- - 65 Reichuber and Rechate 2012
- - 42.63 Sutcliffe et al. 2012
Average - - 54.02 Garden
- - 46.19 Tadesse 2013 - - 56.19 Ayele et al. 2014
Average - - 51.19 Medicinal plants Garden - - 0.06 Tadesse 2013 Other non-timber products - spices, medicinal plants, weaving material
Semi-forest
- - 4.37 Reichuber & Rechate, 2012
Food32 (kg) Garden
- - 11,342.8033
Ayele et al. 2014
Maize 300 Abebe 2005 189.36 @ ETB 4.4/kg
Sweet potatoes 612.5 Abebe 2005 72.86 @ ETB 2.1/kg
31 Per household units – converted to per hectare by dividing with average plot size per household of approximately 2.2 hectares. 32 Based on major food crop outputs. 33 Original value of (2011) ETB 102,070 is extremely high - an outlier, excluded in valuation analysis.

44
Pineapple 465 Abebe 2005 345.39 @ ETB 5.1/kg Sugar cane 1,645.58 Abebe 2005 442.67 @ ETB 1.87/kg Beans 14 Abebe 2005 21.88 @ ETB 10.9/kg Ensete (‘false banana’)
2500 Abebe 2005
Crop Production (Sum)
- - 1,072.15
Wild food (fish, bushmeat)
- - 4.12 Tadesse 2013
Fodder - - 0.16 Tadesse 2013 Spices - - 54.72 Tadesse 2013
*Based on inflation-adjusted farm gate prices of 2012 for each of the food crops34; and 2013 for coffee ** Values considered to be outliers and hence omitted from average values. NS – System not specified
Total provisioning services The aggregate gross output value per hectare of all provisioning services in coffee agroforestry is $1100/ha for semi-forest, where coffee is a major output, and $2450 for garden coffee, where additional food and NTFP are produced. Unexpectedly, timber and NTFP value in semi forest coffee is slightly less than in home gardens, although fuelwood and charcoal values are higher for semi-forest coffee. The average timber and pole values for garden coffee are strongly skewed upwards by estimates from Ayele et al (2014). Semi-forest coffee yields do not differ significantly from garden coffee although semi-forest coffee has greater variability (standard deviation).35 Coffee agroforestry systems include a portfolio of staple food crops, providing extra food values that are not necessarily additive. Semi-forest systems provide no food crops, but may include wild foods (fruits, bush meat) although this has not been confirmed by the literature. Diversified food production in coffee agroforestry ensures household resilience as well as stability of food availability, accessibility, and utilization due to the lower risk of systematic crop/product failure across all of the different system outputs. Ensete is a key food crop in these systems which once established, can be harvested quite flexibly as needed throughout the year (Shank et al. 1996). Ensete annually yields about 2500 kg/ha approximately 1.13 million kilocalories36, or around 450 days’ worth of food37. It serves as “food supply insurance” in case of crop failure (Shank and Eritro 1996). In western Kenya, agroforestry was observed to reduce food insecurity during drought and flooding partially due to increased incomes (Thorlarkson and Neufeldt 2012). Diverse income generation options from charcoal, fuelwood, timber, honey, spices in coffee agroforestry systems also provide very important safety nets when coffee market prices become very low.
34 1 ETB = 0.14 USD. 35 This also depends on whether studies reporting outlier values are used to compute the average. 36 Abebe (2005) yield of 2500 kg/ha times the enset to kocho conversion ratio (31/130) as estimated by Shank (1994) times the kocho
calorie density of 1900 kcal/kg (Shank et al. 1996) = 1,134,000. 1,134,000 kcal / 2500 kcal per day = 453 days’ worth per annum. Note however that only a fraction of the total cultivated hectare is devoted to enset production, and hence this does not represent the total caloric output of the system. 37 Assuming 2500 in kilocalorie requirements per day.

45
Figure 6: Provisioning service values from coffee agroforestry ($/ha/yr)
In maize monocrop systems on the other hand, yield ranges from 1800 kg/ha (Reichuber et al. 2012) to 2,795 kg/ha38 (FAOSTAT 2015). Since this analysis is meant to be nationally representative, the FAOSTAT (2015) data was used. Using long-term maize prices taken from OECD (2013), this comes to about $450/ha/y (if all the maize is sold). The per hectare food value of maize monocrop is approximately 3 million kilocalories/hectare/year, or around 1,200 days’ worth of food when boiled39. For illustrative purposes, if the non-agroforesty land uses (excluding forest reserves and urban areas) consisted exclusively of monoculture maize production system, the output from these would be approximately 801,000 tonnes, with a total monetary value of approximately $128 million40.
The annual gross output value of maize monocrops is very low compared to product values in garden coffee systems. However most of the provisioning benefits in agroforestry are not sold in formal markets and thus are not converted to income. However, the wide array of products provides great potential for farmers to explore diversified markets and cope with unforeseen changes.
Regulating services in coffee agroforestry
Information on regulating services (pollination, biological pest control and soil fertility (N, P, and K nutrient stocks) was scant, as such literature sources beyond pilot countries, but with some level of comparability, were used (Table 12). Carbon and biodiversity services will be considered in more detail in the subsequent sections.
Coffee arabica is self-pollinating, but pollination increases yield by up to 50% (Tscharntke et al. 2011). Coffee pollination is usually a beneficiary of pollination services rather than a service provider though there are notable exceptions, eg. Munyuli et al. (2014), with increased pollination benefits being a function of habitat condition either along land-use gradients (eg. Klassen et al. 2014) or with decreasing distance to forest (eg. Ricketts et al. 2004; Olschewski et al. 2006). No Ethiopian studies were found which quantified the effects of pollinator services on yields, regardless of whether coffee agroforestry was the provider
38 Smoothed average over five years from FAOSTAT (2015) data. 39 Using the same assumptions about kilocalorie requirements as above. 40 Assuming the area extents used in our scenarios analysis.
$0
$200
$400
$600
$800
$1,000
$1,200
Semi-forestcoffee
Homegardencoffee
MaizeMonocrop
Coffee
Food and other crops
Timber + Poles
Energy (Wood fuel, charcoal)
Honey
NTFP (medicines, fodder,etc.)

46
or the beneficiary. However, a study in Gera and Goma districts of Ethiopia observed that with increasing tree cover on coffee farms, the abundance of Apis melliferai (the main pollinator of coffee) declined while the diversity of other pollinator species (eg. Meliponula cf. ogouensis Vachal, Eristalinus (Eristalodes) sp) increased (Samnegard et al. 2014). Whether the greater diversity of other pollinators is due to the increased habitat value in more complex, shaded coffee systems is unclear. Although risks of colony collapse of the semi-wild honeybee are small, the diversification in shaded coffee system provides option values and resilience against any unforeseen ‘shocks’, and there are potential complementarities (Albrecht et al. 2012) and synergies (Brittain et al. 2013) amongst different pollinator species. Pollination estimates based on landscape effects – e.g. distance to forests (Olschewski et al. 2006; Ricketts et al. 2013) could not be used as benefit transfer since they require spatially explicit information. The absence of Ethiopian studies relating pollination to yields and the small number of relevant studies from elsewhere prevented credibly estimating the monetary value of pollination services. Biological pest control services values of coffee agroforestry are based on change in productivity approaches, such as lower observed incidences of coffee berry borer disease (Kellermann et al. 2007) and pest control services by birds (Klassen et al. (2011). Whereas Klassen did not observe any enhanced pest control benefits across vegetation complexity gradients in coffee farms along the slopes of Mt. Kilimanjaro, Bedimo et al. (2008) in Cameroon observed lower incidences of coffee berry disease in (artificially) shaded coffee agroforestry systems relative to full-sun coffee systems, indicating that coffee agroforestry may enhance the delivery of biological control services in some cases. It was again decided that the number of relevant studies was too small to reliably value pest control services for coffee agroforestry in Ethiopia. While in some publications, tree shade is reported to enhance coffee yield (Somporn et al. 2012; Santos et al. 2012; Muschler 2001) or have no effect (Romero-Alvarado et al. 2002; Muschler 2001; Ricci et al. 2011), in some others, shade is reported to lower coffee yield (Steiman et al. 2006; Vaast et al. 2006; Morais et al. 2006), possibly due to competition for growth resources (Haggar et al. 2011) or creation of conditions for multiplication of pathogens such as fungi. Shade also causes delay of bean ripening (Muschler 2001; Vaast et al. 2006; Ricci et al. 2011), which is thought to improve bean flavour with potential to fetch additional price premiums through higher product quality and/or certification. Soil nutrient stock values found for coffee agroforestry were for semi-forest coffee in Aerts et al. (2011) and for shaded coffee plantations in Ebisa (2014). Information was not enough to value these. Similar constraints precluded valuing the soil nutrient flux from coffee agroforestry systems. The more closed-loop nutrient cycles in agroforestry make it less dependent on external inputs (eg. Reichuber and Rechate 2012).
Table 12: Regulating Services from Coffee Agroforestry in Ethiopia (per hectare per year)
Service Quantity System Reference Value ($) Reference
Soil nutrient stocks 0.42-0.46 %N Semi-forest
Aerts et al. 2011
- - 0.25-0.65
cmol/kg K - -
0.38-0.48% N Shaded coffee
Ebisa 2014
- - 1.59 - 4.98
mg/kg K - -
Soil fertility (nutrient flux) (kg/ha/y)
257 N Garden*
Negash 2013 - -
3828 C - -

47
Pollination - Intensive- - 668.8 Munyuli et al. 2014
- Organic - 421.6 - Garden** - 939.5 Pest control % contribution to coffee yield
49.89 Full sun, Cameroon
- Bedimo et al. 2014
29.56 Shaded coffee - 13.96 Jamaica - Jonsson et
al. 2014 2.06 Various shade
levels, Jamaica
Kellermann et al. 2008
Pest control % contribution to avoided coffee fruit set loss
9 Garden, Tanzania
Klassen et al. 2008
Runoff (m3/s) 8-31 WaterWorld Model
Water quality (Human Footprint Index - HFI)
Max 4.4% WaterWorld Model
* Enset coffee and fruit-coffee agroforesty; **Coffee-banana system
Biodiversity Services
Wild Arabica coffee, which grows in the afromontane forests of south-western Ethiopia is of enormous genetic and agronomic value (estimated at $0.4-1.5 billion by Denich M. and Gatzweiler F. unpublished) and needs to be conserved in-situ (Berecha et al. 2014). Coffee agroforestry systems also contain understory avian species diversity levels (as measured by the Shannon Index) that does not differ significantly from that in natural forests. However, coffee agroforestry supports double the avian species richness (a simple count of species) of natural forests with a 73% species overlap between forests and coffee agroforests (Buechley et al. 2015). Another study found that approximately 58% of bird species were shared between coffee agroforestry and forestry plots (Gove et al. 2009). While forest tree retention on farms is positively associated with avian biodiversity, coffee cultivation in forest areas negatively impacts avian diversity. Retention of forest tree species makes Ethiopian shade coffee ‘bird-friendly’ (Buechley et al. 2015), although any certification scheme will need to take the complex relationship between landscape configurations, forestry and agroforestry and avian biodiversity into account (Gove et al. 2009).
Semi-forest and garden coffee systems only retain approximately 50% and 30% of the tree species found in the forest and forest coffee plots. Vegetation diversity (Shannon’s H Index) is nearly half in semi-forest coffee (1.28) and nearly one third (0.78) in garden coffee compared to forest and forest coffee (2.06) systems (Vanderhaegan et al. 2015).
Carbon stocks Carbon stock service figures did not usually distinguish between different biomass pools (eg. coffee, fruit trees, food crops), and in such cases these values were recorded as total above and belowground biomass values. In cases where belowground biomass was not reported, its value was estimated using the root/shoot ratio of 0.25 for coffee-enset and coffee-fruit tree systems by Negash and Starr (2014). Carbon stock values are presented in Table 13. Coffee agroforestry systems (semi-forest and garden coffee) store almost four times more carbon stock than maize mono crop systems (Figure 7a). Moreover, coffee agroforests can store between 50% and 62% of the aboveground carbon biomass found from the same area of surrounding forests (Tadesse et al. 2014) and 30% to 53% of total carbon (soil and biomass) relative to adjacent forests (Vanderhaegen et al. 2015). As such, coffee agroforestry
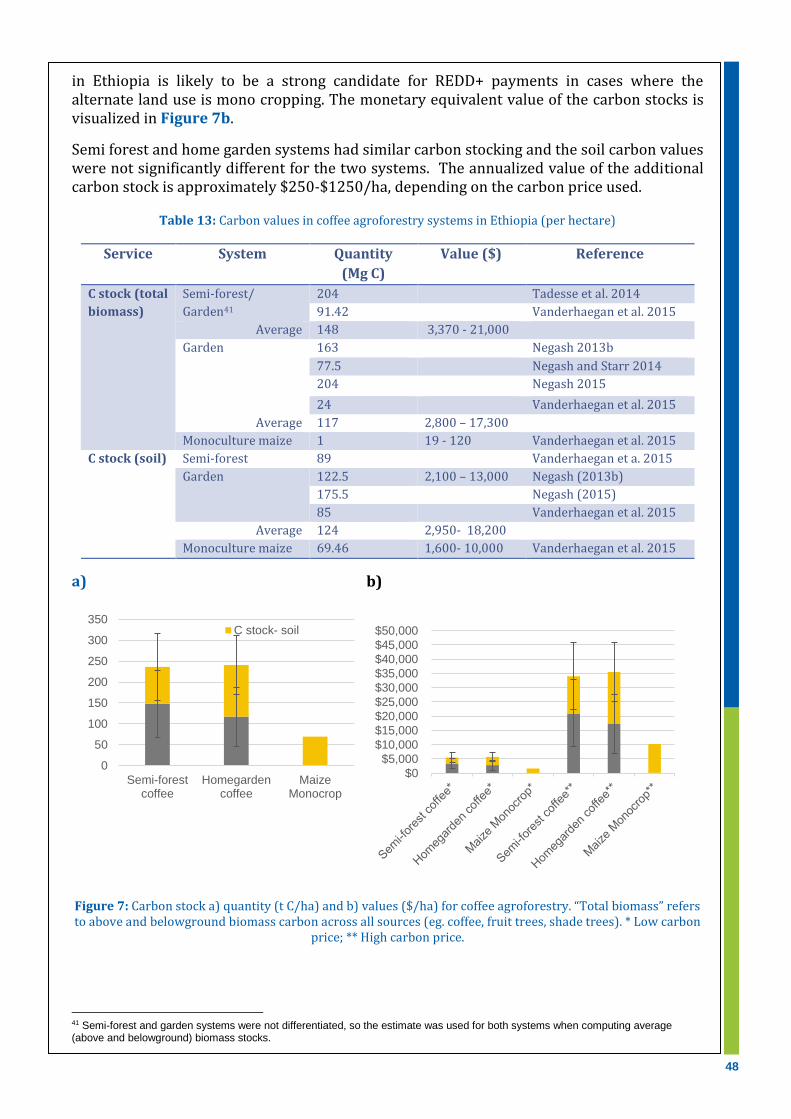
48
in Ethiopia is likely to be a strong candidate for REDD+ payments in cases where the alternate land use is mono cropping. The monetary equivalent value of the carbon stocks is visualized in Figure 7b.
Semi forest and home garden systems had similar carbon stocking and the soil carbon values were not significantly different for the two systems. The annualized value of the additional carbon stock is approximately $250-$1250/ha, depending on the carbon price used.
Table 13: Carbon values in coffee agroforestry systems in Ethiopia (per hectare)
Service
System Quantity
(Mg C)
Value ($) Reference
C stock (total
biomass)
Semi-forest/
Garden41
204 Tadesse et al. 2014
91.42 Vanderhaegan et al. 2015
Average 148 3,370 - 21,000
Garden
163 Negash 2013b
77.5 Negash and Starr 2014
204 Negash 2015
24 Vanderhaegan et al. 2015
Average 117 2,800 – 17,300
Monoculture maize 1 19 - 120 Vanderhaegan et al. 2015
C stock (soil) Semi-forest 89 Vanderhaegan et a. 2015
Garden
122.5 2,100 – 13,000 Negash (2013b)
175.5 Negash (2015)
85 Vanderhaegan et al. 2015
Average 124 2,950- 18,200
Monoculture maize 69.46 1,600- 10,000 Vanderhaegan et al. 2015
a)
b)
Figure 7: Carbon stock a) quantity (t C/ha) and b) values ($/ha) for coffee agroforestry. “Total biomass” refers to above and belowground biomass carbon across all sources (eg. coffee, fruit trees, shade trees). * Low carbon
price; ** High carbon price.
41 Semi-forest and garden systems were not differentiated, so the estimate was used for both systems when computing average (above and belowground) biomass stocks.
0
50
100
150
200
250
300
350
Semi-forestcoffee
Homegardencoffee
MaizeMonocrop
C stock- soil
$0
$5,000
$10,000
$15,000
$20,000
$25,000
$30,000
$35,000
$40,000
$45,000
$50,000
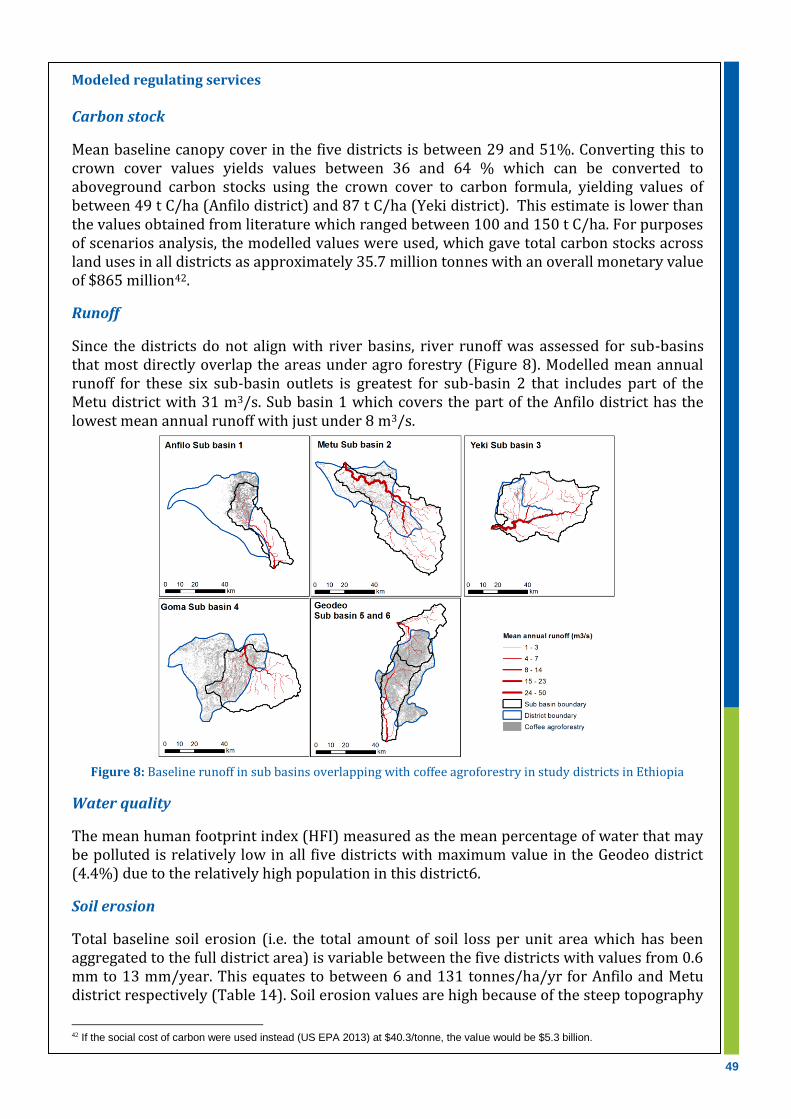
49
Modeled regulating services Carbon stock
Mean baseline canopy cover in the five districts is between 29 and 51%. Converting this to crown cover values yields values between 36 and 64 % which can be converted to aboveground carbon stocks using the crown cover to carbon formula, yielding values of between 49 t C/ha (Anfilo district) and 87 t C/ha (Yeki district). This estimate is lower than the values obtained from literature which ranged between 100 and 150 t C/ha. For purposes of scenarios analysis, the modelled values were used, which gave total carbon stocks across land uses in all districts as approximately 35.7 million tonnes with an overall monetary value of $865 million42.
Runoff
Since the districts do not align with river basins, river runoff was assessed for sub-basins that most directly overlap the areas under agro forestry (Figure 8). Modelled mean annual runoff for these six sub-basin outlets is greatest for sub-basin 2 that includes part of the Metu district with 31 m3/s. Sub basin 1 which covers the part of the Anfilo district has the lowest mean annual runoff with just under 8 m3/s.
Figure 8: Baseline runoff in sub basins overlapping with coffee agroforestry in study districts in Ethiopia
Water quality
The mean human footprint index (HFI) measured as the mean percentage of water that may be polluted is relatively low in all five districts with maximum value in the Geodeo district (4.4%) due to the relatively high population in this district6.
Soil erosion
Total baseline soil erosion (i.e. the total amount of soil loss per unit area which has been aggregated to the full district area) is variable between the five districts with values from 0.6 mm to 13 mm/year. This equates to between 6 and 131 tonnes/ha/yr for Anfilo and Metu district respectively (Table 14). Soil erosion values are high because of the steep topography
42 If the social cost of carbon were used instead (US EPA 2013) at $40.3/tonne, the value would be $5.3 billion.

50
and high rainfall in this region. Consequently, approximately 35 million m3 of soil is lost per annum in total when aggregating across all five districts
Table 14: Summary of results for baseline
District District Area (km2)
Coffee AF area (km2)
Water yield (m3)
Water quality (HFI %)
Carbon (tonnes)
Erosion (m3)
Geodeo 1,366 903 2,141,529,332 4.4 7,566,901 4,293,121
Metu 1,422 275 2,234,847,054 3.0 8,524,044 18,656,644
Goma 1,155 439 2,172,411,752 2.7 6,227,482 6,277,698
Anfilo 1,651 300 1,682,463,997 1.9 8,055,231 971,822
Yeki 621 106 900,922,441 3.9 5,388,447 4,833,094
Baseline ecosystem services and values identification in coffee agroforestry To briefly summarize the valuation analysis, not all of the provisioning service values (food and cash crops, wood fuel and charcoal, building materials, and NTFPs) are necessarily captured in markets. Market and shadow prices are used where possible to demonstrate the corresponding direct use values from these services. For regulating services such as pollination and biological pest control services, values could only be recognized since the literature base is not yet robust enough. Potential carbon values for smallholder farmers are demonstrated using carbon market price and social cost of carbon, respectively, less transaction costs. The value of other regulating services such as erosion control, water provisioning and water quality can have been demonstrated quantitatively and economically, but the possible modalities of benefit capture (eg. markets for soil fertility services, water harvesting structures) have not been identified, although some of these benefits are already captured by farmers (since soil fertility and water provisioning are intermediate services for the final service of crop production). Finally, although the significant existence value attached to avian and vegetative biodiversity as well as its role in fostering agro-ecosystem resilience is recognized, the economic value of biodiversity in these systems could not be concretely demonstrated. To some extent, mechanisms for capturing these benefits are identified in the discussion section.
3.1.3 Gross Margin Estimation of Coffee agroforestry compared to maize monocrop Input costs The net present value of the coffee system was determined using cost-benefit analysis. Labour cost estimates were obtained as follows. For semi-forest coffee systems, coffee, wood fuel timber, honey and non-timber forest product labour costs were derived from Reichuber and Rechate (2012) and Sutcliffe et al. (2012), and scaled to the average yield and production estimates for the system, in order to better mitigate potential bias from the fact that only a fraction of the studies valuing provisioning services also estimate labour costs (Table 15). For coffee home gardens, only Ayele (2014) provided any labour cost estimates. Other inputs are negligible since coffee agroforestry systems in Ethiopia involve low use of fertilizer, agrochemicals and pesticides (eg LMC 2000). Some manure input is used, but data to monetize this was not available.

51
Table 15: Input costs and gross margin per year
Input
System Value ($/ha) Reference
Labour Semi-forest
606.03 Reichuber and Rechate, 2012 1,496.38 Sutcliffe et al 2012
Average 717.44* Garden 1,794.25** Ayele et al. 2014 Maize 247.21 Reichuber and Rechate, 2012
Other input costs Garden 333.36*** Ayele et al. 2014 Total gross system value Semi-forest 1,288 Direct calculation
Garden 2,681 Maize 447
Gross margin Semi-forest 571 Garden 887 Maize 200
* Average value differs from the values of the two studies by Reichuber and Rechate (2012) and Sutcliffe et al. (2012) *** Scaled to two thirds of original value to control because Ayele et al’s (2014) gross output values from garden coffee widely exceed those from every other studies. *** Not included in cost-benefit analysis.
The gross margin (gross output minus variable costs) of different coffee systems was estimated as the sum of all its ES values less labour costs (Figure 9). Although, the gross margin estimates for the two systems are likely to be slightly overestimated due to the absence of data on additional input costs, the estimate for semi-forest coffee is approximately three quarters that from Sutcliffe et al. (2012), which is ETB 3,692/ha ($890/ha43).
Figure 9: Gross Margin and Labour costs from coffee agroforestry ($/ha/yr)
Net Present Value Figure 6 displays the net present value of coffee agroforestry systems and monoculture maize monoculture across various carbon prices and discount rates. Garden coffee systems have higher carbon values than semi-forest systems. Net present value (NPV) of semi-forest is lower than garden coffee by a significant margin. Garden coffee NPV ranges from
43 Inflation-adjusted PPP-equivalent dollars
$0
$500
$1,000
$1,500
$2,000
$2,500
$3,000
Semi-forest coffee Homegarden coffee Maize Monocrop
Gross margin
Labor

52
$4,300/ha to $29,000/ha across the various carbon prices and discount rates44, with a benefit-cost ratio of 1.49 under a low carbon price at a 10% discount rate. The NPV of semi-forest coffee is $2,800-24,000/ha depending on the discount rate and the carbon price, with a benefit-cost ratio of 1.80 under a 10% discount rate. As such, the system is fairly competitive with garden coffee. This NPV value is considerably lower than that estimated by Reichuber and Rechate (2012) for semi-forest coffee in south-western Ethiopia, which identified a net present value of (2013) $90,000 for semi-forest coffee, valued at a premium price and at a 10% discount rate over a 40-year period. While providing important food security benefits, from an economic standpoint monoculture maize is a marginal system with NPV between approximately $1000/ha-$3100/ha, and with a benefit-cost ratio of 1.81. This NPV is considerably lower than that by Reichuber and Rechate’s (2012) of $5600 for monoculture maize production at a 10% discount rate over a 40 year period45, although much of the difference is explained by the 20-year additional time horizon as well as one-off timber and wood fuel harvesting revenues from deforestation.
A) B)
Figure 10: Net present value of coffee agroforestry systems carbon prices per tonne of CO2eq of a) $6.5 and b) $40.3 and various discount rates in Ethiopia
3.1.4 GDP of the poor
Ethiopia’s GDP is currently estimated around $144 billion, of which agroforestry, livestock, forestry and fishing together make a contribution of $61.3 billion (42.3%). Under the assumption that all coffee and honey output are captured in GDP, the contribution of poor smallholder coffee agroforestry to GDP is approximately $274 million46. The total Ethiopian population is approximately 97 million, of which approximately 12.78 million are engaged in smallholder coffee agroforestry47. As such, the unadjusted per capita GDP of the poor from coffee agroforestry amounts to approximately $21 per person per annum. Accounting for the
44 Given that we model the coffee agroforestry and monocrop maize systems at maturity and do not have data capturing variable annual cash flows (positive and negative), we were unable to compute the IRR value for these systems. 45 Their study adopts a 40-year time horizon as it is compared to investments in semi-forest conservation, which incorporates Hein and Gatzweiler’s (2006) estimated benefits of in situ coffee conservation and an agronomic breeding programme of improved coffee varieties from indigenous Arabica strains over a 40-year time horizon. 46 Percentage of farmers with < 1 ha of land (55.13%) multiplied by coffee agroforestry area and by their respective coffee and honey production volumes. 47 4.5 million households (CSA 2013; Minten et al. 2013), multiplied by average rural household size of 5.1 persons, (CSA and World Bank 2013) and then multiplied by 55.13% (smallholder households).
$0
$5,000
$10,000
$15,000
$20,000
$25,000
$30,000
$35,000
$40,000
Semi-forest coffeeHomegarden coffeeMaize Monocrop
NPV 2.5% NPV 7.5% NPV 10% NPV 20%
$0
$5,000
$10,000
$15,000
$20,000
$25,000
$30,000
$35,000
Semi-forest coffeeHomegarden coffeeMaize Monocrop

53
unrecorded wood fuel and timber values48 ($112 million), NTFP and wild food values49 ($42 million) and carbon payments50 - less implementation, management and transaction cost ($34 million) - gives a total adjusted GDP per capita value of approximately $36 per person per year. When these unrecorded timber, wood fuel and NTFP values are expressed as a percentage of traditional forestry, fisheries and agricultural GDP, the additional contribution amounts to approximately $463 million or $36 per capita, which increases agriculture’s share of total GDP by 0.1%. This additional contribution is rather modest in this case due to the fact that the main output of the coffee agroforestry system (namely, coffee), is already captured in formal GDP statistics. For the case of Ethiopia, we used the ratio of per capita consumption of the top of the base of pyramid relative to the bottom of the base of pyramid for Rwanda and Uganda, respectively, averaged between the two countries which gives an equity weight of 3.77. When these per capita values are weighted according to the welfare criteria identified, the equity adjusted value per person amounts to approximately $188 per person per year, more than eight times the initial estimate. Nonetheless, these GDP of the poor values suggest that income from sales of coffee and other crops and non-timber forest products are unlikely to provide farming households with an escape from severe poverty. As Harris and Orr (2014) caution in their review of improved agronomic practices in rainfed semi-arid and dry sub-humid agricultural systems, unless significant shares of income are derived from off-farm employment or households are fortunate enough to be endowed with larger land holdings, net income from smallholder farming may not be sufficient meet the International Poverty Line threshold of $1.25 per day in purchasing power parity equivalents. Given that coffee farming contributes around 20-50% of household incomes for many smallholders (Wiersum et al 2008), this suggests that coffee income in many smallholder systems would not be sufficient to lift many households out of the International Poverty Line. Consequently other complementary livelihood strategies will likely be required in order to ensure that coffee agroforestry remains part of integrated rural development strategies and offers a viable pathway out of poverty. The complete set of GDP of the poor indicators and calculations are summarized in Table 16 below.
48 55.13% multiplied by the respective hectarage and production values of timber, building materials and wood fuel for garden and semi-forest coffee 49 55.13% multiplied by the respective hectarage and production values of timber, building materials and wood fuel for garden and semi-forest coffee. 50 55.13% multiplied by the respective hectarage and revenue for carbon sequestration for garden and semi-forest coffee.
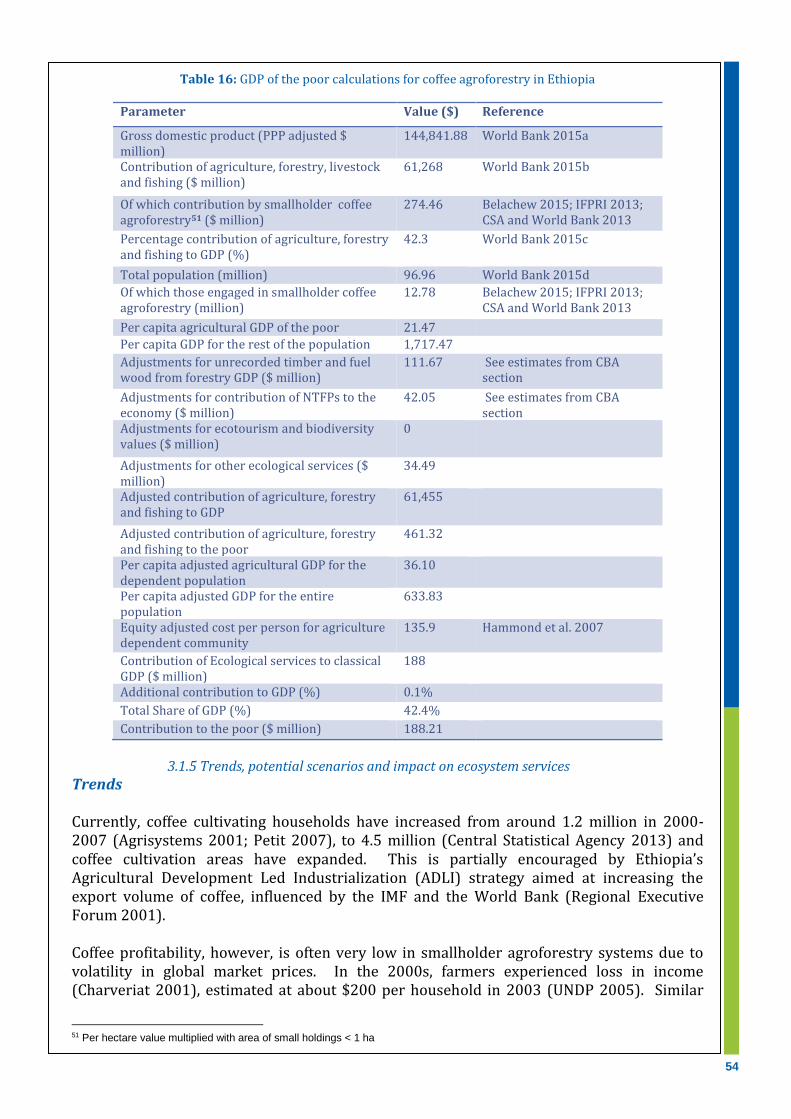
54
Table 16: GDP of the poor calculations for coffee agroforestry in Ethiopia
Parameter Value ($) Reference
Gross domestic product (PPP adjusted $ million)
144,841.88 World Bank 2015a
Contribution of agriculture, forestry, livestock and fishing ($ million)
61,268 World Bank 2015b
Of which contribution by smallholder coffee agroforestry51 ($ million)
274.46 Belachew 2015; IFPRI 2013; CSA and World Bank 2013
Percentage contribution of agriculture, forestry and fishing to GDP (%)
42.3 World Bank 2015c
Total population (million) 96.96 World Bank 2015d
Of which those engaged in smallholder coffee agroforestry (million)
12.78 Belachew 2015; IFPRI 2013; CSA and World Bank 2013
Per capita agricultural GDP of the poor 21.47
Per capita GDP for the rest of the population 1,717.47
Adjustments for unrecorded timber and fuel wood from forestry GDP ($ million)
111.67 See estimates from CBA section
Adjustments for contribution of NTFPs to the economy ($ million)
42.05 See estimates from CBA section
Adjustments for ecotourism and biodiversity values ($ million)
0
Adjustments for other ecological services ($ million)
34.49
Adjusted contribution of agriculture, forestry and fishing to GDP
61,455
Adjusted contribution of agriculture, forestry and fishing to the poor
461.32
Per capita adjusted agricultural GDP for the dependent population
36.10
Per capita adjusted GDP for the entire population
633.83
Equity adjusted cost per person for agriculture dependent community
135.9 Hammond et al. 2007
Contribution of Ecological services to classical GDP ($ million)
188
Additional contribution to GDP (%) 0.1%
Total Share of GDP (%) 42.4%
Contribution to the poor ($ million) 188.21
3.1.5 Trends, potential scenarios and impact on ecosystem services
Trends Currently, coffee cultivating households have increased from around 1.2 million in 2000-2007 (Agrisystems 2001; Petit 2007), to 4.5 million (Central Statistical Agency 2013) and coffee cultivation areas have expanded. This is partially encouraged by Ethiopia’s Agricultural Development Led Industrialization (ADLI) strategy aimed at increasing the export volume of coffee, influenced by the IMF and the World Bank (Regional Executive Forum 2001). Coffee profitability, however, is often very low in smallholder agroforestry systems due to volatility in global market prices. In the 2000s, farmers experienced loss in income (Charveriat 2001), estimated at about $200 per household in 2003 (UNDP 2005). Similar
51 Per hectare value multiplied with area of small holdings < 1 ha

55
observations were made by Oxfam International in the Kafa province where in addition, some primary cooperative societies went bankrupt and many traders and exporters were forced to stop operating (Oxfam 2002). The Ethiopia government estimated a loss of about $814 million in revenue from coffee exports between 1998 and 2003 (Petit 2007). In response to these losses, some small scale farmers e.g., in the Hararghe highlands, replaced coffee farming with khat (FDRE 2003). A similar response was observed in Mount Kenya region in Kenya where smallholder coffee agroforestry was converted to annual food crop systems (Carsan et al. 2013). With the banning of khat on the European market, maize could be considered as an alternative in Ethiopia. Since 2009, however, coffee prices have increased dramatically (Dahlberg 2011). Initiatives for obtaining better prices are also being explored, such as improving quality and obtaining price premiums through certification of washed coffee, semi-washed coffee, differentiated coffees, specially blended flavours, promoting ‘forest’ coffee as ‘organic’ etc. although implementing these also has its own challenges (Stellmacher and Grote 2011). Internally existing license controls for domestic wholesaling, coffee exporting, or coffee roasting (GAIN 2013) also contribute to low coffee profitability. Climatic predictions, however, show that areas bioclimatically suitable for coffee production may reduce by 65% under the most optimistic projections to nearly 100% at the extreme (Davis et al. 2012). The rate of deforestation in Ethiopia is estimated at 1-1.5% per year (Teferi et al. 2013). Smallhholder coffee expansion is a key driver of forest conversion (Davis et al. 2012). For example, in the Belete-Gera Forest, up to 49% of the accessible part of was observed by Cheng et al. (1998) to be under coffee production activities. About 25% of land converted from forests is used for traditional coffee growing (semi-forest and garden coffee). About 30% and 15% become cultivated fields, and tea and Eucalyptus plantations, respectively (Tadesse, 2013). Even when coffee is grown under a canopy of native forest, it causes forest degradation as it involves clearing of the understory (Hylander et al 2013), causing about 34% decline in woody species richness (Tadesse 2014). Conversion of semi-forest coffee to more intensive management types (garden coffee and full sun plantation) results in a further 37% loss of woody species richness (Senbeta & Denich, 2006; Wiersum, 2008; Tadesse, et al. 2014). Carbon losses are also substantial. Melca (2006) estimated conversion of a traditionally managed Sheka forest in southwest Ethiopia to perennial crop plantations to result in a maximum cost of $1,260/ha in terms of carbon release compared to its annual value of $1,240/ha. Even though there is no clear correlation between wood density and carbon biomass (Stegen et al., 2009), the preference for species of lighter wood density that are also faster growing in agroforestry systems, has implications on carbon stocks. Another threat to forestry is the increased leasing of large land parcels to foreign companies for investment mainly in high value export commodities and biofuel plants such as palm oil and maize (Rahmato 2011; Vervoort et al. 2013). Although this mainly targets marginal uncultivated lands, it involves cutting and burning of trees during land clearance. Regulations now specify that investors must leave 60-70 indigenous trees per ha and 100 on slopes (Keeley et al. 2014). Maize is one of the key crops Ethiopia considers for the trade-driven food security under the Agricultural Development Led Industrialization (ADLI) strategy, through productivity enhancement and guaranteeing a minimum price to smallholder farmers, and large scale land investments (Lavers 2012). Although the contribution of forestry to the national economy is very small (De Rosayro), forest conversion is a major concern and is being countered by growing national and international interests such as the Climate Resilience Green Growth Strategy and the REDD+

56
program towards sustainable forest development (Teferi et al. 2013). New initiatives are developing aimed at reducing the (deforestation) carbon footprint of coffee, through promotion of improved cook stoves and tree planting in coffee systems52. Scenarios In this analysis, the following scenarios for coffee agroforestry were considered (Figure 10):
1. Conversion of all areas identified as under coffee agroforestry to a maize mono cropping system (possibly due to climate change or low profitability).
2. Conversion of all areas identified as under coffee agroforestry to a heavy shade coffee agroforestry system (possibly due to REDD+ or certification earnings)
3. Conversion of all areas identified as under coffee agroforestry to a heavy shade
agroforestry system and expansion into all areas identified as non-agroforestry land use outside urban and other priority land uses
Figure 11: Scenarios for coffee agroforestry systems in Ethiopia
Scenario 1: Conversion of coffee agroforestry to maize monocrop system Scenario 1 represents a conversion to a maize mono cropping system in all areas identified as coffee agroforestry, resulting in a 202,000+ ha increase in monocrop maize area extent. Values for tree functional type are set to a maximum of 5% with values for bare and herbaceous cover set to 15% and 85% respectively based on representative values for maize mono cropping in Ethiopia (see Methods section for detail). Converted areas were set to cropping use in the model which impacts the Human Footprint Index (HPI) of potential water pollution. Change in Provisioning Services
Under this scenario, maize output increases by 565,000 tonnes, leading to a total maize production value of 1.37 million tonnes across all districts. This increased maize output has a market value of $90 million, leading to a total maize production value of around $219 million. However, this gain in maize output would come at the expense of approximately $115 million worth of coffee production, as well as $2.7 million and $10 million worth of
52 www.fairclimatefund.nl/en/icco-en-fairtrade-max-havelaar-starten-fairtrade-carbon-partnership/

57
wood fuel and honey production, totalling approximately $38 million of foregone provisioning services (difference between maize gains and foregone coffee value). Change in freshwater provision The land cover changes have variable impacts on water yield between districts with a decrease in overall water yield in three districts and increase in the other two. Since the tree cover is replaced by high water use crops, a decrease in overall available water can be the result. On average, these differences are small (between 0.6 and 12.4 mm/year) relative to the baseline values of overall annual water yields between 1018 and 1880 mm. This leads to a loss of approximately 20.3 m3/ha of water and a cumulative loss of 12 million m3 across all land uses in all the districts. Numerous contingent valuation and choice experiments have been undertaken to measure willingness to pay (WTP) for improved water provisioning in Ethiopia, with variations according to methodology, valuation unit (eg. $/m3, $/household/year), service provisioning unit (eg. built infrastructure versus forest restoration), and whether the study was conducted in urban or rural districts. Using double-bounded dichotomous choice methods, Ayenaw et al. (2015) estimated WTP for improved water supply via conservation of Wondo Genet catchment forest in Southern Ethiopia at approximately 30 ETB/month, or approximately $51/household/year53. Since this study did not specify the exact scope of the incremental water provisioning (eg. in m3/household/year), it is best interpreted as a lower bound on WTP for changes in water provisioning at the district scales. In a study in Hawassa urban area in the SNNPR of Ethiopia, Tarfasa et al. (2013) estimated mean WTP of approximately 17.9 ETB for a three day increase in water supply (equivalent to approximately 300 litres), which corresponds to a WTP of approximately44 $3.57/m3. Similarly, Bogale et al. (2012) use a double-bounded dichotomous choice method to estimate a mean WTP of ETB 0.2730 per 20 litre jerrycan, or approximately44 $3.29/m3. Lastly, a study of factory villages in Wonji Shoa Sugar Estate, (Wendimu et al. 2011) estimated that the mean WTP for improved water provisioning and water quality was approximately $0.025 per 20 litre container, or approximately44 $3.6/m3. Taking the average of these contingent valuation estimates54 gives a total loss equivalent to $34.9 million from the decreased water yield across all districts55. Moreover, detailed estimates of water demand across the urban-rural divide or across regions in Ethiopia were not available. However, population size can serve as a reasonable proxy for water demand, and as can be seen, SNNP (one of the regions featuring a modelled district) is amongst the most populous in all of Ethiopia (Table 17). This coupled with the fact that Ethiopia climate change and growing water demand due to a rising population are increasing water stress in urban and rural areas, implies that increased water provisioning will potentially lead to significant welfare gains. A more accurate valuation assessment would be possible if income effects were accounted for in the adjusted benefit transfer adopted above by acquiring data on household income for each of the modelled districts, or if household income, size, level of education and other variables of interest in the contingent valuation studies above could be used as the basis for function value (or meta-analytic function value) transfer.
53 After adjusting for purchasing power parity and inflation 54 Unit (per m3) WTP multiplied by the decrease in water provisioned, and the adjusted per household figure by the estimated number of coffee cultivating households (obtained by dividing the overall coffee hectarage with land holding size). 55 WTP for an increase in a service is not necessarily equivalent to WTP to avoid the loss of said services. However, due to lack of information, the former were used - which may well be conservative due to diminishing marginal utility from ecosystem service provisioning.

58
Runoff Due to the relatively small changes in water yield within the districts, changes in runoff are also small and change in the same direction as the changes in water yield for each district. The greatest change in absolute runoff is observed in the largest sub basin (2) with an increase of 0.2 m3/s (Table 17).
Table 17: Percentage distribution of population by region (2007)
Region Number %
Tigray 4,314,456 5.8 Afar 1,411,092 1.9 Amhara 17,214,056 23.3 Oromia 27,158,471 36.7 Somali 4,439,147 6.0 Benishangul Gumuz 670,847 0.9 SNNP 15,042,531 20.4 Gambella 306,916 0.4 Harari 183,344 0.2 Addis Ababa 2,738,248 3.7 Dire Dawa 342,827 0.5 Special Enumeration 96,570 0.1 Country Total 73,918,505 100.0
Source: CSA 200856
In relative terms the smaller sub basin 6, which covers part of the Geodeo district has the greatest reduction in runoff annually (0.7%). The absence of economic studies quantifying gains or losses in income or welfare from runoff precluded the valuation of this service.
Change in freshwater quality
Under this scenario there is a clear decrease in water quality for all five districts due to the change to agricultural use which has a high potential pollution factor. Water quality is most impacted in the Geodeo district with an increase in the HFI of 2% from 4.4% in the baseline situation. The smallest change is observed in the Yeki district with an increase in the HFI of 0.2%. No studies were found estimating management costs or WTP from changes in freshwater quality, excepting Wendimu et al. (2012) which was already used for the valuation of water provisioning services.
Change in carbon stock
The reduction of shade trees under this scenario leads to a mean decrease in canopy cover of 16%. The greatest decrease occurs in Geodeo district at nearly 6 million tonnes of carbon lost. The cumulative decrease across all districts is of 17.7 million tonnes in above-ground carbon stocks, with a monetary value of approximately $435 million57.
Change in soil erosion
Soil erosion in all five districts increases under this scenario. Except for the Yeki district (2.2%) relative increases in soil erosion are very large with soil loss increases up to 76% for Anfilo district (Table 18). On the national scale, the costs of soil erosion and soil nutrient loss are quite considerable, and have been estimated as ranging from 2% to 6% of
56 More recent regionally segregated population values could not be found. 57 If the value of the social cost of carbon were used at $40.3/tonne CO2eq. (US EPA 2013), this value would be much higer at $2.7 billion.

59
agricultural GDP per annum depending on the methods used (Yesuf et al. 2005). Studies on measuring productivity changes or producer welfare gains or losses from changes in soil erosion on the farm scale are scarce. However, a recent choice study by Gebremariam et al. (2013) estimated households’ willingness to invest in soil erosion conservation measures at 49 labour days per annum. Using the minimum wage rates for the study area yields an equivalent value of ETB 578 per year, or approximately $118/year. Multiplying this figure by the number of households converting from coffee to monocultures (approximately 135,000 assuming an average farm holding of 1.5 ha) gives an annual welfare loss equivalent of $15.9 million per annum. However, since this willingness to pay estimate does not measure sensitivities to scope (eg. the magnitude in the change of soil erosion), it is best understood as an indicative rather than a rigorous valuation assessment at the scale we are using for scenarios analysis.
Summary
Tables 18 and 19 summarise results from Scenario 1. Overall, converting coffee agroforestry to maize monocrop systems leads to a gain in maize production, but with a substantial loss in revenues from coffee, and provisioning services from trees and other associated intercrops. Because of the significant trade-off in tangible values, this scenario can be avoided as long as coffee prices remain more competitive than those of maize. Although the impact on water yield and quality is only marginal, this scenario causes substantial increase in soil erosion and significant loss of above-ground carbon stocks, with effects experienced over long time horizons and off site.
Table 18: Biophysical results for Scenario 1
District ∆Water yield (m3) ∆Water quality (HFI %) ∆Carbon (tonnes) ∆Erosion (m3)
Geodeo -16,899,319 2.0 -5,986,740 3,095,300
Metu 8,470,944 0.9 -3,929,449 6,230,123
Goma -5,032,284 1.5 -3,812,870 3,444,828
Anfilo 1,043,891 0.4 -3,654,471 739,332
Yeki -207,947 0.2 -600,257 140,162
Table 19: Valuation of changes in regulating services ($) for Scenario 1
District ∆Water yield ∆Carbon ∆ Soil Erosion
Geodeo - -144,922,921 -
Metu - -95,121,441 - Goma - -92,299,362 - Anfilo - -88,464,938 - Yeki - -14,530,603 -
Total -34,885,199 -435,339,265 -15,898,67558
Scenario 2: Converting all coffee agroforestry to heavy shade system
In this scenario, tree cover for all cells identified as agroforestry are set to a minimum of 60% with cells having higher values in the baseline left at their original values. This results in an average canopy cover between 32% and 56% across the study districts.
Change in provisioning services The transition to a heavier shading in extent coffee agroforestry areas is not anticipated to significantly affect the output of coffee or other provisioning services (eg. fuelwood and honey).
58 Negative value refers to an economic loss, rather than indicating a decrease in soil erosion.

60
Change in freshwater provision
The a small increase in shade trees under this scenario has a small impact on annual water yield in all districts with a maximum change of 13 mm in the Geodeo district. The changes lead to small decreases in water yield in three districts and increases in the other two. Decreases in water yield are due to greater water use by trees whereas increases can be explained by the greater interception of cloud water through trees. Interception of cloud water by forests in some districts can be as high as 15% of the annual water budget (precipitation – actual evapotranspiration, AET). Due to the size of the Geodeo district, the total increase in absolute water yield amounts to 17.5 million m3, whereas the cumulative value across all districts is approximately 21 million m3. Multiplying this quantity by the valuation figures described in scenario 1 leads to an aggregated welfare increase worth approximately $59 million per annum.
Runoff
The limited changes in water yield in the districts lead to similarly small changes in runoff. The greatest changes are in the Geodeo district for sub basin 6 where mean annual runoff increases by 0.25 m3/s.
Change in freshwater quality
Changes in water quality are also minimal under this scenario with water quality increases in three districts and decreases in the other two (Goma and Metu). These changes are the result of changing quantities of dilution and the spatial location of the changes in relation to upstream water quality and quantity.
Change in carbon
The increase in shade trees leads to a mean increase in canopy cover of 10.7% across the districts. The greatest mean increase takes place in the Geodeo district (23%) which results in an estimated increase of 39 tonnes C/ha and a total increase of 5.3 million tonnes of carbon. Overall carbon stocks across all land uses in the modelled districts increase by approximately 12 million tonnes, with a monetary equivalent ranging from approximately $291 million59.
Change in soil erosion
Soil erosion decreases for all districts, most especially in the Geodeo district at 1.1 mm a year (-36%). Changes in soil erosion are very small for the other districts. This leads to approximately 1.58 million tonnes of avoided soil loss per district. Using the estimated WTP described above this reduction equates to a value of approximately $15.9 million. However, given that soil erosion on coffee agroforestry farms is already fairly low, and due to the issue of scope insensitivity of the contingent valuation estimated mentioned earlier, this estimate may overestimate the welfare gain to farmers from increasing the number of shade trees in extant agroforestry systems.
Summary
The biophysical and economic values of increasing the canopy cover for coffee agroforestry are summarized in Tables 20 and 21 below. This scenario leads to significant gains in regulating services at approximately $74 million per annum plus an increase in carbon stocks worth at least $291 million, with no significant tradeoff in provisioning services values. 59 Under the high carbon price, the value would be $1.78 billion.
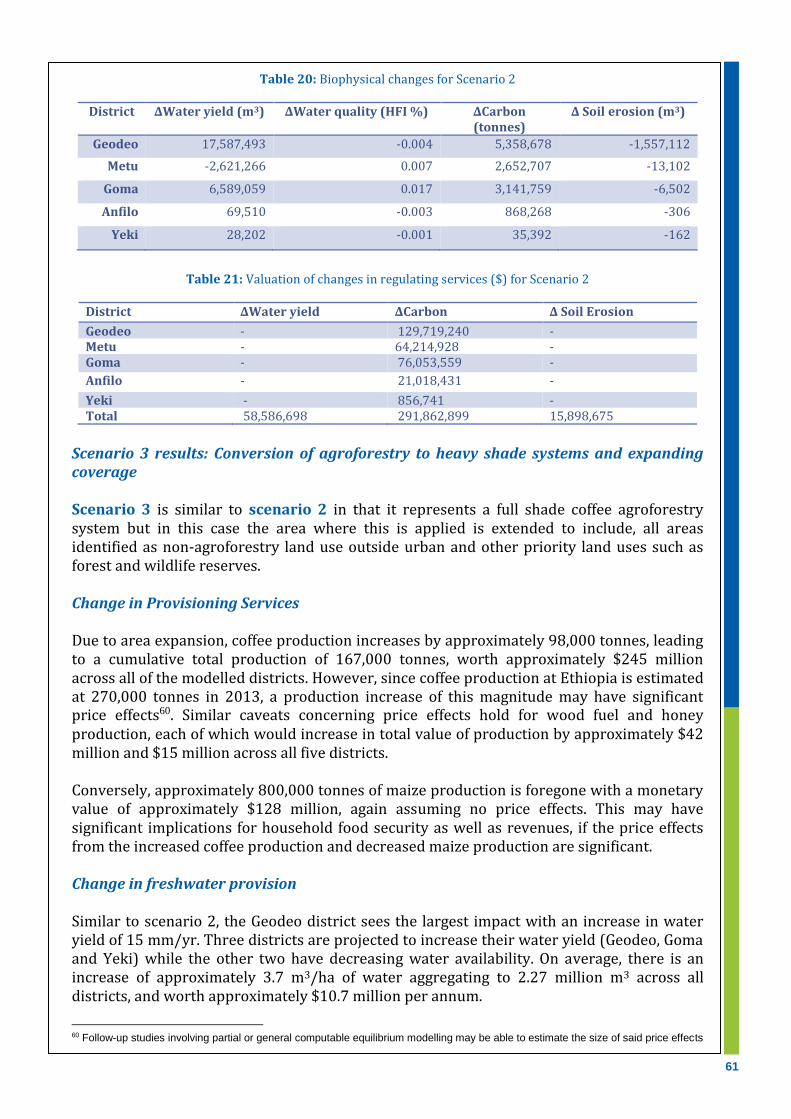
61
Table 20: Biophysical changes for Scenario 2
District ∆Water yield (m3) ∆Water quality (HFI %) ∆Carbon (tonnes)
∆ Soil erosion (m3)
Geodeo 17,587,493 -0.004 5,358,678 -1,557,112
Metu -2,621,266 0.007 2,652,707 -13,102
Goma 6,589,059 0.017 3,141,759 -6,502
Anfilo 69,510 -0.003 868,268 -306
Yeki 28,202 -0.001 35,392 -162
Table 21: Valuation of changes in regulating services ($) for Scenario 2
District ∆Water yield ∆Carbon ∆ Soil Erosion
Geodeo - 129,719,240 - Metu - 64,214,928 - Goma - 76,053,559 -
Anfilo - 21,018,431 -
Yeki - 856,741 - Total 58,586,698 291,862,899 15,898,675
Scenario 3 results: Conversion of agroforestry to heavy shade systems and expanding coverage Scenario 3 is similar to scenario 2 in that it represents a full shade coffee agroforestry system but in this case the area where this is applied is extended to include, all areas identified as non-agroforestry land use outside urban and other priority land uses such as forest and wildlife reserves. Change in Provisioning Services Due to area expansion, coffee production increases by approximately 98,000 tonnes, leading to a cumulative total production of 167,000 tonnes, worth approximately $245 million across all of the modelled districts. However, since coffee production at Ethiopia is estimated at 270,000 tonnes in 2013, a production increase of this magnitude may have significant price effects60. Similar caveats concerning price effects hold for wood fuel and honey production, each of which would increase in total value of production by approximately $42 million and $15 million across all five districts. Conversely, approximately 800,000 tonnes of maize production is foregone with a monetary value of approximately $128 million, again assuming no price effects. This may have significant implications for household food security as well as revenues, if the price effects from the increased coffee production and decreased maize production are significant. Change in freshwater provision Similar to scenario 2, the Geodeo district sees the largest impact with an increase in water yield of 15 mm/yr. Three districts are projected to increase their water yield (Geodeo, Goma and Yeki) while the other two have decreasing water availability. On average, there is an increase of approximately 3.7 m3/ha of water aggregating to 2.27 million m3 across all districts, and worth approximately $10.7 million per annum.
60 Follow-up studies involving partial or general computable equilibrium modelling may be able to estimate the size of said price effects
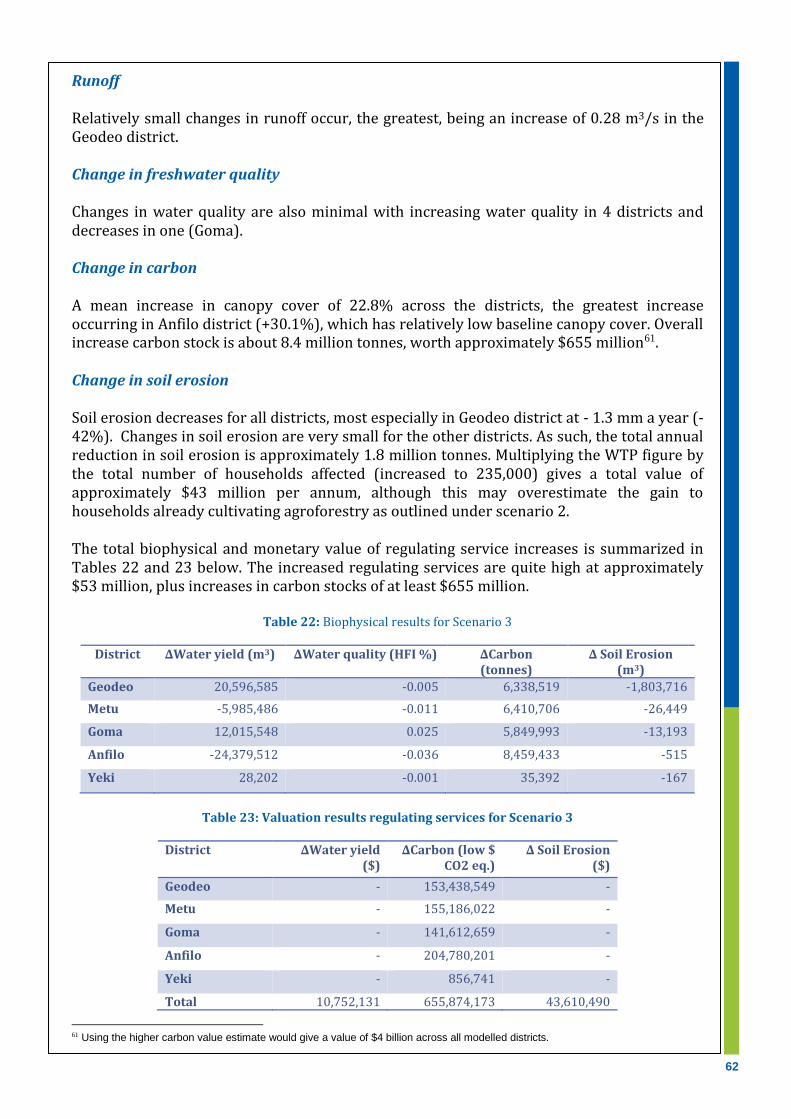
62
Runoff Relatively small changes in runoff occur, the greatest, being an increase of 0.28 m3/s in the Geodeo district. Change in freshwater quality Changes in water quality are also minimal with increasing water quality in 4 districts and decreases in one (Goma). Change in carbon A mean increase in canopy cover of 22.8% across the districts, the greatest increase occurring in Anfilo district (+30.1%), which has relatively low baseline canopy cover. Overall increase carbon stock is about 8.4 million tonnes, worth approximately $655 million61. Change in soil erosion Soil erosion decreases for all districts, most especially in Geodeo district at - 1.3 mm a year (- 42%). Changes in soil erosion are very small for the other districts. As such, the total annual reduction in soil erosion is approximately 1.8 million tonnes. Multiplying the WTP figure by the total number of households affected (increased to 235,000) gives a total value of approximately $43 million per annum, although this may overestimate the gain to households already cultivating agroforestry as outlined under scenario 2. The total biophysical and monetary value of regulating service increases is summarized in Tables 22 and 23 below. The increased regulating services are quite high at approximately $53 million, plus increases in carbon stocks of at least $655 million.
Table 22: Biophysical results for Scenario 3
District ∆Water yield (m3) ∆Water quality (HFI %) ∆Carbon (tonnes)
∆ Soil Erosion (m3)
Geodeo 20,596,585 -0.005 6,338,519 -1,803,716
Metu -5,985,486 -0.011 6,410,706 -26,449
Goma 12,015,548 0.025 5,849,993 -13,193
Anfilo -24,379,512 -0.036 8,459,433 -515
Yeki 28,202 -0.001 35,392 -167
Table 23: Valuation results regulating services for Scenario 3
District ∆Water yield ($)
∆Carbon (low $ CO2 eq.)
∆ Soil Erosion ($)
Geodeo - 153,438,549 -
Metu - 155,186,022 -
Goma - 141,612,659 -
Anfilo - 204,780,201 -
Yeki - 856,741 -
Total 10,752,131 655,874,173 43,610,490
61 Using the higher carbon value estimate would give a value of $4 billion across all modelled districts.

63
GENERAL REMARKS ON RESULTS FOR COFFEE IN ETHIOPIA
There is a high “natural” propensity for soil erosion because of high rainfall intensities and steep topography in the five districts. The main impacts on modelled provisioning and regulating ecosystem services from conversion to a monoculture maize crop are on soil erosion (increase), potential for water pollution (increase) and carbon stocks (decrease). Annual water provision is not much affected at the scale of the districts as water use under monocropping remains high.
When shade cover is increased on the other hand, carbon stock increases and soil erosion decreases. Other services are less strongly affected. Promotion and expansion of high shade coffee agroforestry in all the area in modelled districts leads to further increases in carbon stocks and decreases in soil erosion. Districts that lose most water provisioning under the conversion to maize scenario, gain most under the agroforestry expansion scenario.
3.1.6 Implications for policy and incentives for REDD+
Coffee agroforestry is a major pillar in the livelihoods of the Ethiopian smallholder farmers and the national economy. Although the practice provides a wide range of ecosystem services compared to alternative land uses like full sun coffee or even maize, the benefits it generates only lead to good welfare and the smallholder farmers still remain income poor. The replacement of natural tree species with fast growing alternatives in the farming landscapes and the expansion of coffee farming leading to deforestation and forest degradation are also of great concern. There are various opportunities the country can explore to make the provisioning and regulating ecosystem service values provided by coffee agroforestry, more profitable and prevent conversion to less ‘green’ alternative land uses while at the same time conserving forests and other ecosystems. The scenarios examined show that there is potential to improve regulating ecosystem services by increasing the shade level in coffee agroforestry without significant trade-off in provisioning ecosystem services.
Under the Climate Resilient Green Economy (CRGE) strategy by the Government of Ethiopia, the country aims for environmentally sustainable economic development while offsetting the potential impact of greenhouse gases (GHG) emissions. It targets to increase carbon sequestration from forest activities covering about 7 million hectares (CRGE, 2011). The national REDD+ program is a key pillar within this framework, which is mainly focusing on forest actions. So far, a number of relevant actions for achieving sequestration targets are underway, most notably, the Clean Development Mechanism Humbo Reforestation Project and two EU-funded initiatives in the Oromia region: the Bale Mountains Eco-Region REDD+ project and the Oromia Region REDD+ Pilot Programme. The latter will be piloting REDD+ through a landscape approach, which will generate lessons for building agroforestry and other agriculture based initiatives into REDD+.
Coffee agroforestry offers a key potential focus for the country to achieve REDD+ objectives because it stores substantial carbon stocks compared to alternative agricultural land uses on the one hand, yet it is also a key driver of deforestation and forest degradation. The system stores relatively high carbon stocks compared to maize and other alternative land uses. There is also potential to increase the carbon sequestration of the system by increasing to moderate or heavy shade without significant tradeoffs in provisioning services. However, because the REDD+ prices are low and agroforestry sequestration levels are not that high, carbon payments may only make sense at the landscape level. This needs to be integrated with various ongoing initiatives that enhance the profitability of the system at the individual farm level, as outlined below.

64
Creation of platforms for cooperatives: Since the 1990s, the Ethiopian government has created opportunities for restructuring cooperatives, which has made smallholder coffee systems more profitable by lowering transactions costs enabling direct engagement of bulk buyers without the middle men; negotiation of better prices and creating stable income as mutual insurance against unforeseen disasters. Two examples stand out strongly in this line. The Yirgacheffe Coffee Farmers Cooperative Union (YCFCU) established in 2002 and composed of 50,000 smallholder coffee producers in about 24 small cooperatives62 and the Oromia Coffee Farmers Cooperatives Union (OCFCU), established in 1999 and composed of 250,000 smallholder farmers in 240 smaller cooperatives63. The OCFCU also promotes wood energy use efficiency in cooking food and roasting coffee by providing cooking stoves.
Facilitation of farmer-market linkages: As of 2002, farmer cooperatives or unions can directly access credit and global coffee markets with the assistance of the government. Unions such as OCFCU and YCFCU are exempt from the Ethiopian Commodity Exchange (ECX) procedure in order to export coffee.
Certification and premium prices: Ethiopia began the first coffee certification in 200264
and now has several certification schemes including the Organic and Fair Trade, Rainforest Alliance and Forest Stewardship Council. These mainly focus on coffee produced in enset-coffee tree systems (with Albizzia, Acacia and Cordia), organic and wild coffee. These schemes which provide significant price premiums especially from key importers of Ethiopia’s coffee (Japan, Germany and Saudi Arabia) (Petit 2007; Wiersum et al. 2008; Minten et al. 2014), demand environmental sustainability and address a number of drivers of deforestation and forest degradation thus significantly contributing to REDD+ efforts. Moreover, eleven percent of the farmers in OCFCU are Fair Trade certified and close to 37% of the production is certified as organic65, and Ethiopia supplied a significant share (18%) of the global certified organic coffee market in 2012 (Potts et al. 2014). However, when aggregating certified Ethiopian coffee production across all VSS, it accounts for approximately 10% of national production but only around 2% of total VSS-certified production, suggesting that there is much untapped potential for accessing markets demanding VSS-certified coffee (Potts et al. 2014).
Credit mechanisms for smallholders provide livelihood options that may reduce poverty and thus pressure on forests. Cooperatives together with local banks organize credit mechanisms for smallholder farmer unions at smaller cooperative levels. For instance, The Oromia International Bank gives loans and credits to about 70% of members of OCFCU, which increases their engagement in sustainable coffee production and processing processes.
Advisory support for increasing profitability from the tree component through
appropriate tree species selection and tree management in coffee agroforestry systems, tree product harvesting and handling, value addition and marketing.
62 www.standingstonecoffeecompany.com/yirgacheffe.php 63 www.ifama.org/files/IFAMR/Vol%2017/Special%20Issue%20B/Oromia_11.pdf 64 www.ru.nl/cidin/research/new-solidaridad/ 65 www.alternativegrounds.com/oromia-coffee-farmers-cooperative-union-ethiopia

65
Owing to the strong state control on land (Crewett et al 2008), the incentive to expand coffee agroforestry into areas that require fresh planting of trees has been low due to a sense of tenure insecurity. Instead, coffee farmers have preferred to utilise the already existing tree cover offered by forests, leading to degradation. On-going issuance of land user right certificates is good incentive giving farmers a sense of land security with potential for reducing deforestation and promoting coffee agroforestry. The potential for coffee agroforestry to deliver positive hydrological services including reduction in runoff and soil erosion and improvements in water quality that could be developed into Payments for ecosystem services (PES) for watershed management. Direct PES payments would, however, require presence of downstream companies with capacity and willingness to pay, which is not the case in coffee highlands. Alternatively, financial incentives for coffee agroforestry can be obtained from increasing water tariffs or setting up a watershed management fund or tree fund with contributions from government, development partners and the private sector. Rather than payments, coffee agroforestry can be promoted through co-investment in mutually agreed management plans by government, community, private sector and other relevant stakeholders. The national strategy for restoring 22 million ha of degraded lands may provide opportunities for reducing deforestation and promoting agroforestry based coffee production (New York Declaration on Forests 3.B). Beyond carbon and forest/tree-based objectives, coffee agroforestry systems provide a variety of staple food crops and subsistence values that ensure household resilience as well as stable access to food and farm level incomes that are not susceptible to price slumps experienced in the coffee market. Therefore policies for promoting coffee agroforestry need to take into consideration these additional values, which provide very important cushions for the livelihoods of poor farmers through times of unfavourable market prices or climatic conditions. Scope exists to elevate these additional provisioning services from the mostly subsistence level by targeted efforts to increase their productivity through intensification programs and support their marketing. The regulating service values that contribute to climate resilience need to be included in national accounts in order to enable consideration of their importance in future development plans. There is potential for capturing further value on global coffee export markets by increasing the overall quality of coffee beans, increasing the share of washed coffee on the export market, as well as certification under voluntary sustainability standards such as organic or shade-grown coffee schemes (Petit et al. 2007; Minten et al. 2014). However, care will be needed in the implementation of certification schemes in order to ensure that benefits are not wholly captured by better-endowed households, and it is important to bear in mind that typically only a fraction of certified coffee gets sold as certified (and hence only a fraction of the price premiums are captured) (Petit et al. 2007; Ouaamari 2014). There is also an enormous potential for honey producers in coffee agroforestry systems to access international export markets and further satisfy domestic demand, although currently very little of Ethiopia’s honey is export grade and increased efforts in improving the productivity and quality of honey through improved bee-keeping techniques would be required (Reichuber et al. 2012; Miklyaev et al. 2012). This in turn implies that increased access to financing at favourable interest rates and training on improved bee-keeping techniques would likely be needed (Miklyaev et al. 2012).

66
3.2 Cocoa agroforestry in Ghana This chapter presents an analysis of ecosystem services in cocoa agroforestry systems in Ghana, how these are likely to change under different land use scenarios and provides recommendations for policy actions to ensure that trade-offs are minimised. The major issues addressed in this analysis are presented in Table 24 below.
Table 24: Overview of the analysis of cocoa agroforestry in Ghana
Issue Overview
Systems analysed Light shade/full sun cocoa, moderate shade cocoa, heavy shade cocoa and high-tech cocoa
Policy issues Cocoa expansion, Deforestation, national REDD+ program Location Districts of Adansi Soith, Atwima, Offinso, Asunafo North, Asunafo South and
Sefwi Wiawso Ecosystem services analysed
Provisioning: cocoa yield, timber, freshwater provisioning, food, tree fruits Regulating/supporting: soil fertility, soil erosion control, pollination, carbon, biodiversity, water quality, water yield
Business as usual trends
Expanding cocoa area leading to deforestation and forest degradation Declining tree shade in cocoa systems due to unfavourable tree tenure
rules Agricultural input subsidies to promote intensification of cocoa Land and tree tenure as disincentives for cocoa agroforestry
Alternative scenarios (Figure 8)
1. All cocoa agroforestry systems are converted to a light shade/full sun system 2. A shift to moderate/heavy shade system. 3. Agronomic improvement defined by the use of full sun variety, fertilizer, herbicide and other inputs in cocoa agroforestry systems
Figure 12: Potential scenarios for cocoa agroforestry in Ghana
3.2.1 Background Description of the cocoa agroforestry system
Cocoa is cultivated in six geographical regions of Ghana (Table 25 and Figure 12), which fall under two broad ecological zones (Amanor, 1996):
Moist Forest: which consists of the wet evergreen, moist ever green and moist semi-deciduous with rainfall in excess of 1200 mm per annum and;
Dry Forest: which consist of semi-deciduous inner zone and dry semi-deciduous outer fire zone with rainfall between 1000-1200 mm per annum.
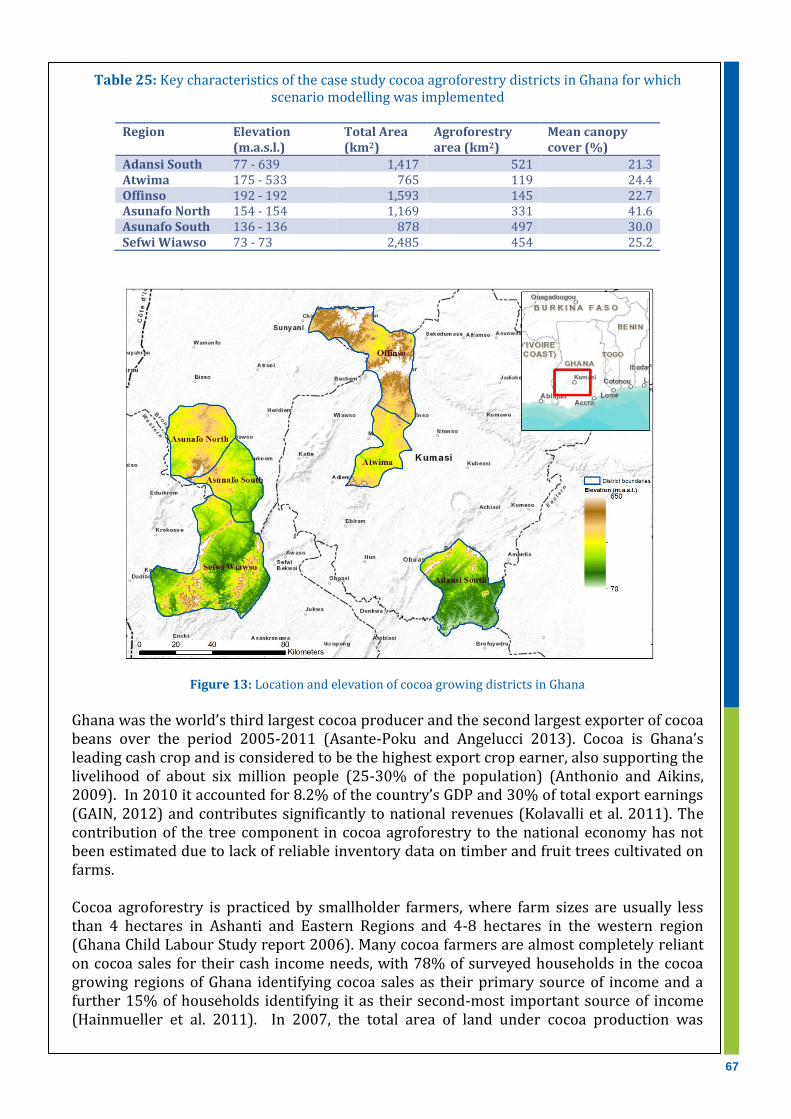
67
Table 25: Key characteristics of the case study cocoa agroforestry districts in Ghana for which scenario modelling was implemented
Region Elevation
(m.a.s.l.) Total Area (km2)
Agroforestry area (km2)
Mean canopy cover (%)
Adansi South 77 - 639 1,417 521 21.3 Atwima 175 - 533 765 119 24.4 Offinso 192 - 192 1,593 145 22.7 Asunafo North 154 - 154 1,169 331 41.6 Asunafo South 136 - 136 878 497 30.0 Sefwi Wiawso 73 - 73 2,485 454 25.2
Figure 13: Location and elevation of cocoa growing districts in Ghana
Ghana was the world’s third largest cocoa producer and the second largest exporter of cocoa beans over the period 2005-2011 (Asante-Poku and Angelucci 2013). Cocoa is Ghana’s leading cash crop and is considered to be the highest export crop earner, also supporting the livelihood of about six million people (25-30% of the population) (Anthonio and Aikins, 2009). In 2010 it accounted for 8.2% of the country’s GDP and 30% of total export earnings (GAIN, 2012) and contributes significantly to national revenues (Kolavalli et al. 2011). The contribution of the tree component in cocoa agroforestry to the national economy has not been estimated due to lack of reliable inventory data on timber and fruit trees cultivated on farms. Cocoa agroforestry is practiced by smallholder farmers, where farm sizes are usually less than 4 hectares in Ashanti and Eastern Regions and 4-8 hectares in the western region (Ghana Child Labour Study report 2006). Many cocoa farmers are almost completely reliant on cocoa sales for their cash income needs, with 78% of surveyed households in the cocoa growing regions of Ghana identifying cocoa sales as their primary source of income and a further 15% of households identifying it as their second-most important source of income (Hainmueller et al. 2011). In 2007, the total area of land under cocoa production was
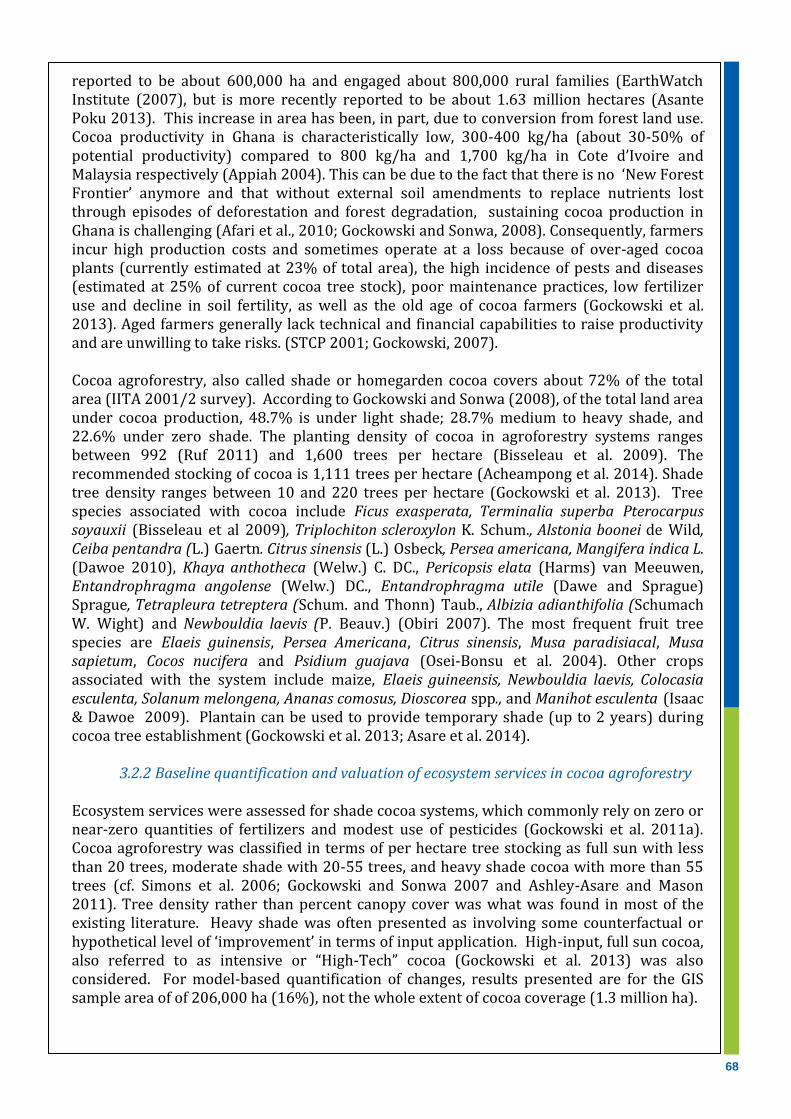
68
reported to be about 600,000 ha and engaged about 800,000 rural families (EarthWatch Institute (2007), but is more recently reported to be about 1.63 million hectares (Asante Poku 2013). This increase in area has been, in part, due to conversion from forest land use. Cocoa productivity in Ghana is characteristically low, 300-400 kg/ha (about 30-50% of potential productivity) compared to 800 kg/ha and 1,700 kg/ha in Cote d’Ivoire and Malaysia respectively (Appiah 2004). This can be due to the fact that there is no ‘New Forest Frontier’ anymore and that without external soil amendments to replace nutrients lost through episodes of deforestation and forest degradation, sustaining cocoa production in Ghana is challenging (Afari et al., 2010; Gockowski and Sonwa, 2008). Consequently, farmers incur high production costs and sometimes operate at a loss because of over-aged cocoa plants (currently estimated at 23% of total area), the high incidence of pests and diseases (estimated at 25% of current cocoa tree stock), poor maintenance practices, low fertilizer use and decline in soil fertility, as well as the old age of cocoa farmers (Gockowski et al. 2013). Aged farmers generally lack technical and financial capabilities to raise productivity and are unwilling to take risks. (STCP 2001; Gockowski, 2007). Cocoa agroforestry, also called shade or homegarden cocoa covers about 72% of the total area (IITA 2001/2 survey). According to Gockowski and Sonwa (2008), of the total land area under cocoa production, 48.7% is under light shade; 28.7% medium to heavy shade, and 22.6% under zero shade. The planting density of cocoa in agroforestry systems ranges between 992 (Ruf 2011) and 1,600 trees per hectare (Bisseleau et al. 2009). The recommended stocking of cocoa is 1,111 trees per hectare (Acheampong et al. 2014). Shade tree density ranges between 10 and 220 trees per hectare (Gockowski et al. 2013). Tree species associated with cocoa include Ficus exasperata, Terminalia superba Pterocarpus soyauxii (Bisseleau et al 2009), Triplochiton scleroxylon K. Schum., Alstonia boonei de Wild, Ceiba pentandra (L.) Gaertn. Citrus sinensis (L.) Osbeck, Persea americana, Mangifera indica L. (Dawoe 2010), Khaya anthotheca (Welw.) C. DC., Pericopsis elata (Harms) van Meeuwen, Entandrophragma angolense (Welw.) DC., Entandrophragma utile (Dawe and Sprague) Sprague, Tetrapleura tetreptera (Schum. and Thonn) Taub., Albizia adianthifolia (Schumach W. Wight) and Newbouldia laevis (P. Beauv.) (Obiri 2007). The most frequent fruit tree species are Elaeis guinensis, Persea Americana, Citrus sinensis, Musa paradisiacal, Musa sapietum, Cocos nucifera and Psidium guajava (Osei-Bonsu et al. 2004). Other crops associated with the system include maize, Elaeis guineensis, Newbouldia laevis, Colocasia esculenta, Solanum melongena, Ananas comosus, Dioscorea spp., and Manihot esculenta (Isaac & Dawoe 2009). Plantain can be used to provide temporary shade (up to 2 years) during cocoa tree establishment (Gockowski et al. 2013; Asare et al. 2014).
3.2.2 Baseline quantification and valuation of ecosystem services in cocoa agroforestry Ecosystem services were assessed for shade cocoa systems, which commonly rely on zero or near-zero quantities of fertilizers and modest use of pesticides (Gockowski et al. 2011a). Cocoa agroforestry was classified in terms of per hectare tree stocking as full sun with less than 20 trees, moderate shade with 20-55 trees, and heavy shade cocoa with more than 55 trees (cf. Simons et al. 2006; Gockowski and Sonwa 2007 and Ashley-Asare and Mason 2011). Tree density rather than percent canopy cover was what was found in most of the existing literature. Heavy shade was often presented as involving some counterfactual or hypothetical level of ‘improvement’ in terms of input application. High-input, full sun cocoa, also referred to as intensive or “High-Tech” cocoa (Gockowski et al. 2013) was also considered. For model-based quantification of changes, results presented are for the GIS sample area of of 206,000 ha (16%), not the whole extent of cocoa coverage (1.3 million ha).
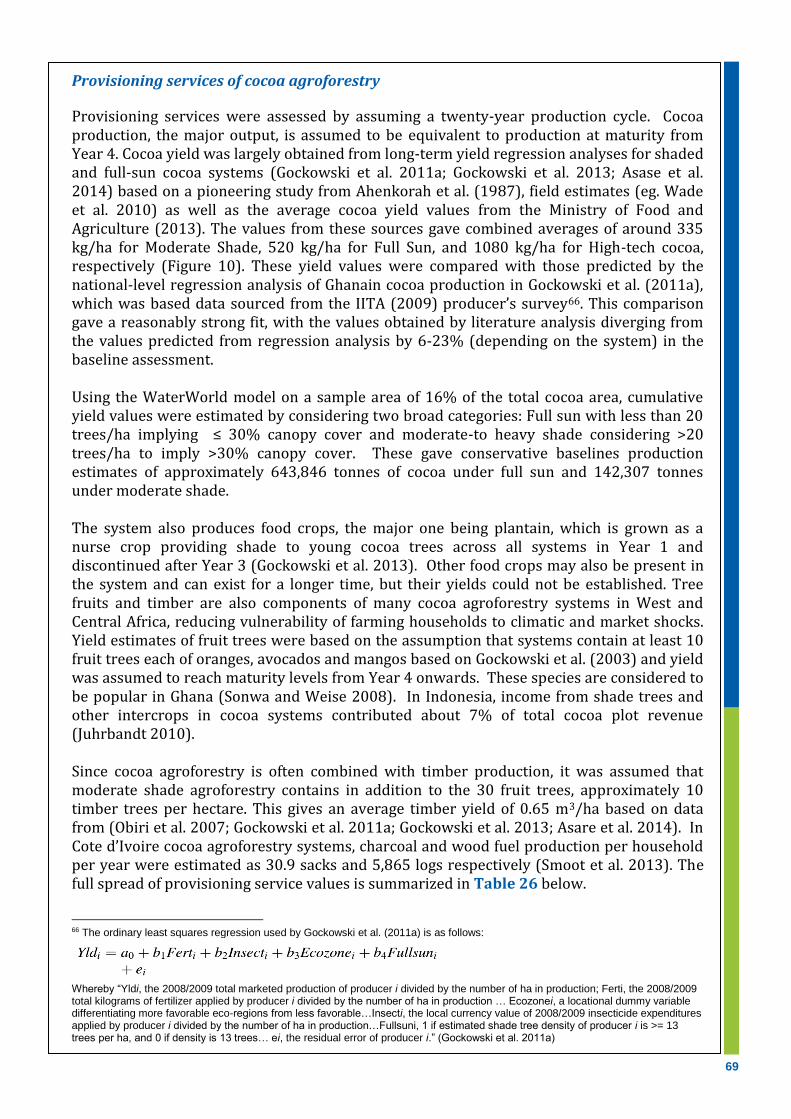
69
Provisioning services of cocoa agroforestry
Provisioning services were assessed by assuming a twenty-year production cycle. Cocoa production, the major output, is assumed to be equivalent to production at maturity from Year 4. Cocoa yield was largely obtained from long-term yield regression analyses for shaded and full-sun cocoa systems (Gockowski et al. 2011a; Gockowski et al. 2013; Asase et al. 2014) based on a pioneering study from Ahenkorah et al. (1987), field estimates (eg. Wade et al. 2010) as well as the average cocoa yield values from the Ministry of Food and Agriculture (2013). The values from these sources gave combined averages of around 335 kg/ha for Moderate Shade, 520 kg/ha for Full Sun, and 1080 kg/ha for High-tech cocoa, respectively (Figure 10). These yield values were compared with those predicted by the national-level regression analysis of Ghanain cocoa production in Gockowski et al. (2011a), which was based data sourced from the IITA (2009) producer’s survey66. This comparison gave a reasonably strong fit, with the values obtained by literature analysis diverging from the values predicted from regression analysis by 6-23% (depending on the system) in the baseline assessment. Using the WaterWorld model on a sample area of 16% of the total cocoa area, cumulative yield values were estimated by considering two broad categories: Full sun with less than 20 trees/ha implying ≤ 30% canopy cover and moderate-to heavy shade considering >20 trees/ha to imply >30% canopy cover. These gave conservative baselines production estimates of approximately 643,846 tonnes of cocoa under full sun and 142,307 tonnes under moderate shade. The system also produces food crops, the major one being plantain, which is grown as a nurse crop providing shade to young cocoa trees across all systems in Year 1 and discontinued after Year 3 (Gockowski et al. 2013). Other food crops may also be present in the system and can exist for a longer time, but their yields could not be established. Tree fruits and timber are also components of many cocoa agroforestry systems in West and Central Africa, reducing vulnerability of farming households to climatic and market shocks. Yield estimates of fruit trees were based on the assumption that systems contain at least 10 fruit trees each of oranges, avocados and mangos based on Gockowski et al. (2003) and yield was assumed to reach maturity levels from Year 4 onwards. These species are considered to be popular in Ghana (Sonwa and Weise 2008). In Indonesia, income from shade trees and other intercrops in cocoa systems contributed about 7% of total cocoa plot revenue (Juhrbandt 2010). Since cocoa agroforestry is often combined with timber production, it was assumed that moderate shade agroforestry contains in addition to the 30 fruit trees, approximately 10 timber trees per hectare. This gives an average timber yield of 0.65 m3/ha based on data from (Obiri et al. 2007; Gockowski et al. 2011a; Gockowski et al. 2013; Asare et al. 2014). In Cote d’Ivoire cocoa agroforestry systems, charcoal and wood fuel production per household per year were estimated as 30.9 sacks and 5,865 logs respectively (Smoot et al. 2013). The full spread of provisioning service values is summarized in Table 26 below.
66 The ordinary least squares regression used by Gockowski et al. (2011a) is as follows:
Whereby “Yldi, the 2008/2009 total marketed production of producer i divided by the number of ha in production; Ferti, the 2008/2009 total kilograms of fertilizer applied by producer i divided by the number of ha in production … Ecozonei, a locational dummy variable differentiating more favorable eco-regions from less favorable…Insecti, the local currency value of 2008/2009 insecticide expenditures applied by producer i divided by the number of ha in production…Fullsuni, 1 if estimated shade tree density of producer i is >= 13 trees per ha, and 0 if density is 13 trees… ei, the residual error of producer i.” (Gockowski et al. 2011a)

70
Table 26: Provisioning services for cocoa agroforestry in Ghana (per hectare per year)
Service System Quantity Value ($) Reference
Cocoa (kg) Moderate Shade
280 Gockowski et al. 2013 403 Gockowski et al. 2011a 321 Wade et al. 2010
546 Nunoo et al. 2014* Average 335 1,993 Full Sun 519 Gockowski et al. 2011a
318 Obiri et al. 2007* Average 519 3,090 High Tech 1,235 Gockowski et al. 2013
1053 Gockowski et al. 2011a 927 Obiri et al. 2007 949 Asare et al. 2014
Average 1080 6,400
Plantain (kg) - 2591 Opuku et al. 2012 All systems 3500 Gockowski et al. 2013
Average 3231 2890 @ $0.96/kg**
Cassava (kg) - 5297 Opuku et al. 2012 Maize (kg) - 1200 Opuku et al. 2012 Fruit Tree Products (kg)
Moderate Shade
348.9 67 339.73 Gockowski et al. 2004; Ministry of Agriculture 2008a & 2008b;
USAID 2009, FAOSTAT 2015 Other food crops (establishment phase only)
Moderate Shade
2821.65 Obiri et al. 2007
Timber (m3) Moderate Shade
1.04 Gockowski et al. 2011a***
0.48 Gockowski et al. 2013 ***
0.23 Obiri et al. 2007 ***
0.85 Asare et al. 2014
Average 0.65 70.5 Litter (kg) Shaded
600 Asase 2008
546.67 Dawoe 2010 Full Sun 200 Asase 2008
* Estimate not used because yields were based on regression equations developed for Costa Rican context (Ryan et al. 2007). ** 2011 Farm gate price (FAOSTAT 2015), adjusted for purchasing power parity and inflation. *** Adapted values from heavy shade systems
Figure 14: Cocoa yields from national average, full sun, moderate shade, heavy shade and high-tech cocoa (kg/ha). Error bars are for standard deviations (+/-). Values for heavy shade and high tech are with some
degree of input application and do not necessarily reflect ordinary system yields.
67 Benefit transfer from Cameroon agroforests.
0
200
400
600
800
1000
1200
1400
AverageCocoaYield
Full sun Moderateshade
HeavyShade
High-tech

71
Heavy shade (with high levels of input application) gives yield higher than the average yield for Ghana and not significantly different from that of high tech systems, The input use seems to more than offset the yield depression due to shade. High tech yield in Ghana only matches average yield levels of Cote d’Ivoire. High Tech cocoa yield, however declines in trees aged 25-30 years (Tscharntke et al. 2011) due to weeds, pest and disease attack unless agrochemical and fertilizer application is sustained (Schroth et al. 2000). Freshwater provision
Annual fresh water yield was estimated using WaterWorld model and this ranged between 915 mm (Offinso) and 1,257 mm (Sefwi Wiawso). This gave total fresh water yield ranging from 0.8 km3 (Atwima) in the smallest district to 3.1 km3 in the largest district one (Sefwi Wiawso). Valuation of provisioning services
A cost-benefit analysis was used to estimate the value of cocoa agroforestry systems over a cycle of 20 years (Figure 11). Plantains, discontinued after the third year, were valued as a food crop for Years 2 and 3. The value of food from all three systems was similar. Values for cocoa and fruit tree yield were from years 4-20. The most recent cocoa price update from the Ghana Cocoa Board (COCOBOD) of GHc 5.52/kg68 ($5.95/kg69) was used. Using this price resulted in average values of approximately $2000/ha, $3100/ha and $6400/ha for moderate shade, full sun and high-tech cocoa respectively. Farm-gate price information for fruit trees was obtained from Ministry of Agriculture (2008a & b) and USAID (2009). Timber was valued at a price of $107/m3 as reported in Gockowski et al. (2013)70. This gives a cumulative value of approximately $1400/ha, assuming all timber is harvested at year 20. Other provisioning services considered included honey, medicinal plants, and biomass energy (wood fuel and charcoal), but information on their quantities and values was scarce in the CBA, economic valuation and farmer preference literature on cocoa agroforests in West Africa. Gockowski et al. (2010) estimated the value of trees in cocoa agroforestry systems that are used for malaria treatment in Cameroon as saving households approximately $7957 per malaria incident. However, without further information on household size, the size of cocoa farmers’ holdings and frequency of malaria bouts, these medicinal benefits cannot be valued on a per-hectare basis. Likewise, charcoal and wood fuel figures could not be converted to per hectare monetary values without additional information about local prices in Ghana71. Food security and resilience in cocoa agroforestry systems In cocoa agroforestry systems, plantains and cocoyams serve as nurse crops for cocoa (Gockowski et al. 2013), and plantain yield per hectare is approximately 4500 kg (5.22 million kilocaries or 2000 days’ worth) in Year 2 and 2500 kg of food (2.9 million kilocaries or 1000 days’ worth) in Year 3. In the modelled moderate shade system, fruit from mango, avocado and tangerines provide approximately 21, 52 and 21 days’ worth of calories per year. However, the actual harvested volumes (as a function of tree density and yields per tree) as well as tree crop species will vary from farm to farm. In the full-sun system by
68Ministry of Finance, Republic of Ghana. Review of the Producer Price of Cocoa for the 2014/2015 Cocoa Season. Last accessed 02 October 2015. Accessible at: http://www.mofep.gov.gh/?q=content/review-producer-price-cocoa-20142015-cocoa-season. See also: Cocobod Reviews Producer Price, Ghana Daily, October 3 2014. 69 In 2013 PPP equivalent US dollars. 70 Converted from GhC to PPP equivalent US dollars. 71 Moreover, it was unclear whether these provisioning service values were also valid for the Ghanaian context.
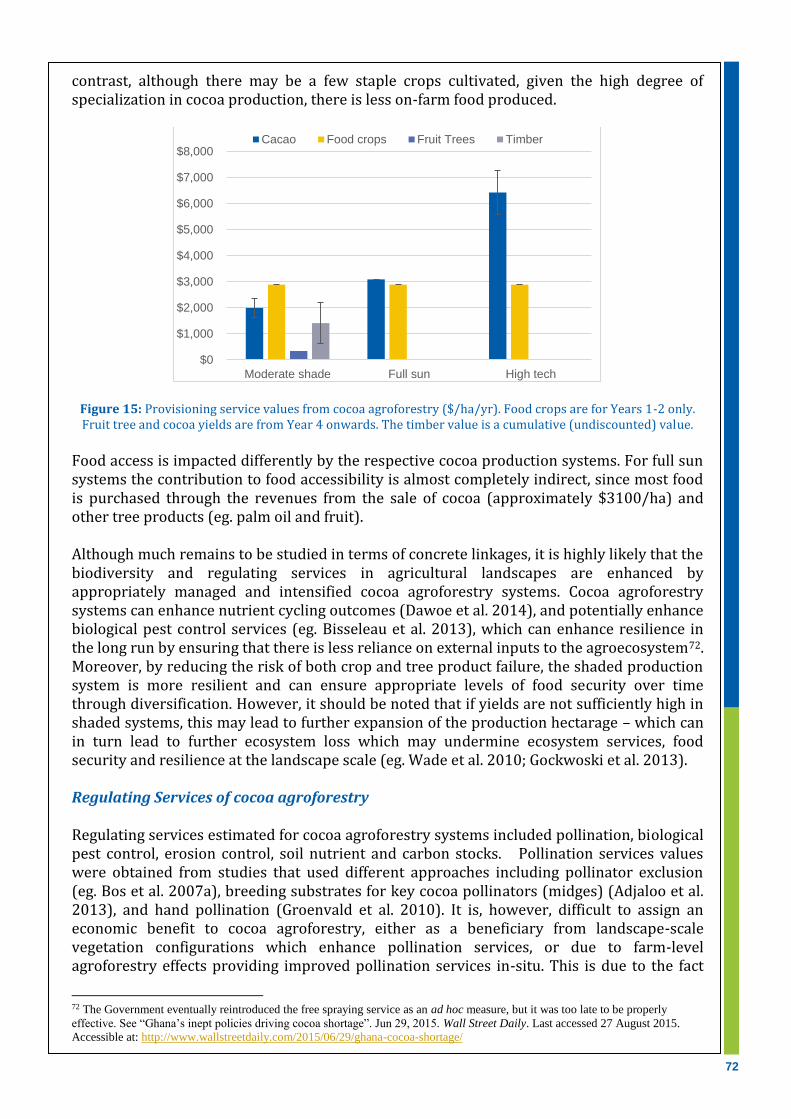
72
contrast, although there may be a few staple crops cultivated, given the high degree of specialization in cocoa production, there is less on-farm food produced.
Figure 15: Provisioning service values from cocoa agroforestry ($/ha/yr). Food crops are for Years 1-2 only. Fruit tree and cocoa yields are from Year 4 onwards. The timber value is a cumulative (undiscounted) value.
Food access is impacted differently by the respective cocoa production systems. For full sun systems the contribution to food accessibility is almost completely indirect, since most food is purchased through the revenues from the sale of cocoa (approximately $3100/ha) and other tree products (eg. palm oil and fruit). Although much remains to be studied in terms of concrete linkages, it is highly likely that the biodiversity and regulating services in agricultural landscapes are enhanced by appropriately managed and intensified cocoa agroforestry systems. Cocoa agroforestry systems can enhance nutrient cycling outcomes (Dawoe et al. 2014), and potentially enhance biological pest control services (eg. Bisseleau et al. 2013), which can enhance resilience in the long run by ensuring that there is less reliance on external inputs to the agroecosystem72. Moreover, by reducing the risk of both crop and tree product failure, the shaded production system is more resilient and can ensure appropriate levels of food security over time through diversification. However, it should be noted that if yields are not sufficiently high in shaded systems, this may lead to further expansion of the production hectarage – which can in turn lead to further ecosystem loss which may undermine ecosystem services, food security and resilience at the landscape scale (eg. Wade et al. 2010; Gockwoski et al. 2013).
Regulating Services of cocoa agroforestry Regulating services estimated for cocoa agroforestry systems included pollination, biological pest control, erosion control, soil nutrient and carbon stocks. Pollination services values were obtained from studies that used different approaches including pollinator exclusion (eg. Bos et al. 2007a), breeding substrates for key cocoa pollinators (midges) (Adjaloo et al. 2013), and hand pollination (Groenvald et al. 2010). It is, however, difficult to assign an economic benefit to cocoa agroforestry, either as a beneficiary from landscape-scale vegetation configurations which enhance pollination services, or due to farm-level agroforestry effects providing improved pollination services in-situ. This is due to the fact
72 The Government eventually reintroduced the free spraying service as an ad hoc measure, but it was too late to be properly
effective. See “Ghana’s inept policies driving cocoa shortage”. Jun 29, 2015. Wall Street Daily. Last accessed 27 August 2015.
Accessible at: http://www.wallstreetdaily.com/2015/06/29/ghana-cocoa-shortage/
$0
$1,000
$2,000
$3,000
$4,000
$5,000
$6,000
$7,000
$8,000
Moderate shade Full sun High tech
Cacao Food crops Fruit Trees Timber

73
that increased levels of pollination have been documented to increase frequency of cocoa fruit abortion, mostly as an energy conservation strategy (Bos et al. 2007b), thus complicating assessments of pollinators’ contribution to cocoa yield. Pest control services were found only in two studies estimating effects on yields or net returns. The main study quantifying effects on yields was undertaken in Indonesia (Maas et al. 2013), where bird and bat (biological control agent) exclosures reduced cocoa yields by as much as one-third. However, this yield reduction from bird and bat exclosures was constant across both shade cover and distance to forest gradients in the experiment, implying that cocoa agroforests are likely to be beneficiaries rather than providers of these biological control services (and that agroforestry systems do not provide any additional substitute or complementary biological control services). According to a study in Cameroon (Bisseleau et al. 2013), shade intensity of native species tends to be related to lower pest incidences, and lower input costs, and hence may provide enhanced pest control services. From these and the other retained studies, it was determined that the evidence base was too thin to value biological pest control of cocoa in Ghana. Soil erosion resulting in nutrient loss is reported to be negligible in mature cocoa agroforests except when located on very steep slopes (Tscharnke et al. 2011, citing Hartemink 2005), however studies to quantify these losses were not readily available. Nutrient uptake of cocoa trees in Ghana was observed by Timmer & Quashie-Sam (2007) to increase by 43–80%, 22–45% and 96–140% for nitrogen, phosphorus, potassium (NPK) respectively under shade tree systems compared to monoculture, however this varied widely and depended a lot on how the shade trees were managed. Nitrogen stock was estimated at was 3,275 kg/ha (Dawoe et al. 2010; Dawoe et al. 2014) at 0-20 cm depth for moderate shade cocoa. Full Sun system values were obtained on per unit mass (eg. ug/g) and could not be converted to stock values without information on soil bulk density values. Similar issues precluded the valuation of soil P and K stocks from these same studies. Values are summarised in Table 27.
Table 27: Regulating ecosystem services per hectare per year in cocoa agroforestry in Ghana
Service System Quantity Reference
Biological pest control – avoided loss*
Moderate & Heavy shade 31% Mass et al. 2013)
Litter yield Moderate shade 14 Mg Beer et al. 1998
Soil N stock Moderate shade 3360 kg Dawoe 2010 3190 kg Dawoe 2014
Average 3275 kg High Tech 0.19% Asase 2008
Available P stock Moderate shade
3.69 kg Dawoe 2014 15.5 ug/g Asase et al. 2008
High Tech 9.9 ug/ Asase et al. 2008
Exchangeable K stock Moderate shade 335.3 kg Dawoe et al. 2014
High Tech 0.1 cmol/(+) Asase et al. 2008
Buffering high temperature extremes
Moderate shade 50C Beer et al. 1998
* “Avoided loss” i.e. loss prevented by biological agents (birds and bats) is not necessarily attributable to an agroforestry effect.

74
Biodiversity Cocoa agroforestry biodiversity values in West and Central Africa are comparable to those of secondary forests (Gockowski et al. 2006, Sonwa et al. 2007) and some forest vegetative biodiversity is conserved in cocoa agroforestry systems (Wade et al. 2010). Approximately one third of the trees identified on the shaded cocoa farms are classified as vulnerable under IUCN (Anglaaere et al. 2011). Cocoa agroforestry delivers about 43% the value of a forest as a habitat for birds, based on a number of indices73. Forest reserves have significantly higher abundance of bird species with conservation importance (red list species and endemics) than shaded cocoa farms (Holbech et al. 2005) – Table 28. No studies from West and Central Africa placed an economic value on on-farm vegetative, insect or mammalian diversity. Quantifying on-farm biodiversity, as well as economic studies assessing local farmers, national stakeholders’ and global societies’ willingness to pay for on-farm biodiversity conservation for shaded cacao systems remain important areas of further research. However, equally if not more important is the biodiversity at the landscape scale – the West African Guinean rainforest has been identified as a biodiversity hotspot, yet forest clearing for low productivity, extensive cash crops such as oil palm and cacao by smallholders in Ghana and elsewhere remain a critical driver of deforestation (Gockowski et al. 2011a). The Bia Conservation Area and Kroshua hills Forest reserve in the Western region of Ghana are rainforests with very high biodiversity importance, as they include important habitat for the Roloway Guenon (Cercopithecus diana roloway) and the white-naped mangabey (Cercocebus atys lunulatus), which are two of the most highly endangered primates in Africa (Oates 2006; Asare et al. 2014). Shade-grown cocoa can play a major role in reducing pressure on these ecosystems thus safeguarding this larger stock of biodiversity. On the other hand, given the low productivity of cocoa agroforestry systems and in light of COCOBOD’s targets to stabilize national production at one million tonnes per year, several authors have made a case that full-sun systems could potentially have a much greater potential role in ‘sparing’ these ecosystems (Wade et al. 2010; Gockowski et al. 2011a; Gockowski et al. 2013). On the other hand, the potential for a cocoa landscape to provide a “biological corridor" between national parks and forest reserves underscores its the importance for landscape-scale biodiversity (Asare et al. 2014; Acheampong et al. 2015).
73 These include the Relative abundance (i.e. birds netted per net-meter-hours), Abundance-based Coverage Estimator of species richness, Chao 2 estimator of species richness, Jack-knife 2 estimator of species richness and the Shannon-Wiener index of species diversity (H’).

75
Table 28: Vegetation diversity in cocoa systems in Ghana
System No. of forest species
% compared to natural forest
Biodiversity index
Source
Forest 170 Wade et al. 2010 2.67 (Shannon-
Weiner - birds) Holbech et al. 2005
Moderate Shade
26 15% number of tree species
Wade et al. 2010
60% vegetation species Asase et al. 2005 40 1.34 (Shannon H -
vegetation) Archeampong et al.
2015 77% bird species Asase et al. 2005 Mature agroforests
50% spp richness Anglaaere et al. 2011
50% Bird spp richness Holbech et al. (005
1.47 (Shannon-Weiner - birds)
Holbech et al. 2005
61% fruit-feeding butterflies
Asase et al. 2005
Full sun 38 1.3 (Shannon H) Archeampong et al. 2015
14 8% number of tree species
Wade et al. 2010
8% vegetation species Asase et al. 2005
32% bird species Asase et al. 2005 41% fruit-feeding
butterflies Asase et al. 2005
Carbon stocks Carbon, values were obtained for above and below-ground biomass, as well as soil carbon (at 0-20 cm depth). As mentioned in the methodology section, where only aboveground biomass was available, belowground biomass values were imputed using Norgrove and Hauser’s (2013) estimate of 13% total biomass attributable to root biomass – this root biomass fraction was also used for the shade trees. Due to limitations in the dataset, the same studies were used to estimate biomass and soil C stocks for full sun and high-tech systems, although this may pose a risk of underestimating values from the high-tech system. The average total C stocks came to approximately 61 Mg C/ha and 80 Mg C/ha for Full Sun and Moderate Shade cocoa systems, respectively, but there is no significant difference between the two (Table 29 and, Figure 15). Given the difference in total areas, Sefwi Wiawso yields the greatest carbon stock of 6.5 million tons carbon while Atwima has the lowest total stock of 1.9 million tonnes carbon, with a total value of over 23.4 million tonnes of carbon across all districts. Multiplying the carbon stock across all districts by the C-CO2 conversion factor of 3.67 and the low ($6.5/tonne CO2eq.) and high carbon price gives a range of $565 million to $3.4 billion (Figure 15).

76
Table 29: Baseline assessment - carbon stocks of cocoa agroforestry in Ghana
Service System Quantity Reference
Biomass C stock (Mg)
Moderate shade 23.74 Acheampong et al. 2014
61.72 Isaac 200574 Average 42.73
High Tech
28.16 Gockowski et al. 2011a
39.2 Wade et al. 2010 23.90 Asase et al. 2008
16.29 Acheampong et al. 2014
Average 26.89 Soil C stock* (Mg)
Moderate shade 40.8 Dawoe et al. 2010, 34.8 Dawoe et al. 2014
Average 37.8 High Tech 43.2 Gockowski et al. 2011a
30.6 Ofori-Frimpong et al. 2010 Average 34.82
Figure 16: Carbon stocks in cocoa agroforestry systems in Ghana (Mg C/ha). “Biomass” refers to above and
belowground biomass from both cocoa and upper canopy trees.
Runoff Runoff was estimated also based on the WaterWorld model for four sub-basins that most directly overlapped the areas under cocoa agroforestry (Figure x), since the district boundaries did not align with river basins. Mean annual runoff for these four sub-basin outlets was greatest for the largest sub-basin that includes parts of Asunafo South and Sefwi Wiawso (sub-basin 2) with 39.6 m3/s. Mean annual runoff for sub-basin 1 (Asunafo North) is 3.2 m3/s, for sub-basin 3 (Offinso and Atwima), 7.5 m3/s and for sub-basin 4 (Adansi South), 3.0 m3/s.
74 This system with only 56 stems/ha is only marginally heavy shade. The Acheampong et al. (2014) system with 20-22 stems/ha is also only marginally moderate shade, but with the Isaac (2005) estimate, the average biomass C stock value is still within the range of values found for full sun (eg. Wade et al. 2010).
0
20
40
60
80
100
120
Moderate shade Full sun High tech
C stock- soil

77
Figure 17: Water run-off within sub-basins that overlapped most with the study areas
Water quality
The mean human footprint index (mean percentage of water that may be polluted) was relatively low in all six districts with maximum value in the Atwima district (4.2%) due to the city of Ashanti partly extending into this district and therefore the potential pollution sources are higher.
Soil erosion
Baseline total soil erosion from the six districts is relatively low with values between 0.1 mm and 1.6 mm/year. This equates to between 1.5 and 15.7 tonnes/ha/yr for Offinso and Atwima district respectively. Total soil erosion is expected to be quite low since forest cover is relatively high in all districts, with a cumulative value of approximately 2.9 million m3 across all modelled districts. Modelled baseline services in cocoa agroforestry are summarised in Table 30.
Table 30: Baseline services in for cocoa agroforestry
District Water yield (m3/ha)
Water quality (HFI %)
Carbon (tonnes/ha)
Soil Erosion (tonnes/ha)
Adansi South 32,991.61 3.3 60.39881 3.16811 Atwima 66,519.44 4.2 164.3207 15.73149 Offinso 100,628.8 3.1 261.4108 0.94209 Asunafo North 32,468.48 2.2 155.2993 1.4942 Asunafo South 18,049.73 3.5 55.75732 2.20462 Sefwi Wiawso 68,843.89 2.4 144.4907 2.92142
Valuation of regulating services
Results-based REDD+ payments based on the differences in carbon stocks are visualized below. Results show that the additional carbon stocks are such that payments for in-situ carbon sequestration under medium shaded cocoa in Ghana would be quite modest, ranging from $23-$140/ha/year depending on the carbon price. As such, payments for in-site carbon sequestration are unlikely to incentivize land sparing (reducing pressure on ecosystems with high conservation value) alone – if carbon payments for REDD+ are to succeed and be remunerative for farmers, it is likely that payments for avoided deforestation will also be required.
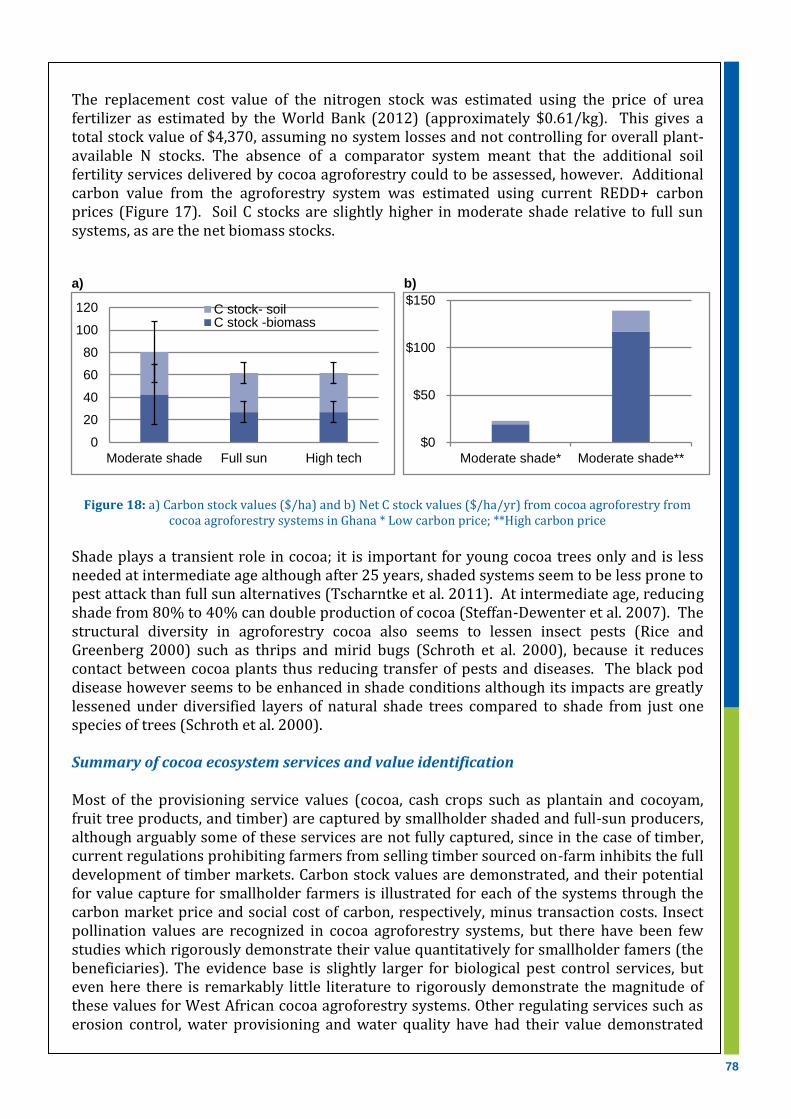
78
The replacement cost value of the nitrogen stock was estimated using the price of urea fertilizer as estimated by the World Bank (2012) (approximately $0.61/kg). This gives a total stock value of $4,370, assuming no system losses and not controlling for overall plant-available N stocks. The absence of a comparator system meant that the additional soil fertility services delivered by cocoa agroforestry could to be assessed, however. Additional carbon value from the agroforestry system was estimated using current REDD+ carbon prices (Figure 17). Soil C stocks are slightly higher in moderate shade relative to full sun systems, as are the net biomass stocks.
a)
b)
Figure 18: a) Carbon stock values ($/ha) and b) Net C stock values ($/ha/yr) from cocoa agroforestry from cocoa agroforestry systems in Ghana * Low carbon price; **High carbon price
Shade plays a transient role in cocoa; it is important for young cocoa trees only and is less needed at intermediate age although after 25 years, shaded systems seem to be less prone to pest attack than full sun alternatives (Tscharntke et al. 2011). At intermediate age, reducing shade from 80% to 40% can double production of cocoa (Steffan-Dewenter et al. 2007). The structural diversity in agroforestry cocoa also seems to lessen insect pests (Rice and Greenberg 2000) such as thrips and mirid bugs (Schroth et al. 2000), because it reduces contact between cocoa plants thus reducing transfer of pests and diseases. The black pod disease however seems to be enhanced in shade conditions although its impacts are greatly lessened under diversified layers of natural shade trees compared to shade from just one species of trees (Schroth et al. 2000). Summary of cocoa ecosystem services and value identification Most of the provisioning service values (cocoa, cash crops such as plantain and cocoyam, fruit tree products, and timber) are captured by smallholder shaded and full-sun producers, although arguably some of these services are not fully captured, since in the case of timber, current regulations prohibiting farmers from selling timber sourced on-farm inhibits the full development of timber markets. Carbon stock values are demonstrated, and their potential for value capture for smallholder farmers is illustrated for each of the systems through the carbon market price and social cost of carbon, respectively, minus transaction costs. Insect pollination values are recognized in cocoa agroforestry systems, but there have been few studies which rigorously demonstrate their value quantitatively for smallholder famers (the beneficiaries). The evidence base is slightly larger for biological pest control services, but even here there is remarkably little literature to rigorously demonstrate the magnitude of these values for West African cocoa agroforestry systems. Other regulating services such as erosion control, water provisioning and water quality have had their value demonstrated
0
20
40
60
80
100
120
Moderate shade Full sun High tech
C stock- soilC stock -biomass
$0
$50
$100
$150
Moderate shade* Moderate shade**
79
both quantitatively and economically, but the total extent to which these benefits have been captured by the farmer have not been quantified, to say nothing of designing institutional mechanisms for enhancing benefit capture in these systems. Finally, although we recognize the significant existence value attached to avian and vegetative biodiversity in cocoa agroforestry systems as well as their role in fostering agro-ecosystem resilience, there have been virtually no studies which quantify (and hence demonstrate) the economic value of biodiversity in these systems. We also recognize the potential land scape enhancement benefits from cocoa agroforestry systems as part a broader land-sharing strategy at the forest margins and as wildlife corridors, although the extent to which full shade systems enhance biodiversity relative to more intensified systems is an open question. We also qualitatively identify mechanisms for capturing these benefits in the discussion section of this chapter, through certification schemes for eg. Rainforest Alliance and UTZ-certified production. Input costs and gross margin Labour and other input costs, drawn from several sources, are summarized in Table 31 below. Labour estimates for the moderate shade are derived from Obiri’s estimated labour costs from hybrid shaded agroforestry, and from Gockowski’s labour estimates for Rainforest Alliance certified cocoa systems in Ghana. The full sun estimates are an average of Obiri’s traditional (shade deficient) cocoa production systems and the labour estimates for intensive fine flavor cocoa systems as estimated by Gockwoski (2011b). For the high-tech systems, only the Gockowski (2011b) estimate was used. Due to limitations in the dataset, labour costs could not be consistently broken down into system establishment and maintenance costs, so the two costs elements are ‘smoothed’ to make for a uniform annual labour cost throughout the production cycle.75 For the medium shade and low shade extensive cocoa production systems, the study assumes no fertilizer use as described by Gockowski et al. (2013) and as corroborated by the 2008/2009 IITA cocoa producers survey, which found that only 17% among Ghanaian cocoa producers use fertilizers. The high tech system assumes the maximum recommended NPK fertilizer input of 381 kg/ha (Gockoski et al. 2011a; IITA 2009), which when multiplied by the full fertilizer costs (i.e. without Government subsidies, as estimated in Gockowski et al. 2011a) gives an estimated cost of $551/ha. For the medium and low shade extensive systems, the study assumes the average insecticide use as reported by the 2008/2009 IITA producer survey, whereas we assume much greater quantities applied in high-tech systems, again based on (Gockoski et al. 2011a; IITA 2009). Average annual costs for additional inputs (plantain suckers, cocoa pods, pruning knives and cutlasses, watering can etc.) across all systems were estimated from Gockowski et al’s (2011b), which gave a value of approximately $352/ha/year. In Sulawesi Indonesia, pesticide costs in high tech systems were estimated to be one third of the total variable costs in cocoa plot management (Juhrbandt 2010).
75 Although this biased the NPV estimates upwards across all systems, the consequences are less severe for comparisons between
systems.
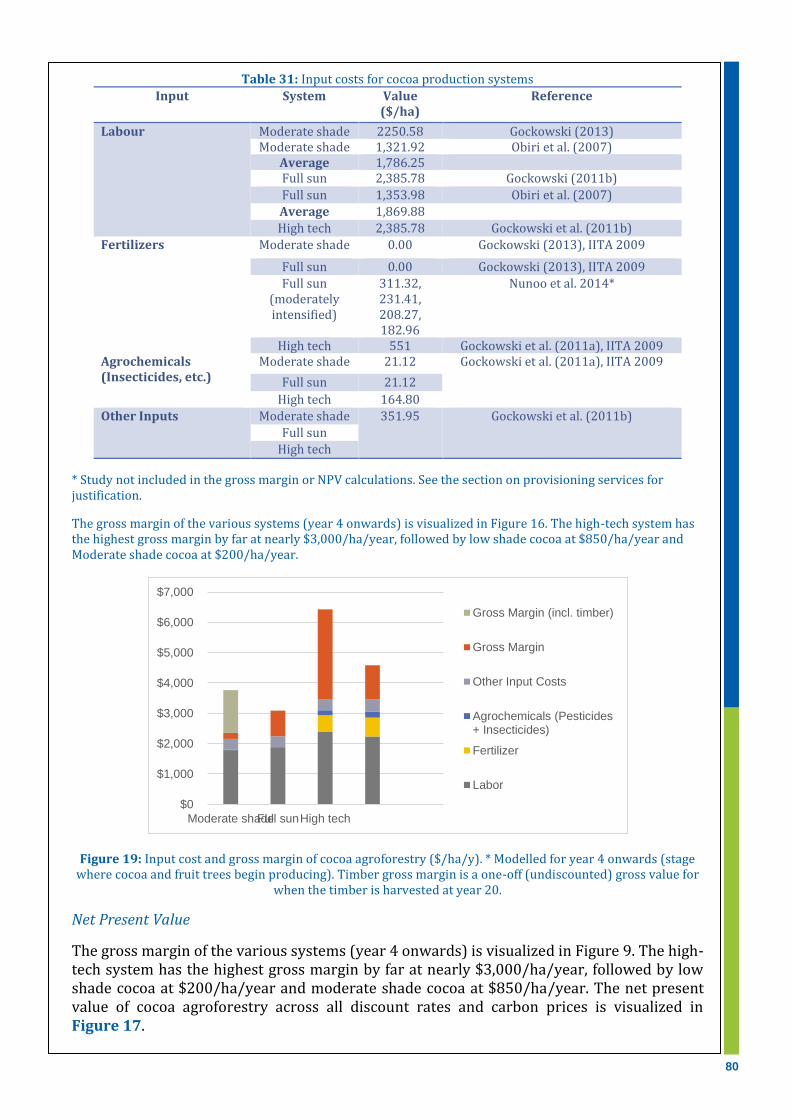
80
Table 31: Input costs for cocoa production systems
Input System Value ($/ha)
Reference
Labour Moderate shade 2250.58 Gockowski (2013) Moderate shade 1,321.92 Obiri et al. (2007)
Average 1,786.25 Full sun 2,385.78 Gockowski (2011b)
Full sun 1,353.98 Obiri et al. (2007)
Average 1,869.88
High tech 2,385.78 Gockowski et al. (2011b)
Fertilizers Moderate shade 0.00 Gockowski (2013), IITA 2009
Full sun 0.00 Gockowski (2013), IITA 2009
Full sun (moderately intensified)
311.32, 231.41, 208.27, 182.96
Nunoo et al. 2014*
High tech 551 Gockowski et al. (2011a), IITA 2009 Agrochemicals (Insecticides, etc.)
Moderate shade 21.12 Gockowski et al. (2011a), IITA 2009 Full sun 21.12
High tech 164.80
Other Inputs Moderate shade 351.95 Gockowski et al. (2011b) Full sun
High tech
* Study not included in the gross margin or NPV calculations. See the section on provisioning services for justification.
The gross margin of the various systems (year 4 onwards) is visualized in Figure 16. The high-tech system has the highest gross margin by far at nearly $3,000/ha/year, followed by low shade cocoa at $850/ha/year and Moderate shade cocoa at $200/ha/year.
Figure 19: Input cost and gross margin of cocoa agroforestry ($/ha/y). * Modelled for year 4 onwards (stage where cocoa and fruit trees begin producing). Timber gross margin is a one-off (undiscounted) gross value for
when the timber is harvested at year 20.
Net Present Value
The gross margin of the various systems (year 4 onwards) is visualized in Figure 9. The high-tech system has the highest gross margin by far at nearly $3,000/ha/year, followed by low shade cocoa at $200/ha/year and moderate shade cocoa at $850/ha/year. The net present value of cocoa agroforestry across all discount rates and carbon prices is visualized in Figure 17.
$0
$1,000
$2,000
$3,000
$4,000
$5,000
$6,000
$7,000
Moderate shadeFull sunHigh tech
Gross Margin (incl. timber)
Gross Margin
Other Input Costs
Agrochemicals (Pesticides+ Insecticides)
Fertilizer
Labor

81
The high-tech cocoa system would be most profitable from a private, financial perspective, regardless of the carbon price adopted, with a net present value of over $4,600-33,000/ha over a 20 year cycle depending on the chosen discount rate, an IRR of 38%, and a benefit-cost ratio (BCR) of 1.47 at a 10% discount rate. However, this may well be due to the fact that some of the ecosystem services occurring in more quantities in shaded systems including, for example, biodiversity conservation or hydrologic services, are not easily quantified and monetized. Our cost-benefit analyses also ignore externalities from on-farm nitrogen emissions, emissions which occur during the production of fertilizers, pesticides and insecticides, as well as the downstream cost of surface and groundwater pollution. If the high-tech system is scaled up and out over a much larger area, then these costs could be quite significant, and which might lower the NPV values considerably if all social costs were accounted for. The NPV estimate of $4,600 at 20% discount rate for high-tech cocoa, is lower than that of Gockowksi et al. (2013) at approximately $6,00076 at a 20% discount rate over a 21-year cycle, although the latter assumed fertilizer subsidies in the reference case.
a) b)
Figure 20: NPV for cocoa agroforestry under carbon prices of a) $6.5/tonne CO2eq and b) $40.3/tonne CO2eq across different discount rates.
Full Sun cocoa is a reasonably viable production system with an NPV of approximately $4200/ha, an IRR of 34% and a benefit-cost ratio (BCR) of 1.21 (10% discount rate). This estimate is also much lower than that of Obiri et al. (2007) at $10,000 under an 80-year rotation at a 10% discount rate, although the latter assumed considerably lower labour costs. Moderately shaded cocoa fares the least of the three systems – despite significant benefits from trees, the system cannot compete with full sun cocoa, and features a net present value of slightly over $600/ha, with an IRR of 16% and a BCR of 1.03 under a 10% discount rate, and a slightly negative NPV (-240) at a 20% discount rate. The latter finding accords with other studies which estimate a slightly negative NPV for extensive, low-input landrace cocoa at higher discount rates and lower cocoa prices when labour costs are fully accounted for (e.g. Gockowski et al. 2011b; Gockowski et al. 2013). Even when assessing the land expectation value (LEV) of medium shade cocoa grown over 60 years as compared to the
76 All NPV estimates discussed in this section are expressed in 2013 US PPP-equivalent dollars.
($10,000)
$0
$10,000
$20,000
$30,000
$40,000
Moderateshade
Full sun High tech
NPV 2.5% Discount Rate
NPV 7.5% Discount Rate
NPV 10% Discount Rate
NPV 20% Discount Rate
($5,000)
$0
$5,000
$10,000
$15,000
$20,000
$25,000
$30,000
$35,000
$40,000
Moderateshade
Full sun High tech

82
LEV of full sun cocoa over 20 years, at a 10% discount rate the LEV for medium shade is still only around $960 as compared to $16,300 for full sun cocoa.
The NPV and the LEV for the moderate shade system fares somewhat better with higher carbon prices and under lower discount rates, but even in such cases the maximum NPV is just over $4,000. At the national level, the gross output value of moderately shaded cocoa agroforestry contribution to on-farm cocoa revenues is approximately $110 million each year77.
GDP of the poor
Ghana’s GDP is currently estimated at approximately $109.6 billion (World Bank 2015a), of which the estimated share from agriculture, forestry, livestock and fishing is around $22.6 billion (World Bank 2015b), or just over 20% of GDP (World Bank 2015c). The total estimated population of Ghana is 26.8 million. The Earth Watch Institute estimates that approximately 800,000 families are involved in cocoa farming in Ghana. An average cocoa farming household consists of 5 persons and 75% of these households cultivate 2 ha or less (Hainmueller et al. (2011). This was considered as an indicator for poverty78. From these values, the total number of poor cocoa farmers is approximately 3 million. The total contribution of cocoa agroforestry to GDP is approximately $699 million79. Dividing this GDP figure by the total population of poor cocoa farmers corresponds to a preliminary per capita GDP of the poor estimate for cocoa farmers at $233. Adjusting these GDP values for unrecorded timber and fuel wood gives a value of $25 million80, whereas the unrecorded value of NTFPs (including fruit tree products) amounts to approximately $119 million81. Assuming that smallholders are able to capture a significant share of the carbon values as outlined in the methodology section (lower bound carbon price less the transaction and implementation costs), carbon sequestration contributes an additional value of $ 8 million. Incorporating these ‘hidden’ values into the agricultural GDP estimate gives a total agricultural GDP value of approximately 22.8 billion, or a 0.1% increase in the agricultural contribution to GDP, and a per capita GDP value of $283 for poor cocoa agroforestry smallholders. The final step in this estimation consists of using an equity weight to estimate the revised per capita contribution to the GDP of the poor. For Ghana, we used the ratio of food expenditures for households at the top of the base of pyramid relative to the bottom of the base of pyramid for Cameroon, Cote d’Ivoire and Nigeria, respectively. This gave an equity weight of 2.48, and adjusting our figures for equity gives a final per capita ‘GDP of the poor’ value of $ 703.
Although these GDP of the poor estimates suggest that fruit trees and timber products may provide significant consumptive values to farmers as a complement to cocoa production, which may not be captured in statistical accounts, these results still need to be interpreted in context. As mentioned previously in the discussion of GDP of the poor for coffee agroforestry in Ethiopia, Harris and Orr’s (2014) suggestion that we assess whether net returns per household for a given agronomic practice are sufficient to meet the International Poverty Line of $ 1.25 in PPP equivalent dollars provides an important “litmus test” for assessing
77 Given that this estimate is based on our GIS area extents which is only a fraction of the total agroforestry extent estimated in the literature, this should be considered a conservative estimate. 78 From Hainmueller et al. (2011), income per cocoa farmer comes to less than 1 GHC per day. 79 1.63 million ha under cocoa cultivation X 28.7% (share of cocoa agroforestry area in Ghana) X 75% (share of cocoa farmers with farms sizes of 2 ha or less) = 350,000 ha. 350,000 ha X $1993/ha in medium shade cocoa agroforestry cocoa revenues = $ 699,260,000. 80 The one-off revenue from timber harvesting of $1,410 at year 20 was converted to an annual value $70.5/ha by dividing the former by 20. Multiplying the $70.5/ha/yr figure by the total hectarage of medium shade cocoa cultivated by poor farmers (350,000 ha) gives an annual value of around $ 25 million. 81 Fruit tree products gross output value is approximately $321 per annum per hectare from year 4 onwards. Multiplying this value by the total hectarage of cocoa cultivated by poor smallholders (350,000 ha) gives an annual value of around $ 119 million.

83
whether rainfed crop production can offer a viable pathway from poverty. Unless other on-farm (eg. livestock keeping) or off-farm (paid employment) livelihood options are capitalized on by cocoa farming households, or alternatively they are endowed with relatively large farm sizes, cocoa and other cash crop cultivation may not be up to the task of poverty alleviation. Considering that Hainmueller et al.’s survey (2011) found that “most cocoa farmers are entirely dependent on their cocoa crop for income”, with very little of their income derived from other crops or from paid employment, this suggests that revenues from low input cocoa farming may not suffice for alleviating poverty, and that programmes promoting intensification (while retaining shade trees) will also need to be coupled with programmes encouraging some households to transition away from cocoa production, as has been suggested in Gockowski (2007).
The complete set of GDP of the poor indicators and calculations are summarized in Table 32 below.
Table 32: GDP of the poor estimates for cocoa agroforestry in Ghana
Parameter Value Reference
Gross domestic product ($ million) 109,553 World Bank 2015a
Contribution of agriculture, forestry, livestock and fishing ($ million)
22,677 World Bank 2015b
Of which contribution by poor cocoa agroforesters ($ million)
699.26 Own calculation (See CBA section)
Percentage contribution of agriculture, forestry and fishing to GDP
20.7% World Bank 2015c
Total population (million) 26.79 World Bank 2015d
Of which poor cocoa farmers (million) 3.00 Hainmueller 2011 (HH size); Earth Watch Institute 2007 (#HH)
Per capita agricultural GDP of the poor 233.09
Per capita GDP for the rest of the population 4,576.26
Adjustments for unrecorded timber and fuel wood from forestry GDP ($ million)
25 Own calculation (See CBA section)
Adjustments for contribution of NTFPs to the economy ($ million)
119 Own calculation (See CBA section).
Adjustments for ecotourism and biodiversity values ($ million)
0
Adjustments for other ecological services ($ millions)
8
Adjusted contribution of agriculture, forestry and fishing to GDP
22,829
Adjusted contribution of agriculture, forestry and fishing to the poor
851.20
Per capita adjusted agricultural GDP for the dependent population
283.73
Per capita adjusted GDP for the entire population
852.27
Equity adjusted cost per person for agriculture dependent community
703.09 Hammond et al. 2007
Contribution of Ecological services to classical GDP ($ million)
151.94
Additional contribution to GDP 0.1%
Total Share of GDP 20.8%
Contribution to the poor ($ million) 151.94
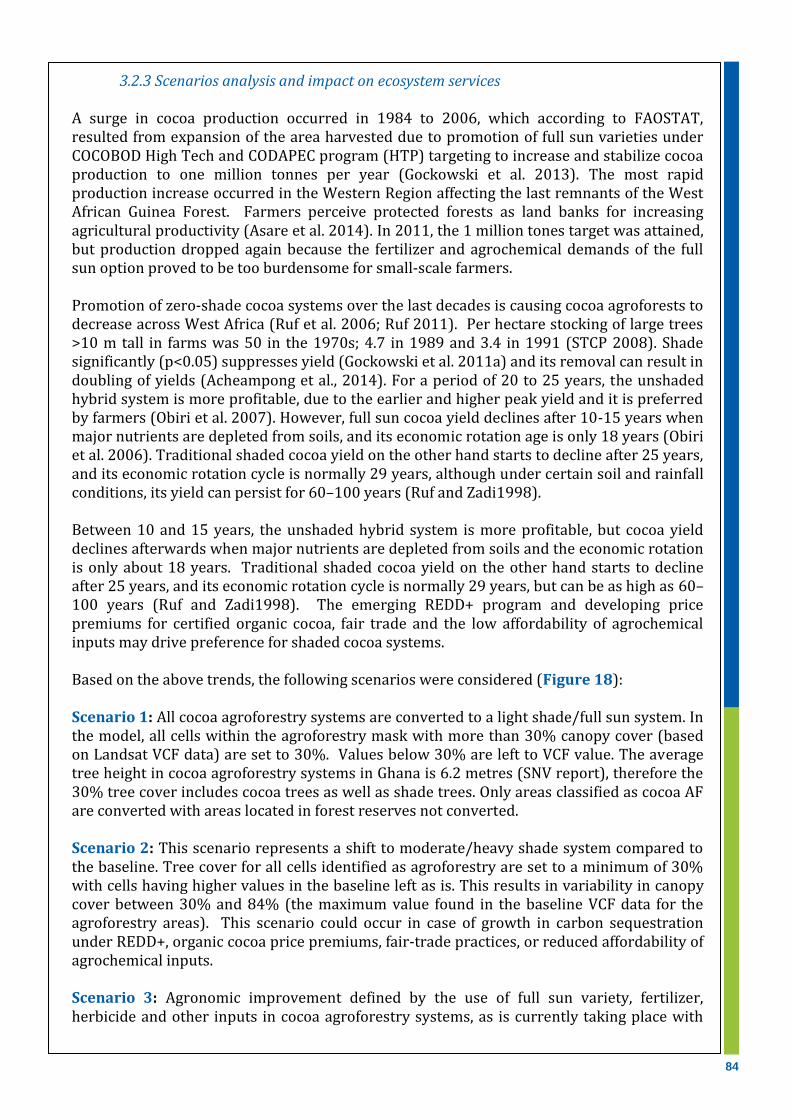
84
3.2.3 Scenarios analysis and impact on ecosystem services A surge in cocoa production occurred in 1984 to 2006, which according to FAOSTAT, resulted from expansion of the area harvested due to promotion of full sun varieties under COCOBOD High Tech and CODAPEC program (HTP) targeting to increase and stabilize cocoa production to one million tonnes per year (Gockowski et al. 2013). The most rapid production increase occurred in the Western Region affecting the last remnants of the West African Guinea Forest. Farmers perceive protected forests as land banks for increasing agricultural productivity (Asare et al. 2014). In 2011, the 1 million tones target was attained, but production dropped again because the fertilizer and agrochemical demands of the full sun option proved to be too burdensome for small-scale farmers. Promotion of zero-shade cocoa systems over the last decades is causing cocoa agroforests to decrease across West Africa (Ruf et al. 2006; Ruf 2011). Per hectare stocking of large trees >10 m tall in farms was 50 in the 1970s; 4.7 in 1989 and 3.4 in 1991 (STCP 2008). Shade significantly (p<0.05) suppresses yield (Gockowski et al. 2011a) and its removal can result in doubling of yields (Acheampong et al., 2014). For a period of 20 to 25 years, the unshaded hybrid system is more profitable, due to the earlier and higher peak yield and it is preferred by farmers (Obiri et al. 2007). However, full sun cocoa yield declines after 10-15 years when major nutrients are depleted from soils, and its economic rotation age is only 18 years (Obiri et al. 2006). Traditional shaded cocoa yield on the other hand starts to decline after 25 years, and its economic rotation cycle is normally 29 years, although under certain soil and rainfall conditions, its yield can persist for 60–100 years (Ruf and Zadi1998). Between 10 and 15 years, the unshaded hybrid system is more profitable, but cocoa yield declines afterwards when major nutrients are depleted from soils and the economic rotation is only about 18 years. Traditional shaded cocoa yield on the other hand starts to decline after 25 years, and its economic rotation cycle is normally 29 years, but can be as high as 60–100 years (Ruf and Zadi1998). The emerging REDD+ program and developing price premiums for certified organic cocoa, fair trade and the low affordability of agrochemical inputs may drive preference for shaded cocoa systems. Based on the above trends, the following scenarios were considered (Figure 18): Scenario 1: All cocoa agroforestry systems are converted to a light shade/full sun system. In the model, all cells within the agroforestry mask with more than 30% canopy cover (based on Landsat VCF data) are set to 30%. Values below 30% are left to VCF value. The average tree height in cocoa agroforestry systems in Ghana is 6.2 metres (SNV report), therefore the 30% tree cover includes cocoa trees as well as shade trees. Only areas classified as cocoa AF are converted with areas located in forest reserves not converted. Scenario 2: This scenario represents a shift to moderate/heavy shade system compared to the baseline. Tree cover for all cells identified as agroforestry are set to a minimum of 30% with cells having higher values in the baseline left as is. This results in variability in canopy cover between 30% and 84% (the maximum value found in the baseline VCF data for the agroforestry areas). This scenario could occur in case of growth in carbon sequestration under REDD+, organic cocoa price premiums, fair-trade practices, or reduced affordability of agrochemical inputs. Scenario 3: Agronomic improvement defined by the use of full sun variety, fertilizer, herbicide and other inputs in cocoa agroforestry systems, as is currently taking place with

85
the Government’s high tech cocoa programme and existing extension activities (Gockowski 2013; Gockowski et al. 2010)82. The analysis considers intensification of heavy shade agroforestry, moderate shade and High Tech cocoa system, which is being promoted within the framework of land-sparing (eg. Wade et al. 2010, Gockowski et al. 2013). These are summarised in Figure 20 below.
Figure 21: Potential scenarios for cocoa agroforestry in Ghana
Scenario 1: Change to Light Shade/Full Sun cocoa system Change in Provisioning Services Under this scenario, cocoa output is estimated at 107,000 tonnes, valued at approximately $638 million per annum. Relative to the baseline, cocoa production increases by approximately 10,300 tonnes and production increases by approximately $61 million in monetary values, for a total cocoa production value of $638 million (assuming no price effects from increased production). If the system were changed to high-tech (intensified full sun), this would imply a total gross output value of $1.3 billion, which is just over $700 million greater than the baseline. As presented above, full sun hybrids tend to have an early surge in production increase, but a relatively shorter rotation cycle. Therefore, if longer cropping cycles were considered, this option would probably have encountered adoption barriers such as the need for much earlier replacement planting as well as input application costs compared to the baseline scenario, unless it continues to be propped up by some input subsidies. Socio-economic factors such as the age of farmers and small farm sizes may also prevent the viability of such an option. Change in freshwater provision Due to the decrease in forest cover, there is overall less water use by trees resulting in an increase in water yield for all six districts. On average, these differences are small (between 0.8 and 4.9 mm/year) resulting in total water volume increases in the range of 1.2 million m3 (Atwima) to 4.4 million m3 (Adansi South) of water, with a cumulative increase of 16 million m3 across all modelled basins.
82 The intensification effort is however complicated as the Ghana government seeks to phase out free pesticide spraying. www.wallstreetdaily.com/2015/06/29/ghana-cocoa-shortage

86
Very few contingent valuation studies have been undertaken for rural water supply services in Ghana83, and only one such study was retained for valuation analysis. In a survey of five of 30 community-managed piped water systems, Nyarko (2007) estimated that approximately 75% of respondents were willing to pay either equal to or greater than the then-current tariff of $0.6/m3; adjusting this figure to 2013 PPP-adjusted dollars gives a WTP of $3.83/m384. Regression analysis identifying determinants of WTP was not provided for the study, so a simple unit adjustment (as in Ready and Narud 2006)) for income differences between policy sites and study sites was used instead. Modifying the WTP value for differences in income between study and policy sites adjusts the WTP bid downwards85 to $2.63/m3. Multiplying this adjusted WTP value by the overall increase in water yield (16,096,825 m3) gives a total value of $42 million per annum.
These monetary values might be upper-bound estimates for several reasons. First, the study was only conducted in one district and hence water tariffs and willingness to pay may not be nationally representative. Second, the study only measured willingness to pay for piped water whereas, depending on the district, approximately 45-80% (value varies according to district) of the respondents to a recent national survey of cocoa producers identified borehole/tube well water as their primary source of drinking water in the rainy season (Hainmueller et al. 2011). Moreover, it may not be the case that all of this additional freshwater provisioned under the scenario could be delivered to end-users on an economic basis86. Finally, households also harvest water for ‘free’ from streams and other sources (Rossiter et al. 2010), and the increased freshwater yield will also likely increase surface water supplies, which could depress willingness to pay for piped water services.
Although a comprehensive, spatially explicit review and adjustment of these WTP values according to eg. variable water supply and demand by key urban centres in the modelled regions is beyond the scope of this study, it is worth noting that a relatively recent review of urban water demand in the different regions of Ghana demonstrated significant supply shortfalls relative to demand, as well as shortfalls in water coverage, which has subsequently led to water rationing for many urban areas (Ministry of Water Resources, Works and Housing, 2010). The demand-to-supply gap is particularly pronounced in the regions modelled for scenario analysis (Brong Ahafo, Ashanti and Western respectively), where the combined demand gap amounts to more than 97,000 m3 per day or 35.6 million m3 per annum. As such, this provides some tentative evidence that benefits from increased water supply could potentially be captured by urban beneficiaries. While rural demand estimates were not available, there is evidence that improved water provisioning might also help farmers in rural areas, as a more recent survey indicates (Hainmueller et al. 2011).
Change in carbon stocks
Conversion to full sun causes a decrease of approximately 533,000 tonnes worth of carbon stocks, which amounts to approximately $12.9 million worth of CO2-equivalent emissions87.
Change in Runoff
Since there are only small changes in water balance, mean annual runoff changes are also small with an increase of 0.2 m3/s for basin 1, 1.4 m3/s for basin 2, 0.3 m3/s for basin 3 and
83 Boadu (1992) WTP was unsuitable for benefit transfer due to age of the study and differences in economic and demographic factors. 84 Note that inflation has increased nearly seven fold in Ghana from the period of 2003-2013. 85 Considering the weighted mean per capita income in regions where cocoa growing districts are located, the WTP value comes to $2.67/m3. 86 i.e. on a cost-recovery basis. 87 If the social cost of carbon were used to compute costs, these would be approximately $78 million worth of emissions under scenario one.

87
0.1 m3/s for basin 4. Literature review did not identify suitable economic data for valuation of avoided runoff services. Change in freshwater quality Under this scenario there is a marginal (maximum -0.07% lower HFI) increase in water quality for four out of the six districts. This is the result of increased water availability and thus more dilution of polluting sources. While there is an increase in bare soils under areas marked as agroforestry, the negative impact on water quality for these areas is outweighed by the increase in water dilution which leads to a very small positive impact on water quality overall. It should be noted that changes in water quality are only related to change in (natural) vegetation cover and do not take into account potential increase from agricultural sources88. The absence of contingent valuation studies for improved water quality in rural areas of Ghana prohibits economic valuation of this service. The low impact of removal of shade trees on hydrological conditions means runoff and water yield are unlikely to drive decisions for keeping shade trees on cocoa farms. The low changes may be due to soils, terrain and rainfall conditions of the area and the perennial cover of the cocoa plants themselves where the additional impact of shade trees is negligible. Change in freshwater provision Due to the decrease in forest cover, there is overall less water use by trees resulting in an increase in water yield for all six districts. On average, these differences are small (between 0.8 and 4.9 mm/year) resulting in total water volume increases in the range of 1.2 (Atwima) to 4.4 million (Adansi South) m3 of water, with a cumulative increase of 16 million m3 across all modelled basins. Changes are summarised in Tables 33 and 34.
Table 33: Biophysical changes for Scenario 1
District ∆Water yield
(m3)
∆Water quality (HFI
%)
∆Carbon
(tonnes)
∆Soil Erosion
(m3)
Adansi South 3,451,452 -0.024 -14,708 51,314
Atwima 1,199,897 -0.067 -63,294 499,863
Offinso 1,355,574 -0.012 -84,264 51,388
Asunafo
North
3,122,949 0.002 -171,410 41,315
Asunafo
South
4,396,600 0.027 -170,697 54,899
Sefwi
Wiawso
2,570,353 -0.013 -28,769 214,867
Table 34: Valuation of changes ($) for Scenario 1
District ∆Water yield ∆Carbon
Adansi South 9,077,320 -356,041 Atwima 3,155,729 -1,532,178 Offinso 3,565,161 -2,039,806 Asunafo North 8,213,356 -4,149,377 Asunafo South 11,563,057 -4,132,117 Sefwi Wiawso 6,760,028 -696,420 Total 42,334,650 -12,905,939
88 Water quality could quite possibly decrease if the high-tech package is more widely adopted, due to its high reliance on pesticides
and fertilizers.

88
Summary
The gains obtained from increasing cocoa production through removal of shade are very high compared to the losses in terms of carbon and other regulating services. Although shade increases the system longevity, its advantage could not be detected in the various valuation records in literature. The potential to use REDD+ payments as an incentive for farmers to retain shade trees on farm based projects is very low. However, a case can be made for using REDD+ payments to enhance on-farm cocoa productivity in order to spare land for forests at landscape level. In any case, given that the earnings from increased cocoa production are much higher than what REDD+ can pay, a wider portfolio of interventions is needed, which should include other forms of incentives and some policy regulations. Soil erosion and hydrological impacts of shade tree removal though only marginal in biophysical terms, resulted in substantial potential economic values for example, in increased water quantity (although based on upper-bound rates), indicating the need for both physical and economic parameters in evaluating landuse change decisions.
Scenario 2: Change to moderate/heavy shade cocoa system
This scenario represents a shift to moderate/heavy shade system compared to the baseline. Tree cover for all cells identified as agroforestry are set to a minimum of 30% with baseline cells having higher values left as is. This results in variability in canopy cover between 30% and 84% (the maximum value found in the baseline VCF data for the agroforestry areas).
Change in Provisioning Service
Under this scenario, cocoa output at maturity is markedly lower at 69,000 tonnes per annum across the total agroforestry extent, and the cumulative value of cocoa output is approximately $411 million per year. This implies production losses of nearly 28,000 tonnes of cocoa per annum worth approximately $166 million each year. Plantain established as a nurse crop in the formerly full-sun areas in years 2 and 3 yields approximately 456,000 tonnes in total with a value of $596 million per year. The moderate shade system is also complemented by additional tree crop products, with approximately 72,000 tonnes of fruit tree outputs (avocado, orange and mango), valued at $70 million per annum89. At year 20 of the production cycle, 2.7 million m3 of timber is provisioned by the system with a one-off, gross (undiscounted) value of harvest at $291 million, assuming no price effects from the increased timber supply. Thus, although the fruit tree products help dampen the loss from diminished cocoa output, the value of the lost cocoa production is estimated at approximately $166 million per year, and the total net loss in provisioning service values for all districts combined is approximately $95 million per year.
Change in freshwater provision
In this scenario, there is an increase in shade trees resulting in greater water use by vegetation and thus a reduction in overall water provision. In all six districts, water yields decrease with the lowest decrease in Offinso (0.3 mm/year) and the greatest decrease in Adansi South (4.4 mm/year) resulting in a total reduction in water yield of approximately 15 million m3 across all districts. Using the contingent valuation estimates of $2.63/m3 from scenario 1, this gives an aggregate value of -$39 million in foregone water provisioning across all districts.
Runoff
For all sub-basins there is a decrease in runoff due to the decreased water availability. Changes in runoff however are relatively small with a decrease of 0.01 m3/s for basin 1, - 89 We assume that the additional shade trees comprise either fruit or timber trees.

89
0.03 m3/s for basin 2, -0.01 m3/s for basin 3 and -0.002 m3/s for basin 4. The relatively small differences are due to the relative change in vegetation in the basin relative to the district. For example, sub basin 2, the largest basin covers parts of Asunafo South and Sefwi Wiawso. While these districts together have a projected decrease in water balance of -2.3 mm/year, the mean decrease in water balance for the whole basin is only 0.22 mm/year leading to much smaller runoff decreases for the basin as a whole. Therefore the downstream impact of changes in extent of shade trees within agroforestry areas depends on what river basin is assessed.
Given that runoff, fresh water quality, and soil erosion was not a significant problem in the baseline, these reductions are only improving the situation and are not likely to be motivations for decisions to increase shade cocoa.
Change in freshwater quality
Despite the decrease in runoff and thus less dilution of potential pollution, the increased tree cover leads to decreases in potential water pollution in all six districts although impacts are small (max 1.8% relative decrease for Atwima district).
Change in carbon
This scenario leads to a mean increase in canopy cover of 1.6% across the districts. The greatest mean increase takes place in the Adansi South district (3.9%) since this district has relatively low baseline canopy cover. Potential stored carbon increases between 26,000 in Atwima and 593,000 tonnes in Adansi South, with a cumulative value of approximately 1.5 million tonnes. Valuing the CO2 equivalent of this gives additional carbon stock values of $36 million90.
Change in erosion
Soil erosion under this scenario decreases for all districts with the largest decrease in the Atwima district (-5.5 tonnes/ha/yr). Overall, soil erosion decreases by 1.3 tonnes/ha/yr across all districts, with a cumulative value of 126,000 m3 of avoided soil erosion per annum.
Table 35 and 36 summarize the changes in the biophysical and economic values of the ecosystem services lost and gained in converting all low shade to moderate shade agroforests. Trading the water and carbon services off each other, the loss in water yield would likely exceed the value of the additional carbon stocks within several years’ time, regardless of the chosen carbon price, due to the fact that the carbon is a stock value whereas the water yield is an annual flow.
Table 35: Biophysical changes for Scenario 2
District ∆Water yield (m3)
∆Water quality (HFI %)
∆Carbon (tonnes)
∆Erosion (m3 soil loss)
Adansi South -6,261,383 -0.030 593,853 -148,748
Atwima -306,783 -0.074 26,832 -424,493
Offinso -456,523 -0.016 46,637 -24,987
Asunafo North -792,919 -0.009 77,053 -23,850
Asunafo South -2,285,672 -0.012 222,405 -45,365
Sefwi Wiawso -4,893,138 -0.015 546,510 -126,057
90 With the high social cost of carbon value, the additional carbon stock has a value of $223 million.
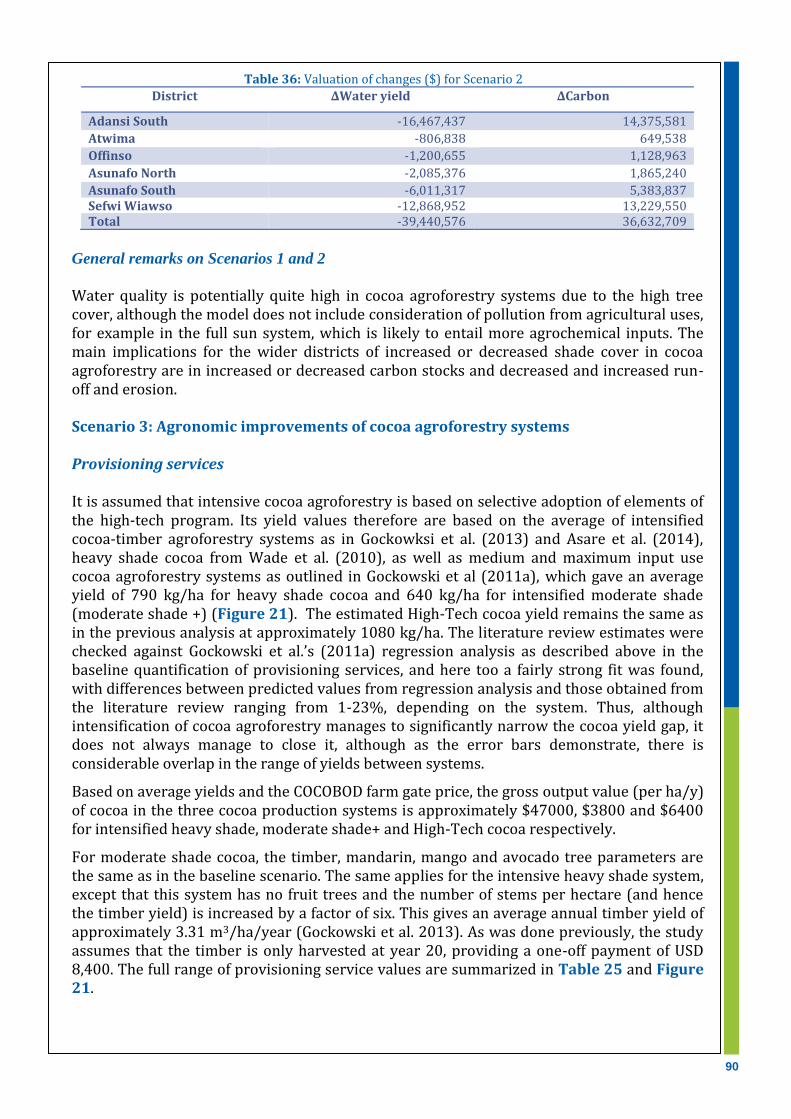
90
Table 36: Valuation of changes ($) for Scenario 2
District ∆Water yield ∆Carbon
Adansi South -16,467,437 14,375,581
Atwima -806,838 649,538
Offinso -1,200,655 1,128,963
Asunafo North -2,085,376 1,865,240
Asunafo South -6,011,317 5,383,837 Sefwi Wiawso -12,868,952 13,229,550 Total -39,440,576 36,632,709
General remarks on Scenarios 1 and 2
Water quality is potentially quite high in cocoa agroforestry systems due to the high tree cover, although the model does not include consideration of pollution from agricultural uses, for example in the full sun system, which is likely to entail more agrochemical inputs. The main implications for the wider districts of increased or decreased shade cover in cocoa agroforestry are in increased or decreased carbon stocks and decreased and increased run-off and erosion. Scenario 3: Agronomic improvements of cocoa agroforestry systems Provisioning services It is assumed that intensive cocoa agroforestry is based on selective adoption of elements of the high-tech program. Its yield values therefore are based on the average of intensified cocoa-timber agroforestry systems as in Gockowksi et al. (2013) and Asare et al. (2014), heavy shade cocoa from Wade et al. (2010), as well as medium and maximum input use cocoa agroforestry systems as outlined in Gockowski et al (2011a), which gave an average yield of 790 kg/ha for heavy shade cocoa and 640 kg/ha for intensified moderate shade (moderate shade +) (Figure 21). The estimated High-Tech cocoa yield remains the same as in the previous analysis at approximately 1080 kg/ha. The literature review estimates were checked against Gockowski et al.’s (2011a) regression analysis as described above in the baseline quantification of provisioning services, and here too a fairly strong fit was found, with differences between predicted values from regression analysis and those obtained from the literature review ranging from 1-23%, depending on the system. Thus, although intensification of cocoa agroforestry manages to significantly narrow the cocoa yield gap, it does not always manage to close it, although as the error bars demonstrate, there is considerable overlap in the range of yields between systems.
Based on average yields and the COCOBOD farm gate price, the gross output value (per ha/y) of cocoa in the three cocoa production systems is approximately $47000, $3800 and $6400 for intensified heavy shade, moderate shade+ and High-Tech cocoa respectively.
For moderate shade cocoa, the timber, mandarin, mango and avocado tree parameters are the same as in the baseline scenario. The same applies for the intensive heavy shade system, except that this system has no fruit trees and the number of stems per hectare (and hence the timber yield) is increased by a factor of six. This gives an average annual timber yield of approximately 3.31 m3/ha/year (Gockowski et al. 2013). As was done previously, the study assumes that the timber is only harvested at year 20, providing a one-off payment of USD 8,400. The full range of provisioning service values are summarized in Table 25 and Figure 21.

91
Figure 22: Yields of intensified cocoa agroforestry (kg/ha)
Regulating Services in intensive cocoa systems Valuation of the non-carbon regulating services such as pollination and pest control faced similar limitations as in the baseline assessment. For heavy shaded cocoa, Isaac (2005) estimated soil nitrogen stocks of approximately 1300 kg/ha at 0-15 cm depth, Asase (2008) estimated soil nitrogen stocks at 0.24% and available P and exchangeable K stocks at 15.5 ug/g and 0.1 cmol/(+) as described in Table 37. However, soil nutrient stocks could not be valued due to the lack of complete comparator data due to missing soil bulk density estimates.
Table 37: Provisioning services per hectare per year in intensive cocoa agroforestry in Ghana (per hectare/year)
Service System Quantity Value ($) Reference
Cocoa Yield (kg) Heavy Shade
553 Asare et al. 2014 670 Obiri et al. 2007 851 Wade et al. 2010 970 Gockwoski et al. 2013
Average 791.00 $4,713 Moderate Shade 388 Gockowski et al. 2011a
701 829
Average 639.33 $3,807
High Tech 963.03 $6,400
Food crops All systems 3023 $2880
Fruit tree products
Moderate Shade 348 $340
Timber (m3/year)
Moderate Shade 0.55 $59.5
Heavy Shade 6.24 Gockowski et al. 2011a
2.29 Gockowski et al. 2013 1.40 Obiri et al. 2007 5.13 Asare et al. 2014 Average 3.93 $423.1
0
200
400
600
800
1000
1200
1400
Heavy Shade ModerateShade+
High tech
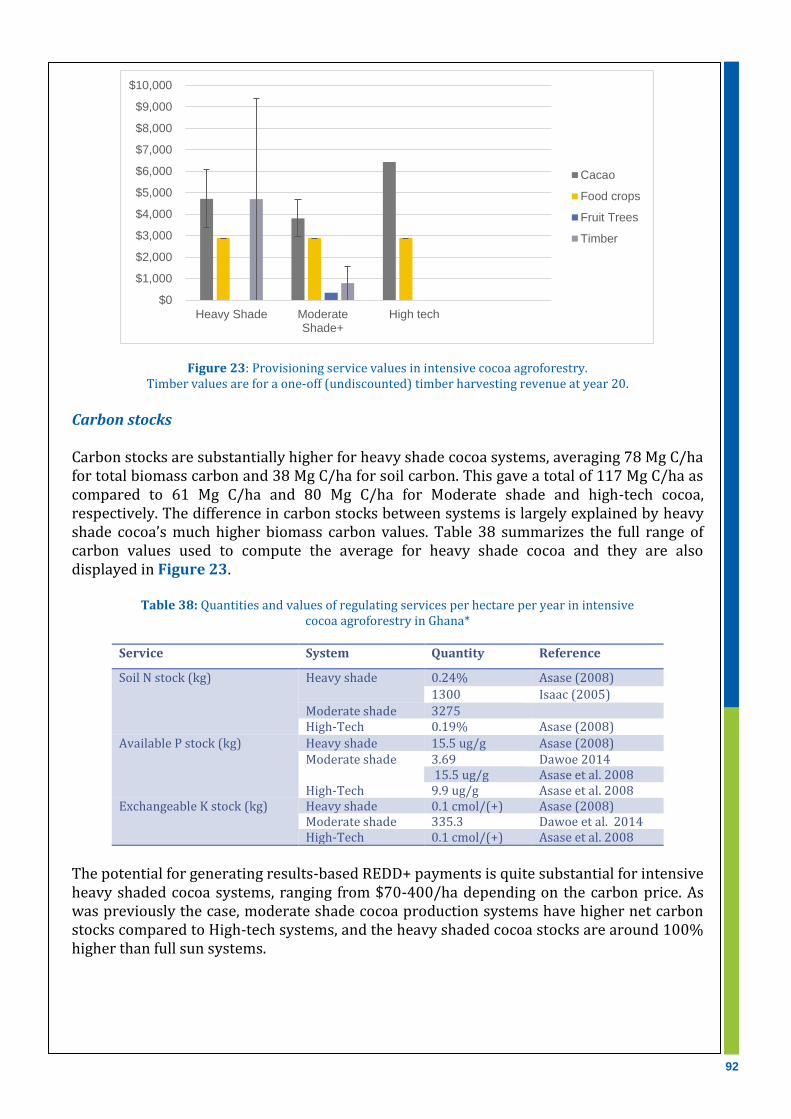
92
Figure 23: Provisioning service values in intensive cocoa agroforestry. Timber values are for a one-off (undiscounted) timber harvesting revenue at year 20.
Carbon stocks Carbon stocks are substantially higher for heavy shade cocoa systems, averaging 78 Mg C/ha for total biomass carbon and 38 Mg C/ha for soil carbon. This gave a total of 117 Mg C/ha as compared to 61 Mg C/ha and 80 Mg C/ha for Moderate shade and high-tech cocoa, respectively. The difference in carbon stocks between systems is largely explained by heavy shade cocoa’s much higher biomass carbon values. Table 38 summarizes the full range of carbon values used to compute the average for heavy shade cocoa and they are also displayed in Figure 23.
Table 38: Quantities and values of regulating services per hectare per year in intensive cocoa agroforestry in Ghana*
Service System Quantity Reference
Soil N stock (kg) Heavy shade
0.24% Asase (2008)
1300 Isaac (2005)
Moderate shade 3275 High-Tech 0.19% Asase (2008)
Available P stock (kg) Heavy shade 15.5 ug/g Asase (2008) Moderate shade 3.69 Dawoe 2014
15.5 ug/g Asase et al. 2008 High-Tech 9.9 ug/g Asase et al. 2008
Exchangeable K stock (kg) Heavy shade 0.1 cmol/(+) Asase (2008) Moderate shade 335.3 Dawoe et al. 2014 High-Tech 0.1 cmol/(+) Asase et al. 2008
The potential for generating results-based REDD+ payments is quite substantial for intensive heavy shaded cocoa systems, ranging from $70-400/ha depending on the carbon price. As was previously the case, moderate shade cocoa production systems have higher net carbon stocks compared to High-tech systems, and the heavy shaded cocoa stocks are around 100% higher than full sun systems.
$0
$1,000
$2,000
$3,000
$4,000
$5,000
$6,000
$7,000
$8,000
$9,000
$10,000
Heavy Shade ModerateShade+
High tech
Cacao
Food crops
Fruit Trees
Timber

93
Table 39: Intensive cocoa agroforestry carbon stocks (Mg C/ha)
Service System Quantity Reference
Biomass C stock (Mg)
Heavy shade
70.11 Gockowski et al. 2011 103.70 Asase et al. 2008 61.72 Wade et al. 2010
Average 78.51 Moderate Shade 42.73 Full sun 26.89
Soil C stock*(Mg)
Heavy shade
43.2 Gockowski et al. 2011a 34.4391 Asase 2008
Average 38.82
Moderate Shade 37.8 Full sun 34.82 Heavy shade 0.1 cmol/(+) Asase (2008)
a)
b)
Figure 24: a) carbon stocks ($/ha) and b) net carbon stocks ($/ha/yr) in intensively managed cocoa agroforestry * Low carbon price; **High carbon priceprice
Input Costs and Gross Margin in intensively managed cocoa systems As was the case for the baseline assessment, the labour costs for moderate input, medium shade and high tech systems were derived from Obiri et al. (2007), as well as the Rainforest Alliance Certified production systems and the intensive fine flavour cocoa production systems by Gockowski et al. (2013) and Gockowski et al. (2011b), respectively. This leads to costs of approximately $2,250 and $1,800 and $2,400 per hectare per year for heavy shade, moderate shade and full sun, respectively. For fertilizer, intensive heavy shade production used the maximum recommended input use of 381 kg on NPK/ha (IITA 2008/2009; Gockowski et al 2011a). High-tech value was the same as in the baseline. For moderate shade cocoa, the fertilizer input of 213 kg/ha was estimated from the average fertilizer use (excluding non-respondents) as reported by IITA (2008/9). This was approximately two thirds of the recommended maximum fertilizer use. Pesticide use value was based on the maximum recommended quantities, worth $164.8 for all three system (Gockowski et al. 2011a). Other input costs remain the same. See Table 40.
91 Adjusted to 0.67 of an original value of 51.4 at 0-30 cm depth, assuming linear depth partitioning.
$0
$2,000
$4,000
$6,000
$8,000
$10,000
$12,000
$14,000
$16,000
$18,000 C stock- soil C stock - biomass
$0
$50
$100
$150
$200
$250
$300
$350
$400
$450
$500
Heavy Shade* ModerateShade+*
HeavyShade**
ModerateShade+**
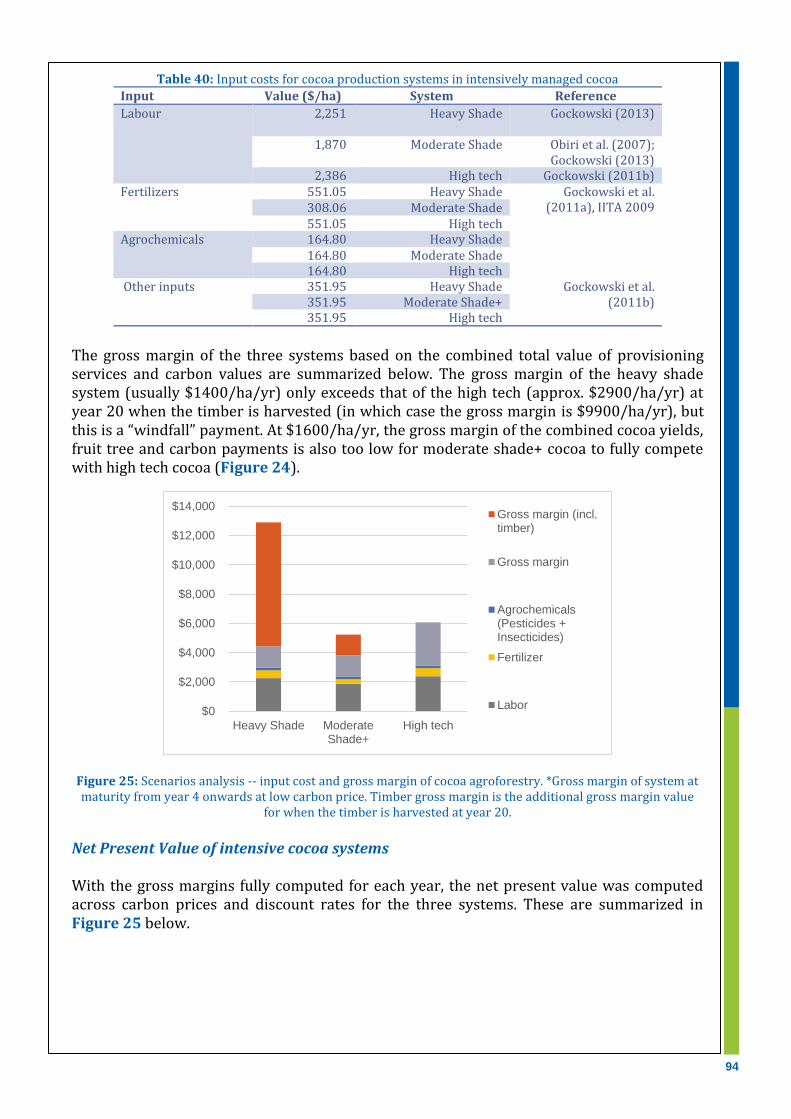
94
Table 40: Input costs for cocoa production systems in intensively managed cocoa
Input Value ($/ha) System Reference
Labour 2,251 Heavy Shade Gockowski (2013)
1,870 Moderate Shade Obiri et al. (2007); Gockowski (2013)
2,386 High tech Gockowski (2011b) Fertilizers 551.05 Heavy Shade Gockowski et al.
(2011a), IITA 2009
308.06 Moderate Shade 551.05 High tech
Agrochemicals 164.80 Heavy Shade 164.80 Moderate Shade 164.80 High tech
Other inputs 351.95 Heavy Shade Gockowski et al. (2011b) 351.95 Moderate Shade+
351.95 High tech
The gross margin of the three systems based on the combined total value of provisioning services and carbon values are summarized below. The gross margin of the heavy shade system (usually $1400/ha/yr) only exceeds that of the high tech (approx. $2900/ha/yr) at year 20 when the timber is harvested (in which case the gross margin is $9900/ha/yr), but this is a “windfall” payment. At $1600/ha/yr, the gross margin of the combined cocoa yields, fruit tree and carbon payments is also too low for moderate shade+ cocoa to fully compete with high tech cocoa (Figure 24).
Figure 25: Scenarios analysis -- input cost and gross margin of cocoa agroforestry. *Gross margin of system at maturity from year 4 onwards at low carbon price. Timber gross margin is the additional gross margin value
for when the timber is harvested at year 20.
Net Present Value of intensive cocoa systems With the gross margins fully computed for each year, the net present value was computed across carbon prices and discount rates for the three systems. These are summarized in Figure 25 below.
$0
$2,000
$4,000
$6,000
$8,000
$10,000
$12,000
$14,000
Heavy Shade ModerateShade+
High tech
Gross margin (incl.timber)
Gross margin
Agrochemicals(Pesticides +Insecticides)
Fertilizer
Labor
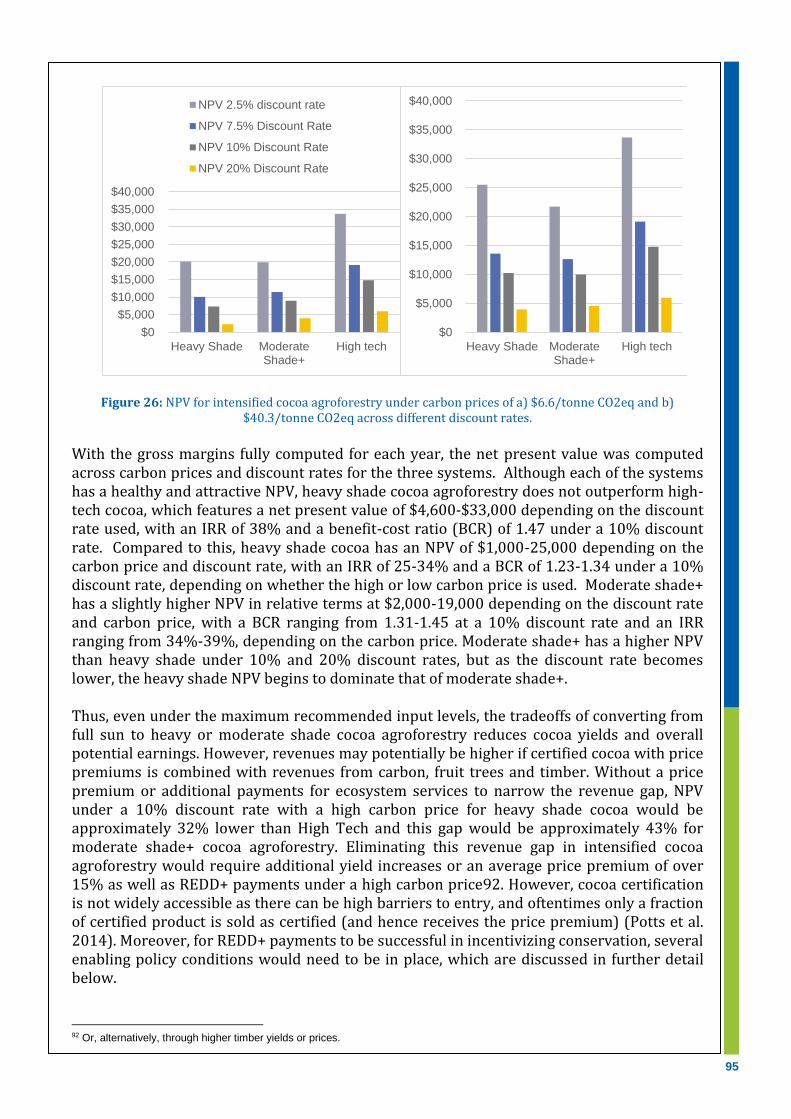
95
Figure 26: NPV for intensified cocoa agroforestry under carbon prices of a) $6.6/tonne CO2eq and b) $40.3/tonne CO2eq across different discount rates.
With the gross margins fully computed for each year, the net present value was computed across carbon prices and discount rates for the three systems. Although each of the systems has a healthy and attractive NPV, heavy shade cocoa agroforestry does not outperform high-tech cocoa, which features a net present value of $4,600-$33,000 depending on the discount rate used, with an IRR of 38% and a benefit-cost ratio (BCR) of 1.47 under a 10% discount rate. Compared to this, heavy shade cocoa has an NPV of $1,000-25,000 depending on the carbon price and discount rate, with an IRR of 25-34% and a BCR of 1.23-1.34 under a 10% discount rate, depending on whether the high or low carbon price is used. Moderate shade+ has a slightly higher NPV in relative terms at $2,000-19,000 depending on the discount rate and carbon price, with a BCR ranging from 1.31-1.45 at a 10% discount rate and an IRR ranging from 34%-39%, depending on the carbon price. Moderate shade+ has a higher NPV than heavy shade under 10% and 20% discount rates, but as the discount rate becomes lower, the heavy shade NPV begins to dominate that of moderate shade+. Thus, even under the maximum recommended input levels, the tradeoffs of converting from full sun to heavy or moderate shade cocoa agroforestry reduces cocoa yields and overall potential earnings. However, revenues may potentially be higher if certified cocoa with price premiums is combined with revenues from carbon, fruit trees and timber. Without a price premium or additional payments for ecosystem services to narrow the revenue gap, NPV under a 10% discount rate with a high carbon price for heavy shade cocoa would be approximately 32% lower than High Tech and this gap would be approximately 43% for moderate shade+ cocoa agroforestry. Eliminating this revenue gap in intensified cocoa agroforestry would require additional yield increases or an average price premium of over 15% as well as REDD+ payments under a high carbon price92. However, cocoa certification is not widely accessible as there can be high barriers to entry, and oftentimes only a fraction of certified product is sold as certified (and hence receives the price premium) (Potts et al. 2014). Moreover, for REDD+ payments to be successful in incentivizing conservation, several enabling policy conditions would need to be in place, which are discussed in further detail below.
92 Or, alternatively, through higher timber yields or prices.
$0
$5,000
$10,000
$15,000
$20,000
$25,000
$30,000
$35,000
$40,000
Heavy Shade ModerateShade+
High tech
NPV 2.5% discount rate
NPV 7.5% Discount Rate
NPV 10% Discount Rate
NPV 20% Discount Rate
$0
$5,000
$10,000
$15,000
$20,000
$25,000
$30,000
$35,000
$40,000
Heavy Shade ModerateShade+
High tech

96
Nonetheless, intensification of cocoa agroforestry would markedly improve upon the status quo. For instance, converting the current area under low shade93 into intensive heavy shade or moderate input medium shade or would increase cocoa production by approximately 41,000 tonnes and 18,000 tonnes respectively across the entire system extent, and would enhance long-term C stocks by 7.8 million tonnes in the case of heavy shade cocoa agroforestry and 2.4 million tonnes for moderate shade+ cocoa agroforestry.
3.2.4 Implications for policy and incentives for REDD+
The baseline, low shade cocoa systems, which are being promoted by the Government of Ghana and COCOBOD are much more profitable than the shaded alternatives whether with low or high intensity management. Low-input shaded systems with landrace cocoa have been shown to have a slightly negative baseline NPV when lower cocoa prices are considered and labour costs are fully accounted for (e.g. Gockowski et al. 2011b; Gockowski et al. 2013). Soil erosion, runoff and water quality challenges are very low for all shade levels. Additional potential benefits from carbon and other ecosystem services in shaded cocoa systems have the potential to reduce the revenue gap, but cannot fully offset it, even when high carbon prices are considered. This is partially due to the challenge in monetizing some of the ecosystem services occurring in more quantities in shaded systems– e.g. biodiversity conservation or hydrologic services. Intensification greatly enhances the profitability of all systems and reduces the potential revenue gap between the full sun and shaded cocoa systems. This, with some degree of regulation, may have the potential to spare land for forests at the landscape level. A REDD+ policy or measure could be used to increase productivity of cocoa farms so that farmers have less need to extend their farms or abandon them for new forest areas (Katoomba 2009) if coupled with a restriction of licenses to convert additional forests, or if the labour costs of additional forest clearing exceed expected net revenues from conversion to agriculture. However, as presented above, full sun hybrids tend to have an early surge in production increase as well as higher NPV, but a relatively shorter rotation cycle, whereas the shaded systems have the advantage of longevity. Therefore, if longer cropping cycles were considered, the full sun option would probably have higher adoption barriers in terms of replacement planting and input application compared to the baseline scenario, and lack of access to credit for fertilizers and other inputs could also be a significant inhibitor of its adoption (Gockowski et al. 2011a). Moreover, full cost accounting for externalities would further close the NPV gap between moderately intensified cocoa agroforestry and high tech systems. The scenario of increasing tree shade relative to the baseline can lead to substantial increase in above-ground carbon stock and reduction in runoff and soil erosion, but it also causes substantial reduction in crop yield, resulting in an overall net reduction in profitability compared to the baseline even when high carbon prices are considered. The reverse is true when shade levels were reduced. In general, the gains obtained from increasing cocoa production through removal of shade are very high compared to the losses in terms of carbon and other regulating services. If the enhancement of on-farm ecological services is to be financially viable for cocoa farmers, some combination of sustainable intensification and rewards for ecological services (whether PES or cocoa certification schemes) will likely be required. However, the impact of different tree shade levels on soil erosion, runoff and water quality is very low. Therefore, payments for watershed services may not be a viable incentive for enhancing tree cover on cocoa farms.
93 1600000*0.487 = 779,200 ha. - assuming all of the area is under low shade extensive cocoa.
97
With regards to REDD+, cocoa growing is emerging as a key driver of deforestation as stressed in Ghana’s REDD Readiness Preparation Proposal. The potential for Ghana to generate result-based payments from cocoa agroforestry systems very much hinges on Ghana’s forest definition. In line with requirements under the CDM (IPCC 2000, UNFCCC 2006) and REDD readiness efforts, Ghana has defined its forests as being a minimum of 1 hectare, having at least 15% canopy cover and containing trees that are at least 5 m tall (ERP 2014). Results from the study by Acheampong et al. (2014) indicated a mean cocoa tree height of 6.3 m for all 10 study areas in some 1 hectare plots. So in those cases, cocoa would meet the national forest definition threshold. However cocoa is not a native forest species and is also typically considered as a crop. Furthermore, according to research conducted by Forest Trends and Nature Conservation Research Centre (NCRC) (2013), sun cocoa fails to achieve the 5 m height requirement. As such, a monoculture cocoa plantation could or could not be considered a forest depending on Ghana’s interpretation. Likewise, the shade trees in cocoa agroforests could constitute a forest if they offer enough canopy cover and are taller than 5 m (Acheampong et al., 2014). Given the small landholdings, some form of aggregation may be needed if REDD+ investments in smallholder agroforestry are to be viable. Based on the scenarios analysis however, the potential to use REDD+ payments as an incentive for farmers to retain shade trees is very low, given the fact that the earnings from increased cocoa production are much higher than potential REDD+ payments (Luedling et al. 2010). Providing a fraction of the REDD+ payment as an up-front, lump-sum payment could help to further make agroforestry attractive although this may carry the risk of farmers violating their agroforestry commitments in the later years (as modelled in Sandker et al. 2009). The potential for REDD+ to promote forest conservation or restoration is also quite low according to Hansen et al (2009). Moreover, REDD+ payments may deter expansion of cocoa into existing forest reserves, but it has low potential to prevent conversion of degraded forests since these mostly exist in the ownership of the wealthy and not the government (Sandker et al. 2010). Therefore in order for REDD+ to be viable, it needs to be part of a wider portfolio of interventions, including other forms of incentives and policy regulations. Alternatively, a segregated enhancement of carbon stocks with non-cocoa tree plantation needs to be considered (Acheampong et al., 2014). In degraded areas, the potential for REDD+ to motivate tree planting and investment in best management practices needs to be explored. A key challenge for cocoa agroforestry REDD+ intervention is linked to land and tree tenure, which is directly attributable to the preference for the full sun system. Sharecropping arrangements in Ghana (where the share of cocoa output belonging to the tenant ranges from one third (abusa) to a half (abunu)) (Acheampong et al., 2014), force farmers to prefer full sun options in order to meet landlord’s quotas. The uncertainty in duration of land tenancy also leads to less preference for longer term shade cocoa systems of lower productivity than short term full sun alternatives (Acheampong et al., 2014). One incentive for securing shade systems could be through documenting the tenancy agreements and specifying benefit sharing arrangements between tenants and landlords (Acheampong et al., 2014). The promotion of full sun varieties is leading to preference of alternatives to trees (such as plantain) for provision of the nurse shade for young cocoa trees. The legal barriers faced in selling of timber, wood fuel or charcoal, are also a disincentive for farmers to invest in shade cocoa systems (Acheampong et al. 2014).

98
Provisions for tree ownership in the 1994 Forest and Wildlife Policy present a disincentive for agroforestry in Ghana, where naturally growing trees are owned by the state, which gives tree harvesting rights to private concessionaires whose operations, sometimes damage the cocoa plants (Asare 2010). One way of encouraging cocoa farmers to keep timber trees on their farms is for the government to put in place a mechanism for sharing portion of the stumpage value of timber trees (about 10%) with the communities as well as raising the current official level by about 25% compensating farmers for the losses of cocoa incurred during tree removal (Richards and Asare 1999). Because of short term land tenure provided under leasehold and share cropping, shade trees are not attractive unless provisions are made for sharing in the long term benefits from trees (Damnyag et al. 2012). Promoting cocoa agroforestry will require new favourable policy environment and appropriate incentives. While the National Agroforestry Policy, put in place in 1986, is aimed at establishing and maintaining 350 achievement demonstration centres, 400 nurseries and 30,000 hectares of agroforestry systems nationwide, it has not been successful. It remains very weak and has little influence on farmers’ decisions (Anim-Kwapong, 2004). The following on-going or potential policies and incentive mechanisms provide potential vehicles for promoting agroforestry cocoa in Ghana and therefore securing the ecosystem services the system provides including REDD+. Eco-certification and premium prices: Ghana is well endowed with premium bulk
cocoa and is strategically positioned to capture significant market shares for the growing demand in specialty cocoa products on the world market. Consumers’ taste and preference for differentiated or ‘specialty’ cocoa based on environmental- and ethically certified cocoa products have been rising over the years. Ghana currently stands as a leader in cocoa production certified under voluntary sustainability standards with approximately 16% of its production certified under a voluntary sustainability standard, thus amounting to over 190,000 tonnes of VSS-certified cocoa. This represents around 17% of the world’s standard-compliant cocoa produced in 2012 (Potts et al. 2014). Another example is Bia-Juabeso in the country’s Western region where 36 cocoa-farming communities located on over 60,000 acres (27,000 hectares) are being introduced to standards for socially, environmentally and economically sound management that will provide access to premium prices and preferred markets. Similarly, in partnership with their Swiss buyer Chocolats Halba, 5000 cocoa producers of the Kuapa Kokoo cooperative in the Kumasi region adopted agroforestry to recreate and maintain soils fertility. Certification programs of Fairtrade, Rainforest Alliance and UTZ require conservation and restoration of local ecosystems and biodiversity, planting of shade trees and more efficient use of agrochemicals. According to the KPMG (2012) study of certification programs of Fairtrade, Rainforest Alliance and UTZ for Ghana and Cote d’Ivoire, certification can deliver net advantages at the farm level due to premium prices, increased yield due to increased access to inputs and group formation. This remains the case even when the subsidization of farm inputs for Ghana is removed. Similarly encouraging results on price premiums and farmers’ revenues were identified in Bennet et al’s (2013) analysis of UTZ-certified cocoa production in Ghana.
Better inform all stakeholders on the legal and policy regimes governing off-reserve tree tenure and exploitation: The state in Ghana owns all naturally-occurring trees and farmers have the right to fell naturally-occurring trees for household use or agriculture but not for economic purposes (Acheampong et al., 2014). This constitutes a

99
disincentive for cocoa agroforestry. However planted trees belong to the person who plants them so the potential exists for farmers to integrate trees into their farms through planting. This is also valid for timber trees with the introduction of the Timber Resources Management (Amendment) Act of 2002 which assigns rights of tenure to planters. However this legislation is not well-known by farmers, landowners as well as forest and agricultural extension advisers.
Capacity-building and improved extension: According to the study led by Acheampong et al. (2014), farmers are aware of the benefits of incorporating trees into cocoa farms but they are still worried that this will have negative impact on yield because of increased exposure to pest diseases as well as increase threats of illegal chainsaw and timber concessionaires. Therefore, there is need to improve local knowledge on optimum shade tree densities with appropriate training and demonstration on how to integrate shade trees on already existing cocoa farms (Acheampong et al., 2014).
Increasing profitability: While the study considered the profitability of cocoa
agroforestry based on current tree selections, there remains an opportunity to further increase earnings through introduction of shade tree species with economic value and at the same time with ability to emerge above cocoa canopies. These could include fast-growing, multi-use species such as the cola bearing species and avocado. Income from tree products can be enhanced by increasing market access and investing in storage and processing facilities.
Engaging with the private sector in multi-stakeholder discussions on evolving Ghana's
Cocoa agroforestry towards REDD+. Improve extension advisory support on appropriate tree selection and
management in cocoa systems. The transient advantages of tree shade can be managed through tree pruning rather than total removal of trees from the system. Moderate shade levels have little effect on cocoa yield (Wood & Lass 2001; Perfecto et al. 2005; Tscharntke et al. 2011). Pruning however has labour cost implications and can lead to preference of shrub-like tree species as compared to large trees. Farmers need knowledge on tree species response to pruning and tolerance different pruning regimes.
The potential for intercropping with legume trees should be explored as this would contribute to cost saving and prevent fruit abortion caused by nitrogen deficiency. By reaching greater rooting depth than the superficial cocoa, agroforestry systems with trees have the potential to remain productive in times of drought by continuing to support livelihoods compared to monoculture options. The increased humidity reduces evaporative demand and thus protects cocoa trees from drought stress in shaded systems. Although a variety of potential private sector (market) driven incentives such as certification and PES are being piloted, their impact tends to be small and sometimes transient. To achieve sufficient scale and permanence, the motivation cocoa agroforestry as a viable part of the REDD+ agenda, requires a combination of state-driven initiatives such as creation of favourable policy environment, conditional cash transfers from the state, establishment of designated funds, and in-kind benefits such as health insurance or improved training and extension services.

100
3.3 Ngitili agroforestry systems in Tanzania Ecosystem services quantities and values from Ngitili agroforestry systems in Tanzania are estimated and their importance to local livelihoods and the national economy demonstrated. Based on current policy and landuse trends, potential changes in the ecosystem services under different landuse scenarios are analysed and policy and incentives recommended for promoting agroforestry in order to ensure that the benefits from it are sustained while addressing development aspirations at local and national levels. The major issues addressed in this analysis are presented in Table 41 below.
Table 41: Overview of the analysis of Ngitili agroforestry in Tanzania
Issue Overview
Systems analysed
Ngitili agroforestry Monocropped maize-grazing rotation (major alternative landuse in the area)
Policy issues
The contribution of Ngitili ecosystem service values to local livelihoods and the national economy secured and enhanced through formal policy and incentives processes, including REDD+, in the public and private sectors
Location Shinyanga Region in the districts of Bukombe, Kahama, Maswa, Meatu, Shinyanga Rural and Shinyanga Urban
Ecosystem services analysed
Provisioning: fodder, timber, freshwater provisioning, building material, wood fuel, charcoal, honey, food, non-timber forest products, spices Regulating/supporting: soil fertility, soil erosion control, pollination, carbon, biodiversity, water quality, water yield
Business as usual trends
Expanding Ngitili area leading to increased tree cover, but now under threat due to growing population and increasing demand for fuelwood and charcoal
Ngitili benefits mostly at subsistence level and not reflected in formal economic accounts and development plans
Low productivity and profitability in Ngitili with potential for enhancement Alternative scenarios (Figure 26)
1 Conversion of all areas under Ngitili agroforestry to a maize mono cropping system
2 Increasing of tree cover to a minimum of 20% within the areas under Ngitili agroforestry
Figure 27: Scenarios for Ngitili systems in Tanzania

101
3.3.1 Description of the Ngitili system Ngitili agroforestry is a traditionally managed system of seasonal exclosures94 around forest patches for grazing during the dry season. It consists of a mosaic of forest patches and other land areas used for crop production, foraging and grazing, modified from Miombo vegetation, Savannah/Acacia vegetation and a transition between Miombo and Savannah/Acacia vegetation. It is aimed at controlling overgrazing, which occurs in open-access rangelands in Shinyanga (Selemani et al. 2013; Selemani et al. 2015). Estimates of the overall area under Ngitili vary widely, ranging from 300,000 ha to approximately 500,000 ha (Monela et al. 2005; Shechambo 2008). In this study, we use the estimate of around 370,000 ha of Ngitili as cited by the HASHI program, Monela et al. (2005) and Mlenge (2004). Ngitili is practiced in the Shinyanga region including Acacia, Dalbergia , and Combretum bush lands in Shinyanga Urban, Meatu, Bariadi and Maswa districts (eastern side of the region); and regrowth miombo woodland in Kahama, Shinyanga Rural and Bukombe districts (western side of the region) (Table 39 and Figure 25). In the Shinyanga region, the climate is semi-arid, with mean temperatures of 27.6 - 30.2o C and mean rainfall of 700 mm per annum. Shinyanga is home to about 20-30% of the total cattle population in Tanzania (Machanya et al, 2003). While cattle keeping is more prominent in the drier eastern part, crop production (mainly maize) is the major activity in the western part where there is extensive forest coverage and rains are relatively stable. Ngitili is locally regarded as a source of not only fodder and wood products, but as a means of diversifying livelihoods and reserve land for future crop cultivation. Tree density per hectare is about 3,439 (Monela et al. 2005) with about 700 big trees95 (Pye-Smith 2010). Ngitili is a major source of charcoal and wild foods. Other crops are grown by farmers managing or exploiting Ngitili on their own farm plots, including maize, sorghum, tobacco and cotton. Livestock stocking per hectare is about one animal (Selemani et al. 2013). The low level of bare patches in Ngitili compared to open grazing systems, makes it potentially able to improve water quality and reduce soil erosion (see eg. Tefera 2007 on exclosure systems in Ethiopia). Monela et al. (2005) provide anecdotal evidence of enhanced water tables (as estimated by depth needed to dig before reaching water) from Ngitili.
Table 42: key characteristics of Ngitili agroforestry districts in Tanzania
District Elevation min
(m.a.s.l.)
Elevation max
(m.a.s.l.)
District area (km2)
Mean canopy cover (%)
Bukombe 1,059 1,526 9920.7 15.2 Kahama 1,081 1,481 8678.7 7.6 Maswa 1,119 1,395 3937.4 2.3 Meatu 1,016 1,792 9325.8 3.8 Shinyanga Rural 1,064 1,473 3724.2 1.8 Shinyanga Urban
1,091 1,281 552.7 1.1
Total 36139.6
94 See http://core.ac.uk/download/pdf/288047.pdf 95 A definition of ‘big tree’ was not provided by the author, but according to Monela et al. (2005), big trees are > 15 cm diameter at breast height.
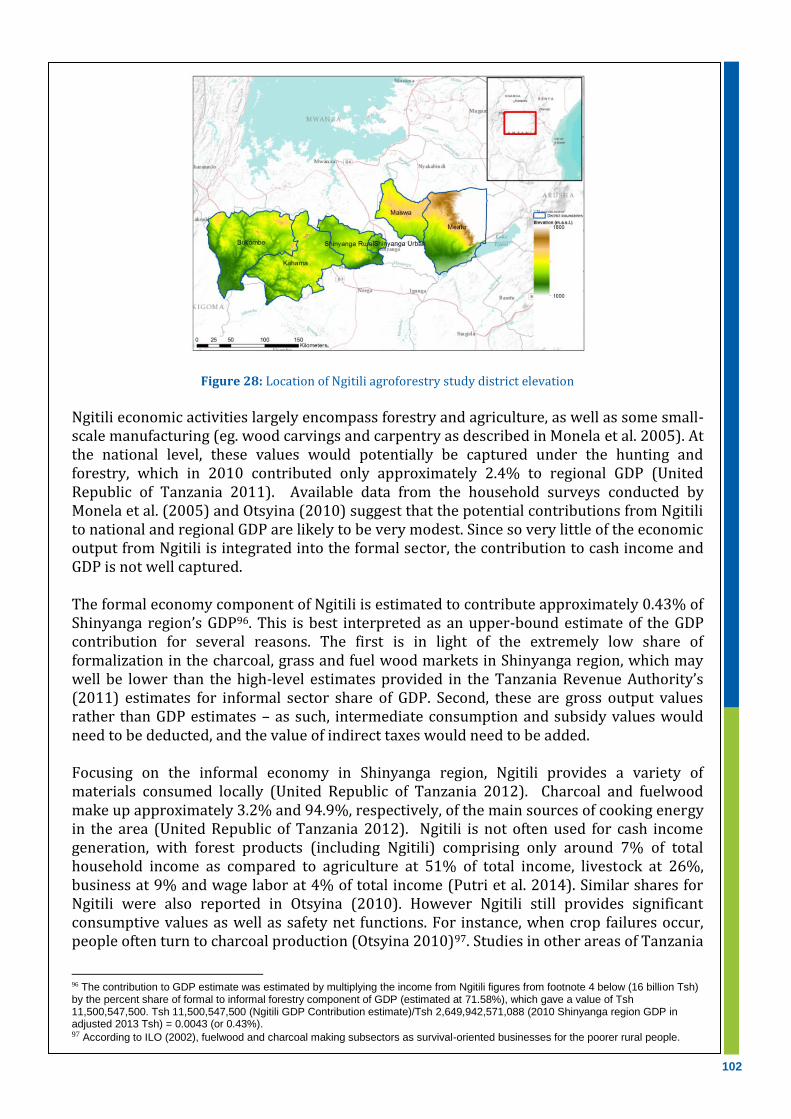
102
Figure 28: Location of Ngitili agroforestry study district elevation
Ngitili economic activities largely encompass forestry and agriculture, as well as some small-scale manufacturing (eg. wood carvings and carpentry as described in Monela et al. 2005). At the national level, these values would potentially be captured under the hunting and forestry, which in 2010 contributed only approximately 2.4% to regional GDP (United Republic of Tanzania 2011). Available data from the household surveys conducted by Monela et al. (2005) and Otsyina (2010) suggest that the potential contributions from Ngitili to national and regional GDP are likely to be very modest. Since so very little of the economic output from Ngitili is integrated into the formal sector, the contribution to cash income and GDP is not well captured. The formal economy component of Ngitili is estimated to contribute approximately 0.43% of Shinyanga region’s GDP96. This is best interpreted as an upper-bound estimate of the GDP contribution for several reasons. The first is in light of the extremely low share of formalization in the charcoal, grass and fuel wood markets in Shinyanga region, which may well be lower than the high-level estimates provided in the Tanzania Revenue Authority’s (2011) estimates for informal sector share of GDP. Second, these are gross output values rather than GDP estimates – as such, intermediate consumption and subsidy values would need to be deducted, and the value of indirect taxes would need to be added. Focusing on the informal economy in Shinyanga region, Ngitili provides a variety of materials consumed locally (United Republic of Tanzania 2012). Charcoal and fuelwood make up approximately 3.2% and 94.9%, respectively, of the main sources of cooking energy in the area (United Republic of Tanzania 2012). Ngitili is not often used for cash income generation, with forest products (including Ngitili) comprising only around 7% of total household income as compared to agriculture at 51% of total income, livestock at 26%, business at 9% and wage labor at 4% of total income (Putri et al. 2014). Similar shares for Ngitili were also reported in Otsyina (2010). However Ngitili still provides significant consumptive values as well as safety net functions. For instance, when crop failures occur, people often turn to charcoal production (Otsyina 2010)97. Studies in other areas of Tanzania
96 The contribution to GDP estimate was estimated by multiplying the income from Ngitili figures from footnote 4 below (16 billion Tsh) by the percent share of formal to informal forestry component of GDP (estimated at 71.58%), which gave a value of Tsh 11,500,547,500. Tsh 11,500,547,500 (Ngitili GDP Contribution estimate)/Tsh 2,649,942,571,088 (2010 Shinyanga region GDP in adjusted 2013 Tsh) = 0.0043 (or 0.43%). 97 According to ILO (2002), fuelwood and charcoal making subsectors as survival-oriented businesses for the poorer rural people.
103
have demonstrated that forest products provide significant livelihood benefits which would leave households significantly worse off (in terms of relative income equivalents) if they were unable to access them (Schaafsma 2012; Schaafsma et al. 2014). Using the weighted average for the household incomes (approximately Tsh 45,388) deriving from Ngitili in the Shinyanga Rural and Kahama districts (Otsyina 2010) and multiplying by the number of households in the region gives an aggregate cash income value for Shinyanga region of approximately Tsh (2013) 16 billion/year98. However, it is likely that only a fraction of this cash income reflects transactions between producers and consumers or businesses in the formal economy. In terms of shares of formal and informal forestry employment, approximately only 59% of business activities in the forestry sector are formally registered with the remaining 41% unregistered or illegal (TRA 2011). In terms of absolute employment figures, approximately 0.6% of respondents from the Shinyanga Agricultural Census (United Republic of Tanzania 2012) identified forest products as their main source of income. This value can be interpreted as a very rough proxy for individuals formally or informally employed in the forestry sector in Shinyanga region. Multiplying this figure by the estimated number of households in Shinyanga gives a value of approximately 1500 households principally employed in the formal and informal forestry sector, of which collection of forest products from Ngitili plays a crucial role99. Ngitili ecosystem service values were analyzed against the option of monoculture maize-grazing rotation, which is another predominant land-use in the region (United Republic of Tanzania 2013; Wiskerke et al. 2010) with two-year cultivation cycles followed by fallow cycles of three years (Wiskerke et al. 2010).
3.3.2 Baseline quantification and valuation of ecosystem services in Ngitili
Provisioning Services There is very little scientific literature on provisioning ecosystem services in ngitili, therefore some of the pricing data and comparative information was obtained from miombo woodlands elsewhere in the country. Benefits presented in per district units were converted to spatial (per hectare) equivalents by dividing the total estimated benefits for all households or districts in Monela et al. (2005), by the total estimated area under Ngitili (370,000 ha) (Table 43). Maize yield estimate of 1.3 t/ha was obtained from the most recent agricultural census from Shinyanga district (URT 2013) and as well as from Wiskerke et al. (2010)’s estimate of 0.93 t/ha for the years 1997-2003. The higher URT (2013) estimates were used for the valuation analysis. Using the WaterWorld Model based on five sub-basins overlapping with the 6 districts under Ngitili agroforestry (Figure 28), annual fresh water yield varies between 353 mm and 615 mm. Total annual water yield in the Bukombe district is highest with a total water yield of 6.1 km3 while the smallest district, Shinyanga urban, produces around 0.2 km3 of freshwater. This leads to a total freshwater yield of over 17 million m3 per annum when aggregating across all districts100.
98 Tsh 45,388 X 261,732 (number of households in Shinyanga region) = Tsh (2010) 11,879,599,117. Tsh 11,879,599,117 X 1.35
(GDP Deflator 2010-2013) = Tsh (2013) 16,066,264,857. 99 Conceptually it did not seem worthwhile or tractable to directly attribute a share forestry employment to harvesting Ngitili per se, since there is very little evidence that individuals source their forestry products exclusively from Ngitili. 100 Note that the Model was based on maps with an area extent about x3.56 larger than that of 370,000 ha from literature
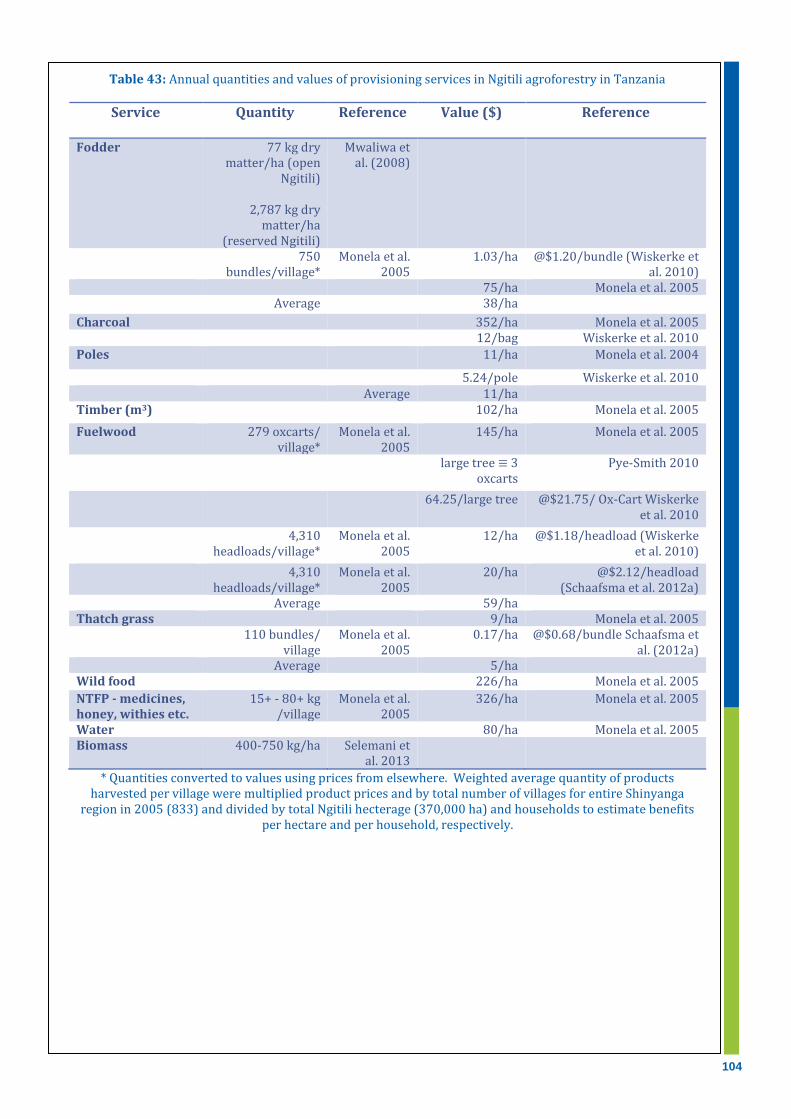
104
Table 43: Annual quantities and values of provisioning services in Ngitili agroforestry in Tanzania
Service Quantity Reference Value ($) Reference
Fodder 77 kg dry matter/ha (open
Ngitili)
2,787 kg dry matter/ha
(reserved Ngitili)
Mwaliwa et al. (2008)
750 bundles/village*
Monela et al. 2005
1.03/ha @$1.20/bundle (Wiskerke et al. 2010)
75/ha Monela et al. 2005 Average 38/ha
Charcoal 352/ha Monela et al. 2005 12/bag Wiskerke et al. 2010
Poles 11/ha Monela et al. 2004
5.24/pole Wiskerke et al. 2010 Average 11/ha Timber (m3) 102/ha Monela et al. 2005
Fuelwood 279 oxcarts/ village*
Monela et al. 2005
145/ha Monela et al. 2005
large tree ≡ 3 oxcarts
Pye-Smith 2010
64.25/large tree @$21.75/ Ox-Cart Wiskerke et al. 2010
4,310 headloads/village*
Monela et al. 2005
12/ha @$1.18/headload (Wiskerke et al. 2010)
4,310 headloads/village*
Monela et al. 2005
20/ha @$2.12/headload (Schaafsma et al. 2012a)
Average 59/ha Thatch grass 9/ha Monela et al. 2005 110 bundles/
village Monela et al.
2005 0.17/ha @$0.68/bundle Schaafsma et
al. (2012a) Average 5/ha Wild food 226/ha Monela et al. 2005
NTFP - medicines, honey, withies etc.
15+ - 80+ kg /village
Monela et al. 2005
326/ha Monela et al. 2005
Water 80/ha Monela et al. 2005 Biomass 400-750 kg/ha Selemani et
al. 2013
* Quantities converted to values using prices from elsewhere. Weighted average quantity of products harvested per village were multiplied product prices and by total number of villages for entire Shinyanga
region in 2005 (833) and divided by total Ngitili hecterage (370,000 ha) and households to estimate benefits per hectare and per household, respectively.
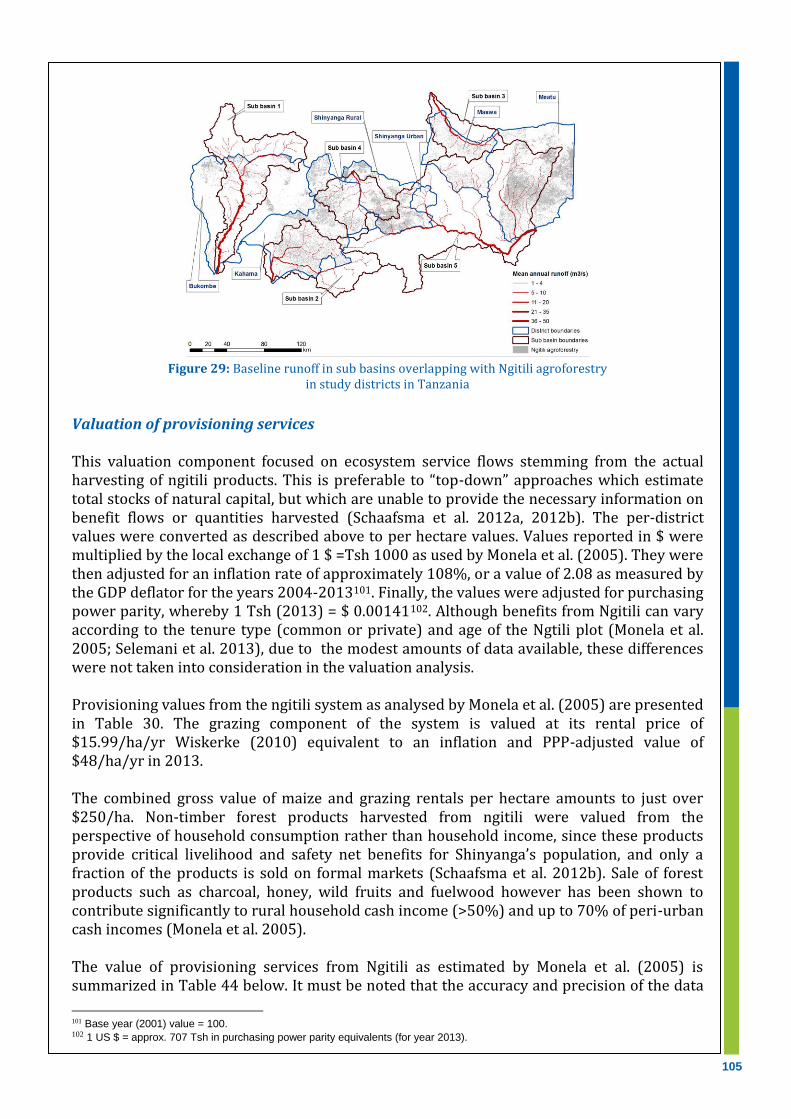
105
Figure 29: Baseline runoff in sub basins overlapping with Ngitili agroforestry
in study districts in Tanzania
Valuation of provisioning services This valuation component focused on ecosystem service flows stemming from the actual harvesting of ngitili products. This is preferable to “top-down” approaches which estimate total stocks of natural capital, but which are unable to provide the necessary information on benefit flows or quantities harvested (Schaafsma et al. 2012a, 2012b). The per-district values were converted as described above to per hectare values. Values reported in $ were multiplied by the local exchange of 1 $ =Tsh 1000 as used by Monela et al. (2005). They were then adjusted for an inflation rate of approximately 108%, or a value of 2.08 as measured by the GDP deflator for the years 2004-2013101. Finally, the values were adjusted for purchasing power parity, whereby 1 Tsh (2013) = $ 0.00141102. Although benefits from Ngitili can vary according to the tenure type (common or private) and age of the Ngtili plot (Monela et al. 2005; Selemani et al. 2013), due to the modest amounts of data available, these differences were not taken into consideration in the valuation analysis. Provisioning values from the ngitili system as analysed by Monela et al. (2005) are presented in Table 30. The grazing component of the system is valued at its rental price of $15.99/ha/yr Wiskerke (2010) equivalent to an inflation and PPP-adjusted value of $48/ha/yr in 2013. The combined gross value of maize and grazing rentals per hectare amounts to just over $250/ha. Non-timber forest products harvested from ngitili were valued from the perspective of household consumption rather than household income, since these products provide critical livelihood and safety net benefits for Shinyanga’s population, and only a fraction of the products is sold on formal markets (Schaafsma et al. 2012b). Sale of forest products such as charcoal, honey, wild fruits and fuelwood however has been shown to contribute significantly to rural household cash income (>50%) and up to 70% of peri-urban cash incomes (Monela et al. 2005). The value of provisioning services from Ngitili as estimated by Monela et al. (2005) is summarized in Table 44 below. It must be noted that the accuracy and precision of the data
101 Base year (2001) value = 100. 102 1 US $ = approx. 707 Tsh in purchasing power parity equivalents (for year 2013).
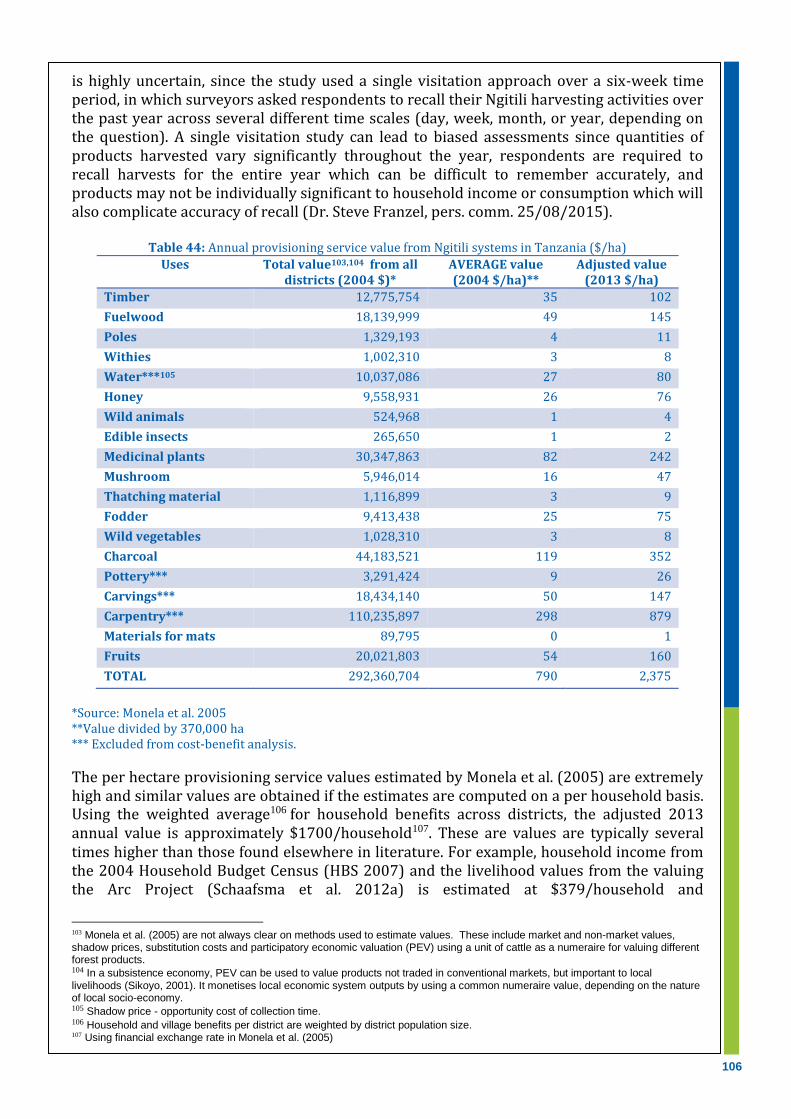
106
is highly uncertain, since the study used a single visitation approach over a six-week time period, in which surveyors asked respondents to recall their Ngitili harvesting activities over the past year across several different time scales (day, week, month, or year, depending on the question). A single visitation study can lead to biased assessments since quantities of products harvested vary significantly throughout the year, respondents are required to recall harvests for the entire year which can be difficult to remember accurately, and products may not be individually significant to household income or consumption which will also complicate accuracy of recall (Dr. Steve Franzel, pers. comm. 25/08/2015).
Table 44: Annual provisioning service value from Ngitili systems in Tanzania ($/ha)
*Source: Monela et al. 2005 **Value divided by 370,000 ha *** Excluded from cost-benefit analysis.
The per hectare provisioning service values estimated by Monela et al. (2005) are extremely high and similar values are obtained if the estimates are computed on a per household basis. Using the weighted average106 for household benefits across districts, the adjusted 2013 annual value is approximately $1700/household107. These are values are typically several times higher than those found elsewhere in literature. For example, household income from the 2004 Household Budget Census (HBS 2007) and the livelihood values from the valuing the Arc Project (Schaafsma et al. 2012a) is estimated at $379/household and
103 Monela et al. (2005) are not always clear on methods used to estimate values. These include market and non-market values, shadow prices, substitution costs and participatory economic valuation (PEV) using a unit of cattle as a numeraire for valuing different forest products. 104 In a subsistence economy, PEV can be used to value products not traded in conventional markets, but important to local
livelihoods (Sikoyo, 2001). It monetises local economic system outputs by using a common numeraire value, depending on the nature of local socio-economy. 105 Shadow price - opportunity cost of collection time. 106 Household and village benefits per district are weighted by district population size. 107 Using financial exchange rate in Monela et al. (2005)
Uses Total value103,104 from all districts (2004 $)*
AVERAGE value (2004 $/ha)**
Adjusted value (2013 $/ha)
Timber 12,775,754 35 102
Fuelwood 18,139,999 49 145
Poles 1,329,193 4 11
Withies 1,002,310 3 8
Water***105 10,037,086 27 80
Honey 9,558,931 26 76
Wild animals 524,968 1 4
Edible insects 265,650 1 2
Medicinal plants 30,347,863 82 242
Mushroom 5,946,014 16 47
Thatching material 1,116,899 3 9
Fodder 9,413,438 25 75
Wild vegetables 1,028,310 3 8
Charcoal 44,183,521 119 352
Pottery*** 3,291,424 9 26
Carvings*** 18,434,140 50 147
Carpentry*** 110,235,897 298 879
Materials for mats 89,795 0 1
Fruits 20,021,803 54 160
TOTAL 292,360,704 790 2,375

107
$305/household, respectively. A livelihoods assessment in Miombo woodlands in Tanzania (Njana et al. 2012) found similar income equivalent values at approximately $1130/household (adjusted for inflation and PPP). However, a recent survey on cash income benefits from Ngitili estimated their worth at Tsh (2010) 45,400/household, or $87/household (Otsyina 2010), indicating that their cash income and consumptive values are more likely to be closer to the HBS (2007) and Schaafsma et al. (2012a) estimates. Thus, in order to help ensure that the valuation estimates are conservative, the per-hectare estimates from Monela et al. (2005) are checked by multiplying physical quantities harvested in Ngitili as estimated in Monela et al. (2005) with local prices for wood fuel, thatch grass and fodder identified in market surveys in various districts of Shinyanga and elsewhere (Wiskerke et al. 2010, Schaafsma et al. 2012a). This value was averaged with the per hectare monetary value derived from Monela et al. 2005 (Figure 29). The resulting total gross value of provisioning services for Ngitili agroforestry and maize-grazing rotation systems was estimated at $1100/ha and $250/ha, respectively. Deducing the estimated wildlife predation costs from the Ngitili system (approx. $100/ha) gives a gross margin of $1000/ha for Ngitili systems.108
Figure 30: Baseline - provisioning service values from Ngitili and maize-grazing rotation ($/ha/year)
Total Provisioning Services The WaterWorld Model was also used to estimate total provisioning services based on area extents (which is about 3.6 times the average size recorded in literature), producing approximately $1.5 billion in consumptive values across all modelled districts. The largest proportion of these values derive from charcoal $463 million, non-timber forest products such as honey, medicines and withies at $429 million, as well as wild foods such as fish and bush meat, at approximately, $297 million respectively. Building materials (timber and poles) and wood fuel also make up a significant share of total values at $148 million and $102 million, whereas the values of fodder and thatch grass are much more modest at $50 million and $6 million respectively. Note however that these are consumptive values, rather than cash income values.
108 Wildlife damages per household Tsh 63,270 (Monela et al. 2005) X number of households during the study period (approx. 198,786) = Tsh 12.58 million. Dividing by the Ngitili hectarage (370,000 ha) = Tsh 33,990/ha. Adjusting inflation from years 2004-2013 and converting to US 2013 PPP-equivalent dollars comes to $100/ha.
$0
$50
$100
$150
$200
$250
$300
$350
$400
Ngitili Maize-grazing rotation
Food crops and other crops
Timber + Poles
Charcoal
Wood fuel
Other NTFPs (eg. honey,medicine, witheys)
Thatch grass
Fodder
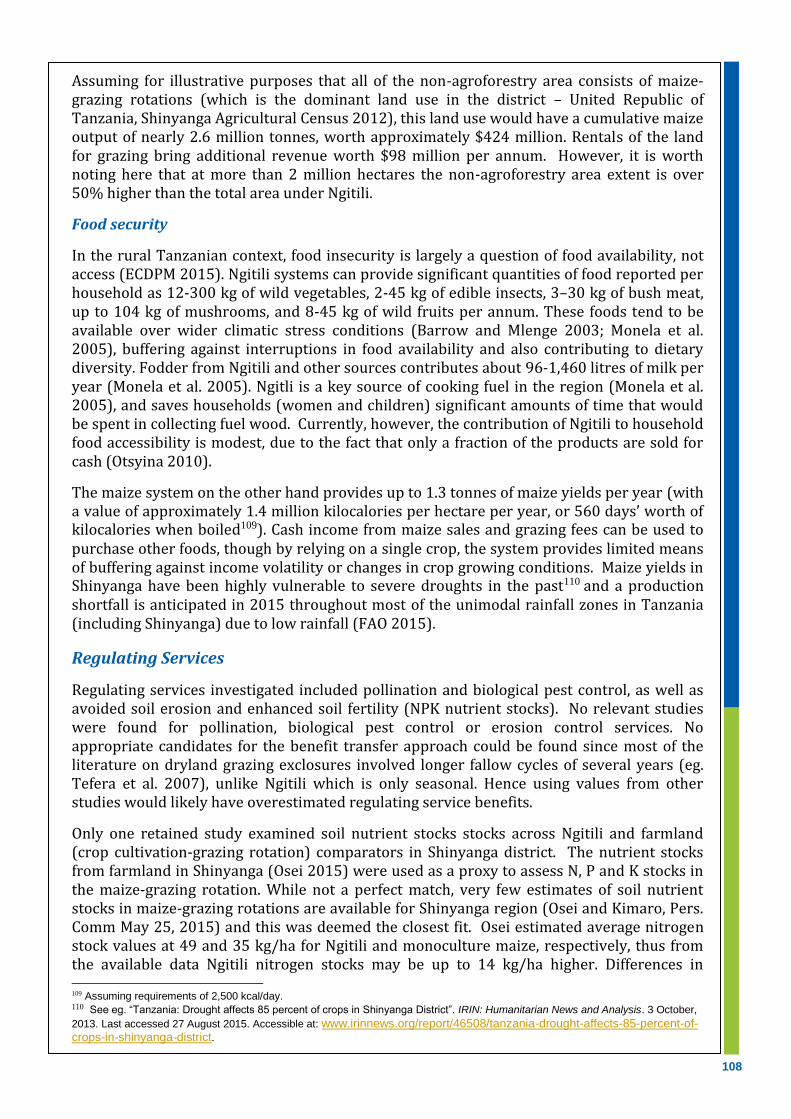
108
Assuming for illustrative purposes that all of the non-agroforestry area consists of maize-grazing rotations (which is the dominant land use in the district – United Republic of Tanzania, Shinyanga Agricultural Census 2012), this land use would have a cumulative maize output of nearly 2.6 million tonnes, worth approximately $424 million. Rentals of the land for grazing bring additional revenue worth $98 million per annum. However, it is worth noting here that at more than 2 million hectares the non-agroforestry area extent is over 50% higher than the total area under Ngitili.
Food security
In the rural Tanzanian context, food insecurity is largely a question of food availability, not access (ECDPM 2015). Ngitili systems can provide significant quantities of food reported per household as 12-300 kg of wild vegetables, 2-45 kg of edible insects, 3–30 kg of bush meat, up to 104 kg of mushrooms, and 8-45 kg of wild fruits per annum. These foods tend to be available over wider climatic stress conditions (Barrow and Mlenge 2003; Monela et al. 2005), buffering against interruptions in food availability and also contributing to dietary diversity. Fodder from Ngitili and other sources contributes about 96-1,460 litres of milk per year (Monela et al. 2005). Ngitli is a key source of cooking fuel in the region (Monela et al. 2005), and saves households (women and children) significant amounts of time that would be spent in collecting fuel wood. Currently, however, the contribution of Ngitili to household food accessibility is modest, due to the fact that only a fraction of the products are sold for cash (Otsyina 2010).
The maize system on the other hand provides up to 1.3 tonnes of maize yields per year (with a value of approximately 1.4 million kilocalories per hectare per year, or 560 days’ worth of kilocalories when boiled109). Cash income from maize sales and grazing fees can be used to purchase other foods, though by relying on a single crop, the system provides limited means of buffering against income volatility or changes in crop growing conditions. Maize yields in Shinyanga have been highly vulnerable to severe droughts in the past110 and a production shortfall is anticipated in 2015 throughout most of the unimodal rainfall zones in Tanzania (including Shinyanga) due to low rainfall (FAO 2015).
Regulating Services
Regulating services investigated included pollination and biological pest control, as well as avoided soil erosion and enhanced soil fertility (NPK nutrient stocks). No relevant studies were found for pollination, biological pest control or erosion control services. No appropriate candidates for the benefit transfer approach could be found since most of the literature on dryland grazing exclosures involved longer fallow cycles of several years (eg. Tefera et al. 2007), unlike Ngitili which is only seasonal. Hence using values from other studies would likely have overestimated regulating service benefits.
Only one retained study examined soil nutrient stocks stocks across Ngitili and farmland (crop cultivation-grazing rotation) comparators in Shinyanga district. The nutrient stocks from farmland in Shinyanga (Osei 2015) were used as a proxy to assess N, P and K stocks in the maize-grazing rotation. While not a perfect match, very few estimates of soil nutrient stocks in maize-grazing rotations are available for Shinyanga region (Osei and Kimaro, Pers. Comm May 25, 2015) and this was deemed the closest fit. Osei estimated average nitrogen stock values at 49 and 35 kg/ha for Ngitili and monoculture maize, respectively, thus from the available data Ngitili nitrogen stocks may be up to 14 kg/ha higher. Differences in 109 Assuming requirements of 2,500 kcal/day. 110 See eg. “Tanzania: Drought affects 85 percent of crops in Shinyanga District”. IRIN: Humanitarian News and Analysis. 3 October,
2013. Last accessed 27 August 2015. Accessible at: www.irinnews.org/report/46508/tanzania-drought-affects-85-percent-of-crops-in-shinyanga-district.
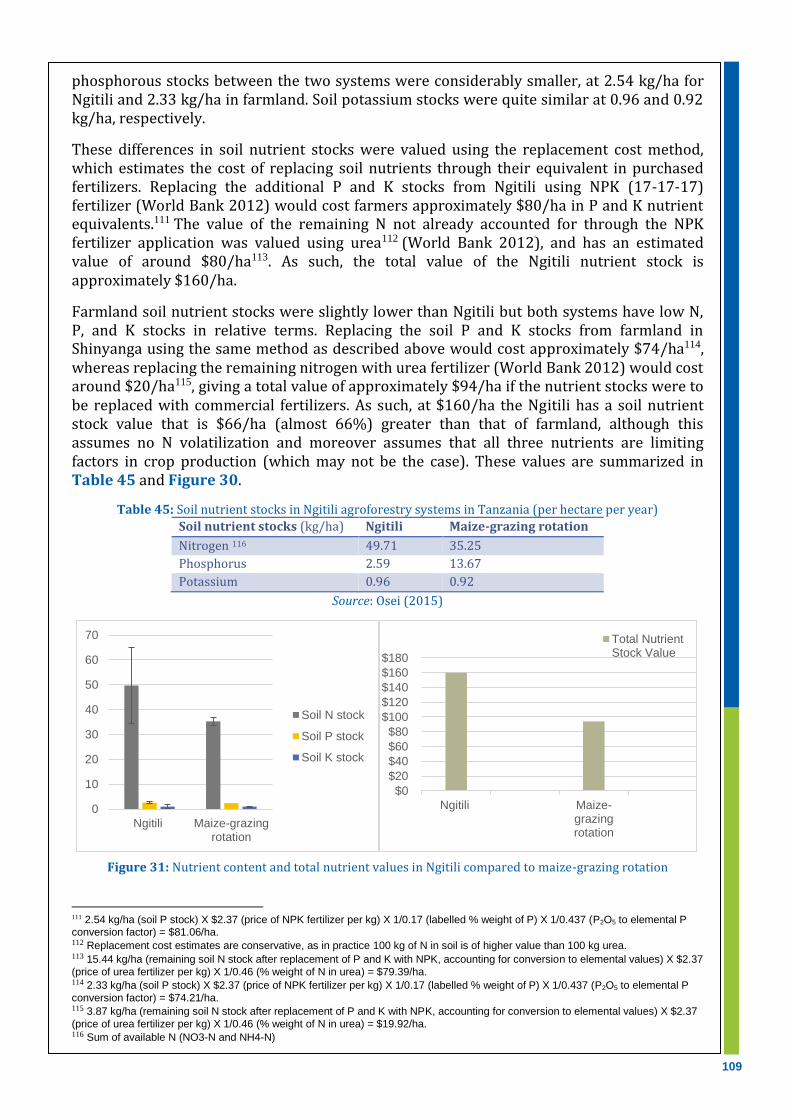
109
phosphorous stocks between the two systems were considerably smaller, at 2.54 kg/ha for Ngitili and 2.33 kg/ha in farmland. Soil potassium stocks were quite similar at 0.96 and 0.92 kg/ha, respectively.
These differences in soil nutrient stocks were valued using the replacement cost method, which estimates the cost of replacing soil nutrients through their equivalent in purchased fertilizers. Replacing the additional P and K stocks from Ngitili using NPK (17-17-17) fertilizer (World Bank 2012) would cost farmers approximately $80/ha in P and K nutrient equivalents.111 The value of the remaining N not already accounted for through the NPK fertilizer application was valued using urea112 (World Bank 2012), and has an estimated value of around $80/ha113. As such, the total value of the Ngitili nutrient stock is approximately $160/ha.
Farmland soil nutrient stocks were slightly lower than Ngitili but both systems have low N, P, and K stocks in relative terms. Replacing the soil P and K stocks from farmland in Shinyanga using the same method as described above would cost approximately $74/ha114, whereas replacing the remaining nitrogen with urea fertilizer (World Bank 2012) would cost around $20/ha115, giving a total value of approximately $94/ha if the nutrient stocks were to be replaced with commercial fertilizers. As such, at $160/ha the Ngitili has a soil nutrient stock value that is $66/ha (almost 66%) greater than that of farmland, although this assumes no N volatilization and moreover assumes that all three nutrients are limiting factors in crop production (which may not be the case). These values are summarized in Table 45 and Figure 30.
Table 45: Soil nutrient stocks in Ngitili agroforestry systems in Tanzania (per hectare per year)
Soil nutrient stocks (kg/ha) Ngitili Maize-grazing rotation
Nitrogen 116 49.71 35.25
Phosphorus 2.59 13.67
Potassium 0.96 0.92
Source: Osei (2015)
Figure 31: Nutrient content and total nutrient values in Ngitili compared to maize-grazing rotation
111 2.54 kg/ha (soil P stock) X $2.37 (price of NPK fertilizer per kg) X 1/0.17 (labelled % weight of P) X 1/0.437 (P2O5 to elemental P conversion factor) = $81.06/ha. 112 Replacement cost estimates are conservative, as in practice 100 kg of N in soil is of higher value than 100 kg urea. 113 15.44 kg/ha (remaining soil N stock after replacement of P and K with NPK, accounting for conversion to elemental values) X $2.37
(price of urea fertilizer per kg) X 1/0.46 (% weight of N in urea) = $79.39/ha. 114 2.33 kg/ha (soil P stock) X $2.37 (price of NPK fertilizer per kg) X 1/0.17 (labelled % weight of P) X 1/0.437 (P2O5 to elemental P
conversion factor) = $74.21/ha. 115 3.87 kg/ha (remaining soil N stock after replacement of P and K with NPK, accounting for conversion to elemental values) X $2.37
(price of urea fertilizer per kg) X 1/0.46 (% weight of N in urea) = $19.92/ha. 116 Sum of available N (NO3-N and NH4-N)
0
10
20
30
40
50
60
70
Ngitili Maize-grazingrotation
Soil N stock
Soil P stock
Soil K stock
$0
$20
$40
$60
$80
$100
$120
$140
$160
$180
Ngitili Maize-grazingrotation
Total NutrientStock Value

110
Biodiversity Nearly all of the Ngitili in each of the districts were dominated by acacia species, excepting Bukombe and Shinyanga rural districts which are largely miombo woodlands. The Shannon-Weiner diversity index (H’) was at 1.874 - 3.669, whereas the species dominance (C’) ranged from 0.041 to 0.292. These values were comparable to publically protected land where the H’ of was at 2.9 and C’ was at 0.092; and gazetted forests/woodlands in Morogoro district where H’ was at 3.13 to 3.16 and C’ was at 0.065 (Zahabu 2001; Malimbwi and Mugasha, 2001). Selemani et al. (2013) found no significant difference in terms of H’ and C’ diversity indices for herbaceous species across Ngitili of different age and tenure status as well as communal grazing land. In the late 1980s, 145 bird species were observed in ngitli managed areas (Monela et al. 2004), with H’ values of 2.14 - 4.28. The Shinyanga region and surrounding areas provide habitats for seven out of approximately 42 bird species with restricted habitat ranges in Tanzania117. The revival of Ngitili was also observed to have reintroduced a number of mammalian species (Monela et al. 2004), with H’ index values of 0.635 - 2.6, and the C’ index of 0.44 - 0.9. None of the above-mentioned biodiversity indicators could be valued economically, since the potential for hunting and game viewing in the area is low, and no relevant local or global contingent valuation studies for birds, mammals or ecosystems in the study area. The re-introduced mammals however included carnivores such as the black-backed jackal, African civet and spotted hyena leading to wildlife damage costing about $63 per family per year (Monela 2005). Carbon Soil carbon was estimated from the same dataset as described for soil nutrient stocks above (Osei 2015), as well as a REDD+ scoping study for potential Ngitili in Shinyanga region (Otsyina et al. 2008) and a baseline assessment for an Ngitili -related REDD+ project in Shinyanga region (TATEDO 2012). Total (above and belowground) biomass carbon for Ngitili was assessed using estimates from Otsyina et al. (2008) and TATEDO (2012). We also include estimates of herbaceous biomass from Selemani et all. (2013) although these are not used for the cost-benefit analysis due to the lack of woody biomass measurements in the same. Given that the maize-grazing rotation is an annual system with very few perennial elements and since litter is excluded from our carbon stock assessments, we assume that the biomass carbon stocks for the system are zero. Combining these biomass and soil carbon estimates gave total values of 37.8 Mg C/ha of carbon for Ngitili and 17 Mg C/ha for the maize-grazing rotation, respectively. The studies measuring carbon stocks are listed below in Table 46 and are visualized in Figures 31 and 32.
117 I.e. birds with habitat ranges amounting to less than 50,000 km2. Representing approximately 17% of the total number of bird species with restricted ranges in Tanzania.

111
Table 46: Carbon stocks in Ngitili agroforestry and maize-grazing rotation in Tanzania (Mg C/ha/y)
C Stock System Quantity Value ($) Source
Biomass Ngitili
29 Otsyina et al. 2008
28.3, 9.26, 2.84 Osei 2015
0.28, 0.27, 0.38, 0.32118 Selemani et al. 2013*
Average 15.6 $370 -$2300
Maize-grazing rotation 0 Assumed value
Soil119 Ngitili
23 Otsyina et al. 2008
21.15 TATEDO 2012
19.86, 34.06, 13.45 Osei 2015
Average 22 $500-3300
Maize-grazing rotation 18.35, 16.43 Osei 2015
Average 17.4 $400-2500 Osei 2015
* Not included in the cost-benefit analysis.
Figure 32: Carbon stocks (Mg/ha) from Ngitili agroforestry and maize-grazing rotation (Mg C/ha)
* “Biomass” refers to total above and belowground biomass
Ngitili harbors significant carbon stocks compared to the maize-grazing rotation, principally in the form of biomass carbon and to a lesser extent in the soil carbon. However, over a 20-year time horizon, the per hectare per year stock value is quite modest. This suggests that significant REDD+ payments for Ngitili establishment and restoration are only likely to accrue if Ngitili leads to avoided emissions from deforestation at landscape level for which payments can be obtained. The literature reviewed did not indicate whether this was the case. Above-ground biomass carbon was also estimated using the WaterWorld model. Mean canopy cover in the five districts was 5.3% (ranging between 1.1% (Shinyanga Urban) and 15.2% (Bukombe)). The total carbon stock of all modelled districts amounts to approximately 34.7 million tonnes, worth about $837 million to $5.1 billion. Runoff Modelled mean annual runoff for the five sub-basin outlets is greatest for sub-basin 5 that includes part of the Kahama and Meatu districts with 37.7 m3/s. Sub basin 4 which covers part of the Shinyanga and Kahama districts has the lowest mean annual runoff with just under 11 m3/s.
118 Only for aboveground herbaceous biomass, not for woody plants 119 Quantified at 0-20 cm depth.
0
5
10
15
20
25
30
35
40
45
Ngitili Maize-grazing rotation
C stock- soil
C stock - biomass

112
a) b)
Figure 33: a) Carbon stocks ($/ha) and b) net carbon stocks ($/ha/year) in Ngitili agroforestry and maize-
grazing rotation. *Low carbon price; **High carbon price
Water quality The mean human footprint index (mean percentage of water that may be polluted) has a maximum value in the Shinyanga urban district of 4 % due to the relatively high number of people living in this district. Soil erosion Total soil erosion is low in all districts due to the mostly flat terrain. Maximum soil erosion is found in the Bukombe district with 1.8mm on average each year, equal to about 18 tonnes/ha/yr. All other districts have soil erosion values below 0.5 tonnes/ha/yr. Total erosion across all districts combined amounts to approximately 18 million m3 of soil loss per year. All values are summarized in Table 47.
Table 47: Model generated regulating services for Ngitili baseline
District Water yield (m3)
Water quality (HFI %)
Carbon (tonnes)
Erosion (m3 soil loss)
Bukombe 6,097,125,766 2.0 19,487,499 17,780,681
Kahama 4,518,137,386 2.7 8,537,186 116,998
Maswa 1,467,557,830 1.3 1,152,893 543
Meatu 3,296,662,601 1.5 4,521,877 77,563
Shinyanga Rural 1,731,251,117 2.1 890,214 1,102
Shinyanga Urban 213,126,471 4.0 79,799 23,800
Gross Margin and Input Costs Although agricultural wage labour markets are imperfect in Shinyanga region (Wiskerke et al. 2010), wage labor is still a major livelihood strategy for many (Monela et al. 2004) and hence should be incorporated into any cost-benefit analysis. Transferable household production functions developed for charcoal, wood fuel, thatch and poles collection from the Eastern Arc mountain forests (Schaafsma et al. 2012a; 2012b) could not be used to estimate
$0
$1,000
$2,000
$3,000
$4,000
$5,000
$6,000
$7,000C stock - soil
$0
$20
$40
$60
$80
$100
$120
$140
$160
Ngitili* Ngitili**
113
collection costs for Ngitili because the model used was spatially explicit. Labour and other management cost estimates for maize were based on values provided for a maize-fallow system in Tabora district as analysed in Ramadhani (2002) estimated at Tsh 19,600/ha/year, or $115/ha/year in 2013 PPP-equivalent dollars. Wildlife predation cost was about $100/ha/year for Ngitili. Since comparative data on labour costs for Ngitili product collection was not available, the gross value of the ecosystem goods and services from the two systems net of predation was estimated instead. The total system output values for Ngitili and the maize/grazing rotation are approximately $1000 and $256/ha/year, respectively. Net Present Values The net present value computed from the current available (and commensurable) data on Ngitili systems in Shinyanga is illustrated in Figure 33. Ngitili clearly dominates maize-grazing rotation regardless of the discount rate used or the carbon pricing assessment, with a net present value range of $5,000 – 18,000120. By contrast, maize has an NPV range of $ 750 - 2,100. Although they would likely have a fairly significant impact on the NPV calculations, we do not anticipate that incorporating any labuor costs (for Ngitili product harvesting will substantially affect the outcome of Ngitili dominating the maize-grazing rotation. Enhancing the hecterage of land under Ngitili management could have a significant potential to improve livelihoods while enhancing ecosystem services. For instance, if half of the crop area currently under maize cultivation were converted to Ngitili, this would enhance longer term C stocks in the area by a cumulative total of approximately 3.8 Mg C, while significantly enhancing provisioning services.
120 As was the case with coffee agroforestry in Ethiopia, since we model the ngitili and maize-grazing rotation systems at maturity and do not have data capturing variable annual cash flows (positive and negative), we were unable to compute the IRR value for these systems.

114
a)
b)
Figure 34: NPV under different discount rates for ecosystem services in Ngitili agroforestry and maize-grazing
rotation at carbon price of a) $6.5/tonne CO2eq and b) $40.3/tonne CO2eq
Summary of Ngitili ecosystem services and value identification
Although most of the ecosystem service values in Ngitili are provisioning services, unlike the other systems examined, only a fraction of these values are fully captured in formal markets. There is some evidence of commercial markets for charcoal, and to a lesser extent for building materials such as timber and poles (Putri and Kweka, 2014; Otsyina 2010; Pye-Smith 2010). On the other hand, many other provisioning services are not marketed extensively and hence are only captured in the form of direct use values, such as medicines, wild foods, wood fuel and fodder (Putri and Kweka, 2014; Otsyina 2010). As with the other systems, carbon stock values are demonstrated through quantification, and we estimate the potential for smallholder agroforester to capture these values through the carbon market price and social cost of carbon, while deducting for REDD+ transaction and implementation costs. Other regulating services such as soil fertility, water provisioning and water quality have had their value demonstrated both quantitatively and economically, but the total extent to which these benefits have been captured by the farmer have not been quantified, to say nothing of designing institutional mechanisms for enhancing benefit capture in these systems.
The extent to which Ngitili systems have actually enhanced biodiversity remains disputed (eg. Selemani et al. 2013), and the paucity of the evidence base is such that its value can only be recognized at this point. The extent to which the vegetative and mammalian biodiversity can be demonstrated (eg. through enhanced household resilience or increased bush meat and insect harvests) or captured (eg. through tourism values) remains an ongoing area of research, although the potential for value capture is likely to be modest at present because of the undeveloped tourism facilities in the area (Monela et al. 2005). The regulating services from Ngitili save farmers from having to rely on agrochemical inputs, which are not always readily accessible or affordable.
3.3.3 GDP of the poor
Tanzania’s GDP is approximately $127 billion in purchasing power parity equivalent, of which agriculture, forestry, fishing and livestock contribute approximately 40 billion or approximately 31.5% of GDP. Tanzania’s total population is approximately 51.8 million, of which approximately 490,000 are poor Ngitili agroforesters. This figure was estimated by taking the population of Shinyanga as estimated by Tanzania Bureau of Statistics (2013) at approximately 1.5 million, multiplied by the fraction of households employed in agriculture, forestry, hunting and fishing in the region (75% - Tanzania Bureau of Statistics (2002)),
$0
$5,000
$10,000
$15,000
$20,000
Ngitili Maize-grazingrotation
NPV 2.5% NPV 7.5% NPV 10% NPV 20%
$0
$5,000
$10,000
$15,000
$20,000
Ngitili Maize-grazingrotation
NPV 2.5% NPV 7.5% NPV 10% NPV 20%

115
which gives a value of 1.15 million. We assume that this complete population of persons employed in said sector is coextensive with the number of potential Ngitili beneficiaries in the area, since many Ngitili are open-access resources managed communally or by institutions such as eg. schools and churches (Monela et al. 2005).
The Shinyanga region is quite poor in most respects, with 26% of surveyed individuals living on less than $1.00/day in purchasing power parity equivalents in 2010 (Otsyina 2010). Since only a fraction of Ngiitili beneficiaries have private title to Ngitili, in this instance it made more sense to measure poverty in terms of whether beneficiaries have any landholdings at all, with the size of the land holding serving as a secondary poverty indicator. Thus, in order to quantify the effects on the poorest beneficiaries, the household wealth categorizations in Otsyina (2010) was used. These wealth categories are relative definitions, unique to each of the surveyed villages, and pertain to such indicators as whether or not the respondent owns land (as well as the size of the land endowment), degree of food sufficiency, and number of livestock owned121. From this it was found that approximately 43% of households in Shinyanga fall into wealth categories III and IV, the two poorest categories. Multiplying the number of households employed in forestry, hunting and fishing as described above by the fraction of households in wealth categories III and IV gives a value of approximately 490,000 beneficiaries of Ngitili whom are relatively poor122.
The only products for which we have confidence to estimate relatively complete capture on formal markets are charcoal and honey. Multiplying the value of the charcoal and honey output by the total hectarage under Ngitili (370,000 ha) and by the proportion of poor beneficiaries (43%) gives a total value of $ 67 million123, or a per capita GDP value of approximately $ 138 per person per year. The contribution of poor Ngitili agroforesters to traditional GDP is quite low due to the fact that most Ngitili products are not marketed or sold for cash (Monela et al. 2004; Otsyina et al. 2010). When non-marketed or informal timber and wood fuel are incorporated into the estimates, the value increases by $27 million124, and adding the value of unmarketed NTFPs gives an increase of $76 million125. Incorporating the values of carbon sequestration, which we assume poor Ngitili beneficiaries capture using the low carbon price (less transaction, implementation and management costs) gives an additional value of $4 million126. The additional contribution of these non-marketed products amounts to a total adjusted value of $173 million, or an approximate 0.1% additional contribution to the country’s agricultural GDP. The revised per GDP per capita from Ngitili products is approximately $355 per person per year. Since Hammond et al.’s (2007) survey was not conducted in Tanzania, the average of the equity weights (ratio of expenditures on food from the ‘top’ of the pyramid to the ‘base’ of the pyramid, respectively) estimated for Malawi and Uganda was used, which gave an equity weight of approximately 3.15. Incorporating these equity weights into the per capita GDP of the poor calculations amounts to $ 1,117 per person per year.
As was mentioned in the discussions on GDP of the poor for agroforestry systems in Ghana and Ethiopia, one means of assessing whether a given land use or agronomic practice provides an exit strategy from severe poverty is by identifying whether net returns exceed the International Poverty Line of $1.25 in purchasing power parity equivalents dollars (cf.
121 Land size (None, hire, or 1 acre (min.) to 10 acres (max.)); Food sufficiency and strategies for coping (Very little; “Depends” (variable food security); Buy food/sell labor; Buy food; Sell labor; 6 months; all year); Livestock (none, goats only, 1 cattle (min.) to 20 cattle (max.)). 122 1,151,106 X 43% = 489,220. 123 (($ 352/ha + $ 76.2/ha) X 370,000 ha) X 43% = $ 67,399,000. 124 (($ 113/ha + $ 59/ha) X 370,000 ha) X 43% = $27,047,000. 125 (($ 250/ha + $ 5/ha + $ 226/ha) X 370,000 ha) X 43% = $ 75,783,493. 126 (($ 24/ha) X 370,000 ha) X 43% = $3,774,000.

116
Harris and Orr 2014). Although the consumptive values from Ngitili are quite high127, it is worth bearing in mind that these are gross values, and if the costs of collection were deducted from the per capita incomes (not weighted for equity) then the per capita values would likely only comprise a modest fraction of the $1.25 per person per day poverty line. However, given that many Ngitili plots are open access resources from which households derive well under one tenth of their incomes on average, and which often serve safety net functions for poorer community households, it is unsurprising that Ngitili alone cannot provide sufficient income (or consumption equivalents) to fully eradicate poverty for many households. However, when combined with income from crop farming, livestock keeping, and off-farm employment, Ngitili still plays an important role stabilizing household livelihoods, even if they will not be a key driver of poverty alleviation.
The complete set of GDP of the poor indicators and calculations are summarized in Table 48 below.
Table 48: GDP of the poor calculations for Ngitili agroforestry in Tanzania
Parameter Value Reference
Gross domestic product (PPP-adjusted $ million) 127,690.83 World Bank 2015a
Contribution of agriculture, forestry, livestock and fishing
($ million)
40,223 World Bank 2015b
Of which contribution by poor Ngitili agroforesters
(per hectare value multiplied with area of small holdings less
than 1 ha) ($ million)
67.33 Own calculation (See
CBA section)
Percentage contribution of agriculture, forestry and
fishing to GDP
31.5% World Bank 2015c
Total population (million) 51.82 World Bank 2015d
Of which poor Ngitili agroforesters farmers (million) 0.49 URT 2012, URT 2004
Per capita agricultural GDP of the poor 137.64
Per capita GDP for the rest of the population
(less GDP of the poor and rest of the population)
2,486.17
Adjustments for unrecorded timber and fuel wood from
forestry GDP ($ million)
27 Own calculation (See
CBA section)
Adjustments for contribution of NTFPs to the economy
($ million)
76 Own calculation (See
CBA section)
Adjustments for ecotourism and biodiversity values
($ million)
0
Adjustments for other ecological services ($ million) 4
Adjusted contribution of agriculture, forestry and
fishing to GDP
40,329
Adjusted contribution of agriculture, forestry and fishing to
the poor
173.76
Per capita adjusted agricultural GDP for the dependent
population
355.18
Per capita adjusted GDP for the entire population 778.21
Equity adjusted cost per person for agriculture dependent
community
1,117.22 Hammond et al. 2007
Contribution of Ecological services to classical GDP ($
million)
106
Additional contribution to GDP 0.1%
Total Share of GDP 31.6%
Contribution to the poor ($ million) 106.43
127 Notwithstanding possible upward bias in the provisioning service values mentioned earlier in this chapter.
117
3.3.4 Trends, potential scenarios and impact on ecosystem services
Ngitili coverage has been expanding from 600 ha in 1986 to >250000 ha in 2003 (Barrow and Mlenge 1997) or about 500,000 ha according to Shechambo (2008). It was a traditional system on communal and individual land that became promoted in the region as a nationally driven requirement to protect water supply sources. The returns to labour and land128 in Ngitili are much higher than those in maize growing which is the alternative land use. Nevertheless the rapid growth in human and livestock population is leading to increasing demand for land to grow food crops especially maize (Fisher 2005; National Bureau of Statistics and Shinyanga Regional Commissioner’s Office 2007), leading to fragmentation of Ngitili. Ngitli is also becoming degraded due to overgrazing and overharvesting of fuel wood for charcoal due to growing urban demand (World Agroforestry Centre 2010). The regulatory requirement for permits to harvest protected tree species in own Ngitili, punitive laws and regulations and gender inequalities in access and control to an extent also create disincentives for the Ngitili system. As such, despite the rapid expansion in Ngitili up to 2003, tree cover on agricultural land largely decreased in Tanzania between 2002 and 2010 (Zomer et al. 2014). Two scenarios are represented as different ways in which Ngitili systems within the study districts could transform over time.
1. Conversion of all areas identified as Ngitili agroforestry to a maize mono cropping system. This could be caused by the fact that maize is a major food crop in the area and the Ngitili system after the HASHI program is reported to be getting degraded due growing demands for fuelwood and food due to rapid population growth (estimated at 2.9% per year) (World Agroforestry Centre).
2. Extended Ngitili agroforestry system where tree cover for all cells identified as Ngitili is set to a minimum of 20%. This could be a scenario if ongoing fuel-saving stove promotions, REDD+ programs and other efforts promoting the Ngitili program are successful.
Scenario 1: Conversion from Ngitili to a maize mono cropping Values for tree functional type are set to a maximum of 1% as Ngitili areas already have very low values of tree canopy cover e.g. 3.8% for Meatu district and increasing tree values are not anticipated under this scenario. Values for bare and herbaceous cover are set to 19% and 80% respectively. Converted areas are set to cropping use.
Change in provisioning services
The increase in hectarage under maize-grazing rotation would increase maize production to around 4.4 million tonnes. Assuming no price effects this leads to a total monetary value of nearly $700 million in maize production, a $273 million increase compared to the baseline.
Change in freshwater provision Water use by vegetation decreases in this scenario, leading to an increase in available water of between 2.6 and 12 mm a year. Total annual water yield increases by 283 million m3 when summed across all districts, the greatest impact occurring in Meatu district.
128 Ngitli returns to labour and land estimated to be $2.67/work day and $388/ha, respectively (Franzel 2004).

118
Of the literature reviewed, two contingent valuation studies for water provisioning services were relevant. However, these values varied widely with location. The study by Kaliba et al. (2003) showed that in Dodoma, households were willing to pay approximately Tsh 52 for each 20 litres, which amounts to approximately (2013) $8.91 per m3 when adjusted for inflation and purchasing power parity (PPP). By contrast, the willingness to pay of each household in the Singida region was only approximately 599 Tsh per year, or approximately (2013) $2.05 per annum in inflation and PPP-adjusted dollars. In order to ensure the estimates were conservative, the Dodoma WTP values were not used129. Mombo et al. (2014) established an average willingness to pay per household per annum for catchment trees of approximately $US 1.92130 in the Kilombero region and $6.92 in the Morogoro region. The study assumes the final service of water provisioning is what respondents are actually valuing, rather than some combination of services from catchment trees. Neither study provided sufficiently detailed information on household or per capita incomes, and consequently it was not possible to adjust the WTP values for differences in incomes between study and policy sites. Although it was not possible to obtain any quantitative projections or estimates of water demand in Shinyanga region as a whole, there is reason to believe that increased fresh water provisioning would lead to enhanced welfare (as reflected in our WTP estimates). The 2007 Shinyanaga socio-economic profile notes that
“[in] the rural areas of Shinyanga region the availability of natural water sources are scarce and seasonal…The majority of rural population still depend on traditional water sources, like hand-dug water, waterholes in riverbeds during the dry season or unlined and unprotected shallow wells for both human and livestock consumption. The natural sources existing in the region are usually unsafe and not reliable…The findings suggest that Shinyanga region is facing an acute shortage of water supply” (National Bureau of Statistics and Shinyanga Regional Commissioner’s Office 2007b).
Similarly, 22% of survey respondents in Otsyina (2010) noted scarcity of water for livestock and 47% identified drought as a key problems. Finally, as documented by Monela et al. (2005), enhanced water supplies can reduce travel and collection times for households, the majority of which is fetched by women and children. This can potentially free up time for other livelihoods activities, or educational and recreational opportunities. As such, although attention needs to be paid to water quality and safety, there is ample evidence to suggest that residents of Shinyanga would significantly value the increased water supplies. Multiplying the mean annual household willingness to pay for the three study areas by the 261,732 households in Shinyanga region (Tanzania Bureau of Statistics 2013) gives approximately $0.95 million worth of increased water provisioning to households across all modelled districts. This estimate could be improved by using additional contingent valuation studies which are sensitive to changes in scope to the ecosystem services (as measured in eg. $/m3), and by a comprehensive, spatially explicit review and adjustment of these WTP values according to eg. variable water supply and demand by key urban centres in the modelled regions. 129 Kaliba et al. (2003) also note that the Dodoma WTP value is substantial by Tanzanian standards. 130 Per household obtained by dividing aggregate district value (Tsh 294,755,038) by 94,856 households in Kilombero district
(National Bureau of Statistics 2013) and Tsh 304,674,000 by 77,040 households in Morogoro district then converting to 2013 PPP
equivalent US dollars.

119
Runoff
The greatest change in absolute runoff is observed in the largest sub basin 5 with an increase of 0.7m3/s. No valuation studies for avoided runoff services were found.
Change in freshwater quality
There is a decrease in water quality most especially in the Kahama district with an increase in the HFI of 0.3% from the initial value of 2.7% in the baseline situation. The smallest change is observed in the Maswa district. The absence of relevant socio-economic literature on this service meant it could not be valued.
Change in carbon stock
The reduction in canopy cover in all districts of about 1.1% leads to overall decrease in carbon stocks by approximately 7.2 million tonnes, worth approximately $176 million131.
Change in soil erosion
Soil erosion in most districts increases slightly, but the large gains in erosion control in Bukombe district leads to avoided soil loss of approximately 315,000 tonnes when aggregating across all districts. The replacement cost method was used to value soil nutrient changes based on estimates by Osei (2015) at approximately 17.8 mg/kg, 0.19 mg/kg and 0.91 mg/kg for N132, P and K respectively in Ngitili soils. Multiplying these shares by the total avoided soil loss across all districts gives approximately 7,226 kg, 60 kg and 287 kg of avoided N, P, and K nutrient losses per annum. The replacement cost of P and K using NPK fertilizer (World Bank 2012) was first estimated, which amounts to a net gain of approximately $4,800 in avoided P and K nutrient losses.133 The value of the remaining N not already replaced by NPK fertilizer was valued using urea (World Bank 2012), and was estimated at approximately $26,700 in foregone nitrogen losses134. As such, the total value of the avoided soil nutrient losses from erosion is very modest, at just over $31,000. Tables 49 and 50 summarize the changes in regulating services below. Modest gains in water provisioning and erosion control values are obtained, although at the cost of significant quantities of carbon stocks.
Table 49: Biophysical results for Scenario 1
District ∆Water yield
(m3)
∆Water quality
(HFI %)
∆Carbon
(tonnes)
∆Erosion
(m3 soil loss)
Bukombe 25,319,687 0.150 -3,720,899 -474,132
Kahama 63,270,830 0.256 -3,131,301 67,911
Maswa 37,753,547 0.000 -340,497 0
Meatu 111,810,245 0.207 -1,901,796 90,638
Shinyanga
Rural
42,698,694 0.107 -17,812 309
Shinyanga
Urban
2,198,099 0.011 -10,192 155
131 If the high end carbon value of $ 40.3/tonne CO2eq. is used, the value amounts to roughly $1 billion across all modelled districts. 132 More specifically, NO3-N and NH4-N. 133 (431 kg (foregone K loss from erosion) X $2.37 (price of NPK fertilizer per kg) X 1/0.17 (labelled % weight of K) X 1/0.83 (K2O to
elemental K conversion factor) = $4,817. 134 5,378 kg (remaining foregone N loss from erosion) X $2.37 (price of urea fertilizer per kg) X 1/0.46 (% weight of N) = $26,760.

120
Table 50: Regulating service valuation ($) for Scenario 1
District ∆Water yield* ∆Carbon (low ∆ Erosion
Bukombe - -71,919,291 34,958.31
Kahama - -60,523,263 -5,007.15
Maswa - -6,581,282 -
Meatu - -36,758,809 1,618.02
Shinyanga Rural - -344,277 5.52
Shinyanga Urban - -196,991 2.77
Total 950,087 -176,323,914 31,577.47
*Data on number of households per district was not available and hence benefits per district were not estimated.
Scenario 2: Increasing tree cover in Ngitili agroforestry areas to a minimum of 20%
This scenario represents an extended Ngitili agroforestry system. Tree cover for all cells identified as agroforestry are set to a minimum of 20% with cells having higher baseline values left to their original values. In addition, the area of Ngitili agroforestry is extended for those areas classified as non-agroforestry land use (outside urban areas).
Changes in provisioning services
Net gains to provisioning services135 from conversion of maize-grazing rotations to Ngitili are significant at approximately $1.8 billion across all districts combined, which leads to a total value of provisioning services from Ngitili at $3.8 billion. However, converting over 235,000 ha of monocrop maize-grazing rotation systems to Ngitili leads to a loss of around 2.6 million tonnes in maize output worth nearly $425 million.
Change in freshwater provision
Considerable increase in tree cover leads to increased water use and thus a decrease in annual water yield of up to 11 mm for the Shinyanga rural and Meatu districts. Total water yield decreases by approximately 217 million m3 per year across all districts. Using the contingent valuation estimates from scenario 1 implies a loss of approximately $0.95 million in water values, which are identical to those of scenario 1 (except in this instance it is a loss rather than a gain).
Runoff
The changes in water yield in the districts lead to relatively small changes in runoff. The greatest changes are in sub basin 4 where mean annual runoff decreases with 0.25 m3/s.
Change in freshwater quality
Water quality under this scenario increases for all districts due to the increase in tree cover.
Change in carbon
The increase in shade trees leads to a mean increase in canopy cover of 10.7% across the districts. This leads to a net gain in carbon stocks of approximately 60 million tonnes across
135 Net of existing Ngitili benefits and the lost gains due to conversion from monoculture to Ngitili.
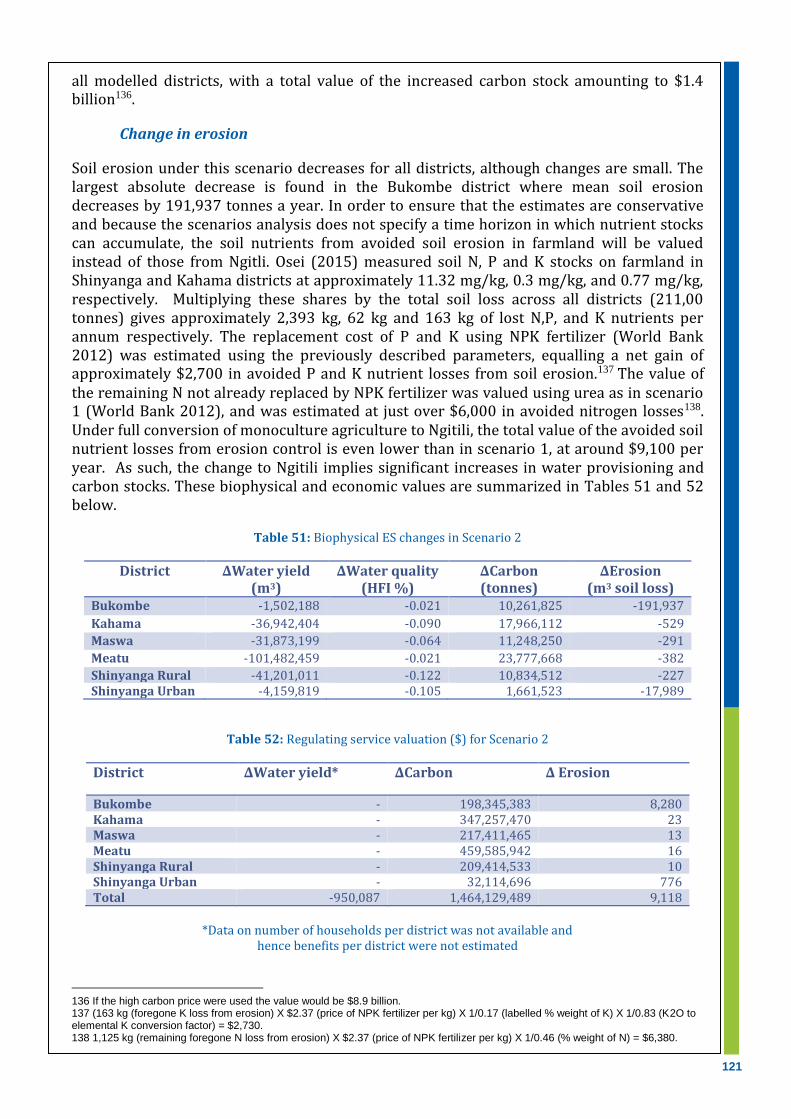
121
all modelled districts, with a total value of the increased carbon stock amounting to $1.4 billion136.
Change in erosion
Soil erosion under this scenario decreases for all districts, although changes are small. The largest absolute decrease is found in the Bukombe district where mean soil erosion decreases by 191,937 tonnes a year. In order to ensure that the estimates are conservative and because the scenarios analysis does not specify a time horizon in which nutrient stocks can accumulate, the soil nutrients from avoided soil erosion in farmland will be valued instead of those from Ngitli. Osei (2015) measured soil N, P and K stocks on farmland in Shinyanga and Kahama districts at approximately 11.32 mg/kg, 0.3 mg/kg, and 0.77 mg/kg, respectively. Multiplying these shares by the total soil loss across all districts (211,00 tonnes) gives approximately 2,393 kg, 62 kg and 163 kg of lost N,P, and K nutrients per annum respectively. The replacement cost of P and K using NPK fertilizer (World Bank 2012) was estimated using the previously described parameters, equalling a net gain of approximately $2,700 in avoided P and K nutrient losses from soil erosion.137 The value of the remaining N not already replaced by NPK fertilizer was valued using urea as in scenario 1 (World Bank 2012), and was estimated at just over $6,000 in avoided nitrogen losses138. Under full conversion of monoculture agriculture to Ngitili, the total value of the avoided soil nutrient losses from erosion control is even lower than in scenario 1, at around $9,100 per year. As such, the change to Ngitili implies significant increases in water provisioning and carbon stocks. These biophysical and economic values are summarized in Tables 51 and 52 below.
Table 51: Biophysical ES changes in Scenario 2
District ∆Water yield (m3)
∆Water quality (HFI %)
∆Carbon (tonnes)
∆Erosion (m3 soil loss)
Bukombe -1,502,188 -0.021 10,261,825 -191,937
Kahama -36,942,404 -0.090 17,966,112 -529
Maswa -31,873,199 -0.064 11,248,250 -291
Meatu -101,482,459 -0.021 23,777,668 -382
Shinyanga Rural -41,201,011 -0.122 10,834,512 -227 Shinyanga Urban -4,159,819 -0.105 1,661,523 -17,989
Table 52: Regulating service valuation ($) for Scenario 2
District ∆Water yield* ∆Carbon ∆ Erosion
Bukombe - 198,345,383 8,280 Kahama - 347,257,470 23 Maswa - 217,411,465 13 Meatu - 459,585,942 16 Shinyanga Rural - 209,414,533 10 Shinyanga Urban - 32,114,696 776 Total -950,087 1,464,129,489 9,118
*Data on number of households per district was not available and
hence benefits per district were not estimated
136 If the high carbon price were used the value would be $8.9 billion. 137 (163 kg (foregone K loss from erosion) X $2.37 (price of NPK fertilizer per kg) X 1/0.17 (labelled % weight of K) X 1/0.83 (K2O to elemental K conversion factor) = $2,730. 138 1,125 kg (remaining foregone N loss from erosion) X $2.37 (price of NPK fertilizer per kg) X 1/0.46 (% weight of N) = $6,380.

122
3.3.5 Policies and incentives for promoting Ngitili in production landscapes
Ngitili provides considerable ecological and economic values, mostly contributing to the informal subsistence sector, not featuring in formal estimates. By bringing together information (though scarce139) supplemented by models, this analysis takes forward the previous assessments of Ngitili values especially by testing alternative landuse options and the implication of this for ecosystem service values and for REDD+. Currently Ngitili provisioning services are valued at about $1250 totalling about $1.6 billion across all districts considered in this study. Soil nutrient stock values are only slightly higher than those in the alternative maize-grazing rotation system and in general, the soil erosion threat is quite low and not significantly different between systems. Ngitili however has considerably higher above ground carbon and biodiversity values compared to maize-grazing alternative. The biodiversity value could not be valued in monetary terms, but the carbon value is almost double that found in the maize-grazing alternative. The scenario of converting Ngitili to maize has low impact on soil erosion and nutrient stocks, but substantial loss in above-ground carbon stock with the value of this loss estimated at about $1.6 billion for all the districts considered in this study. Conversely, increasing Ngitili tree stocking and coverage in the area has potential to enhance above-ground carbon stock values by up to $8.9 billion. These values are, however, currently not realised because lack of development of a carbon market, but they represent an asset that could be explored for REDD+ payments. In addition, considerable biodiversity and provisioning values could potentially accrue from expansion of the system. This scenario could yield even more benefits if the ongoing practice of dairy cows with fodder shrubs (TARDT, 2000) is expanded by enriching Ngitili with fodder shrubs and promoting dairy cows. Species tested, which could fit within the rainfall range of Ngitili (600-1200 mm/y) include Chamaecytisus palmensis, Sesbania sesban and Gliricidia sepium (Wambugu et al.2011) and Leucaena collinsi. Leucaena collinsi gives an average fodder yield of 3.0 t/ha. When cattle are fed 3kg of leaucaena as a protein source would have an equivalent effect as using the cottonseed meal resulting in improved milk production by about 4 –5 litres per day over the control based on basal diet plus maize bran only as the supplement. Improved milk production results in income generation and improved family nutrition. The manure quality from the cows fed the legume supplements also improves (Chakeredza et al. 2007). Nitrogen fixing trees can also be used to restore degraded land.
A REDD+ initiative could offer additional incentives to restore and reinstate traditional management of the Ngitilis as illustrated by the example of the NGO TaTEDO. The project obtained funding to develop a local institutional framework that would allow Ngitili owners to benefit from REDD+, either through the voluntary market or through a national REDD+ fund (Dwi Putri and Kweka 2014). TaTEDO planned to accomplish this by formalizing Ngitilis into legal entities, and by aggregating Ngitili owners into functional groups to facilitate carbon marketing. While the proponents did start developing a proposal design document to sell credits through the VCS, that process had not been finalized as of 2014 due to its high cost. This is related to the difficulty of acquiring the technical skills and spatial data required to calculate a reference level and project emissions reductions. The required technical capacity is hard to find locally and costly to source from outside Tanzania (Dwi Putri and Kweka, 2014).
139 It should be noted that data used in analyses here are highly uncertain, sometimes coming from localised surveysnot distributed over the whole region or from other locations, which introduces errors

123
Moving forward, there is a large and untapped potential for integrating products sourced from Ngitili into the formal economy, especially for both honey and charcoal. The World Bank notes that the value of the charcoal sector has been conservatively estimated at approximately $500 million per annum, with the foregone revenues from fees and levies that have escaped the legal charcoal supply chain amounting to almost $100 million (World Bank 2009). By reducing the licensing fees for legal charcoal production, the Government can ensure better transparency in the sector and improve its revenue collection, which can then be used to enhance forest protection efforts (World Bank 2009). The funds could also potentially be used to promote additional private Ngitili and/or rotational woodlots, as well as improving biomass energy efficiency from both the supply and demand side by incentivizing improved cook stoves and more efficient charcoal kilns. However, given the global benefits derived from enhancing carbon stocks in dryland forests and Ngitili, supplementary financing through a market or fund-based REDD+ mechanism or other donor funds from the international community will also be necessary. Additional value could be added to Ngitili exclosures through the planting and management of valuable timber and fruit trees (Barrow and Mlenge 2003). A multi-sectorial approach could be adopted, building from policies such as the 2001 Agricultural Sector Development Strategy (ASDS) and the 2006 National Livestock Policy. The Ngitili system has been undermined by expanding demands for pasture, fuelwood and land for agriculture, consequences of the rapid growth rates of human and livestock populations (Dwi Putri and Kweka, 2014). Ensuring protection and restoration of the Ngitili system will require provision of alternative energy sources and promotion of fuel saving stoves. The adoption of the latter however has been slow (World Agroforestry Centre 2010) and the underlying cause of this needs to be investigated. With Ngitili acquiring greater value, there is greater competition for ownership of them (Barrow and Shah 2011). The poorest have tended to deal with occasional shocks by selling off their farm-land to wealthier people who convert it to private forest. The balance between land put under private Ngitilis and that set aside for communal Ngitilis has also shifted in the direction of the former, so the landless are losing access to communal Ngitili products as well as to their own land. In order to protect Ngitili system and access to Ngitili, there should be improved tenure and improved legal recourse for the poorest.
124
4. CONCLUSION
This analysis set out to quantitatively demonstrate the potential for agroforestry to deliver provisioning and regulating ecosystem services that are relevant in the context of REDD+ in Africa; to quantify the changes in these ecosystem services using scenario analysis; and to recommend incentives approaches for promoting agroforestry in lived-in landscapes that contribute to achievement of REDD+. In all the three systems analysed, there is scope to increase ecosystem service benefits to rural farmers and national economies by increasing the tree component and expanding the coverage of agroforestry systems although this requires substantial investment. However, most of the benefits delivered by agroforestry are externalised from formal market systems and do not translate into tangible gains at the farm of national level. In addition, agroforestry entails biophysical trade-offs exacerbated by policy related disincentives associated with restrictions on land and tree tenure, insufficient extension support for increasing productivity and profitability from tree products. The three case studies analysed showed potential for agroforestry to generate carbon, which can be part of REDD+ and also as a strategy for supplying co-benefits and wood fuel alternatives. This is summarized below. Coffee agroforestry Coffee agroforestry in Ethiopia stores carbon stocks ranging from 49 to 150 t/ha with an overall monetary value ranging from $865 million to $5.3 billion over the current total area coverage (depending on carbon price used). The system produces provisioning services including coffee yield, food fuelwood and non-timber forest products (NTFP) worth an annual per hectare value of $1,100-2,400, compared to production in the alternative maize systems, which has a value of only $450/ha/y. The agroforestry system also provides regulating ecosystem services including soil fertility enhancement, pollination, biodiversity, soil erosion control, enhancement of water quality and water flows. The overall net present value (NPV) of baseline coffee agroforestry comes to $2,700-30,300/ha compared to only $900/ha-$3000 in maize systems. Converting coffe to maize would result in overall marginal increase in maize, worth about $90 million a year. However, this entails loss of $115 million worth of coffee production, as well as $2.7 million and $10 million worth of wood fuel and honey production, totalling approximately $38 million of foregone provisioning services. In addition, it leads to regulating services losses due to decreased water yield, loss in carbon stocks, increased soil erosion and runoff. Conversely, increasing canopy cover in coffee agroforestry systems would not affect provisioning services significantly compared to the baseline, yet it can potentially generate regulating service gains in terms of increased carbon stocks, increased water yield and reduces soil erosion and runoff. If such a system is expanded (scenario 3), would increase the gains in regulating services even more while generating a net increase in provisioning services too. Overall, there are substantial potential benefits in increasing tree cover in coffee agroforestry systems.
125
Cocoa agroforestry
Cocoa agroforestry in Ghana stores carbon stocks of about 23.4 million tonnes over the current total area coverage, worth about $565 million. However, the value of provisioning services including cocoa yield, food fuelwood and NTFP from shaded cocoa systems comes to an annual per hectare value of only $2,300/ha compared to the full sun option worth about $3100/ha and the high input (‘high-tech’) option worth $6400/ha. The overall NPV of baseline cocoa agroforestry comes to $600/ha, compared to over $4,100/ha in the full sun system and $14,000/ha in the high tech system. The shade cocoa systems also provide regulating ecosystem services including soil fertility enhancement, pollination, biodiversity, enhancement of water quality and water flows. Water quality is potentially quite high in cocoa agroforestry systems due to the high tree cover, although effects from pollution from agrochemical inputs were not considered in the model used.
Conversion of cocoa agroforestry to full sun leads to 10,300 tonnes increase in cocoa production and gains in water yield, but causes carbon stock losses. Conversely, increasing tree cover in cocoa agroforestry leads to carbon stock gains, but with losses in cocoa and water yield. Intensification of moderate and heavy shade systems using maximum recommended agro-input levels results in overall increase in value of the system, but agroforestry systems have a lower value than full sun.
Ngitili
Ngitili systems in Tanzania deliver provisioning services including charcoal, non-timber forest products, honey, medicines, wild foods and bush meat, wood fuel, timber and poles and fodder and thatch grass worth a total of $1.6 billion over the current total area coverage, although these are mostly are consumptive values, rather than cash income values. In addition, the system stores carbon stocks of approximately 34.7 million tonnes, worth about $837 million. Assuming the area was covered with maize, this would deliver 5 million tonnes of maize, worth approximately $799 million per annum. Soil nutrient value is to an extent higher than that in maize systems although given the wide variability it could not be established whether the difference was significant. Other regulating ecosystem services from Ngitili include soil erosion control, enhancement of water quality and water flows. The overall NPV of baseline ngitili agroforestry comes to $5,000 - 16,000/ha. By contrast, maize has an NPV range of $ 750 - 2,000/ha.
Conversion to maize systems could result in a net gain from maize production and improved water yield. However, it would lead to loss in terms of decreased carbon stocks and increased soil erosion. Conversely, increasing tree cover would cause a gain in carbon stocks, but with loss in maize production and reduced in water yield.
Towards Agroforestry-Based REDD+ Policy Incentives
Given the potential for agroforestry systems to store and sequester larger amounts carbon than conventional agriculture, there is scope to include it as a means of ‘enhancing forest carbon stocks’ as well as generating co-benefits in terms of livelihoods for forest communities under REDD+ in the UN Framework Convention on Climate Change (UNFCCC). Therefore the scope for agroforestry inclusion in the REDD+ programs that various African countries are running needs to be explored. Technically agroforests and agroforestry can be stimulated through REDD+ incentives as direct targets REDD+ programs, or indirect as part of the necessary conditions for success. Whether or not it can be a core element of REDD+ depends on the country’s forest definition.
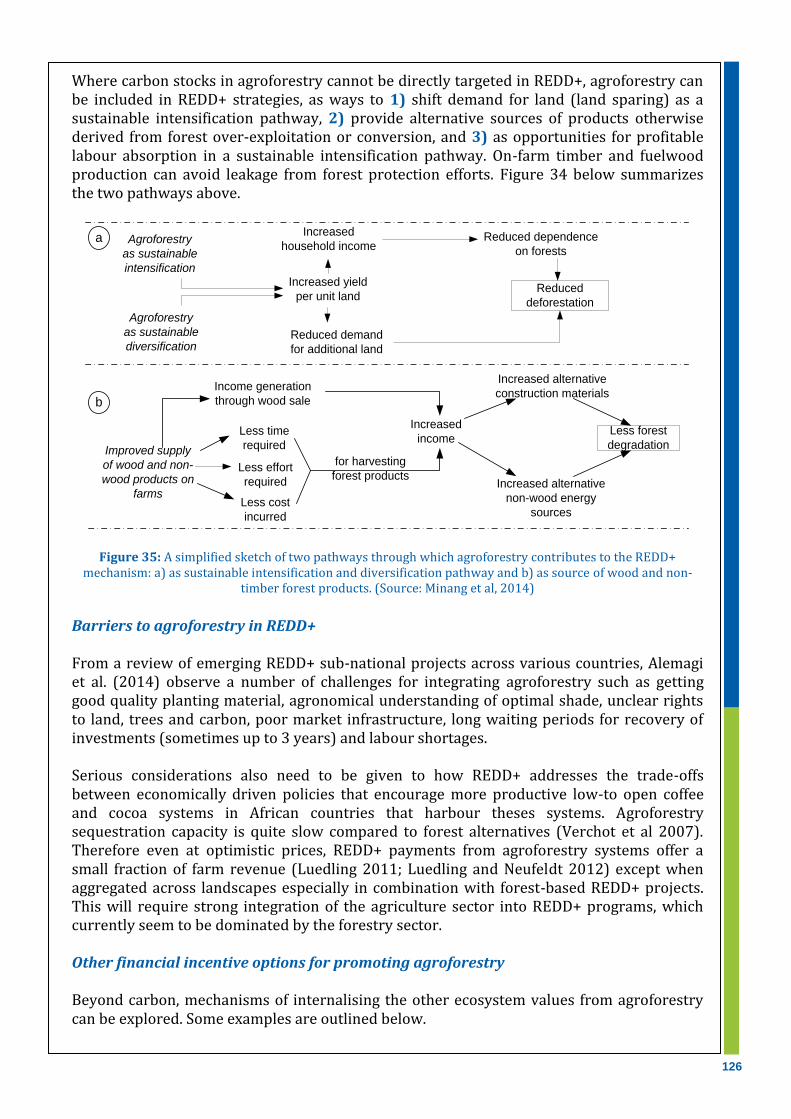
126
Where carbon stocks in agroforestry cannot be directly targeted in REDD+, agroforestry can be included in REDD+ strategies, as ways to 1) shift demand for land (land sparing) as a sustainable intensification pathway, 2) provide alternative sources of products otherwise derived from forest over-exploitation or conversion, and 3) as opportunities for profitable labour absorption in a sustainable intensification pathway. On-farm timber and fuelwood production can avoid leakage from forest protection efforts. Figure 34 below summarizes the two pathways above.
Figure 35: A simplified sketch of two pathways through which agroforestry contributes to the REDD+ mechanism: a) as sustainable intensification and diversification pathway and b) as source of wood and non-
timber forest products. (Source: Minang et al, 2014)
Barriers to agroforestry in REDD+ From a review of emerging REDD+ sub-national projects across various countries, Alemagi et al. (2014) observe a number of challenges for integrating agroforestry such as getting good quality planting material, agronomical understanding of optimal shade, unclear rights to land, trees and carbon, poor market infrastructure, long waiting periods for recovery of investments (sometimes up to 3 years) and labour shortages. Serious considerations also need to be given to how REDD+ addresses the trade-offs between economically driven policies that encourage more productive low-to open coffee and cocoa systems in African countries that harbour theses systems. Agroforestry sequestration capacity is quite slow compared to forest alternatives (Verchot et al 2007). Therefore even at optimistic prices, REDD+ payments from agroforestry systems offer a small fraction of farm revenue (Luedling 2011; Luedling and Neufeldt 2012) except when aggregated across landscapes especially in combination with forest-based REDD+ projects. This will require strong integration of the agriculture sector into REDD+ programs, which currently seem to be dominated by the forestry sector. Other financial incentive options for promoting agroforestry Beyond carbon, mechanisms of internalising the other ecosystem values from agroforestry can be explored. Some examples are outlined below.
Agroforestry
as sustainable
intensificationIncreased yield
per unit land
Reduced demand
for additional land
Increased
household incomeReduced dependence
on forests
Improved supply
of wood and non-
wood products on
farms
Less time
required
Less effort
required
Less cost
incurred
for harvesting
forest products
Increased
income
Increased alternative
non-wood energy
sources
Increased alternative
construction materials
Less forest
degradation
Reduced
deforestation
a
b
Agroforestry
as sustainable
diversification
Income generation
through wood sale

127
Payments for ecosystem services Payments for ecosystem services have been piloted for water quality realted systems with some level of success in the Americas through raising of water tariffs from downstream users and channeling this to farmers in the uplands. In Africa, pilots by ICRAF (under the Propoor Rewards for Environmental Services in Africa – PRESA project), WWF and CARE in Kenya and Tanzania show that this approach is challenged mainly by policy barriers (Namirembe et al. 2013), and low coverage of downstream companies with capacity and willingness to pay. Water Funds, which are emerging in some countries, could create the necessary incentives if they can focus beyond supporting actions believed to be ‘good’ or ‘sustainable’ towards making direct linkage to and monitoring of ecosystem service improvements. It should be noted that the adoption of these schemes depends largely on the size of incentives they provide. For example, Sartorio and Blackman (2009) found that a financial incentive through a voluntary price support program for shade grown coffee in Mexico attracted only very few takers possibly because of subsidy provided was too small. Implementing PES is also challenging with regards to for example, assigning an appropriate value, determining who to pay etc. Certification Several certification schemes are already in operation such as the Rainforest Alliance, Organic, Bird Friendly, UTZ and Starbucks certification (Lentijo and Hostetler 2011), which offer scope for internalizing benefits shade tree systems provide. The Rainforest Alliance for example, requires farmers to shift towards shade systems with at least 70 shade trees/ha over a minimum of 12 species. A KPMG (2012) study showed that certification has potential to generate positive outcomes for smallholder cocoa farmers in Ghana and Cote d’Ivoire. However, the number of farmers benefiting from these schemes is low given the high upfront costs and difficulty in sustaining the required controls in certification. Profitability of these schemes requires a high premium price, subsidies on input prices, (Victor et al. 2010), a minimum land size of about 3 ha, access to transport infrastructure and membership in marketing groups (KPMG 2012). Certification schemes also entail risks such as prices slumping due to flooding of the market with certified products or change in consumer preferences or buying power (Giovanucci et al. 2008). Improving profitability of agroforestry provisioning services The trade-off between the shade tree effect and the commodity or livelihood value plays a key role in determining land use trends. The productivity and profitability of the main cash commodities can be enhanced by providing incentives conditional to keeping trees in the system, such as tax exemptions, input subsidies, additional extension or group formation support and sustainable intensification aimed at enhancing productivity and profitability not only of the main crops, but also of tree products such as timber and fruits. This, however, needs to be backed by a strong policy framework as the increased profitability from intensified systems could motivate conversion of forests. As such, intensification could be integrated with programs to reforest/afforest or assisted regeneration in a segregated structure.

128
Landscape level options Focus on landscape mechanisms, beyond just the farm field level provide scope for a combined package that seeks at the same time, to improve farm level profitability or well being and provide off-farm opportunities. Co-investment approaches could be financed through a combined fund contributed to by a collection of ES beneficiaries, governments and global development partners building on local assets in form of land, local knowledge and labour. The assessments and institutional structures already being developed under country REDD+ programs provide good platforms for co-investment in more ecosystem services beyond carbon. Options involving collective action of multiple institutions including government, private sector, communities and NGO players are needed where community level incentives such as schools, health centres, storage and processing structures are used to motivate landscape-level tree stocks through locally driven institutional processes.
POLICY OPTIONS GOING FORWARD:
INCLUDING AGROFORESTRY IN THE NATIONAL POLICY REDD+ FRAMEWORK
Minang et al, (2014) found that 40 of African countries involved in REDD+ mention agroforestry in the REDD strategy. Countries like Kenya, Ghana and Cameroon have three direct agroforestry based REDD+ strategic options/ activities to address the influence of agricultural expansion on deforestation and forest degradation. However, many countries do not have specific operationalization plan with options for every context. Cote D’Ivoire has just initiated a process for developing a plan for integrating agroforestry into the national REDD+ plan. This option could be considered by other countries. An enabling environment is needed for motivating shade tree planting and retention. Land and tree tenure need to be made more secure and road-blocks against marketing of tree products including timber and charcoal need to be replaced by provisions that work together with key stakeholder who are mostly the rural youth, to prevent over-exploitation. Ecosystem protection approaches are also still crucial especially for biodiversity for ensuring continuity of those ecosystem service values for which no direct market or use has been identified or developed. Agroforestry tends to be practiced by older generations in rural and financially poor settings, and may not fit the current urbanization trends and aspirations of a ballooning youth population aspiring for a lifestyle beyond just subsistence. Promotion efforts need to be supplemented with extension services and supporting of rural institutions for joint learning and marketing (Assah et al. 2011; Oluyede et al. 2011), and supporting enterprise development. Finally, where studies could be used to compare agroforestry to forests, there is potential for agroforestry to provide a middle ground where livelihood and income enhancements are achieved at reduced ecological trade-offs. As such, agroforestry, in addition to providing potential areas for REDD+, can also contribute to the shift towards a Green Economy, provided tree provisioning values in the informal sector are better captured in formal decisions.
129
Data limitations in this study for Future considerations in assessing agroforestry values In order to provide a more complete assessment of the potential of agroforestry systems to deliver carbon and multiple benefits under REDD+ the following data gaps would need to be addressed:
Inconsistency in definitions of agroforestry systems and criteria used to classify them.
Lack of spatial data on agroforestry systems leading to difficulties in using remote sensing data for analysis and modelling. Addressing the spatial data gap would allow for the use of the higher resolution remote sensing data that is becoming available as well as newer techniques such as LIDAR based measurements, which provide opportunities for better assessment and modelling of ecosystem services in agroforestry landscapes.
Due to the heterogeneity in agroforestry, there are large variations in ecosystem
services values. Therefore, there is a need for local scale assessments using ground based measurements. Efforts for on the ground or expert-opinion based mapping of these systems would help support more accurate scenario modelling.
The lack of established relationships between biophysical and ecological data used or
produced by models such as, for example, the relationship between above ground carbon stocks and canopy cover.
Key regulating services such as pollination, pest control, soil improvements and
biodiversity could not be quantified or valued, which means the estimates made in this study are much lower than the true of agroforestry systems. Bringing together data generated in different contexts and at different scales also introduced error in the estimates made
Areas for further research Through the literature review, we were able to identify significant differences between agroforestry and non-agroforestry systems in terms of provisioning services, as well as carbon stocks and biodiversity/habitat values. However, in terms of other regulating services, the evidence base is inconclusive at best. Moreover, much more work is done to understand the impacts of the agroforestry and non-agroforestry systems in terms of full cost-accounting for both positive and negative externalities. Some pressing areas for future research include:
• Highlighting tradeoffs between food security, monetary & resilience values - there have been several studies highlighting the linkages between regulating and biodiversity services on the one hand, and socio-ecological resilience and food security on the other (eg. Poppy et al. 2014; Mohamed-Katerere and Smith 2012), with some authors urging that “environmental concerns should no longer be treated as secondary to productivity priorities, if vulnerability is to be reduced and long-term (food) security achieve assured. The idea that there is inevitably a trade-off between agricultural production and productivity and maintaining the environment is now dated… There is no choice but to do both” (Mohamed-Katerere and Smith 2012). While we welcome this reframing and recognition that food production and the broader environment are part of an integrated system, placing too heavy an emphasis

130
on precautionary approaches and multifunctional systems carries a potential opportunity cost in terms of foregone income for smallholders who are, in many cases, already quite poor and whose livelihoods are precarious. Consequently, more research is required to investigate tradeoffs and optimization between income from productivity gains and the additional potential for capital investment (including financial, human and manufactured capital) that it creates, relative to the need for preserving, enhancing and restoring regulating and biodiversity services in agroecosystem.
• Further quantification & valuation of regulating & habitat/biodiversity services – in particular, some of the promising regulating services for further in-depth study within the case study countries include pollination, biological pest control, erosion control, water infiltration, nutrient cycling and soil fertility services. Out of the biodiversity services examined, only Hein and Gatzweiler (2006) attempt any form of economic valuation. Given the high biodiversity values of rainforest in the Western region Ghana and for the Afromontane forests of Ethiopia, as well as the ‘bird-friendly’ status of shade cocoa and coffee in these countries, studies assessing the option and existence values of on and off-farm biodiversity for smallholders, as well as at the national and international level, would be of particular policy relevance.
• Adopting appropriate comparators - too few studies examined multiple agroforestry and non-agroforestry land-uses simultaneously, and as such we were forced to draw eclectically from several studies which either featured no comparators, or which featured secondary forests as comparators, etc. Studies which assess comparator systems within the same landscape have significantly less risk of biased ecosystem service estimates.
• Spatially explicit and landscape approach – such an approach which implicitly accounts for downstream costs and benefits of eg. soil erosion, enhanced water provisioning, etc. can inform the design of watershed level payment for ecosystem service schemes.
• Assessing impacts on casual labourers – Cocoa and coffee farming often relies on significant quantities of casual labourers, whom are amongst the mmost vulnerable members of rural populations (eg. Cramer 2014). As such, if the promise of multifunctional agroecosystems to satisfy poverty alleviation and food security objectives is to be fulfilled, it is critical that potential positive and negative impacts on casual labourers are assessed as well.
• Analysing trade-offs and synergies among services – like much of the ecosystem services literature (eg. Howe 2014), only a handful of our studies examined such tradeoffs and synergies, which challenges robust assessment of good practices.
• Time-series data – with the exception of the cocoa yield regression analyses, all of our retained studies were static in nature. None of them examined services or changes thereof over time.
• Assessing C stocks at greater soil depths (eg. 30-50 cm) – The vast majority of studies estimate soil carbon stocks at 0-20 cm or at most 0-30 cm depths. Given that agroforestry systems are typically deep-rooted, neglecting the measurement or estimation of soil carbon stocks at greater depths has the potential to underestimate the additional carbon stocks from agroforestry systems.
131
REFERENCES Abebe, T. 2005. Diversity in homegarden agroforestry systems of Southern Ethiopia. PhD
thesis Wageningen University, Wageningen. Acheampong, E., Dawoe, E., Bosu, P., Asante, W. (2014). Moving Forward with REDD+ in
Ghana: Shade Systems, Crown Cover, Carbon Stocks and Socio-Economic Dynamics of Smallholder Cocoa Agroforestry Systems. REAP.
Adhikari, B., Nadella, K. 2011. Ecological economics of soil erosion: a review of the current state of knowledge. Annals of the New York Academy of Sciences 1219: 134-152.
Adjaloo M. K., A. A. Ankomah, K. Yeboah-Gyan, B. M. Dzomeku. (2013). Nectar production dynamics in two melliferous plant species. American Journal of Plant Sciences 4: 203-210.
Aerts, R., Hundera, K., Berecha, G., Gijbels, P., Baeten, M., Van Mechelen, M., ... & Honnay, O. (2011). Semi-forest coffee cultivation and the conservation of Ethiopian Afromontane rainforest fragments. Forest Ecology and Management, 261(6), 1034-1041.
Afari-Sefa, V., J. Gockowski, N. Agyemnan, and A. Dziwornu. Econoimc cost–benefit of certified sustainable cocoa production in Ghana. Poster presented at the Joint 3rd African Association of Agricultural Economists (AAAE) and 48th Agricultural Economists Association of South Africa (AEASA) Conference, Cape Town, South Africa, 19–23 Sept. 2010.
Agrisystems Ltd, 2001. Coffee Support Project, Ethiopia. Revised Draft Formulation Report for the European Commission. April 2001.
Ahenkorah, Y., et al., 1987. Twenty years’ results from a shade and fertiliser trial on Amazon cocoa (Theoborma cocoa) in Ghana. Experimental agriculture, 23 (1), 31–39. Edited by Lupton, F.G., Cambridge University Press, Cambridge
Alain Albrecht, , Serigne T Kandji. (2003). Carbon sequestration in tropical agroforestry systems. Agriculture, Ecosystems & Environment 99. 1–3: 15–27
Albrecht, M., Bernhard Schmid, Yann Hautier, Christine B. Müller: Diverse pollinator communities enhance plant reproductive success. (2012). Proceedings of the Royal Society B 279: 4845–4852
Alemagi D., L. Duguma, P.A. Minang, F. Nkeumoe, M. Feudjio and Z. Tchoundjeu. (2015). Intensification of cocoa agroforestry systems as a REDD+ strategy in Cameroon: hurdles, motivations, and challenges, International Journal of Agricultural Sustainability, 13.3.
Amanor, K.S. (1996). Managing trees in the farming system: the perspective of farmers. Forest farming series No. 1, Forestry Department, Ghana. 202 pp
Amanor, K. S. (2005). Equity in forest benefit sharing and poverty alleviation. In Nketiah, Ameyaw, Owusu (eds), Equity in Forest Benefit Sharing: Stakeholders’ Views. Tropenbos International— Ghana, Workshop proceedings 3, 15–23.
Anglaaere L.C.N., Cobbina J., Sinclair F.L. McDonald M.A. (2011). The effect of land use systems on tree diversity: farmer preference and species composition of cocoa-based agroecosystems in Ghana. Agroforest Syst (2011) 81:249–265. DOI 10.1007/s10457-010-9366-z
Anthonio D. C. and Aikins E. D. (2009) Reforming Ghana ́s cocoa sector - an evaluation of private participation in marketing. Luleå University of Technology, Master Thesis, Continuation Courses Marketing and e-commerce Department of Business Administration and Social Sciences Division of Industrial marketing and e-commerce.
Appiah, M. R. (2004). Impact of Cocoa Research Innovations on Poverty Alleviation in Ghana. Accra Printing Division, CSIR-INSTI.

132
Asaah E.K., Tchoundjeu Z., Leakey R.R.B., Takousting B., Njong J.& Edang I. 2011. Trees, agroforestry and multifunctional agriculture in Cameroon. International Journal of Agricultural Sustainability 9.1: 110-119.
Asante-Poku A., Angelucci F., 2013. Analysis of incentives and disincentives for cocoa in Ghana. Technical notes series, MAFAP. Rome: FAO.
Asare, R. (2005). Cocoa agroforestry in West Africa: a look at activies on preferred trees in
the farming systems. (pp. 1-77). Hørsholm: Center for Skov, Landskab og Planlægning/Københavns Universitet.
Asare R. 2004 Agroforestry initiatives in Ghana: a look at research and development. A presentation made at the World Cocoa Foundation conference in Brussels April 21 –22, 2004 http://www.worldagroforestrycentre.org/treesandmarkets/inaforesta/documents/agrof_cons_biodiv/Ghana_RandD.pdf
Asare R. Afari-Sefa V., Osei-Owusu Y. and Pabi O. 2014. Cocoa agroforestry for increasing forest connectivity in a fragmented landscape in Ghana. Agroforest Syst. DOI 10.1007/s10457-014-9688-3
Asare, R.A. 2010. Implications of the Legal and Policy Framework for Tree and Forest Carbon in Ghana: REDD Opportunities Scoping Exercise. Forest Trends: Washington, DC. http://www.forest-trends.org/~foresttr/publication_details.php?publicationID=2452
Asase A., Wade S. A. , Ofori-Frimpong K., Hadley P. , Norris K. 2008. Carbon storage and the health of cocoa agroforestry ecosystems in south-eastern Ghana..In Africa and the Carbon Cycle Proceedings of the Open Science Conference on “Africa and Carbon Cycle: the CarboAfrica project” Accra (Ghana) 25-27 November 2008, 131-143. Edited by Bombelli A. and Valentini R., Food and Agricultural Organization, Rome.
Asase A., and Tetteh D.A. 2010. The role of complex agroforestry systems in the conservation of forest tree diversity and structure in southeastern Ghana. Agroforest Systems (2010) 79:355–368. DOI 10.1007/s10457-010-9311-1
Ávalos-Sartorio B. and Blackman A. 2009. Agroforestry Price Supports as a Conservation Tool: Mexican Shade Coffee. Environment for Development. Discussion Paper Series. EfD DP 08-36-REV. http://www.efdinitiative.org/sites/default/files/efd-dp-08-36-rev.pdf
Ayele Y., Dr. Zeleke Ewnetu, Dr. Zebene Asfaw: Economic Evaluation of Coffee-Enset-Based Agroforestry Practice in Yirgachefe Woreda, Ethiopia: Comparative Analysis with Parkland Agroforestry Practice. Journal of Economics and Sustainable Development 5.27: 72-81.
Ayenew, B., A. Belay, Y. Tesfay. Economic Value of Wondo Genet Catchment Forest in Domestic. Water Supply Services. Journal of Economics and Sustainable Development 6.9: 213-221.
Barbier, E.B., 2007. Valuing ecosystem services as productive inputs. Economic Policy 22, 177–229.
Barrow E. and Shah A. 2011. Restoring Woodlands, Sequestering Carbon and Benefiting Livelihoods in Shinyanga,Tanzania. Geneva: The United Nations Economics of Ecosystems and Biodiversity Initiative.
Barrow, E., and W. Mlenge (2003). Trees as Key to Pastoralist Risk Management in Semi-Arid Landscapes in Shinyanga, Tanzania, and Turkana, Kenya. Paper presented at International Conference on Rural Livelihoods, Forest and Biodiversity 19-23 May 2003, Bonn, Germany. Bonn: Centre for International Forestry Research.
Bedimo, J. A. M., I. Njiayouom, D. Bieysse, M. Ndoumbè Nkeng, C. Cilas, and J. L. Nottéghem. (2008) Effect of Shade on Arabica Coffee Berry Disease Development: Toward an
133
Agroforestry System to Reduce Disease Impact. Ecology and Epidemiology 98.12: 1320-1325.
Beer J., Muschler, R., Kass, D. and Somarriba, E. (1998). Shade management in coffee and cacao plantations. Agroforestry Systems 38: 139–164.
Beer J. (1988). Litter production and nutrient cycling in coffee (Coffea arabica) or cacao (Theobroma cacao) plantations with shade trees. Agroforestry Systems 7.2: 103-114
Belachew O., I. Z..Muhammad 2015. Perception of Climate Change and Livelihood of a Farming Community of Maruf Kebele, Central Oromia, Ethiopia. American Journal of Climate Change 4: 269-281.
Bennett, M. D. Giovannucci, C. Rue, H. Ayerakwa, A. Agyei-Holmes. (2013). Cocoa Farms in Ghana: An Evaluation of the Impact of UTZ Certification on the Sustainability of Smallholders Supported by the Solidaridad Cocoa Programme (2010-2012). Amsterdam: UTZ.
Berecha G., Aerts R., Vandepitte K., Van Glabeke S., Muys B., Roldan-Ruiz I. and Honnay O. 2014. Effects of forest management on mating patterns, pollen flow and intergenerational transfer of genetic diversity in wild Arabica coffee (Coffea Arabica L.) from Afromontane rainforests. Biological Journal of the Linnean Society 112: 78-88.
Bishop, J. 1995. The Economics of Soil Degradation: an illustration of the change in productivity approach to valuation in Mali and Malawi. LEEC Paper DP 95-02. International Institute for Environment and Development. London
Bishop, J. and Allen, J. 1989. The on-site costs of soil erosion in Mali. Environment working paper #21, Environmental Department, Washington :World Bank.
Bisseleua DHB, Yede FD, Missoup AD, Vidal S 2013. Shade Tree Diversity, Cocoa Pest Damage, Yield Compensating Inputs and Farmers’ Net Returns in West Africa. PLOS ONE. 8.3. 9pp.
Bisseleau, D.H.B., A.D. Missoup and S. Vidal. 2009. Biodiversity Conservation, Ecosystem Functioning, and Economic Incentives under Cocoa Agroforestry Intensification. Conservation Biology 23.5: 1176–1184
Bisseleua DHB, and Vidal S. (2008). Plant biodiversity and vegetation structure in traditional cocoa forest gardens in southern Cameroon under different management. Biodiversity Conservation 17:1821–1835.
Boadu, F. O. (1992). Contingent valuation for household water in rural Ghana. Journal of Agricultural Economics 43.3: 458–465.
Bockstael, N.E., A.M. Freeman, R.J. Kopp, et al. 2000. On measuring economic values for nature. Environ. Sci. Technol. 34: 1384–1389.
Bogale, A. and B. Urgessa. (2012) Households’ Willingness to Pay for Improved Rural Water Service Provision: Application of Contingent Valuation Method in Eastern Ethiopia. Journal of Human Ecology 38.2: 145-154.
Boni, S. (2006). Ghanaian Farmers’ Lukewarm Reforestation: Environmental Degradation, The Timber Option and Ambiguous Legislation. Contributed Paper to the International Conference “At the Frontier of Land Issues”, IRD, Montpellier.
Bos et al. 2007. Caveats to quantifying ecosystem services: fruit abortion blurs benefits from crop pollination. Ecological Applications 17.6: 1841–1849.
Brander, L.M., Beukering van, P. and Cesar, H.S.J. 2007. The recreational value of coral reefs: a meta-analysis. Ecological Economics 63: 209–218.
Brander, L.M., Florax, J.G.M., Vermaat, J.E., 2006. The empirics of wetland valuation: a comprehensive summary and meta-analysis of the literature. Environmental and Resource Economics 33, 223–250. Brander, L.M., Van Beukering, P.J.H., Cesar, H.S.J., 2007. The recreational value of coral reefs: a meta-analysis. Ecological Economics 63, 209–218.

134
Brittain, C., N. Williams, C. Kremen and A.M. Klein.(2013). Synergistic effects of non-Apis bees and honey bees for pollination services. Proceedings of the Royal Society B 280.1754: 1-7.
Buechley, E.R., Çag˘an H. Sekerciog˘lu, Anagaw Atickem, Gelaye Gebremichael, James Kuria Ndungu, Bruktawit Abdu Mahamued, Tifases Beyene, Tariku Mekonnen, Luc Lens. (2015). Importance of Ethiopian shade coffee farms for forest bird conservation. Biological Conservation 188..
Burgess, B.B., T. Clairs, F. Danielsen, S. Dalsgaard, M. Funder, N. Hagelberg, P. Harrison, C. Haule, K. Kabalimu, F. Kilahama, E. Kilawe, S.L. Lewis, J.C. Lovett, G. Lyatuu, A.R . Marshall, C. Meshack, L. Miles, S.A.H. Milledge, P.K.T. Munishi, E. Nashanda, D. Shirima, R.D. Swetnam, S. Willcock, A. Williams and E. Zahabu. (2010). Getting ready for REDD+ in Tanzania: a case study of progress and challenges Oryx 44: 339–351.
Carsan S., Stroebel A, Dawson I, Kindt R, Swanepoel F and Jamnadass R 2013. Implications of shifts in coffee production on tree species richness, composition and structure on small farms around Mount Kenya. Biodiversity Conservation 22:2919–2936.
Central Statistical Agency. 2013. Agricultural Sample Survey 2012/2013 (2005 E.C.), Report on area and production of major crops. Central Statistical Agency, Addis Ababa.
Central Statistics Agency of Ethiopia (CSA), Ministry of Finance and Economic Development and the World Bank. Living Standards Measurement Study Integrated Surveys of Agriculture (LSMS-ISA): Ethiopia-Socio Economic Survey 2013-2014. Addis Ababa and Washington: Central Statistical Agency, Ministry of Finance, and Economic Development and the World Bank.
Chakeredza S., Hove L., Akinnifesi F.K., Franzel S., Oluyede C. A. and Sileshi G. (2007). Managing fodder trees as a solution to human–livestock food conflicts and their contribution to income generation for smallholder farmers in southern Africa. Natural Resources Forum 31: 286–296
Charveriat C. 2001. Bitter Coffee: How the Poor are paying for the Slump in Coffee Prices. Cheng, S., Y. Hiwatashi, H. Imai, M. Naito, and T. Numata. (1998) Deforestation and
Degradation of Natural Resources in Ethiopia: Forest Management Implications from a Case Study in the Belete-Gera Forest. Journal of Forestry Research 3:199-204.
Chidumayo, E.N., Gambiza, J., and Grundy, I. 1996. Managing miombo woodlands. Pp175-193. In Campbell, B. (Ed). Miombo in transition: woodlands and welfare in Africa. Bogor: Centre for Intenrational Forestry Rresearch, 266pp.
Classen A., M.K. Peters, S.W. Ferger, M.H. Bonitz, J.M. Schmack, G. Maassen, M. Schleuning, E.K.V. Kalko, K. Bohning-Gaese, and I. Steffan-Dewenter. (2014). Complementary ecosystem services provided by pest predators and pollinators increase quantity and quality of coffee yields. Proceedings of the. Royal Society B 28.1 : 20133148.
Coffee annual report 2013. Ethiopia coffee annual report 5/14/2013. Gain Report ET-1302. Gray, Q, A. Tefera and T. Tefera. Washington: Global Agricultural Information Network.
Costanza, R,, R. de Groot, P. Sutton,, S. van der Ploeg, S.J. Anderson, I. Kubiszewski, S. Farber, R. Kerry Turner. (2014). Changes in the global value of ecosystem services. Global Environmental Change 26:152–158
Costanza, R., d’Arge, R., De Groot, R.S., Farber, S., Grasso, M., Hannon, B., Limburg, K., Naeem, S., O’Neill, R.V., Paruel, J., Raskin, R.G., Sutton, P., Van den Belt, M., 1997. The value of the world’s ecosystem service and natural capital. Nature 387, 253–260.
Cotula L., Vermeulen, S., Leonard, R. and Keeley, J., 2009. Land grab or development opportunity? Agricultural investment and international land deals in Africa, IIED/FAO/IFAD, London/Rome. ISBN: 978-1-84369-741-1
Crewett, W., A. Bogale, and B. Korf. 2008. Land Tenure in Ethiopia: Continuity and Change, Shifting Rulers, and the Quest for State Control. CAPRi Working Paper 91. International Food Policy Research Institute: Washington, DC. http://dx.doi.org/10.2499/CAPRiWP91

135
Dahlberg G. 2011. Ethiopian Coffee and Fair Trade-An empirical study, Bachelor Thesis 15 ECTS. School of Business and Economics, Gothenburg University
Damnyag, L., Saastamoinen, O., Appiah, M., & Pappinen, A. (2012). Role of tenure insecurity in deforestation in Ghana's high forest zone. Forest Policy and Economics, 14(1), 90-98.
Davis AP, Gole TW, Baena S, Moat J (2012) The Impact of Climate Change on Indigenous Arabica Coffee (Coffea arabica): Predicting Future Trends and Identifying Priorities. PLoS ONE 7(11): e47981. doi:10.1371/journal.pone.0047981
Dawoe E. K. & Marney E. Isaac & James Quashie-Sam (2010): Litterfall and litter nutrient dynamics under cocoa ecosystems in lowland humid Ghana. Plant Soil (2010) 330:55–64. DOI 10.1007/s11104-009-0173-0
K.E. Dawoe, J. Quashie-Sam, K.S. Opong: Effect of land-use conversion from forest to cocoa agroforest on soil characteristics and quality of a Ferric Lixisol in lowland humid Ghana. Plant Soil 330: 55–64.
De Beenhouwer, M., Aerts R., Honnay, O. 2014. A global meta-analysis of the biodiversity and ecosystem service benefits of coffee and cacao agroforestry. Agriculture, Ecosystems & Environment. 175: 1-7.
De Groot, Rudolf, Luke Brander, Sandervander Ploeg, RobertCostanza, Florence Bernard, Leon
Braat, Mike Christie, Neville Crossman, Andrea Ghermandi, Lars Hein, Salman Hussain, Pushpam Kumar, Alistair McVittie, Rosimeiry Portela, Luis.Rodriguez, Patrickten Brink,
Pieter van Beukering. 2012. Global estimates of the value of ecosystems and their services in
monetary units Ecosystem Services 1 (2012) 50–61. Denich M. and Gatzweiler F. In situ Conservation and Use of the Wild Populations of Coffea
arabica in the Montane Rainforests of Ethiopia. Bonn: Centre for Development Research. Accessible at: http://asic-cafe.org/system/files/B217_2006.pdf
DE ROSAYRO R.A. Diversification forestry in coffee-producing countries. http://www.fao.org/docrep/76067e/76067e03.htm
Diao X. and Sarpong D.B. 2007. Cost Implications Of Agricultural Land Degradation In Ghana. An Economy wide, Multimarket Model Assessment. The Ghana Strategy Support Program Background Paper 3. Accra: International Food Policy Research Institute.
COCOA FARMING AND BIODIVERSITY IN GHANA: EarthWatch Institute Annual Report 2007 Ebisa, L. (2014) . Effect of Dominant Shade Trees on Coffee Production in Manasibu District,
West Oromia, Ethiopia. Science, Technology and Arts Research Journal 3..3: 18-22. Economic Report on Africa 2013. Ethiopia case study. United Nations Economic Commission
of Africa. European Centre for Development Policy Management. 2015. Assessment of Policy Coherence
for Development for Food Security in Tanzania: Tanzania Food Security Profile. Brussels: European Centre for Development Policy Management and Economic and Social Research Foundation.
Emissions Reductions Programme (ERP) (2014) Ghana’s emission reduction programme for the cocoa forest mosaic landscape (cocoa forest REDD+ programme). Forestry Commission of Ghana.
Ethiopia Agricultural Growth Program. 2015. Ethiopian Coffee Exports to Hit Record in 2015. Accessed 27 April 2015. Accessible at: http://ethioagp.org/ethiopian-coffee-exports-to-hit-record-in-2015/.
Ethiopia's Climate Resilient Green Economy (CRGE) strategy to "achieve middle income status by 2025 with zero net emissions". 2011.http://www.fairclimatefund.nl/en/icco-en-fairtrade-max-havelaar-starten-fairtrade-carbon-partnership/

136
Food and Agricultural Organization of the United Nations. 2008. An introduction to the basic concepts of food security. Rome: Food and Agricultural Organization of the United Nations
FDRE, 2003b. Sustainable Development and Poverty Reduction Program Annual Progress Report (2002/2003). Addis Ababa: Federal Democratic Republic of Ethiopia, Ministry of Finance and Economic Development.
Fisher R.J. 2005. Poverty and Conservation: Landscapes People and Power. https://books.google.com/books?isbn=283170880X
Fisher, Brendan, Ian Bateman and R. Kerry Turner. 2011. Valuing Ecosystem Services: Benefits, Values, Space and Time. Ecosystem Services Economics (ESE) Working Paper Series. Department of Environmental Policy Implementation, United Nations Environment Program.
Forest Trends and Katoomba Group (2009) Sweetening the deal for shade-grown cocoa: a preliminary review of constraints and feasibility of ‘cocoa carbon’ in Ghana. pp 6
Forest Trends. 2013. Covering new ground: State of the forest carbon markets 2013. Washington, DC: Ecosystem Marketplace.
Financial Analysis of Agroforestry Practices Fodder shrubs in Kenya, woodlots in Tanzania, and improved fallows in Zambia. pp. 39-57 in Valuing Agroforestry Systems: Methods and Applications. Eds. J.R.R. Alavalapati, D.E. Mercer. Dordrecht: Springer Netherlands.
Fritz et. al. 2015. Mapping global cropland and field size. Global Change Biology 21.5: 1980–1992.
GAIN 2013 Abu Tefera and Teddy Tefera (co-authors) Quintin Gray; Coffee Annual Report, Gatzweiler, FW. (2005) Institutionalising Biodiversity Conservation - The Case of Ethiopian
Coffee Forests. Conservation and Society 3:201-23
Gebremariam, Gebrelibanos G., A. K. Edriss, A.M. Maganga, A.T. Terefe. (2013). Labor as a Payment Vehicle for Valuing Soil Conservation Practices in a Subsistence Economy: Case of Adwa Woreda in Ethiopia. American Journal of Economics 3.6: 283-290
Geyid et al., 2005 Microbial Inputs in Coffee (Coffee Arabica L) Production Systems, Southwestern Ethiopia Implications for Promotion of Biofertilizers and Biocontrol Agents Diriba Muleta Faculty of Natural Resources and Agricultural Sciences Department of Microbiology Uppsala
Ghana Child Labour Study report 2006 Gabriele Zdunnek (team leader), Dorothee Dinkelaker, Britt Kalla, Gertraud Matthias, Rebecca Szrama, Katrin Wenz: Centre for Advanced Training in Rural Development (SLE) on behalf the Food and Agriculture Organization of the United Nations (FAO) Child Labour and Children’s Economic Activities in Agriculture in Ghana
Giovannucci, D., P. Liu, and A. Byers. 2008. Adding value: certified coffee trade in North America. Pages 33–49 in P. Liu, editor. Value-adding standards in the North American food market–trade opportunities on certified products for developing countries. FAO, Rome.http://www.dgiovannucci.net/docs/Adding_Value-Certified_Coffee_Trade_in_North_America.pdf.
GLENDAY, J. (2006). Carbon storage and emissions offset potential in an east African tropical rainforest. Forest Ecology and Management 235:72-83.
Global Agricultural Information Network (GAIN) (2012). Cocoa Annual Report. Gockowski, J., Sonwa, D. 2011. Cocoa Intensification Scenarios and Their Predicted Impact on
CO2 Emissions, Biodiversity Conservation, and Rural Livelihoods in the Guinea Rain Forest of West Africa. Environmental Management 48: 307-321.
Gockowski, J., Afari-Sefa, V., Bruce D.B., Osei-Asare, Y., Agyemana, N.F. 2013. Improving the productivity and income of Ghanaian cocoa farmers while maintaining environmental

137
services: what role for certification? International Journal of Agricultural Sustainability 11.4: 331-346.
Gockowski, James. 2007. The Analysis of Policies, Productivity and Agricultural Transformation in the Cocoa-Producing Rural Economies of West Africa. Technical Report: Executive Summary.
Gockowski, J. and D. Sonwa. 2007. Biodiversity conservation and smallholder cocoa production systems in West Africa with particular reference to the Western Region of Ghana and the Bas Sassandra region of Côte d’Ivoire.
Gockowski, J., Sonwa, D. 2008. Biodiversity and smallholder cocoa production systems in West Africa. Sustainable Tree Crops Program Working Paper Series, International Institute of Tropical Agriculture.
Gockowski, J., Baker, D., Tonye, J., Weise, S., Ndoumbé, M., Tiki-Manga, T. & Fouaguégué (1998) characterization and diagnosis of farming systems in ASB Forest Margins Benchmark of southern Cameroon. Mimeograph. Yaoundé, IITA Humid Forest Ecoregional Center. 65pp
Gole, T.W., M. Denish, D. Teketay, and P.L. Vlek. 2000. Human impacts on the Coffea Arabica gene pool in Ethiopia and the need for its in situ conservation. In: J. Engels, V.R. Rao, A.H.D. Brown and M. Jackson (Eds), Managing plant diversity. Proceedings of an international conference, Kuala Lumpur; Malaysia, p. 237-247.
Aaron D. Gove, Kristoffer Hylander, Sileshi Nemomisa, & Anteneh Shimelis (2008). Ethiopia coffee cultivation-Implications for bird conservation and environmental certification. Conservation Letters 1:208–216 doi:10.1111/j.1755-263X.2008.00033.x
Groeneveld JH, Tscharntke T, Moser G, Clough Y (2010). Experimental evidence for stronger cacao yield limitation by pollination than by plant resources. Perspectives in Plant Ecology, Evolution and Systematics 12:183191.
Jens Hainmueller, Michael J. Hiscox, Maja Tampe (2011). Sustainable Development for Cocoa Farmers in Ghana. Baseline Survey: Preliminary Report, January 2011. Cambridge: MIT and Harvard University.
Haggar J, Barrios M, Bolaños M, Merlo M, Moraga P, Munguia R, Ponce A, Romero S, Soto G, Staver C & de M. F. Virginio E. 2011. Coffee agroecosystem performance under full sun, shade, conventional and organic management regimes in Central America. Agroforestry Systems 82(3):285-301.
Hammond, A,. W. Kramer,, J. Tran,, R. Katz., and C. Walker. 2007 The Next 4 Billion: Market Size and Business Strategy at the Base of the Pyramid. Washington: World Resources
Institute and International Finance Corporation. Hansen, M. C., R. S. DeFries, J. R. G. Townshend, M. Carroll, C. Dimiceli, and R. A. Sohlberg.
2003. Global percent tree cover at a spatial resolution of 500 meters: first results of the MODIS vegetation continuous fields algorithm. Earth Interactions 7:10.
Hansen, C. P., Lund, J. F., & Treue, T. (2009). Neither Fast, Nor Easy: The Prospect of Reduced
Emissions from Deforestation and Degradation (REDD) in Ghana. International Forestry Review, 11(4), 439-455.
Hartemink A.E. (2005). Nutrient Stocks, Nutrient Cycling, and Soil Changes in Cocoa Ecosystems: A Review. Advances in Agronomy 86: 227–253. doi:10.1016/S0065-2113(05)86005-5
Hein, Lars. Gatzweiler, F. (2006). The economic value of coffee (Coffea arabica) genetic resources. Ecological Economics 60: 176 – 185
Hertel, D., Harteveld, M. A., and Leuschner, C. (2009). Conversion of a Tropical Forest into Agroforest Alters the Fine Root-Related Carbon Flux to Soil. Soil Biology and Biochemistry 41: 481–490.

138
Holbech, L.H. (2009). The conservation importance of luxuriant tree plantations for lower storey forest birds in south-west Ghana. Bird Conservation International 19: 287-308.
Holling, C. S. (1973). Resilience and Stability of Ecological Systems. Annual Review of Ecology and Systematics 4: 1-23.
Hylander, K., S. Nemomissa, J. Delrue and W. Enkosa. (2013). Effects of Coffee Management on Deforestation Rates and Forest Integrity. Conservation Biology. 27. 5: 1031–1040. DOI: 10.1111/cobi.12079
International Institute for Tropical Agriculture (IITA). (2001) Project Report on Integrated Perennial and Annual Cropping Systems (InPACS): Building Household Assets. Ibadan: IITA.
IITA. (2009). 2009 IITA STCP producer evaluation survey. Ibadan: IITA. Intergovernmental Panel on Climate Change (IPCC) (2000) Penman J., Kruger D., Galbally I.,
Hiraishi T., Nyenzi B., Emmanuel S., Buendia L., Hoppaus R., Artinsen T., Meijer J., Miwa K. and Tanabe K. (Eds). Good Practice Guidance and Uncertainty Management in National Greenhouse Gas Inventories. IPCC/OECD/IEA/IGES, Hayama, Japan.
IPCC (2013) Definition of terms used within the DDC pages. Available at: http://www.ipcc-data.org/guidelines/pages/definitions.html [Accessed March 2015].
International Monetary Fund. 2006. The Federal Democratic Republic of Ethiopia: Selected Issues and Statistical Appendix. International Monetary Fund Country Report 6/122. Washington: IMF
M.E. Isaac and E. Dawoe Integrative management of cocoa agroforestry systems: Promoting long-term on-farm diversity. Journal of Science and Technology, Vol. 29, No. 2, Aug., 2009 p 26-33.
Isaac, M.E., V.R. Timmer and S.J. Quashie-Sam. (2007). Shade tree effects in an 8-year-old cocoa agroforestry system: biomass and nutrient diagnosis of Theobroma cacao by vector analysis. Nutrient Cycling in Agroecosystems 78(2): 155-165.
Jherime L. Kellerman, Matthew D. Johnson, Amy M. Stercho, and Steven C. Hackett. 2008. Ecological and Economic Services Provided by Birds on Jamaican Blue Mountain Coffee Farms. Conservation Biology 22.5: 1177-1185.
Juhrbandt, J., Duwe, T., Barkmann, J., Gerold, G. & Marggraf, R. (2010). Structure and management of cocoa agroforestry systems in Central Sulawesi across an intensification gradient. Tropical Rainforests and Agroforests Under Global Change (eds T. Tscharntke, C. Leuschner, E. Veldkamp, H. Faust, E. Guhardja & A. Bidin), pp. 115–140. Environmental Science and Engineering Series. Berlin: Springer Verlag.
Aloyce R. M. Kaliba , David W. Norman & Yang-Ming Chang (2003) Willingness to pay to improve domestic water supply in rural areas of Central Tanzania: Implications for policy, International Journal of Sustainable Development & World Ecology, 10:2: 119-132
Keeley J., Seide W.M., Eid A. and Kidewa A.L. (2014). Large-scale land deals in Ethiopia: Scale, trends, features and outcomes to date. London: IDRC and IIED. 62 pp.
http://pubs.iied.org/pdfs/12575IIED.pdf. Kerr, Amber Catherine. (2012). Drought resilience of maize-legume agroforestry systems in
Malawi. UC Berkeley: Energy & Resources. Retrieved from: http://escholarship.org/uc/item/7bm3k6nv
Klein, A.M., Vassiere, B.E., Cane, J.H., Ingolf, S.D., Cunningham, S.A., Kremen, C., Tscharnke. (2007). Importance of pollinators in changing landscapes for world crops. Proceedings of the Royal Society B-Biological Sciences 274.1608: 303-313
Kolavalli, S., Vigneri, M.. (2011). Cocoa in Ghana, shaping the success of an economy. Pg 201-217. Washington: THe World Bank. Accessible at: http://siteresources.worldbank.org/AFRICAEXT/Resources/258643-1271798012256/ghana_cocoa.pdf

139
Kolavalli, S., Robinson, E., Diao, X., Alpuerto, V., Folledo, R., Slavova, M., Ngeleza, G., Asante, F. (2012). Economic Transformation in Ghana: Where Will the Path Lead?. IFPRI Discussion Paper 01161 Development Strategy and Governance Division. Washington: International Food Policy Research Institute.
KPMG. (2012.) The International Cocoa Organization (ICCO) Study on the costs, advantages and disadvantages of cocoa certification. London: The International Cocoa Organization.
Kufa, T. (2012). Recent coffee research development in Ethiopia, Presentation at the “Ethiopian Coffee Export Conference: Strengthening the Legacy of Our Coffee”, November 8-9, 2012, Hilton, Addis Ababa.
Lavers, T. (2012). ‘Land grab’as development strategy? The political economy of agricultural investment in Ethiopia. Journal of Peasant Studies 39.1: 105-132.
LTS International and Unique Forestry and Land Use. 2012. Estimating Cost Elements of REDD+ in Tanzania. Dar es Salaam: Ministry of Natural Resources and Tourism (MNRT) and the UN-REDD National Programme in Tanzania.
Lehner, B., Grill G. (2013). Global river hydrography and network routing: baseline data and new approaches to study the world’s large river systems. Hydrological Processes, 27.15: 2171–2186.
Lentijo GM, Hostetler M 2011. Evaluating Certified Coffee Programs. WEC306, W ildlife Ecology and Conservation Department, Florida Cooperative Extension Service.
Linger, Ewuketu. 2014. Agro-ecosystem and socio-economic role of homegarden agroforestry in
Jabithenan District, North-Western Ethiopia: implication for climate change adaptation. Springer Plus 3:154. LMC, 2000. International Coffee Organization/Common Fund for Commodities Study of
Marketing and Trading Policies and Systems in Selected Coffee Producing Countries: Ethiopia Country Profile. Study prepared by LMC International Ltd. Oxford, England.
Luck, G. W., Chan, K. M.A. and Fay, J. P. (2009), Protecting ecosystem services and biodiversity in the world's watersheds. Conservation Letters 2: 179–188. doi: 10.1111/j.1755-263X.2009.00064.x
Luedeling E, Neufeldt H: Carbon sequestration potential of parkland agroforestry in the Sahel. Climatic Change 2012, 15:443-461.
Luedeling E., G. Sileshi , T. Beedy and J. Dietz. (2011). Carbon Sequestration Potential of Agroforestry Systems in Africa. Carbon Sequestration Potential of Agroforestry Systems (Advances in Agroforestry) 8: 61-83. DOI 10.1007/978-94-007-1630-8_4
Machanya et al, 2003 Aichi Kitalyi, Robert Otsyina Charles Wambugu, and Deborah Kimaro; FAO Characterisation of Global Heritage Agroforestry Systems in Tanzania and Kenya Kihamba system a traditional Agroforestry system, Shimbwe Juu Kilimanjaro region: Agro Forestry and Development Alternatives (AFOREDA), Tanzania Greener landscapes, healthier ecosystems, better life for all.
Maas, Bea; Clough, Yann; Tscharntke, Teja (2013). Bats and birds increase crop yield in tropical agroforestry landscapes. Ecology Letters, 16(12), 1480-1487, doi:10.1111/ele.12194
Mahmood T. 2008. Characterisation of the Trees Diversity in the Agro-forests of Coffee of Haro(Manna Woreda of Jimma Zone, Ethiopia) Under program “Biodivalloc” of IRD in Ethiopia. Masters Thesis ENGREF, Paris.
Malimbwi, R. E. and Mugasha, A. G. (2001). Reconnaissance inventory of Handeni Hill Forest Reserve in Tanga, Tanzania. 28 pp.
Mbow C., Van Noordwijk M., Luedeling E., Neufeldt H., Minang P.A. and Kowero G. 2014. Agroforestry solutions to address food security and climate change challenges in Africa Current Opinion in Environmental Sustainability 6: 61–67. doi:10.1016/j.cosust.2013.10.014

140
Metaferia, F., S.T. Cherenet, A.G, F. Abnet,A. Tesfay,, J.A. Ali, W. Gulilat. 2011. A Review to Improve Estimation of Livestock Contribution to the National GDP. Addis Ababa: Ministry of Finance and Economic Development and Ministry of Agriculture.
Melca. (2006). Forests of Sheka. Melca Mahiber and the African Biodiversity Network. Méthot, J. (2012). Managing Food Security for Resilience: The Role of Ecosystem Services.
Research to Practice Policy Briefs: Policy Brief No. 12. Montreal: Institute for the Study of International Development.
Miklyaev, M., G.P. Jenkins, R.R. Barichello. (2012) Honey Production in Ethiopia: A Cost-Benefit Analysis of Modern Versus Traditional Beekeeping Technologies. Report for USAID’s “Learning, Evaluation and Analysis Project (LEAP)”. Belmont: Cambridge Resources International.
Minang P.A., Duguma L.A., Bernard F., Mertz O. and van Noordwijk M. (2014). Prospects for agroforestry in REDD+ landscapes in Africa. Current Opinion in Environmental Sustainability 6:78–82. http://dx.doi.org/10.1016/j.cosust.2013.10.015
Ministry of Finance, Republic of Ghana. (2015). Review of the Producer Price of Cocoa for the 2014/2015 Cocoa Season. Last accessed 02 October 2015. Accessible at: http://www.mofep.gov.gh/?q=content/review-producer-price-cocoa-20142015-cocoa-season.
Ministry of Food and Agriculture. Republic of Ghana. (2008a). Mango production. Last accessed 30 September 2015. Accessible at: http://mofa.gov.gh/site/?page_id=14124
Ministry of Agriculture. Republic of Ghana. (2008b). Avocado production. Last accessed 30 September 2015. Accessible at: http://mofa.gov.gh/site/?page_id=14099
Ministry of Water Resources, Works and Housing. Republic of Ghana. (2010). Water and Sanitation Sector Performance Report. Accra: Ministry of Water Resources, Works and Housing.
Minten, B., S. Tamru, T. Kuma, and Y. Nyarko. (2014) Structure and performance of Ethiopia’s coffee export sector . Ethiopia strategy support program. IFPRI Working Paper 66. Washington: International Food Policy Research Institute.
Mlenge W. (2004). Ngitili: an indigenous natural resources management system in Shinyanga. Nairobi, Kenya: Arid Lands Information Network-Eastern Africa (ALIN-EA), 56p.
Mohamed-Katerere, J, D. M.. Smith.. (2012). Filling the Resilience Gap: The Ecosystems Dimension in Food Security Strategy and Policy. Draft IUCN Paper on Food Security for CIDA/ADB/UBC. Gland: International Union for Conservation of Nature (IUCN).
Felister Mombo, Leopold Lusambo, Stijn Speelman, Jeroen Buysse, Pantaleo Munishi d,Guido van Huylenbroeck (2014). Scope for introducing payments for ecosystem services as a strategy to reduce deforestation in the Kilombero wetlands catchment area. Forest Policy and Economics 38: 81–89.
Monela GC, Chamshama SAO, Mwaipopo R and Gamassa DM. 2005. A study on the social, economic and environmental impacts of forest landscape restoration in Shinyanga Region, Tanzania. A report for the Ministry of Natural Resources and Tourism and the World Conservation Union (IUCN).
Monfreda, C., R. Navin, and J.A. Foley (2008). Farming the planet: 2: Geographic distribution
of crop areas, yields, physiological types, and net primary production in the year 2000. Global Biogeochemical Cycles 22.102..
Moore, F.C. and D.B. Diaz. Temperature impacts on economic growth warrant stringent mitigation policy. Nature Climate Change 5:127–131.
Morais H, Henrique Caramori P, de Arruda Ribeiro AM, Carlos Gomes J & Sei Koguishi M. 2006. Microclimate Characterization and Productivity of Coffee Plants Grown Under

141
Shade of Pideon Pea in Southern Brazil. Pesquisa Agropecuaria Brasileira 41(5):763-770.
Muleta D., Assefa F., Nemomissa S. and Granhall U. 2011. Coffee production systems in Bonga and Yayuhurumu sistricts southwestern Ethiopia: Farmers’ perceptions. Ethio. J. Educ. & Sc. 1: 39-56.
Mulligan, M. (2012) WaterWorld: a self-parameterising, physically-based model for application in data-poor but problem-rich environments globally Hydrology Research 44 (5) 748–769. Doi:10.2166/nh.2012.217
Mulligan, M. (2009) The human water quality footprint: agricultural, industrial, and urban impacts on the quality of available water globally and in the Andean region. Proceedings of the International Conference on Integrated Water Resource Management and Climate Change. Cali, Colombia.
Munyuli, T., & Mushambanyi, B. (2014). Social and Ecological Drivers of the Economic Value of Pollination Services Delivered to Coffee in Central Uganda. Journal of Ecosystems, 2014.
Muschler RG. 2001. Shade improves coffee quality in a sub-optimal coffee-zone of Costa Rica. Agroforestry Systems 51(2):131-139.
Namirembe S, Mwangi JK and Gathenya JM 2013. Implementing PES within public watershed management structures: A case of Sasumua watershed in Kenya. FAO Case studies on Remuneration of Positive Externalities /http://www.fao.org/fileadmin/user_upload/pes-project/docs/FAO_RPE-PES_ICRAF-Kenya.pdf
National Bureau of Statistics and Shinyanga Regional Commissioner’s Office 2007. Shinyanga regional and socio-economic profile. http://www.shinyanga.go.tz/Shinyanga%20Socio%20Economic%20Profile.pdf
National Bee Research Institute. 2011. Productivity of Honey from different beehives. Neufeldt H, Jahn M, Campbell BM, Beddington JR, DeClerck F, Pinto AD, Gulledge J et al.:
Beyond climate-smart agriculture: toward safe operating spaces for global food systems. Agric Food Security 2013, 2(12):6.
Njana M. A., G. C. Kajembe & R. E. Malimbwi. (2013) Are miombo woodlands vital to livelihoods of rural households? Evidence from Urumwa and surrounding communities, Tabora, Tanzania. Forests, Trees and Livelihoods, 22:2, 124-140.
Nune, S. M. Kassier and E, Mungatana. 2012. Forest Resource Accounts for Ethiopia. In Rashid Hassan and Eric D. Mungatana (Eds.), Implementing Environmental Accounts: Case Studies from Eastern and Southern Africa. New York: Springer.
Nunoo I., V.owusu and B.O.Darko (2014). Cocoa agroforestry a bridge for sustainable organic cocoa Production. Rahmann G & Aksoy U (Eds.) (2014) Proceedings of the 4th ISOFAR Scientific Conference. ‘Building Organic Bridges’, at the Organic World Congress 2014, 13-15 Oct., Istanbul, Turkey (eprint ID 23519).
Nature Conservation Research Centre / Forest Trends (NCRC/FT) (2013) Climate-smart cocoa in Ghana. Achievements and way forward. pp 11
Negash, M. and M. Starr. (2013a). Litterfall production and associated carbon and nitrogen fluxes of seven woody species grown in indigenous agroforestry systems in the south-eastern Rift Valley escarpment of Ethiopia. Nutrient Cycling Agroecosystems 97:29-41.
Negash, M. (2013b). The indigenous agroforestry systems of the south-eastern Rift Valley escarpment, Ethiopia: Their biodiversity, carbon stocks, and litterfall. University of Helsinki
Tropical Forestry Reports. Negash, M. and M. Starr (2015). Biomass and soil carbon stocks of indigenous agroforestry
systems on the south-eastern Rift Valley escarpment, Ethiopia. Plant Soil 393.1: 95-107.

142
Negash, M., and M. Kanninen. (2015). Modeling biomass and soil carbon sequestration of indigenous agroforestry systems using CO2FIX approach. Agriculture, Ecosystems and Environment 203: 147–155.
New York Declaration on Forests, 3B. http://www.theguardian.com/environment/2014/dec/08/lima-climate-talks-pledge-to-plant-20m-hectares-of-trees and http://www.un.org/climatechange/summit/wp-content/uploads/sites/2/2014/07/New-York-Declaration-on-Forest-%E2%80%93-Action-Statement-and-Action-Plan.pdf
Norgrove, L. and S. Hauser. Carbon stocks in shaded Theobroma cacao farms and adjacent secondary forests of similar age in Cameroon. Tropical Ecology 54(1): 15-22, 2013 ISSN 0564-3295 International Society for Tropical Ecology: www.tropecol.com
Nguyen Q., Hoang M.H., Öborn I and van Noordwijk M. 2013. Multipurpose agroforestry as a climate change resiliency option for farmers: an example of local adaptation in Vietnam. Climatic Change (2013) 117:241–257. DOI 10.1007/s10584-012-0550-1
Nyarko K. B. , S. Oduro-Kwarteng & I. Adama. (2006). Cost recovery of community-managed piped water systems in Ashanti region, Ghana. Water and Environment Journal 1.2: 92-99. doi:10.1111/j.1747-6593.2006.00051.x.
Obiri, B. D., G. A. Bright, M.A. McDonald, L. C. Anglaaere & J. Cobbina. (2007). Financial analysis of shaded cocoa in Ghana. Agroforestry systems 71.2:139-149
Ofori-Frimpong K. , A. Asase, J. Mason3 and L. Danku. Shaded versus unshaded cocoa: implications on litter fall, decomposition, soil fertility and cocoa pod development. Woking paper. Last accessed 1 September 2015. Accessible at: http://www.ncrc-ghana.org/downloads/Ofori-frimpong_n_mason_07.pdf
Oluyede C.A., Place F., Akinnifesi F.K. & Sileshi G.W. 2011. Agricultural success from Africa: the case of fertilizer tree systems in southern Africa (Malawi, Tanzania, Mozambique, Zambia and Zimbabwe). International Journal of Agricultural Sustainability 9.1: 129-136. DOI:10.3763/ijas.2010.0554
Olschewski et al. Roland Olschewski, Teja Tscharntke, Pablo C. Benítez, Stefan Schwarze, and Alexandra-Maria Klein (2006). Economic Evaluation of Pollination Services Comparing Coffee Landscapes in Ecuador and Indonesia. Ecology and Society 11.1:7.
Opoku-Ameyaw K., F. K.Oppong, K. Acheampong and F. M. Amoah. (2012). Long Term Assessment of the Agronomic and Economic Benefits of Cocoa Food Crop Intercropping in the Absence of Fertilizer Application. Cocoa Research Institute of Ghana, P.O. Box 8, New Tafo-Akim, Ghana. American Journal of Experimental Agriculture 2.2: 186-197.
Osei, A.K. (2015). Estimating Stocks in Tree Biomass and Soils Under Rotational Woodlots and Ngitili Systems in Northwestern Tanzania. Thesis submitted to college of graduate studies and Research in Partial Fulfillment of the Requirements for Degree of Master of Science in the Department of Soil Science. Saskatoon: University of Saskatchewan.
Osei, A.K. and A. Kimaro, Personal communication on soil carbon and nutrient stocks in Tanzania, May 25, 2015.
Otsyina R., C.D.K. Rubanza and E. Zahabu. (2008). Development Associates Ltd Contribution of Tree planting and conservation activities to carbon offsets in Shinyanga. Dar es Salaam: Royal Norwegian Embassy.
Otsyina, J.A. 2010. Socio economic baseline and indicators for REDD in Shinyanga Rural and Kahama districts. Dar es Salaam: Development Associates Ltd. and TATEDO.
Ouaamari S.E. and H. Cochet. The Role of Coffee in the Development of Southwest Ethiopia's Forests: Farmer Strategies, Investor Speculation, and Certification Projects. Society and International Resources 27: 200–214.
Oxfam, 2002a. Crisis in the Birthplace of Coffee. Oxfam International Research Paper, September 2002. Oxfordshire: Oxfam International.
143
Perfecto, I., J. Vandermeer, A. Mas, and L. Soto Pinto. (2005). Biodiversity, yield, and shade coffee certification. Ecological Economics 54: 435–446
Perman, R., Y Ma., J McGilvray and M Common. (2003). Natural Resource and Environmental Economics. 3rd edition. Harlow: Longman
Pesaresi M. , G. Huadong, X. Blaes, D. Ehrlich, S. Ferri, L. Gueguen, M. Halkia, M. Kauffmann, T. Kemper, L. Lu, M. A. Marin-Herrera, G. K. Ouzounis, M. Scavazzon, P. Soille, V. Syrris, and L. Zanchetta(2012). A Global Human Settlement Layer From Optical HR/VHR RS Data: Concept and First Results. IEEE Jornal of selected topics in applied earth observation and remote sensing, VOL. 6, NO. 5,Oct 2013.
Petit, N. 2007. Ethiopia’s coffee sector: A better or bitter future? Journal of Agrarian Change 7.2: 225-263. doi: 10.1111/j.1471-0366.2007.00145.x
Potts, J., M. Lynch, A. Wilkings, G. Huppé, M. Cunningham, V. Voora. (2014). The State of Sustainability Initiatives Review 2014: Standards and the Green Economy. Winnipeg: International Institute for Sustainable Development.
Powell, Rebecca L., Eun-Hye Yoo, and Christopher J. Still. "Vegetation and soil carbon-13 isoscapes for South America: integrating remote sensing and ecosystem isotope measurements." Ecosphere 3.11 (2012): art109.
Putri, A.A.D.P. and Kwek, D.L. Pilot project on Community-Based REDD Mechanisms for Sustainable Forest Management in Semiarid Areas: The Case of Ngitilis in the Shinyanga Region, Tanzania 272. REDD+ on the ground: a case book of subnational initiatives across the globe. Eds. Erin O Sills, Stibniati S Atmadja, Claudio de Sassi, Amy E Duchelle, Demetrius L Kweka, Ida Aju Pradnja Resosudarmo and William D Sunderlin. Bogor: Centre for International Forestry Research (CIFOR).
Pye-Smith C. 2010. A Rural Revival in Tanzania: How agroforestry is helping farmers to restore the woodlands in Shinyanga Region. ICRAF Trees for Change no. 7. Nairobi: World Agroforestry Centre.
Ramadhani T., R. Otsyina, S. Franzel. (2002). Improving household incomes and reducing deforestation using rotational woodlots in Tabora District, Tanzania. Agriculture, Ecosystems, and the Environment 89.3: 227-237.
Rahmato D. 2011. LAND TO INVESTORS: Large-Scale Land Transfers in Ethiopia. Forum for Social Studies. 37 pp. http://www.landgovernance.org/system/files/Ethiopia_Rahmato_FSS_0.pdf
Ready, Richard and Stale Navrud. (2006). International benefit transfer: Methods and validity tests. Ecological Economics 60: 429 – 43.
Regional Executive Forum 2001. Ethiopia’s export strategy: key features and major influencing factors. Presentation at the Regional Executive Forum on National Export Strategies. Nairobi, Kenya 26-28 November, 2001
Reichhuber, A.m Requate, T. 2012. Alternative use systems for the remaining Ethiopian cloud forest and the role of Arabica coffee — A cost-benefit analysis. Ecological Economics 75: 102–113
Ricci MSF, Rouws JRC & De Oliveira NG. 2011. Vegetative and productive aspects of organically grown cofee cultivars under shaded and unshaded systems. Sci. Agric. (Piracica, Braz.) 68(4):424-430.
Rice, R.A., R. Greenberg. (2000). Cacao cultivation and the conservation of biological diversity. Ambio 29, 167–173.
Richards, M., & Asare, A. (1999). Economic incentives for cocoa farmers to tend timber trees in Southern Ghana. London: Overseas Development Institute.
Ricketts, T.H., E. Lonsdorf (2013). Mapping the margin: Comparing marginal values of tropical forest remnants for pollination services. Ecological Applications 23(5): 1113-1123.

144
Romero-Alvarado Y, Soto-Pinto L, García-Barrios L & Barrera-Gaytán JF. (2002). Coffee yields and soil nutrients under the shades of Inga sp. vs. multiple species in Chiapas, Mexico. Agroforestry Systems 54(3):215-224.
Rossiter Helfrid M.A., A Peter .Owusu, E. Awuah, A. M. MacDonald, A. I. Schäfer. (2010) Chemical drinking water quality in Ghana: Water costs and scope for advanced treatment.
Science of the Total Environment 408.11: 2378–2386. Rubanza CDK, Shem MN, Bakengesa SS, Ichinohe T, Fujihara T. (2007). Effects of Acacia
nilotica, A. polyacantha and Leucaena leucocephala leaf meal supplementation on performance of Small East African goats fed native pasture hay basal forages. Small Ruminant Research 70: 165-173.
Ruf F. and Zadi H. 1998. Cocoa: From Deforestation to Reforestation. nationalzoo.si.edu/scbi/migratorybirds/research/cacao/ruf.cfm
Ruf F. 2011. The Myth of Complex Cocoa Agroforests: The Case of Ghana. Hum Ecol 39:373–388. DOI 10.1007/s10745-011-9392-0
Ruf, F, Deheuvels, O., and Sarpong, D. (2006). Intensification in Cocoa Cropping Systems: is Agroforestry a Solution for Sustainability? The Case of Manso Amenfi, Western Region, Ghana. 15th International Conference on Cocoa Research (Vol. 1), pp. 355–364
Sandker, M., Nyame, S. K., Förster, J., Collier, N., Shepherd, G., Yeboah, D., ... & Campbell, B. M. (2010). REDD payments as incentive for reducing forest loss. Conservation Letters, 3.2, 114-121.
Santos R, Rodrigues L, Lima C & Jaramillo-Botero C. 2012. Coffee Yield and Microenvironmental Factors in a Native Tree Agroforestry System in Southeast Minas Gerais, Brazil. Journal of Sustainable Agriculture 36(1):54-68.
Schaafsma, M.. (2012). Mapping ntfp collection in Tanzania: A comparison of surveys. Centre
for Social and Economic Research on the Global Environment Working Paper 2012-05. Norwich: University of East Anglia.
Schaafsma M., S. , Morse-Jones, P. Posen, R.D. Swetnam, A.Balmford , I.J. Bateman, N.D. Burgess S.A.O. Chamshama, B. Fisher, R.E. Green, A.S. Hepelwa, A. Hernández-Sirvent, G.C. Kajembe, K. Kulindwa, J.F. Lund, L. Mbwambo, H. Meilby, Y.M. Ngaga e, I. Theilade, T. Treue, V.G. Vyamana, R.K. Turner (2012a).The importance of local forest benefits: Economic valuation of Non-Timber Forest Products in the Eastern Arc Mountains in Tanzania. Global Environmental Change 24: 295–305
Schaafsma M., S. Morse-Jones, P. Posen, R.D. Swetnam, A. Balmford b, I.J. Bateman, N.D.
Burgess, S.A.O. Chamshama, B. Fisher, R.E. Green, A.S. Hepelwa, A. Hernández-Sirvent, G.C. Kajembe, K. Kulindwa, J.F. Lund, L. Mbwambo, H. Meilby, Y.M. Ngaga e, I. Theilade, T. Treue, V.G. Vyamana, R.K. Turner (2012b).Towards transferable functions for extraction of Non-timber Forest Products: A case study on charcoal production in Tanzania. Ecological Economics 80: 48–62.
Schaafsma, M., N. D. Burgess, R.D. Swetnam, Y. M. Ngaga, R.K. Turner, T. Treue. (2014). Market Signals of Unsustainable and Inequitable Forest Extraction: Assessing the Value of Illegal Timber Trade in the Eastern Arc Mountains of Tanzania Global Environmental Change 24: 295–305.
Schmitt, C. B., F. Senbeta, M. Denich, H. Preisinger, and H.J. Boehmer. (2007). Wild coffee management and plant diversity in the montane rain forest of southwestern Ethiopia. African Journal of Ecology 48: 78–86.
Schroth G., A. B. Gustavo, da Fonseca, A. C. Harvey, Gascon C., H. L. Vasconcelos, and N. Izac Anne-Marie. Agroforestry and Biodiversity Conservation in Tropical Landscapes. Biodivers Conserv (2007) 16:2237–2244 DOI 10.1007/s10531-007-9195-1.

145
Schroth G., Bede L.C. & Paiva A.O., Cassano C.R., Amorim A.M., Faria D., Mariano-Neto E. MartiniA.M.Z., Sambuichi R.H.R., and Lôbo R.N. (2015). Contribution of agroforests to landscape carbon storage. Mitigation Adaptation Strategies to Global Change 20:1175–1190.
Ismail S Selemani, Lars O Eik, Øystein Holand, Tormod Ådnøy, Ephraim Mtengeti & Daniel Mushi (2013) The effects of a deferred grazing system on rangeland vegetation in a north-western, semi-arid region of Tanzania, African Journal of Range & Forage Science, 30:3, 141-148. http://dx.doi.org/10.2989/10220119.2013.827739
Selemani, I. S. (2015). Influence of Ngitili management on vegetation and soil characteristics in semi-arid Sukumaland, Tanzania. Livestock Research for Rural Development. 27.37.
Sexton, J. O., Song, X.-P., Feng, M., Noojipady, P., Anand, A., Huang, C., Kim, D.-H., Collins, K.M., Channan, S., DiMiceli, C., Townshend, J.R.G. (2013). Global, 30-m resolution continuous fields of tree cover: Landsat-based rescaling of MODIS Vegetation Continuous Fields with lidar-based estimates of error. International Journal of Digital Earth
Shank, R. 1995. Enset and Root Crop Production in Relation to Food Supply Assessment, Food Security and Nutritional Status in Ethiopia. Addis Ababa: United Nations Development Programme Emergencies Unit for Ethiopia.
Shank, R. and C. Eritro. (1996). Enset crop Assessment: A linear Model for Predicting Enset Yield and Assessment of Kocho Production. A report. Addis Ababa: UN Emergencies Unit for Ethiopia and World Food Program.
Shechambo F. 2008. Conserving the environment and improving livelihoods by using traditional knowledge and organizations.In: Kimambo IN, Hyden G, Maghimbi S, Sungimura K (eds), Contemporary perspectives on African moral economy. Dar esSalaam: University of Dar es Salaam Press. pp 55–62.
David H. Shinn, Thomas P. Ofcansky - 2013 - History . ( https://books.google.com/books?isbn=0810874571). Ethiopia coffee trade (http://www1.american.edu/ted/ethcoff.htm)
Sikoyo G. M., K. Hanlon, U. Mwinyiechi (2001). The impact of wildlife-based enterprises on local livelihoods and conservation in Tanzania : Wildlife Enterprise for Local Development (WELD) Project.
Simons, A. J., G. Schroth, M. van Noordwijk, R. R. B. Leakey, H. Shapiro, and D. P. Garrity (2006). “Cultivating diversity: The role of cacao agroforestry systems in rural economic growth and conservation of biodiversity.” Cocoa Symposium, National Academy of Sciences, 9-10 February.
Smoot K, A. Gyau, C. Kouame, L. Diby. (2013). Market analysis of selected agroforestry products in the Vision for Change Project intervention zone, Côte d’Ivoire. Working paper 174. Nairobi, Kenya, DOI http://dx.doi.org/10.5716/WP13249.PDF
Somporn C, Kamtuo A, Theerakulpisut P & Siriamornpun S. 2012. Effect of shading on yield, sugar content, phenolic acids and antioxidant property of coffee beans (Coffea Arabica L. cv. Catimor) harvested from north-eastern Thailand. Journal of the Science of Food and Agriculture:n/a-n/a.
Sonwa1, D.J., S.F Weise., M.J.J. Janssen, G. Schroth and H. Shapiro. 2008. Diversifying and Intensifying the Cocoa Agroforest Landscape: Review and strategic approaches for managing the shade matrix in West and Central Africa The Su s tainable Tree Crops Program (STCP). Working Paper 4.
Stegen, J.C., Swenson, S.G., Valencia, R., Enquist, E.J., Thompson, E., 2009. Above ground forest biomass is not consistently related to wood density in tropical forests Global Ecol. Biogeogr. 1-9
Steiman SR, Bittenbender HC, Idol TW, Gautz LD & Jackson MC. 2006. Shade Coffee in Hawaii – The Impact of Light on Coffee Quality. Proc. 21st ASIC. Montpellier.

146
Stellmacher T. and Grote U. 2011. Forest coffee certification in Ethiopia: Economic boon or ecological bane? ZEF Working Paper Series 76. http://hdl.handle.net/10419/88396
Stern, N., et al. 2006. Stern Review on the Economics of Climate Change. UK Government Economic Service, London. www.sternreview.org.uk
Sutcliffe, J.P. A. Wood, J. Meaton. 2012. Competitive forests – making forests sustainable in south-west Ethiopia. International Journal of Sustainable Development & World Ecology 19.6.: 471-481.
STCP 2001 Jim Gockowski and Denis Sonwa The Sustainable Tree Crops Program (STCP) Biodiversity and smallholder cocoa production systems in West Africa International Institute of Tropical Agriculture (IITA), Accra, Ghana International Institute of Tropical Agriculture (IITA), Yaoundé, Cameroon
Tadesse, E. 2013. Biodiversity And Livelihoods In Southwestern Ethiopia: Forest Loss And Prospects For Conservation In Shade Coffee Agroecosystems (Doctoral dissertation). Last accessed 10 October 2015. Accessible at: http://escholarship.org/uc/item/2pc6t277.
Tadesse G., Zavaleta E. , Shennan C., FitzSimmons M.. Prospects for forest-based ecosystem services in forest-coffee mosaics as forest loss continues in southwestern Ethiopia. Applied Geography 50 (2014a) 144-151
Tadesse G., Zavaleta E., Shennan C.. Coffee landscapes as refugia for native woody biodiversity as forest loss continues in southwest Ethiopia. Biological Conservation 169 (2014b) 384–391
Tadesse, G., E. Zavaleta, C. Shennan. 2014. Effects of land-use changes on woody species distribution and aboveground carbon storage of forest-coffee systems. Agriculture, Ecosystems and Environment 197 (2014c) 21–30
Taffesse A.S., Dorosh P. and Gemessa S.A. 2012. Crop production in Ethiopia: regional patterns and trends in Dorosh P. and Rashid S. (editors) Food and Agriculture in Ethiopia: progress and policy challenges. IFPRI.
United Republic of Tanzania. 2002. 2002 Population and Housing Census IV: The Regional and District Census Data in Brief. Dar es Salaam: National Bureau of Statistics.
Tanzania Demographic and Health Survey (2004-05 TDHS), which was conducted by the National Bureau of Statistics of the United Republic of Tanzania. ORC Macro provided technical assistance.
Tanzania Bureau of Statistics. 2013. 2012 POPULATION AND HOUSING CENSUS. Population Distribution by Administrative Areas and March, 2013. Dar es Salaam: Ministry of Finance and Tanzania Bureau of Statistics.
Taye, E. 2001. Report on woody plant inventory of Yayu national forestry priority area. IBCR/GTZ, Addis Ababa, Ethiopia, pp. 2-21.
Tefera S, Snyman HA, Smit GN. 2007. Rangeland dynamics of southern Ethiopia: (2). Assessment of woody vegetation structure in relation to land use and distance from water in semi-arid Borana rangelands. Journal of Environmental Management 85: 443–452.
Teferi M., Gole T.W., and Yelibora M. 2013. Ethiopia: Mapping REDD+ finance flows 2009-2011. Forest Trends REDDX Report
Isaac M.E., Timmer V.R. and Quashie-Sam S.J. 2007. Shade tree effects in an 8-year-old cocoa agroforestry system: biomass and nutrient diagnosis of Theobroma cacao by vector analysis. Nutrient Cycling in Agroecosystems 78(2): 155-165. Thorlakson T, Neufeldt H: Reducing subsistence farmers’ vulnerability to climate change:
evaluating the potential contributions of agroforestry in western Kenya. Agric Food Security 2012, 1(15):1-13.
147
Thornes, J. B. (1990). The interaction of erosional and vegetational dynamics in land degradation: spatial outcomes. Vegetation and erosion. Processes and environments., 41-53.
Tscharntke T., Clough Y., Bhagwat S.A., Buchori D., Faust H., Hertel D., lscher D.H., Juhrbandt J., Kessler M., Perfecto I., Scherber C., Schroth G., Veldkamp E. and Wanger T.C. 2011. Multifunctional shade-tree management in tropical agroforestry landscapes – a review. Journal of Applied Ecology 2011, 48, 619–629. doi: 10.1111/j.1365-2664.2010.01939.x
Sandker, M., S. Kofi Nyame, J. Forster, N. Collier, G. Shepherd, D. Yeboah, D.Ezzine-de Blas, M. Machwitz, S. Vaatainen, E. Garedew, G. Etoga, C. Ehringhaus, J. Anati, O. Dankama Kwasi Quarm, & B.M. Campbell. (2009) REDD payments as incentive for reducing forest loss. Conservation Letters 3: 114–121
TaTEDO. (2012). Pilot Project on Community-Based REDD+ Mechanisms for Sustainable Forest Management in Semi-Arid Areas (Case of Ngitilis in Shinyanga Region). Project Final Report. Dar Es Salaam: TaTEDO and Development Associates Ltd.
Tarfasa, S. and R. Brouwer. (2013). Estimation of the public benefits of urban water supply improvements in Ethiopia: a choice experiment. Applied Economics 45:
1099–1108. UNDP (2012) Environment Sustainability and Policy for Cocoa Production in Ghana.
COCOBOD. pp 56 UNDP, 2005. Human Development Report 2005: International Cooperation at a Crossroads.
Aid, Trade and Security in an Unequal World. New York: United Nations Development Programme.
United Nations Economic Commission on Africa. 2013. Ethiopia Country Case Study. Economic Report on Africa 2013. Last accessed 26 April 2015 Accessible at: http://www.uneca.org/sites/default/files/uploaded-documents/era2013_casestudy_eng_ethiopia.pdf..
The United Nations Economics of Ecosystems and Biodiversity (UN TEEB). 2010. TEEB Ecological and Economic Foundations. Accessible at: http://www.teebweb.org / Ecological and Economic Foundation/tabid/1018/language/en-US/Default.aspx
United Nations Food and Agricultural Organization.2015. FAOSTAT database. Accessible at: http://faostat3.fao.org/download/Q/QC/E. Last accessed 25 April, 2015.
UN TEEB. 2014. The Economic of Ecosystem and Biodiversity (TEEB) for Agriculture & Food. Concept Note: 27 February 2014. Accessible at: http://doc.teebweb.org/wp-content/uploads/2014/05/TEEB-for-Agriculture-and-Food_Concept-note.pdf
UNFCCC 2006. United Nations Framework Convention for Climate Change. United States Environmental Protection Agency (U.S. EPA). (2013, November 26). Social cost
of carbon. Last accessed January 28, 2015. Accessible at: http://www.epa.gov/climatechange/EPAactivities/economics/scc.html.
United Republic of Tanzania. 2011. National Accounts of Tanzania Mainland: 2000-2010. Dar es Salaam: National Bureau of Statistics and Ministry of Finance.
United Republic of Tanzania. 2012. National sample census of agriculture 2007/2008: Shinyanga region. Government report. Dar es Salaam: National Bureau of Statistics. Accessible at http://www.nbs.go.tz [accessed 5 July 2013].
Tanzania-National Household Budget Survey 2007. National Bureau of Statistics, Ministry of State President’s Office Planning and Privatisation. Financial Assistance from, Swiss Development Cooperation - SDC, Census and Survey Working Group -CSTWG, Mkukuta Secretariat. http://www.nbs.go.tz/tnada/index.php/catalog/2
Tanzania Revenue Authority. 2011. Review of Informal Sector for Taxation Purposes. First Draft Report. Dar es Salaam: Tanzania Revenue Authority.

148
United States Agency for International Development (USAID). 2009. United States Agency for International Development (USAID)’s Trade and Investment Program for a Competitive Export Economy (TIPCEE) GHANA Assessing Economic Benefits: The Case of Banana, Mango, and Rice. Washington: USAID.
United States Agency for International Development (USAID). 2012. Agricultural Growth Program Agribusiness and Market Development (AGP-AMDe) Project. Submitted by ACDI/VOCA to Contracting Officer’s Representative Tewodros Yeshiwork, USAID Ethiopia.
Vaast P, Bertrand B, Perriot J-J, Guyot B & Génard M. 2006. Fruit thinning and shade improve bean characteristics and beverage quality of coffee (Coffea arabica L.) under optimal conditions. Journal of the Science of Food and Agriculture 86(2):197-204.
Vaast P., Harmand J.M. and Somarriba E 2015. Smallholders’ coffee and cocoa agroforestry systems; examples of climate-smart agriculture. Oral Presentations L3.2. Climate-smart Agriculture, Climate-smart cropping systems 2015. https://agritrop.cirad.fr/576709/1/ID576709.pdf
Van Notten, P.W., Sleegers, A. M., & van Asselt, M.B. (2005) The future shocks: On
discontinuity and scenario development. Technological Forecasting and Social Change, 72(2), pp. 175-194.
Vanderhaegen, K., Verbist, B., Hundera, K., Muys, B., (2015). REALU vs. REDD+: Carbon and biodiversity in the Afromontane landscapes of SW Ethiopia. Forest Ecology and Management 343, 22-33.
Verchot LV, Noordwijk MV, Kandji S, Tomich T, Ong C, Albrecht A, Mackensen J, Bantilan C, Anupama KV, Palm C: Climate change: linking adaptation and mitigation through agroforestry. Mitigation Adaptation Strategies Global Change 2007, 12:901-918.
Verdeaux, F., and Alpha, A. (2004). Deforestation in Côte d’Ivoire. The exploitation of forest resources. In Babin, D. (ed.), Beyond Tropical Deforestation. CIRAD and UNESCO, Paris, pp. 51–60.
Victor, A. S., Gockowski, J., Agyeman, N. F., & Dziwornu, A. K. (2010, September). Economic cost-benefit analysis of certified sustainable cocoa production in Ghana. In Proc. of the 3rd African Association of Agricultural Economists (AAAE) and 48th Agricultural Economists Association of South Africa (AEASA) Conference (pp. 19-23).
Wade et al. 2010. Management strategies for maximizing carbon storage and tree species diversity in cocoa-growing landscapes. Agriculture, Ecosystems and Environment 138: 324-334.
Wambugu C., Place F. & Franzel S. 2011 Research, development and scaling-up the adoption of fodder shrub innovations in East Africa. International Journal of Agricultural Sustainability 9(1): 100-109. DOI:10.3763/ijas.2010.0562
Wendimu S. and Wagayehu Bekele (2011). Determinants of individual willingness to pay for quality water supply: The case of Wonji Shoa Sugar Estate, Ethiopia. Industrial Projects Service, Addis Ababa, Ethiopia. Journal of Ecology and the Natural Environment Vol. 3(15), pp. 474-480, 12 December, 2011. DOI: 10.5897/JENE11.089. Available online at http://www.academicjournals.org/jene
Wiersum, K. F., T. W. Gole, F. Gatzweiler, J. Volkmann, E. Bognetteau, and Olani Wirtu. "Certification of wild coffee in Ethiopia: experiences and challenges." Forests, Trees and Livelihoods 18, no. 1 (2008): 9-21.
Wiskerke WT, Dornburg V, Rubanza CDK, Malimbwi RE, Faaij APC. 2010. Cost/benefit analysis of biomass energy supply options for rural smallholders in the semi-arid eastern part of Shinyanga Region in Tanzania. Renewable and Sustainable Energy Reviews 14: 148–165.
149
Wood G. A. R. and Lass R. A. 2008. Cocoa. 4th edition. http://samples.sainsburysebooks.co.uk/9780470698426_sample_378686.pdf
World Agroforestry Centre 2010. A Rural Revival in Tanzania: How agroforestry is helping farmers to restore the woodlands in Shinyanga Region. World Agroforestry Centre, Trees for Change No 7. http://www.worldagroforestry.org/downloads/Publications/PDFS/B16751.pdf
The World Bank. 2009. Environmental crisis or sustainable development opportunity? Transforming the charcoal sector in Tanzania: A Policy Note. Washington: The World Bank.
World Bank. 2012a. Agribusiness indicators - Ghana. Washington DC ; World Bank Group. Accessible at: http://documents.worldbank.org/curated/en/2012/04/16373413/ghana-agribusiness-indicators
World Bank. 2012. Agribusiness indicators : Tanzania. Washington DC : World Bank.
Accessible at: http://documents.worldbank.org/curated/en/2012/11/17036886/agribusiness-indicators-tanzania
The World Bank. 2014. World Development Indicators. Data - the World Bank. Last accessed 10 December 214. Accessible at: http://data.worldbank.org/data-catalog/world-development-indicators.
The World Bank. 2015a. GDP, PPP (current international $) World Development Indicators. Data - the World Bank. Last accessed 10 December 2014.
Accessible at: http://data.worldbank.org/indicator/NY.GDP.MKTP.CD The World Bank. 2015b. Agriculture, value added (% of GDP) World Development
Indicators. Data - the World Bank. Last accessed 10 December 2014. Accessible at: http://data.worldbank.org/indicator/NV.AGR.TOTL.ZS.
The World Bank. 2015c. Population, total. World Development Indicators. Data - the World Bank. Last accessed 10 December 2014. Accessible at: http://data.worldbank.org/indicator/SP.POP.TOTL
The World Bank. 2015d. PPP conversion factor, private consumption (LCU per international $). World Development Indicators. Data - the World Bank. Last accessed 12 October 2015. Accessible at:http://data.worldbank.org/indicator/PA.NUS.PRVT.PP
The World Bank. 2015e. GDP deflator (base year varies by country). World Development Indicators. Data - the World Bank. Last accessed 12 October 2015. Accessible at: http://data.worldbank.org/indicator/NY.GDP.DEFL.ZS
Yesuf M., Mekonnen A., Kassie M. and Pender J. 2005. Cost of Land Degradation in Ethiopia: A Critical Review of Past Studies IFPRI. http://www.efdinitiative.org/sites/default/files/costs_of_land_degradation_in_ethiopia_v2_final.pdf
Zahabu 2001,Impact of charcoal extraction on the Miombo Woodlands: The case of Kitulangalo Area, Tanzania E Zahabu, RE Malimbwi - Unpublished MSc. Dissertation, SUA, 2001
Zomer RJ, Trabucco A, Coe R and Place F. 2009. Trees on Farm: Analysis of Global Extent and Geographical Patterns of Agroforestry. ICRAF Working Paper no. 89. Nairobi, Kenya: World Agroforestry Centre.
Zomer RJ, Trabucco A, Coe R, Place F, van Noordwijk M, Xu JC. 2014. Trees on farms: an update and reanalysis of agroforestry global extent and socio-ecological characteristics. Working Paper 179. Bogor, Indonesia: World Agroforestry Centre (ICRAF) Southeast Asia Regional Program. DOI: 10.5716/ WP14064.PDF

150
Zuidema Pieter A., Peter A. Leffelaar, Gerritsma Wouter, Liesje Mommer, Niels P.R. Anten (2005). A physiological production model for cocoa (Theobroma cacao): model presentation, validation and application. Agricultural Systems 84 (2005) 195–225
Web Sources used http://www.willoughbyscoffee.com/images/ethdtlmap.jpg) http://www.teebweb.org/wp-content/uploads/2013/01/TEEBcase-Traditional-forest-
restoration-Tanzania-.pdf

151
The Economics of Ecosystems and Biodiversity (TEEB) is a global initiative focused on “making nature’s values visible”.
Its principal objective is to mainstream the values of biodiversity and ecosystem services into decision-making at all levels.
It aims to achieve this goal by following a structured approach to valuation that helps decision-makers recognize the wide range
of benefits provided by ecosystems and biodiversity, demonstrate their values in economic terms and,
where appropriate, capture those values in decision-making.
www.teebweb.org