agriculture and environmental pollution
TRANSCRIPT

Agriculture Agriculture and and
Environmental PollutionEnvironmental Pollution
Dr P S HarikumarScientist and HeadWater Quality Division, [email protected]

Higher production and increased efficiency
Agricultural Policy
Intensification of the
farming system
Increase of pollution risks

Linkages between policies, driving forces and the state of the environment relevant to water
Source: OECD Secretariat, 2010
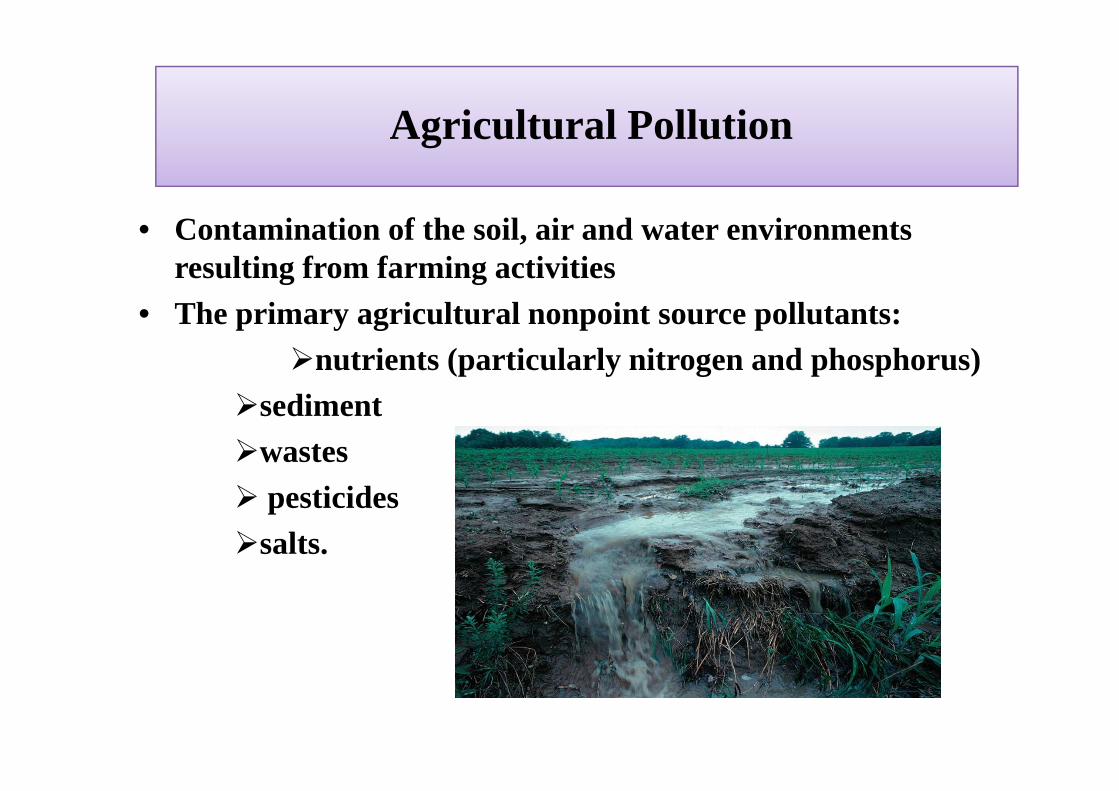
Agricultural Pollution
• Contamination of the soil, air and water environments resulting from farming activities
• The primary agricultural nonpoint source pollutants:�nutrients (particularly nitrogen and phosphorus)
�sediment�sediment�wastes� pesticides �salts.
Effects of agricultural pollution.Effects of agricultural pollution.
1) Public healthIn drinking water, high concentrations of nitrate can cause
methemoglobinemia( blue baby syndrome), a potentially fataldisease in infants.Endosulphan Problem
2) Fish stocks and marine biodiversity.Eutrophication destroysEutrophication destroys
(a) spawning areas for economically valuable fish(b) habitats for other marine life
3) The tourist industryPoisonous and odorous coastal waters discourage tourists!

Biodiversity Loss
Loss and degradation of habitat fromclearing grasslands and forests anddraining wetland
Fish kills from pesticide runoff
Killing of wild predators to protectlivestock
Loss of genetic diversity fromreplacing thousands of wild crop
Soil
Erosion
Loss of fertility
Salinization
Waterlogging
Desertificationreplacing thousands of wild cropstrains with a few monoculture strains
Human Health
Nitrates in drinking water
Pesticide residues in drinking water,food, and air
Contamination of drinking andorganisms from livestock wastesorganisms from livestock wastes
Bacterial contamination

Air Pollution
Greenhouse gas emissions from fossilFuel issue
Other air pollutants from fossil fuel use
Pollution from pesticide sprays
WaterWater waste
Aquifer depletion
Increased runoff andflooding from land clearedto grow crops
Sediment pollution fromerosion
Surface and groundwaterpollution from pesticidesand fertilizers
Overfertilization of lakesand slow-moving riversfrom runoff of nitrates and phosphates fromfertilizers, livestockwastes, and fooderosion
Fish kills from pesticiderunoff
wastes, and foodprocessing wastes

Fertilizers
TYPES OF FERTILIZERS
Inorganic fertilizers
Liquid fertilizers Nitrosol and African Violet Food
Slow-release fertilizers
Fertilizer with insecticides
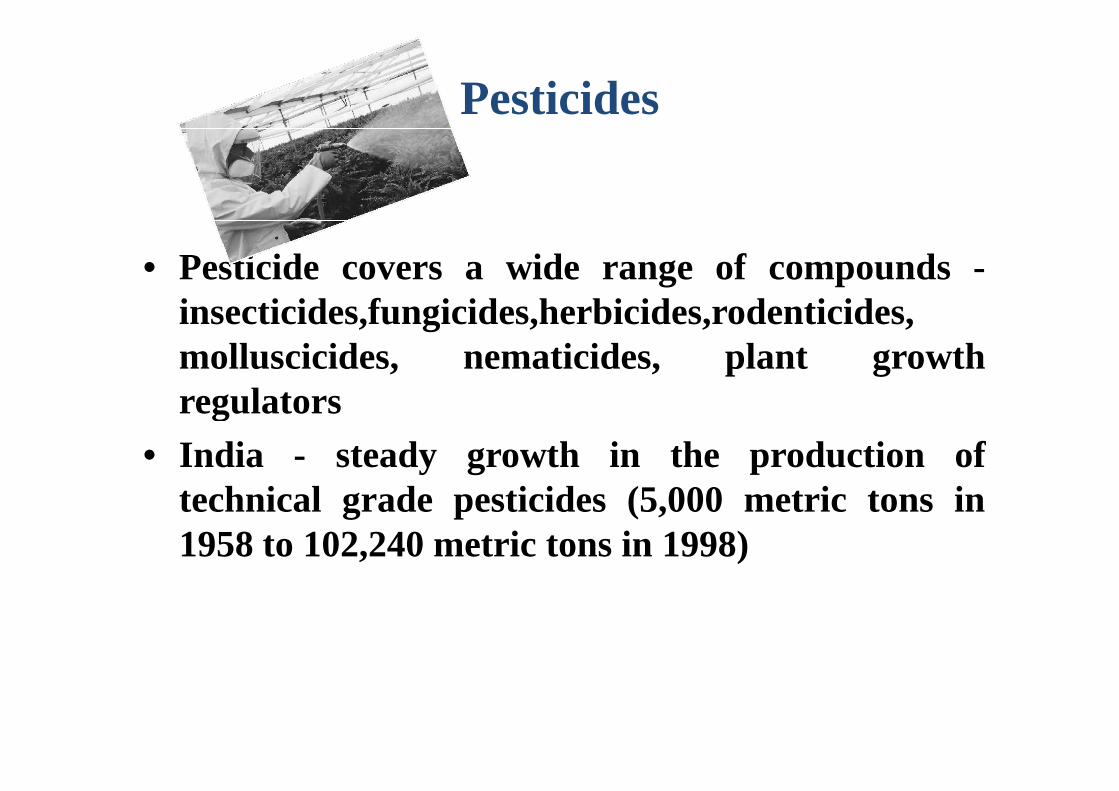
Pesticides
• Pesticide covers a wide range of compounds -insecticides,fungicides,herbicides,rodenticides,molluscicides, nematicides, plant growthregulatorsregulators
• India - steady growth in the production oftechnical grade pesticides (5,000 metric tons in1958 to 102,240 metric tons in 1998)
Pesticide use in India 1948 : Dichloro DiphenylTrichloroethane (DDT) and Benzene Hexa Chloride (BHC) formalaria control.
India is the leading manufacturer of basic pesticides in Asia and ranks 12th globally
Insecticides :61% of total consumptionfungicides (19%) and herbicides (17%).
54% of the total quantity of pesticides :cotton 17% : rice and 13% in vegetables and fruits.

76% of the pesticide used is insecticide, as against 44% globally
India World
Consumption pattern of pesticides
Pesticide use in India 30% of the cropped area. Increased from 2.4, million hectares (1950) to 137 million hectares.
Total consumption was the highest during the 1980s, post-green revolution.
The declining trend observed later may be attributed to the increased awareness on negative externalities by the farmers or the changes in policies reducing subsidies.
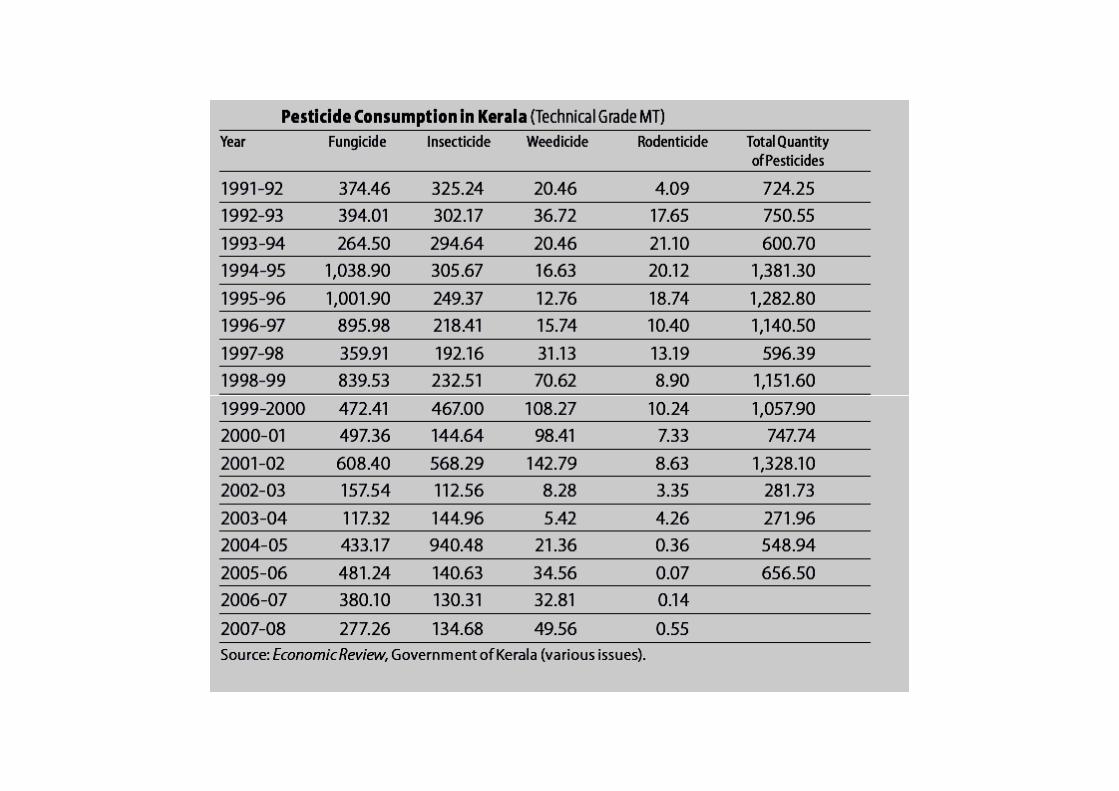
Consumption level of pesticides in agriculture in Kerala (1995-96 to 2007-08)462.05 metric tonnes (MT) (2007-08) technical grade material of insecticides, fungicides, weedicides and rodenticides.
Over the past 15 years, consumption reached the highest level of 1,381.30 MT in 1994-95 and 1,328.10 in 2001-02 and was the lowest at 271.96 MT during 2003-04 and shows a gradual declining trend.

Kerala agriculture contributes 17.2% to Kerala’s economy (as of 2002-2003).
Pesticide consumption in Kerala and India

How can Agricultural Pollution harm our environment?
How do different agricultural activities contributeto pollution, and how does this affect our ground and surface waters??
16

Agricultural impacts on water quality
Agricultural activity
Tillage/ploughingImpactsImpacts
Surface waterSurface water GroundwaterGroundwater
17
Sediment/turbidity: sediments carry phosphorus and pesticides adsorbed to sediment particles;siltation of river beds and loss of habitat,etc.
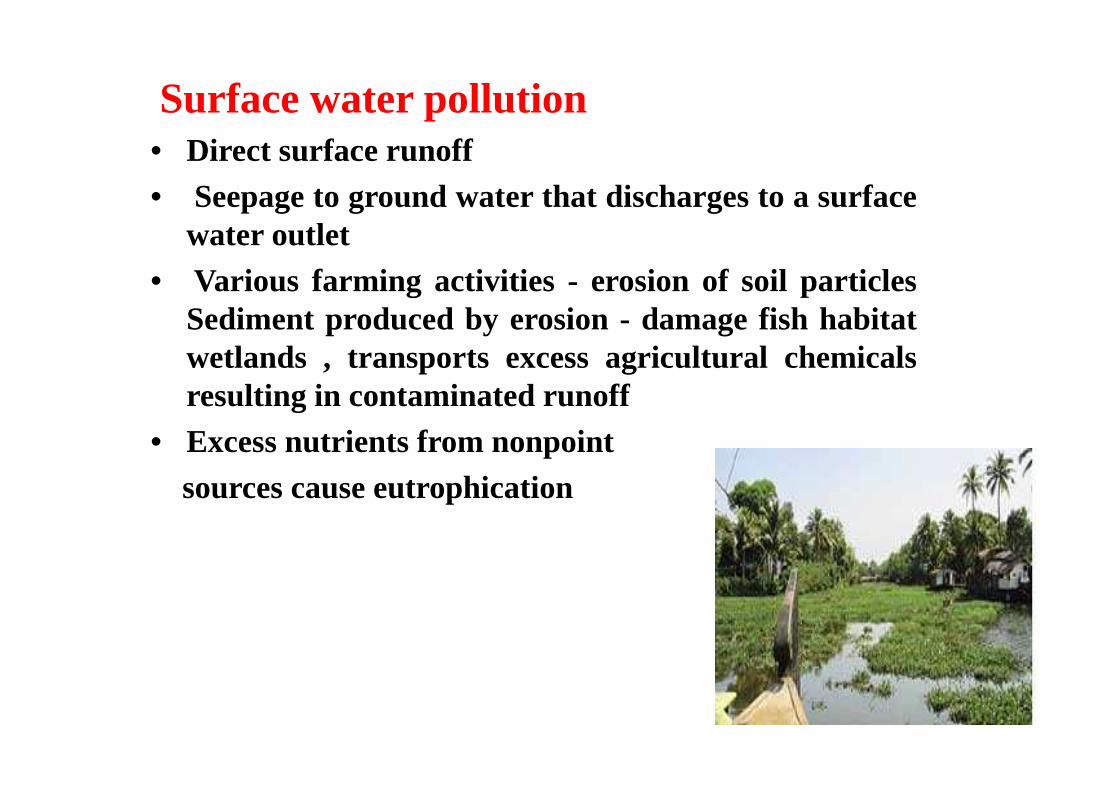
Surface water pollution• Direct surface runoff• Seepage to ground water that discharges to a surface
water outlet• Various farming activities - erosion of soil particles
Sediment produced by erosion - damage fish habitatwetlands , transports excess agricultural chemicalsresulting in contaminatedrunoffresulting in contaminatedrunoff
• Excess nutrients from nonpointsources cause eutrophication

Agricultural activity
ImpactsImpactsSurface water Surface water GroundwaterGroundwater
Fertilizers
Runoff of nutrients, especially phosphorus,leadingto eutrophication causingtasteand Leaching of nitrate to
19
leadingto eutrophication causingtasteandodour in public water supply, excessalgae growth leading to deoxygenatingof water and fish kills.
Leaching of nitrate togroundwater; excessive levelsare a threat to public health.

Groundwater pollution
• Nitrate -most common chemical contaminant
• Mean nitrate levels - risen by an estimated 36%in global waterwayssince1990in global waterwayssince1990
• India and Africa - 20-50% of wells in agricultureareas contain nitrate levels greater than 50 mg/l& in some cases as high as 100 mg/l
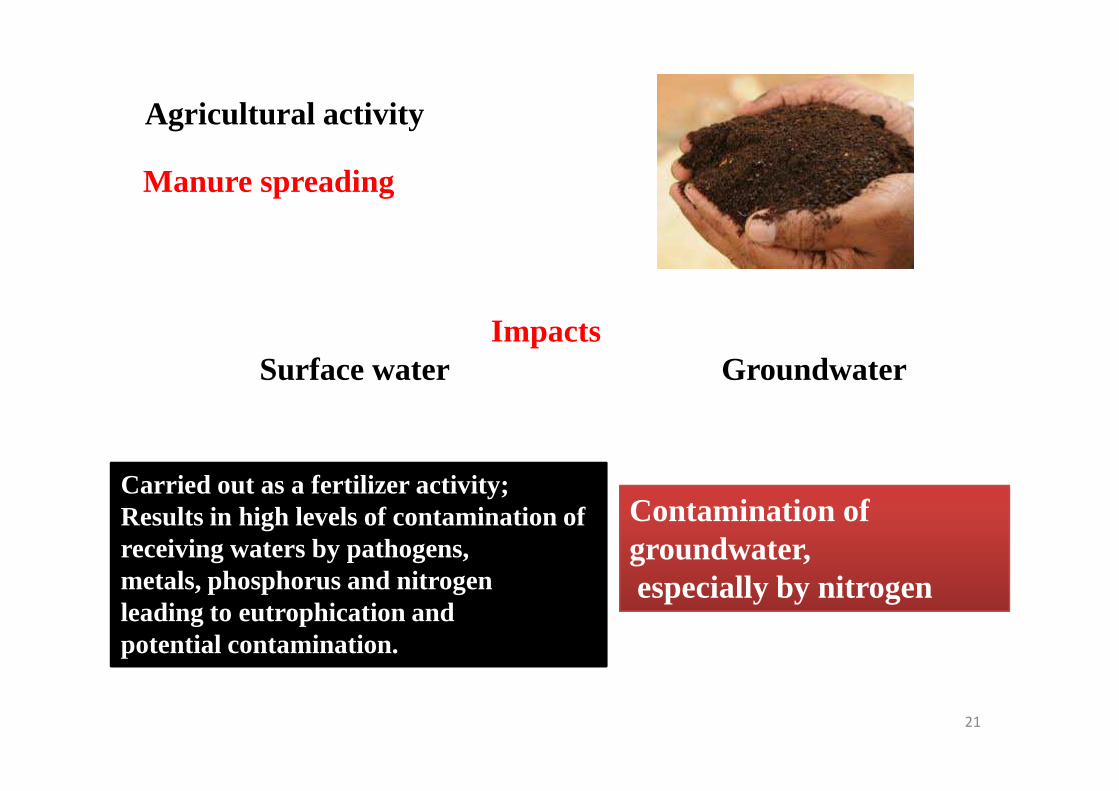
Agricultural activity
Manure spreading
ImpactsSurface water Groundwater
21
Carried out as a fertilizer activity;Results in high levels of contamination ofreceiving waters by pathogens,metals, phosphorus and nitrogenleading to eutrophication andpotential contamination.
Contamination of groundwater,especially by nitrogen

Agricultural activity
5. Irrigation
ImpactsSurface water Surface water GroundwaterGroundwater
22
Runoff of salts leading to salinizationof surface waters; runoff of fertilizersand pesticides to surface waters with ecological damage, bioaccumulation in edible fish species, etc. High levelsof trace elements such as selenium can occur with serious ecological damage and potential human healthimpacts.
Enrichment of groundwater withsalts, nutrients (especially nitrate ). ).
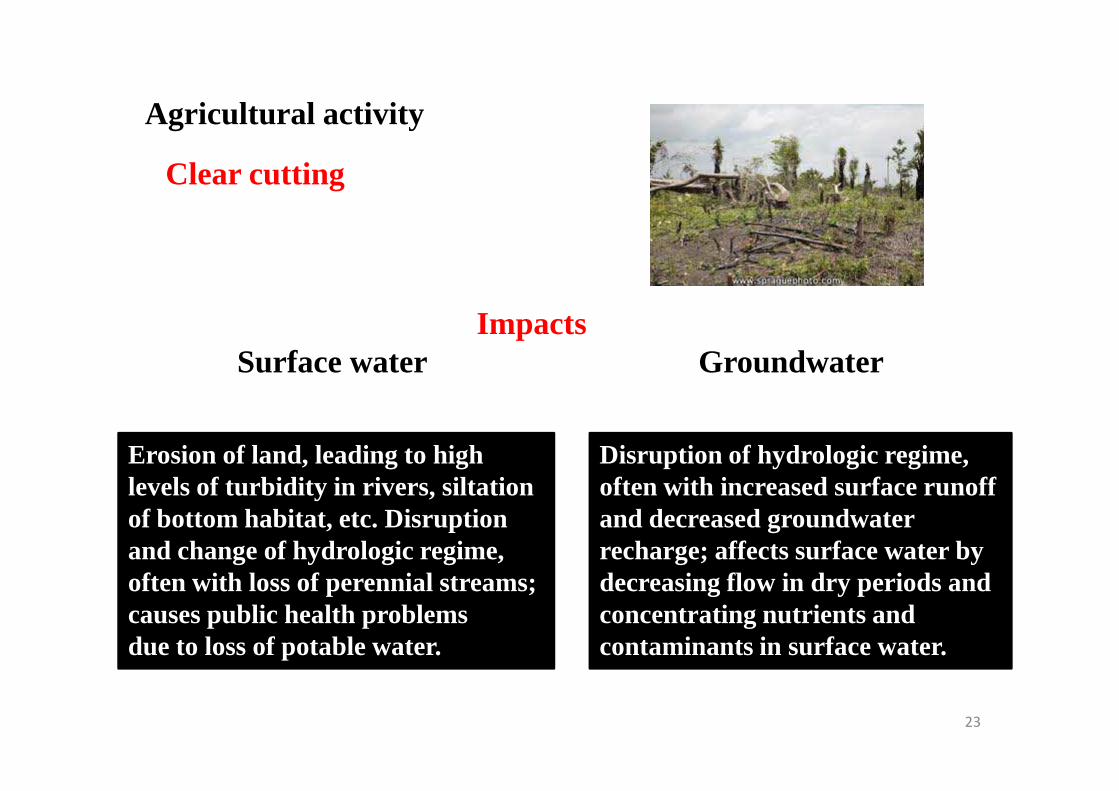
Agricultural activity
Clear cutting
ImpactsSurface water Groundwater
23
Erosion of land, leading to highlevels of turbidity in rivers, siltation of bottom habitat, etc. Disruption and change of hydrologic regime,often with loss of perennial streams;causes public health problems due to loss of potable water.
Disruption of hydrologic regime, often with increased surface runoffand decreased groundwater recharge; affects surface water by decreasing flow in dry periods and concentrating nutrients and contaminants in surface water.

Agricultural activity
24
ImpactsSurface water Groundwater
Broad range of effects: pesticide runoff and contaminationof surface water and fish; erosion and sedimentation problems.

Agricultural activity
Aquaculture
ImpactsImpactsSurface waterSurface water GroundwaterGroundwater
25
Surface waterSurface water GroundwaterGroundwater
Release of high levels of nutrientsto surface water and groundwaterthrough feed and faeces, leadingto serious eutrophication..
• Handling, storage and disposal of chemicalagricultural inputs - cause cancer ,negativelyinfluence reproduction ,disrupt the endocrinesystem etc.
• Pesticide residues in food and drinking water -
Health problems
• Pesticide residues in food and drinking water -cause similar adverse health effects

• Systems of ‘Pokkali’, ‘Kuttanad’ and ‘Kole’-
• Irrigated as well as rain fed rice cultivation- in valleys ofmidlands and highlands
• Catchment area of Kuttand - fertilizer and pesticide
Agriculture Pollution in Kerala
• Catchment area of Kuttand - fertilizer and pesticideconsumption increased significantly over the years
• Plantation Corporation of Kerala -aerial spraying ofEndrin (later Endosulphan) in cashew plantations -severehealth problems
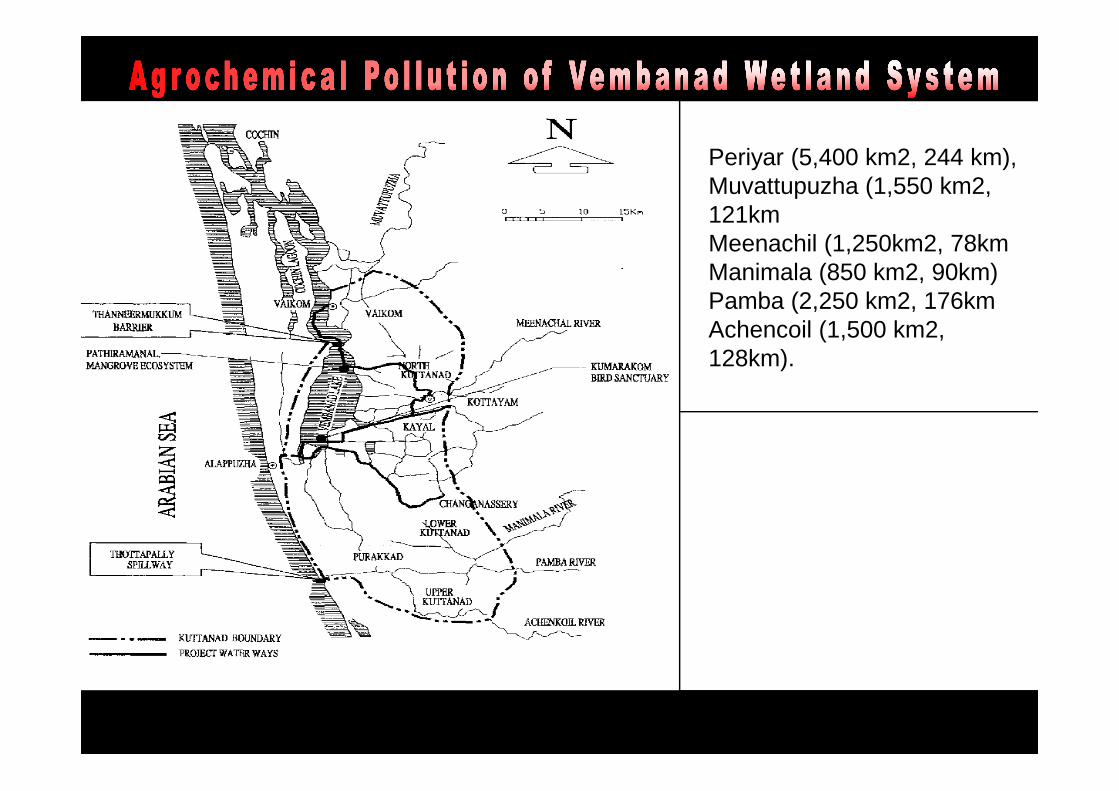
Periyar (5,400 km2, 244 km), Muvattupuzha (1,550 km2, 121km Meenachil (1,250km2, 78km Manimala (850 km2, 90km) Pamba (2,250 km2, 176km Achencoil (1,500 km2, 128km).
Coordinates :
9° 10’ 40” N latitude
76° 77’ 30” E longitude
Area : 151250 haElevation :
0.6 - 2.2 m below MSL

• Input of large quantities of agrochemicals and pesticides
• The annual usage of pesticides/fungicides/weedicides inKuttanad -117 tones during Virippu season , 368 tonesduring the Mundakan and Punchaseason
Pollution of Vembanad backwater system
during the Mundakan and Punchaseason
• Annual fertilizer consumption - 8409 tones of nitrogen,5044 tones of potassium
• Aggressive waterweeds and water pollution

To check the floodwaters from Achenkovil,
Manimala and Pamba Rivers during monsoons, a
spillway was constructed at Thottapally in 1955
which divert the water to the Arabian Sea.
To prevent salt water intrusion and to promote To prevent salt water intrusion and to promote
double crop of rice in about 55000 ha of low lying
fields in the area, a barrage at Thanneermukkom
in the Vembanad Lake was constructed in1975
with facilities for allowing navigation and this
remains closed from December to May every
year.
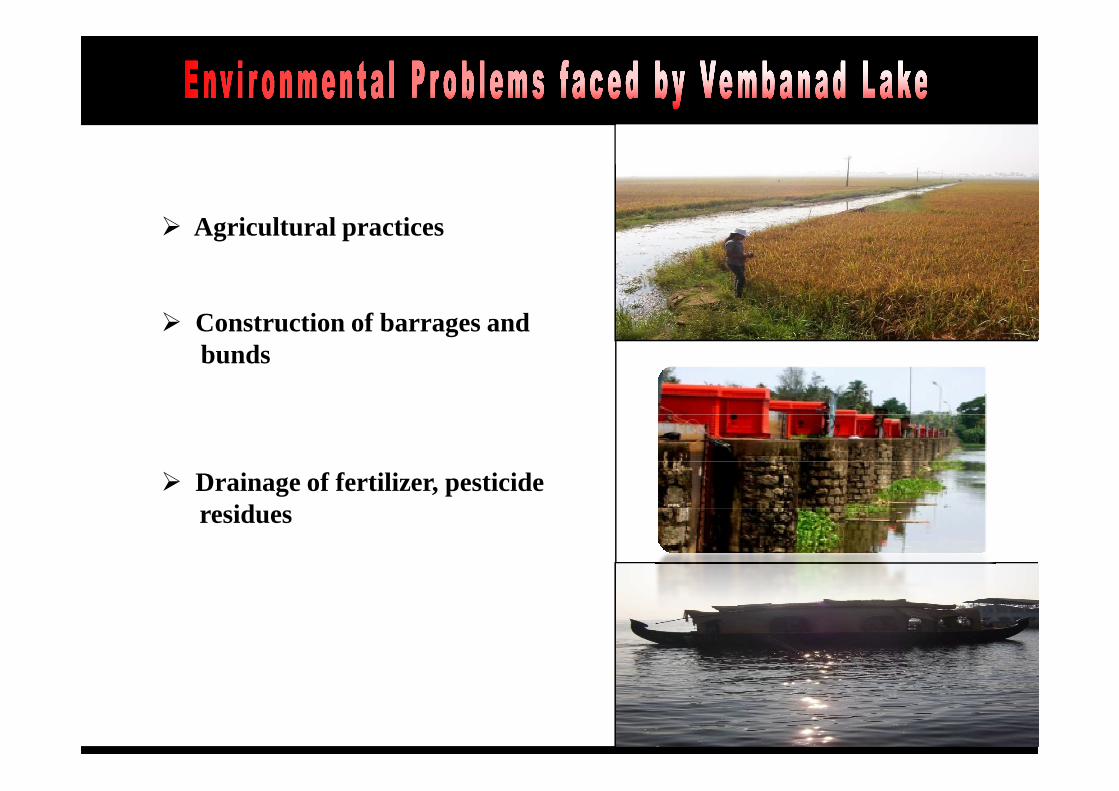
� Agricultural practices
� Construction of barrages and bunds
� Drainage of fertilizer, pesticide residues
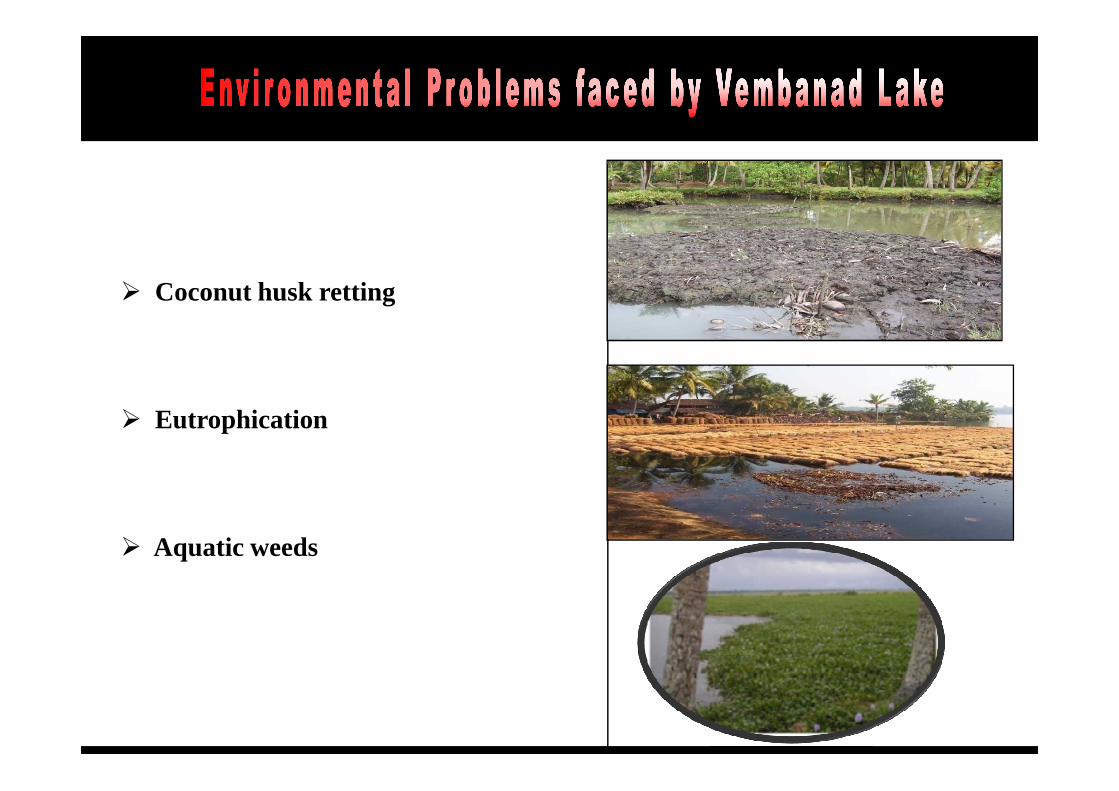
� Coconut husk retting
� Eutrophication
� Aquatic weeds

Sl.No Crop Fertilizers (Tonnes)
N P K
1 Paddy 6839 3666 4721
2 Coconut 914 757 1399
3 Banana 111 77 193
4 Cocoa 67 40 102
5 Vegetables 33 26 29
6 Tapioca/Cassava 18 16 64
7 Plantain 83 82 86
8 Others 344 380 192
Total 8409 5044 6786

Fertilizers
Total agricultural field area in Kuttanad is 56000 ha including 30000 ha in
Alappuzha and 26000 ha in Kuttanad area.
NPK requirement per ha is 90:45:45
�Factomphos - 20:20:0:15 (N: P: K: S)
�Rajphos - 22-24% rock phosphate, suited to the acid environment of Kerala
�Urea - Source of Nitrogen
�Mureto potash -Source of Potassium (400 kg/ha per season)
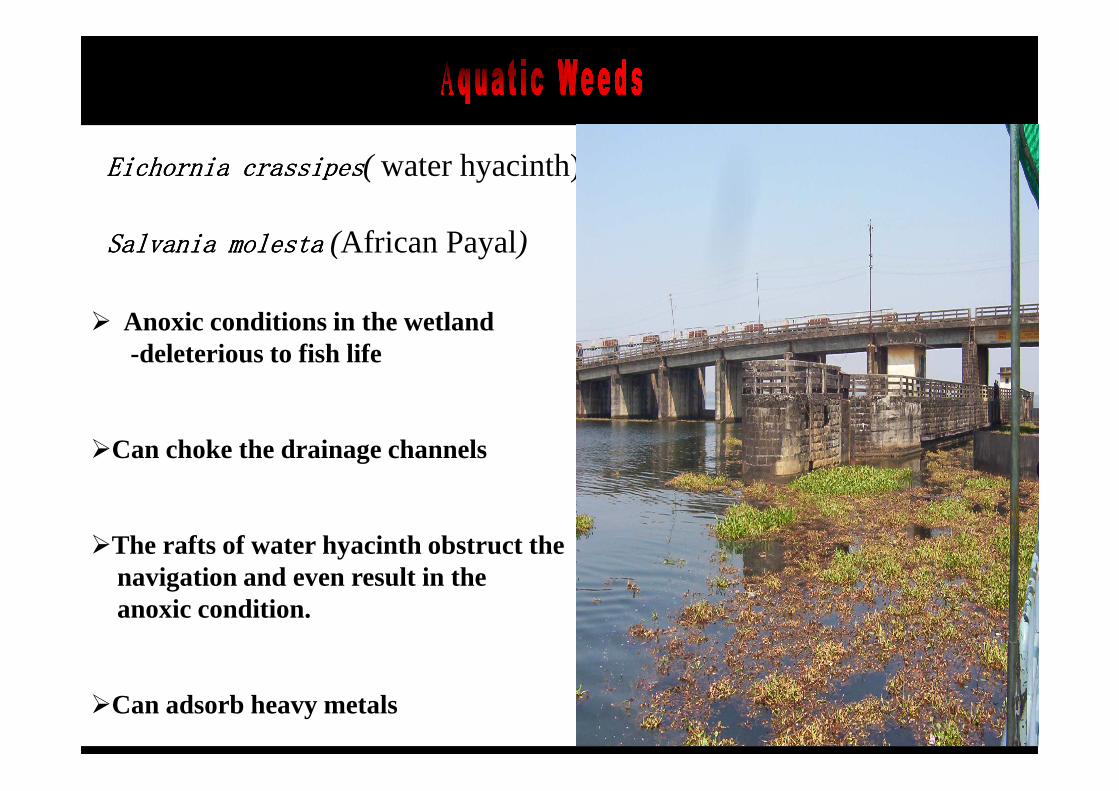
Eichornia crassipesEichornia crassipesEichornia crassipesEichornia crassipes( water hyacinth)
Salvania molestaSalvania molestaSalvania molestaSalvania molesta (African Payal)
� Anoxic conditions in the wetland-deleterious to fish life
�Can choke the drainage channels
�The rafts of water hyacinth obstruct thenavigation and even result in the anoxic condition.
�Can adsorb heavy metals

Production of hydrogen sulfide and releaseof organic substances such as pectin, petosan,fat and tannin by the biological degradationof algae and fungi
The retting yards also act as breeding groundsfor mosquitoes
Kuttanad, -157 million coconut husks are subjected to retting annually covering anarea of 242 ha.
Anoxic condition, excess H2S and increased turbidity drastically reduce the primary productivity of the lake leading considerabledecline in fishery resource
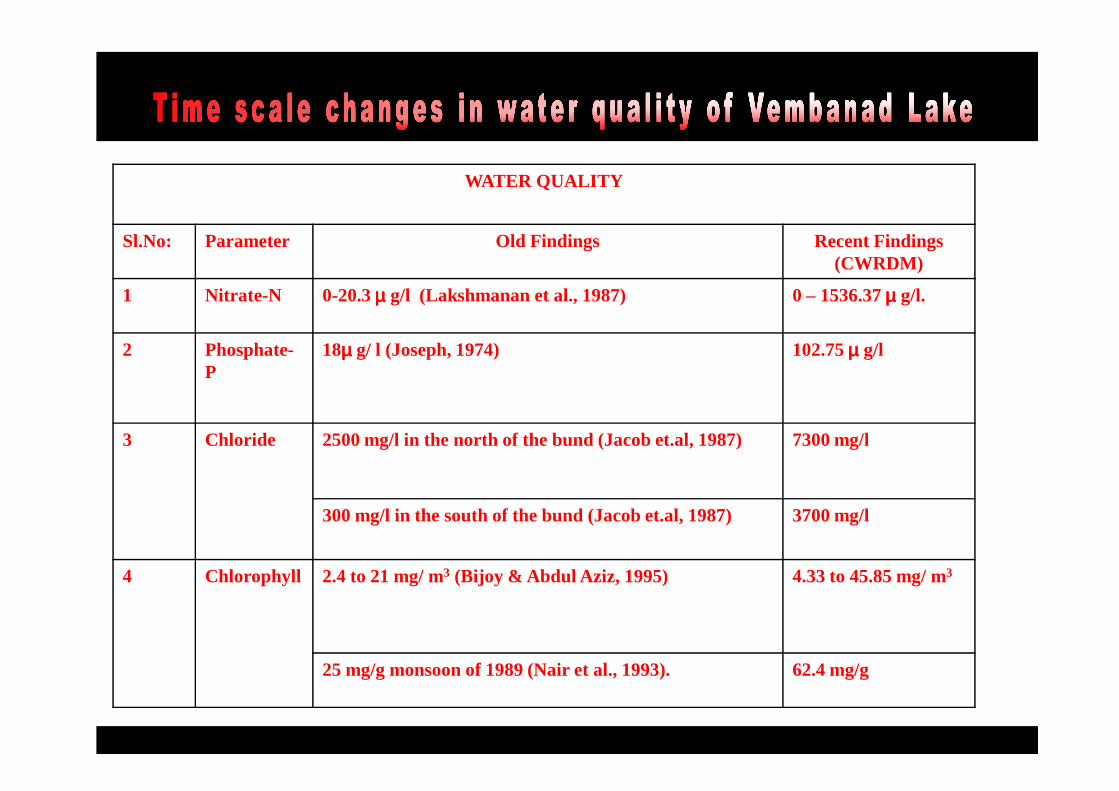
WATER QUALITY
Sl.No: Parameter Old Findings Recent Findings(CWRDM)
1 Nitrate-N 0-20.3µµµµ g/l (Lakshmanan et al., 1987) 0 – 1536.37µµµµ g/l.
2 Phosphate-P
18µµµµ g/ l (Joseph, 1974) 102.75µµµµ g/l
3 Chloride 2500 mg/l in the north of the bund (Jacob et.al, 1987) 7300 mg/l
300 mg/l in the south of the bund (Jacob et.al, 1987) 3700 mg/l
4 Chlorophyll 2.4 to 21 mg/ m3 (Bijoy & Abdul Aziz, 1995) 4.33 to 45.85 mg/ m3
25 mg/g monsoon of 1989 (Nair et al., 1993). 62.4 mg/g

Sl.No: Parameter Old Findings Recent Findings (CWRDM)
5 Manganese 141 to 337 µµµµ g / g in the year 2000 404.76 to 785 µµµµ g / g.
6 Organic carbon
35 mg/g pre-monsoon of 1989 (Nair et al., 1993).
99.5 mg/g
25 mg/g monsoon of 1989 (Nair et al., 1993).
62.4 mg/g

�Chlorophyll is to be having high value inthe range 4.33 to 45.85 mg/ m3.
�High chlorophyll value (2.4 to 21 mg/ m3)was reported in Vembanad Lake
�Gross primary productivity shows avertical decrease from 0.0004718 mg C/m3/hr in the surface to zero in thebottom during monsoon seasonbottom during monsoon season
�Luxuriant growth of plants in some partsof the lake indicates the nutrient rich condition in the lake.
�The system is found to be eutrophic innature, especially the tourism areaswhere the chlorophyll content and thenutrients are found to be high and DO isfound to be very less.

Herbicides: � Fernoxone, 2,4-D- (2,4-Dichlorophenoxy acetic acid, for control of
broad leaved weeds and sedges.
� Clinchure 10/EC - Cyhalofop butyl,for control of Echinochlora sp.
� Sofit 30/EC - Pretilachlor and safener� Sofit 30/EC - Pretilachlor and safener
Fungicides:� New generation chemicals are used and are supposed to be dissipating
in 30 days and so they are not harmful.
�run–off
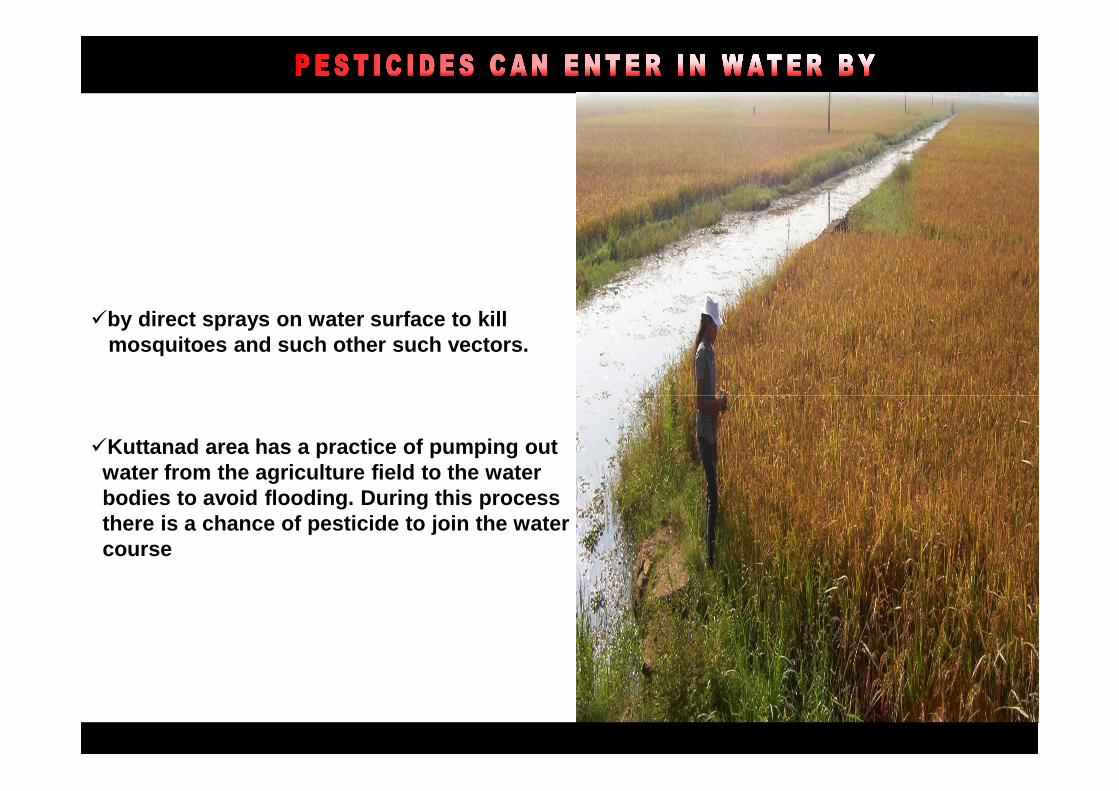
�by direct sprays on water surface to kill mosquitoes and such other such vectors.
�Kuttanad area has a practice of pumping out water from the agriculture field to the water bodies to avoid flooding. During this process there is a chance of pesticide to join the water course

Wetland rice soils - high concentration of iron and manganese manganese
Run off from the agricultural fields during rainyseason
Practice of pumping out flooded water from ricefields to the nearby canals

� The concentration of the nutrients, shallow nature, lower secchidepth values (average 1.50m) and chlorophyll concentrationhigher than 30µµµµg/l indicate that the water column of the lake isin euphotic zone.
� The analysis of the water and sediment also reveals the extentof eutrophication at the southern part of the lake.
� The eutrophication is also determined to be influenced byoperation of the Thaneermukkom barrage an interventionconstructed to prevent salinity intrusion during summermonths.


Water column of the lake is in euphotic zone
�concentration of the nutrients�shallow nature�lower secchi depth values (average1.50m) �chlorophyll concentration higher than 30 µµµµg/l indicate
Extent of eutrophication at the southern part of the lake
When the barrage is closed the nutrients have the tendency to concentrate in the lake
Bottom turbulence and tidal influencephosphorous to the epilimnion section (average
phosphorous 20 mg/kg)
plankton production

Habit Species
‘Free’ floating Eichornia crassipesSalvania molests
Rooted and floating Nymphaea stellataNymphoea nouchali
Nymphoides cristatumNymphoides indicum
Aquatic weeds of Vembanad Lake
Nymphoides indicum
Rooted and submerged Hydrilla verticellataNajas minor
Limnophila heterophyllaAponogeton crispium
Potamogeton pectinatus
Emergent/littoral Scripus validusCyperus corymbosusIschaemum barbatum

The results indicate that a reduction of 12.5 % of the
existing load of phosphorous may be necessary to achieve
the targeted reduction in chlorophyll value <10 so as to the targeted reduction in chlorophyll value <10 so as to
bring the lake to mesotrophic/oligotrophic level

Pesticides

Conflicting uses of pesticides - agricultural and domestic
Two methods of classifying pesticides
a) according to chemical classb) according to their intended use

Health Effects of PesticidesHealth Effects of Pesticides
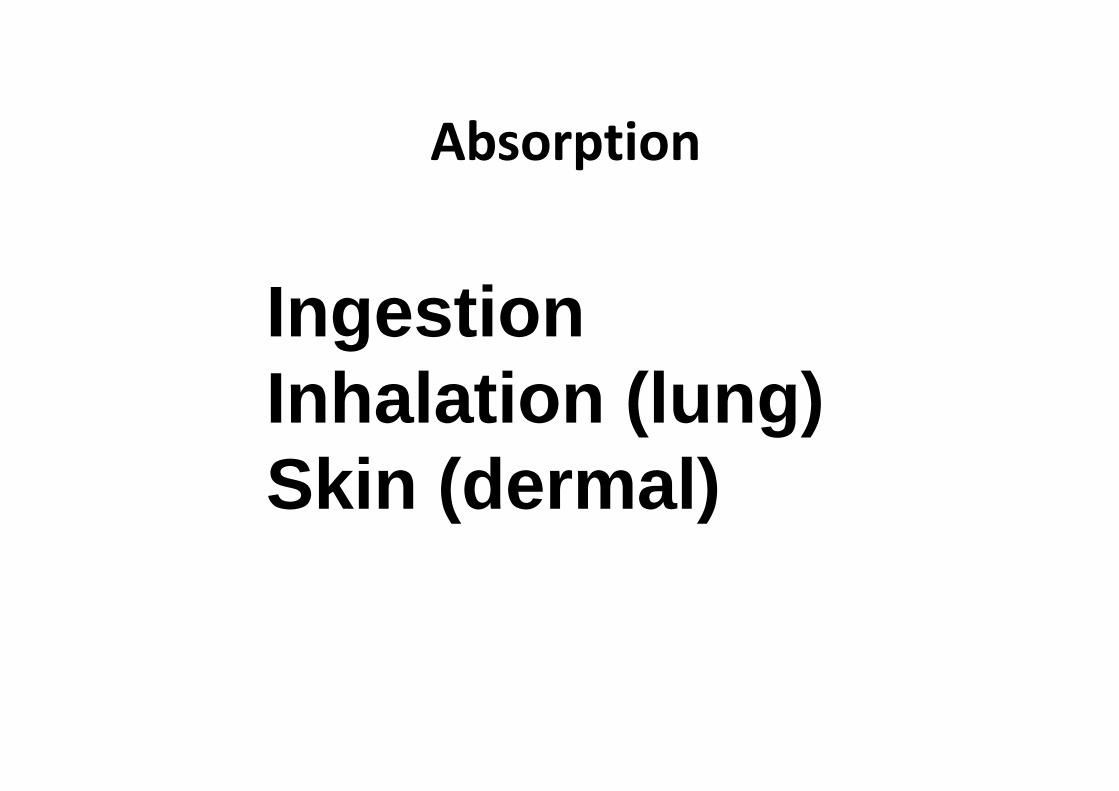
IngestionInhalation (lung)
Absorption
Inhalation (lung)Skin (dermal)

Insecticides
� Insecticides (kill insects)� Insecticides (kill insects)• Organochlorines• Organophosphates• Carbamates• Synthetic Pyrethroids

Mechanism of ActionMechanism of Action
Oganochlorines & Pyrethroids- Enzymes, axonal membranes
(Na+, K+, Ca++, Cl-)
Organophosphates & Organophosphates & Carbamates
- excess acetylcholine

�DDE (1,1-dichloro-2, 2-bis (P-chlorophenyl) Ethylene) - C hanganacherry.
� BHCThe concentration range from a maximum of 38.35 mg/kg to a min imumof 6.35 mg/kg.

Core sediment samples
Lindane(16.15mg/Kg), aldrin endo-alpha, dieldrin, DDE, endo-beta (2.02 mg/Kg )and DDD (1.06mg/Kg)
Variation of organochlorine pesticides in the sediment core of Vembanad Lake
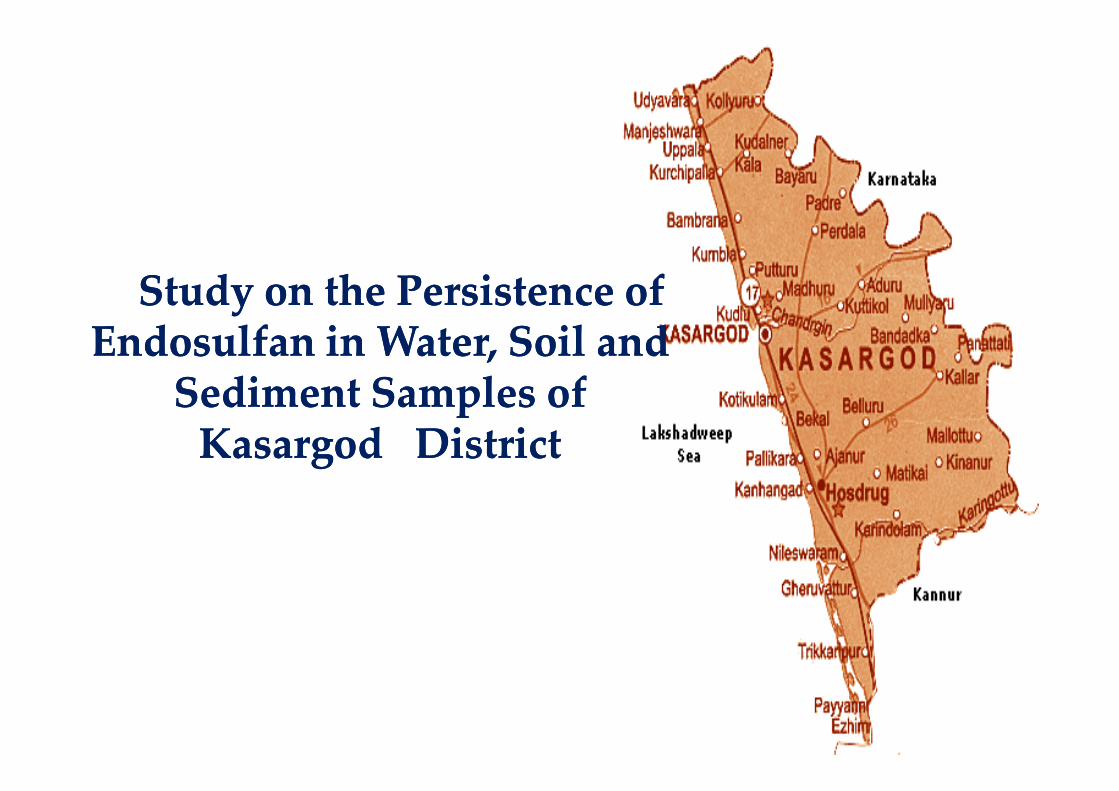
Study on the Persistence of Study on the Persistence of Endosulfan in Water, Soil and Endosulfan in Water, Soil and
Sediment Samples of Sediment Samples of Sediment Samples of Sediment Samples of KasargodKasargod DistrictDistrict

�Endosulfan - a Persistent Organic Pollutant (POP)
�Recognized by UNEPto be a Persistent Toxic Substance.
Toxicity Classification
� U S Environmental Protection Agency (EPA) has classified endosulfan as Category 1b – Highly Hazardous.
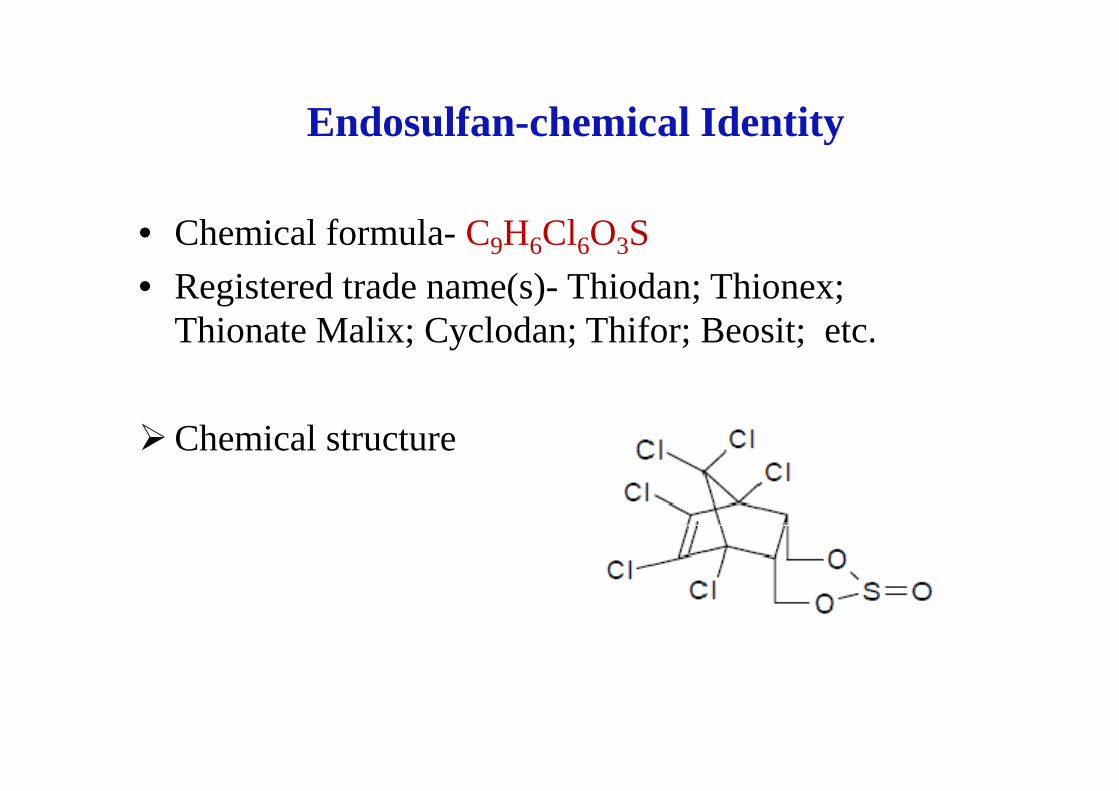
Endosulfan-chemical Identity
• Chemical formula-C9H6Cl6O3S
• Registered trade name(s)- Thiodan; Thionex; Thionate Malix; Cyclodan; Thifor; Beosit; etc.
�Chemical structure
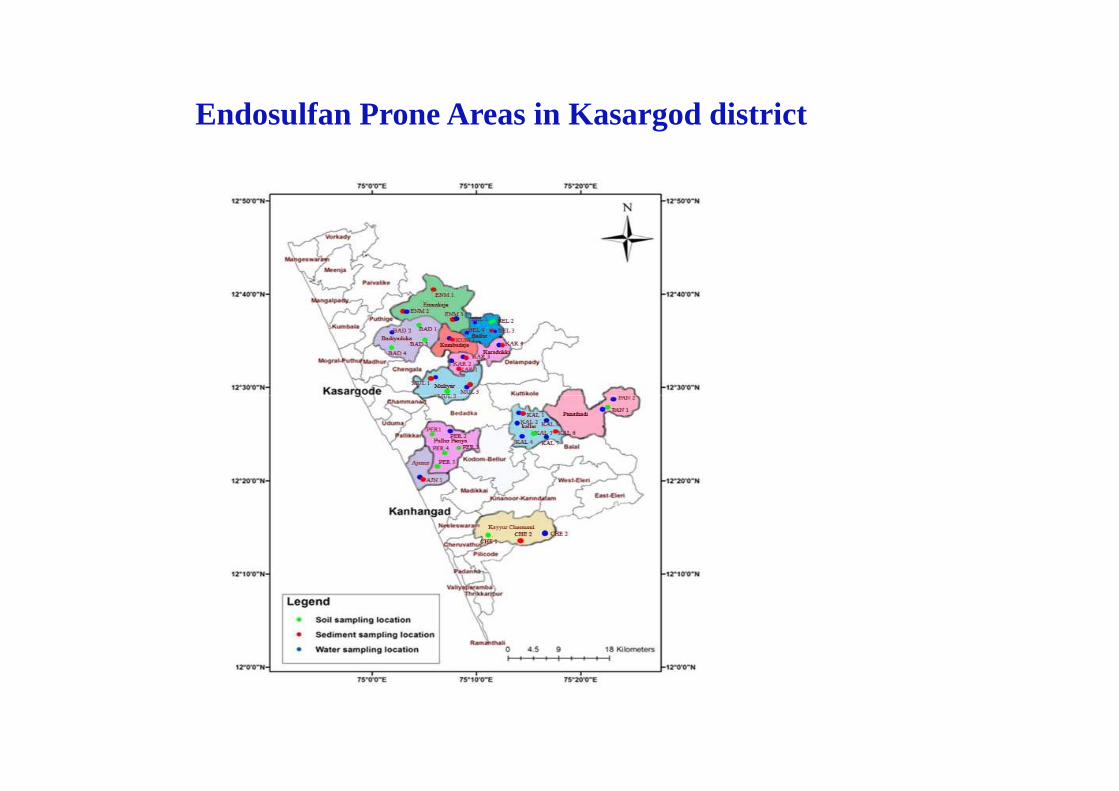
Endosulfan Prone Areas in Kasargod district
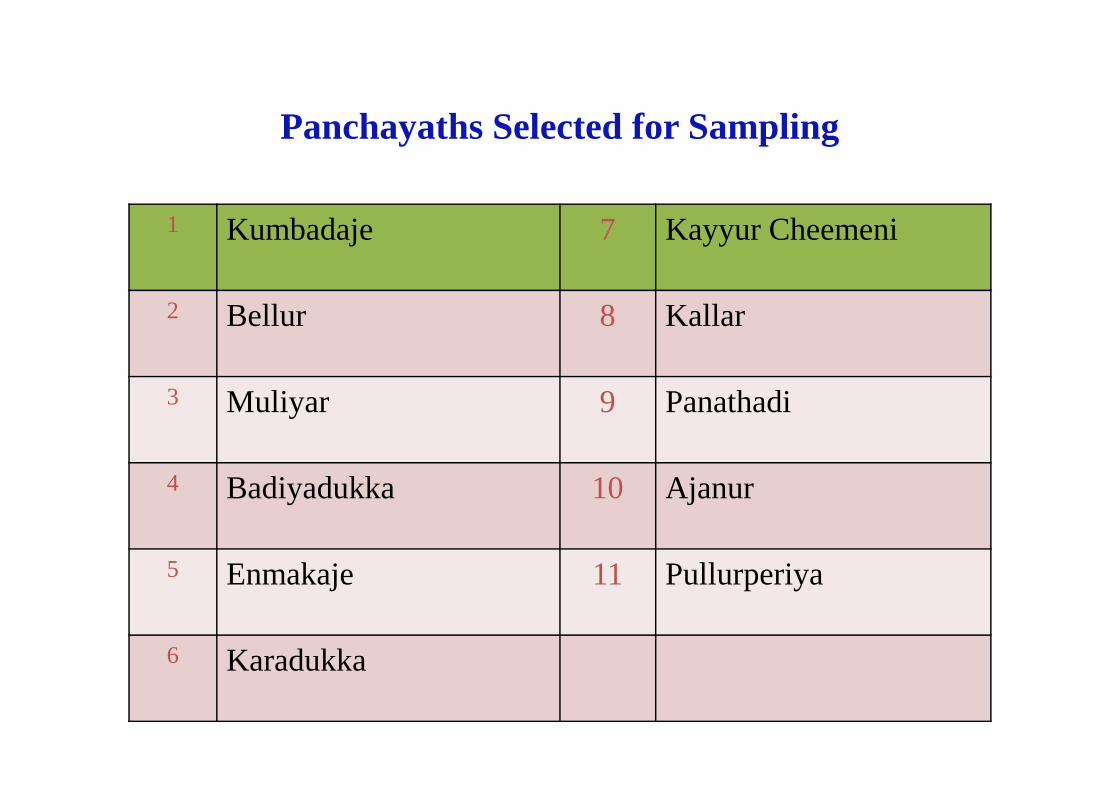
Panchayaths Selected for Sampling
1 Kumbadaje 7 Kayyur Cheemeni
2 Bellur 8 Kallar
3 Muliyar 9 Panathadi3 Muliyar 9 Panathadi
4 Badiyadukka 10 Ajanur
5 Enmakaje 11 Pullurperiya
6 Karadukka

Study on the impacts of agrochemicals on a Micro Watershed in Kozhikode District
VELLANUR WATERSHED MAP

• Sediment/erosion control
• Confined animal facility
• Nutrient management
• Livestock grazing
Management measures
• Livestock grazing
• Effective irrigation system
• Control of phosphorus from point and diffuse sources
• Integrated Pest Management
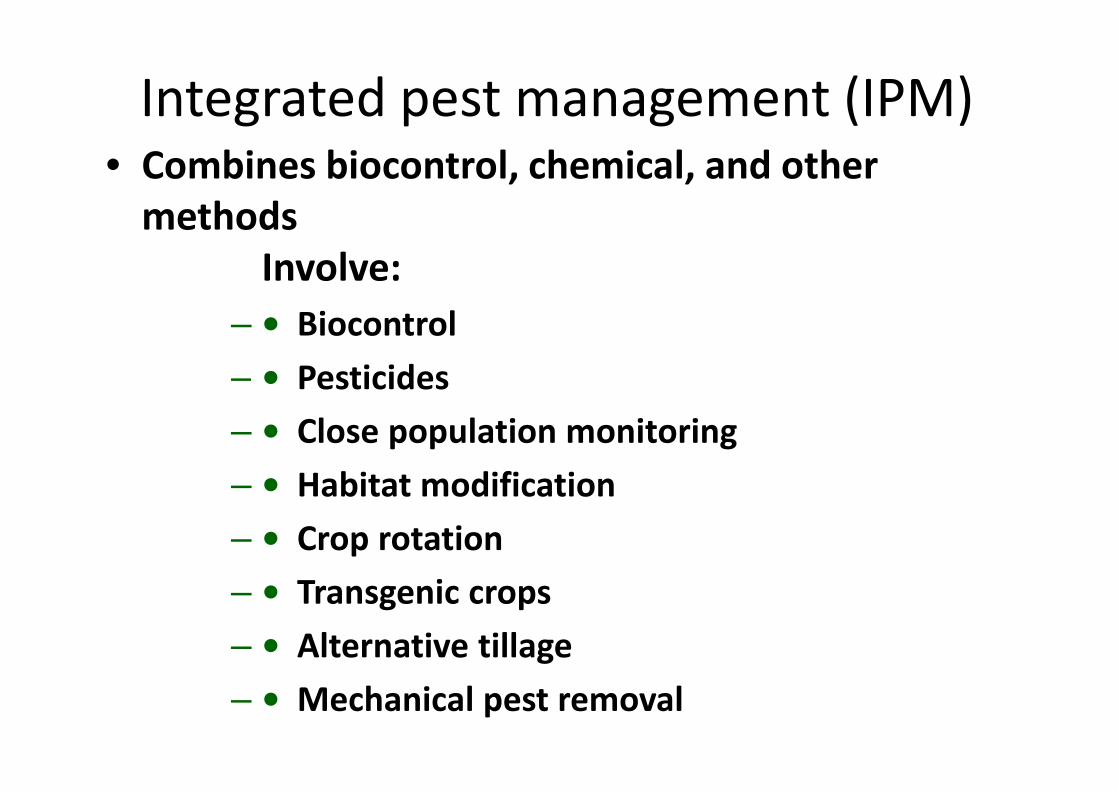
Integrated pest management (IPM)• Combines biocontrol, chemical, and other
methods
Involve:
– • Biocontrol
– • Pesticides– • Pesticides
– • Close population monitoring
– • Habitat modification
– • Crop rotation
– • Transgenic crops
– • Alternative tillage
– • Mechanical pest removal

Biological control
• Synthetic chemicals can pollute and be health hazards.
• Biological control (biocontrol) avoids this.
• Biocontol entails battling pests and weeds with • Biocontol entails battling pests and weeds with other organisms that are natural enemies of those
pests and weeds.
• (“The enemy of my enemy is my friend.”)