agriculture and agrifood: choosing the future › userfiles › file › caaaq_angl.pdf · an...
TRANSCRIPT
Agriculture andAgrifood: Choosing the FutureConsultation document
An invitation to participate 3
1 The food requirementsof the population 6
2 Agricultural production 9
3 Food processing 15
4 Distribution of food produce 18
5 Foreign trade in agricultural andagri-food products 22
6 Human resource development 25
7 Agriculture, agri-foodand the environment 29
8 Health and consumer concerns 33
9 Rural life and regional development 37
10 Governance 40
How to participate 43
References 46
Table of Contents
2
Commission sur l'avenir de l'agriculture et de l'agroalimentaire québécois
Jean Pronovost, chairmanMario Dumais, commissionerPascale Tremblay, commissioner
Suzanne Dion, secretary general
RESEARCH AND TEXTDenis Cormier, research directorJean Dionne, communications directorJean-François Aubin, analystJacques Bélanger, analystMichel Carignan, analystBertrand Venne, analyst
ASSISTANCEEco Ressources Consultants
PRODUCTION COORDINATIONGino Desrosiers, communications advisor
TECHNICAL SUPPORTOdette Côté, administrative assistantSylvie Jolicoeur, administrative assistantFrance Pelletier, communications advisor
LINGUISTIC REVISIONPierre Senéchal
ENGLISH TRANSLATIONBenjamin WaterhouseChristine Gardner
LAYOUTFolio et Garetti
PHOTOGRAPHS Guy Tessier
Ce document est également disponible en français
© Commission sur l'avenir de l'agriculture et de l'agroalimentaire québécoisLegal deposit: Bibliothèque nationale du Québec, January 2007
ISBN 978-2-550-48761-6 (print version)ISBN 978-2-550-48762-3 (PDF)

3
The primary mission of Quebec’sagriculture and agri-food sector is to contribute toward feeding people,in Quebec and around the world. Whilemeeting our vital need for food, thesector also produces non-comestiblegoods such as fibre, horticulturalproducts and bio-energy. As a result,it is at the heart of a number ofsocietal issues that concern everybody.
Production, processing anddistribution, including activities in the hotel, restaurant and institutional(HRI) sector, are economic activitiesthat generate wealth, jobs andexports. Currently, the agri-foodsector in Quebec employs some452,000 people.
For those who make their living fromagriculture, it is a lifestyle as well as a source of great personal and familysatisfaction. A number of specificskills are required to be successful.Training, advisory services, researchand innovation are therefore ofstrategic importance.
In 2001, Quebec hadapproximately 47,390 farmproducers working on 30,539farming operations.
An invitationto participate
Graph 1 – BREAKDOWN OF JOBS INQUEBEC’S AGRI-FOOD SECTOR
Distribution and HRI: 71 %
Processing: 16 %
Production: 13 %

Agriculture is the territorial foundationof Quebec’s rural fabric. By definition,it is the primary and most stablefactor in the dynamic occupation ofthe land. It plays a significant role inshaping Quebec’s landscape as wellas its economic development.
Because agriculture occupies such a large percentage of Quebec’sinhabited land mass, it has a majorimpact on our environment. Farmproduction methods that arerespectful of water, soil and air qualitytherefore benefit the entire population.
Agriculture and the agri-food sectorare core elements in any strategydesigned to protect and promotehealth. Long before medical carebecomes necessary, healthy livinghabits, including eating a variety of healthy foods, are key factors in determining our individual andcollective health.
Every one of these issues comes withits own set of problems and upheavals.Some have gone so far as to use theterm crisis. Yvon Vallières, Minister,Ministère de l’Agriculture, des Pêcherieset de l’Alimentation du Québec, hadthis to say when introducing theCommission members:
“Our business environment isbecoming increasingly constrainedas a result of elements such as thefarm income crisis, chronically lowcereal prices, problems in the porksector, the mad cow crisis, threatsto supply management and thestrength of the Canadian dollar.There are also a number ofparadoxes, such as rising landprices, soaring quota costs and continued increases in the volumeof farm gate sales. At the sametime, short-term crises have tendedto disguise some major long-termtrends, namely the leveling-off of farm prices, rising costs andincreasingly strong competition.”
Over the years, society’s expectationsof the men and women whose job it is to feed the population haveincreased and become more complex.The precarious financial situation ofQuebec’s farms, along with high debtand stress levels and the problem ofinter-generational farm transfers, arethe most common difficulties currentlyfaced by the sector.
The farming profession is demandingin terms of time and training, as wellas personal and financial investment.Farmers are expected to producemore efficiently, in terms of quantityand quality, to satisfy the increasinglydiverse tastes of consumers, and atthe same time they are asked to helpimprove Quebec’s exports—all withina context of worldwide competitionwhere food product prices are tendingto stagnate or decline and productioncosts are rising steadily.
In the rural community, agriculture is no longer the only, nor even themajority, stakeholder. City dwellers are moving out to the country, andalong with the peri-urban populationand other rural inhabitants, they arebeginning to express new values.They are also making new demandsconcerning the impact of farming on the quality of the environment.
Today, Quebec’s farmingpopulation accounts for just6.4% of the total ruralpopulation.
4
Farm size is increasing, while farmnumbers are declining steadily. Thishas clearly had an impact on thedynamics in rural communities.
Growing public concerns about healthand food quality also have an impacton agriculture and the food industry.At the same time, the trust betweenconsumers and the food production,processing and distribution chain hasbeen eroded.
Some people believe technologicalinnovations, such as the introductionof GMOs, pose a threat to humanhealth, livestock health, biologicaldiversity and the environment.
Processing companies, for their part,feel trapped between producers,distributors and the demands ofinternational competition.
Some observers believe it is now time to re-examine the system usedto govern the sector’s institutions. The question is this: should therelationships between the players in the sector be adjusted and theirroles updated to meet the challengesof the future?
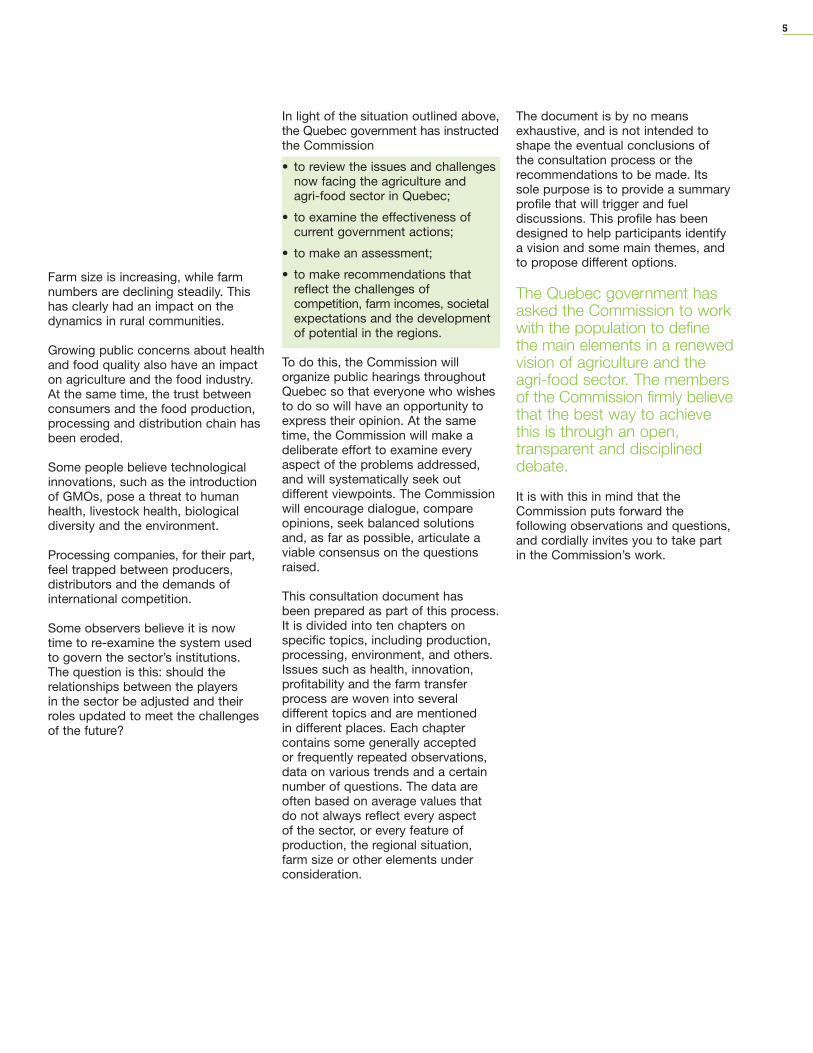
In light of the situation outlined above,the Quebec government has instructedthe Commission
• to review the issues and challengesnow facing the agriculture and agri-food sector in Quebec;
• to examine the effectiveness ofcurrent government actions;
• to make an assessment;
• to make recommendations thatreflect the challenges ofcompetition, farm incomes, societalexpectations and the developmentof potential in the regions.
To do this, the Commission willorganize public hearings throughoutQuebec so that everyone who wishesto do so will have an opportunity toexpress their opinion. At the sametime, the Commission will make adeliberate effort to examine everyaspect of the problems addressed,and will systematically seek outdifferent viewpoints. The Commissionwill encourage dialogue, compareopinions, seek balanced solutionsand, as far as possible, articulate aviable consensus on the questionsraised.
This consultation document has been prepared as part of this process.It is divided into ten chapters onspecific topics, including production,processing, environment, and others.Issues such as health, innovation,profitability and the farm transferprocess are woven into severaldifferent topics and are mentioned in different places. Each chaptercontains some generally accepted or frequently repeated observations,data on various trends and a certainnumber of questions. The data areoften based on average values thatdo not always reflect every aspect of the sector, or every feature ofproduction, the regional situation,farm size or other elements underconsideration.
The document is by no meansexhaustive, and is not intended toshape the eventual conclusions of the consultation process or therecommendations to be made. Itssole purpose is to provide a summaryprofile that will trigger and fueldiscussions. This profile has beendesigned to help participants identifya vision and some main themes, andto propose different options.
The Quebec government hasasked the Commission to workwith the population to definethe main elements in a renewedvision of agriculture and theagri-food sector. The membersof the Commission firmly believethat the best way to achievethis is through an open,transparent and disciplineddebate.
It is with this in mind that theCommission puts forward thefollowing observations and questions,and cordially invites you to take partin the Commission’s work.
5
The population must not only be fed,it must also be well fed. The growingprevalence of obesity, along with therelated problems of diabetes andcardiovascular disease, has led to the emergence of a number of publichealth issues that are of concern tothe agriculture and agri-food sector.One of these issues is the need tocreate an environment that willencourage as many people as possibleto adopt healthy eating habits.
THE QUEBEC MARKET
A number of social and demographiccharacteristics influence our foodrequirements. Since populationgrowth and consumption are relativelystable, the volume of food consumedin Quebec is expected to level out inthe future.
The portion of total income spent on food in Quebec and Canada isshrinking. Between 1997 and 2004, it fell from 13.2% to 12.5% in Quebec,and from 11.5% to 10.9% in Canada.1
Rising life expectancy and averageage, the shrinking size of households,higher education levels, changingvalue systems and cultural diversitywill all have an impact on the demandfor food.
The population is ageing, in bothQuebec and Canada. The Institut de la statistique du Québec (ISQ)forecasts that the portion of thepopulation aged 50 and over will risefrom 31% in 2001 to 44% in 2036.2
The first members of the Baby Boomgeneration turned 60 in 2006, and are now beginning to retire. In the last 20 years, the number of peoplein Quebec aged 65 and over has
increased, while the number aged 15 and under has declined.
According to ISQ forecasts, by 2010 the over-65 age groupwill have overtaken the under-15group in terms of size.
Based on the reference scenario usedby the ISQ to forecast demographictrends, the Quebec population shouldstop growing in 2031, at which point it will stand at nearly 8.1 millionpeople.3 The demographic curve isthen expected to descend, slowly atfirst, but picking up pace over time.
Because of its ageing population,Quebec’s consumer food sector will probably offer some interestingprospects for the development ofproducts that address concernsrelating to health and old age.
Quebec’s agriculture and agri-food sector ensures a secure supply of food for people both at home and abroad. In an increasingly
inter-related world, it is part of aneconomic network that spans markets in Quebec, Canada and the world,creating a flow of exports and imports to meet the population’s foodrequirements.
1The foodrequirements of thepopulation

Consumers are increasingly sensitiveto the composition and nutritive valueof the food they eat, and are seekinga better dietary balance. Consumersare also increasingly concerned withfood quality and safety. Faced with apopulation that wants to remain activeand healthy for as long as possible,the agriculture and agri-food sectorwill probably have to concentrateeven more on the quality aspect of itsproducts.
Obesity and its complications, alongwith many cardiovascular disorders,have food-related causes thatscientists and the general public nowunderstand fairly well. In the future,Quebec’s food sector will probablyoffer many opportunities for thedevelopment of products that addressthe health concerns of the population.
Families are busier than ever before,and their time is at a premium. Inmany families, both spouses workand have less time to spend onpreparing meals. These trends havebeen clear for some time, and there isevery indication that they will continuein the future. Consumers are thereforeseeking healthy foods that can beprepared quickly and easily.
The number of people per householdis falling, and the trend now is towardshouseholds composed of one or twopeople (63% of all households in2001).4 The number of childlesscouples and the growing numbers ofyoung adults (20 to 29 years of age)who live with their parents also havean impact on consumer habits.
The impact of the cultural communitieson society is significant. They havetheir own dietary preferences thatinfluence, at least to some extent, the variety of foods stocked in localmarkets, thus contributing to changesin consumer habits.
In the 1990s, consumers graduallybegan to incorporate ethical, politicaland environmental considerations intotheir food and consumption choices.This ongoing trend has led to theemergence of new requirements forcompliance with certain valuesapplicable to production, processingand distribution activities.Considerations such as animalwelfare, local or regional production,environmental certification, fair trade,ecological products and organicfarming now have an influence onconsumer choices.
The media have played, and willcontinue to play, a leading role inshaping eating trends. Famous chefshave become household names. The quality and nutritional value offood products, along with questionsof taste, are discussed in newspaperand magazine articles and on radioand television, helping to changeconsumer perceptions and choices.
The Commission invitesparticipants to think about theprincipal changes influencing thedemand for food products:
• Is Quebec’s agriculture and agri-food sector fully prepared to respond to present and futureconsumer needs?
• What do you think of publichealth issues, in particular thecreation of settings moreconducive to healthy eatinghabits?
7

8
WORLD DEMAND FOR FOODPRODUCTS
According to studies published by the Food and Agriculture Organization(FAO),5 the world population isincreasing by more than 70 millionpeople per year, and will level off atroughly 9.3 billion in 2050. Most ofthis growth will take place in Asia,Africa and Latin America. Forty-fivepercent of the world’s population lived in cities in 1995, a figure that is expected to rise to 60% by 2015.Clearly, this will have a significantimpact on farming.
Demographic growth, rising incomelevels, changing diets and rising per-capita consumption all influencethe demand for food. The averagedaily per-capita food consumption will rise in developing countries; in the developed world, it is already atpeak levels.
According to FAO forecasts for the period 2000 to 2030,the demand for farm productswill increase by 60%, and willhave doubled by 2050.
Diets will also change. The Organisationfor Economic Co-operation andDevelopment (OECD) and the FAO6
estimate that most of the increase inper-capita food consumption will befor animal protein. This is due to theincrease in per-capita income in manyparts of the world. As incomes rise,people choose to consume meat,eggs and dairy products morefrequently, instead of eating onlycereals such as rice, corn and millet.
The combined effect of changingdiets and demographic growthcaused world consumption of meat to almost quadruple in the period1950 to 1997. The FAO forecasts an additional increase of 23% for the period 2006 to 2015.
The FAO also forecasts that worldfood production should normally besufficient to meet this demand in thecoming decade. Production will beincreased among other things throughnew production technologies, largercultivated areas, more intensecultivation, better yields, the use ofbiotechnologies and more suitablevarieties, better public informationand research.
On the other hand, the problem of the gap in food availability, due mainlyto access and distribution difficulties,will continue to exist, especially indeveloping countries where, eventoday, some 776 million people do not have enough to eat.
The Commission would likeparticipants to reflect on andpropose solutions to the followingquestions:
• How should Quebec respond tothe dynamics of world trade inagricultural and agri-foodproducts?
• Should the anticipated increase in world demand for animalprotein be seen as an opportunityfor Quebec’s agri-food sector?
POVERTY, ABUNDANCE ANDWASTAGE
Significant quantities of farm produceand food stuffs are lost at every levelof the food chain. American researchestimates that between 40% and50% of all the food produced,processed and distributed neverreaches consumers due to cumulativelosses along the way.
The average American familywastes 130 kg of food peryear.7 Although precise figuresare not available for Quebecand Canada, it is reasonable to assume that consumerbehaviour is more or less the same.
Food banks do their best to use safefood resources that would otherwisebe discarded, directing them towardsunderprivileged segments of societyincluding many children. Socialgroups regularly criticize the paradoxof a society of abundance and wastein which Quebecers of all agesregularly miss meals because theysimply cannot afford them. Consumergroups also point out the weaknessesof the distribution network in poorneighbourhoods, especially withregard to fruits and vegetables.
The Commission would like toreceive comments andrecommendations on this subject.
• How can the agriculture and agri-food sector help combatunder nourishment andmalnutrition?
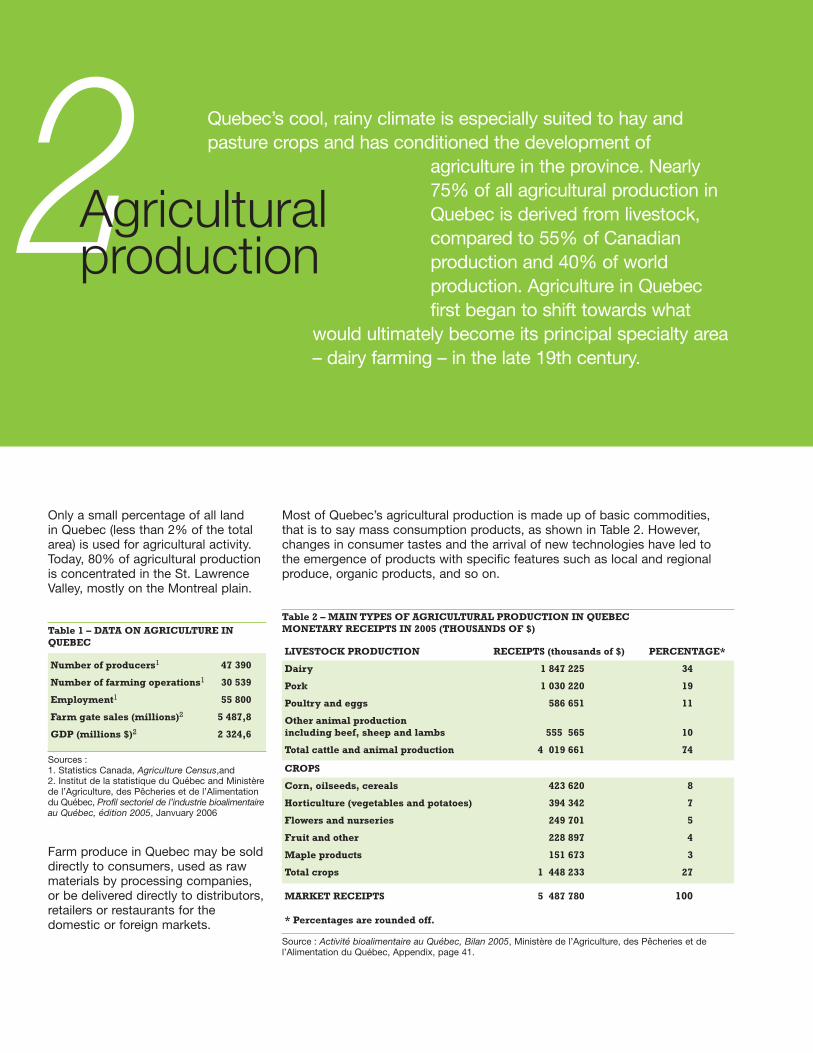
Only a small percentage of all land in Quebec (less than 2% of the totalarea) is used for agricultural activity.Today, 80% of agricultural productionis concentrated in the St. LawrenceValley, mostly on the Montreal plain.
Table 1 – DATA ON AGRICULTURE INQUEBEC
Number of producers1 47 390
Number of farming operations1 30 539
Employment1 55 800
Farm gate sales (millions)2 5 487,8
GDP (millions $)2 2 324,6
Sources : 1. Statistics Canada, Agriculture Census,and 2. Institut de la statistique du Québec and Ministèrede l’Agriculture, des Pêcheries et de l’Alimentationdu Québec, Profil sectoriel de l’industrie bioalimentaireau Québec, édition 2005, Janvuary 2006
Farm produce in Quebec may be solddirectly to consumers, used as rawmaterials by processing companies,or be delivered directly to distributors,retailers or restaurants for thedomestic or foreign markets.
Quebec’s cool, rainy climate is especially suited to hay andpasture crops and has conditioned the development of
agriculture in the province. Nearly75% of all agricultural production inQuebec is derived from livestock,compared to 55% of Canadianproduction and 40% of worldproduction. Agriculture in Quebecfirst began to shift towards what
would ultimately become its principal specialty area– dairy farming – in the late 19th century.
2Agriculturalproduction
Table 2 – MAIN TYPES OF AGRICULTURAL PRODUCTION IN QUEBEC MONETARY RECEIPTS IN 2005 (THOUSANDS OF $)
LIVESTOCK PRODUCTION RECEIPTS (thousands of $) PERCENTAGE*
Dairy 1 847 225 34
Pork 1 030 220 19
Poultry and eggs 586 651 11
Other animal productionincluding beef, sheep and lambs 555 565 10
Total cattle and animal production 4 019 661 74
CROPS
Corn, oilseeds, cereals 423 620 8
Horticulture (vegetables and potatoes) 394 342 7
Flowers and nurseries 249 701 5
Fruit and other 228 897 4
Maple products 151 673 3
Total crops 1 448 233 27
MARKET RECEIPTS 5 487 780 100
* Percentages are rounded off.
Source : Activité bioalimentaire au Québec, Bilan 2005, Ministère de l’Agriculture, des Pêcheries et del’Alimentation du Québec, Appendix, page 41.
Most of Quebec’s agricultural production is made up of basic commodities,that is to say mass consumption products, as shown in Table 2. However,changes in consumer tastes and the arrival of new technologies have led to the emergence of products with specific features such as local and regionalproduce, organic products, and so on.
Livestock yields have also increasedsignificantly. For example, the averagemilk yield per cow increased by 14% over a ten-year period, from7,102 kg/year in 1996 to 8,115 kg/yearin 2005.1 For pigs, overall sowproductivity increased by 15%,from 20.1 weaned piglets per year
in 1995 to 23.2 in 2003.2
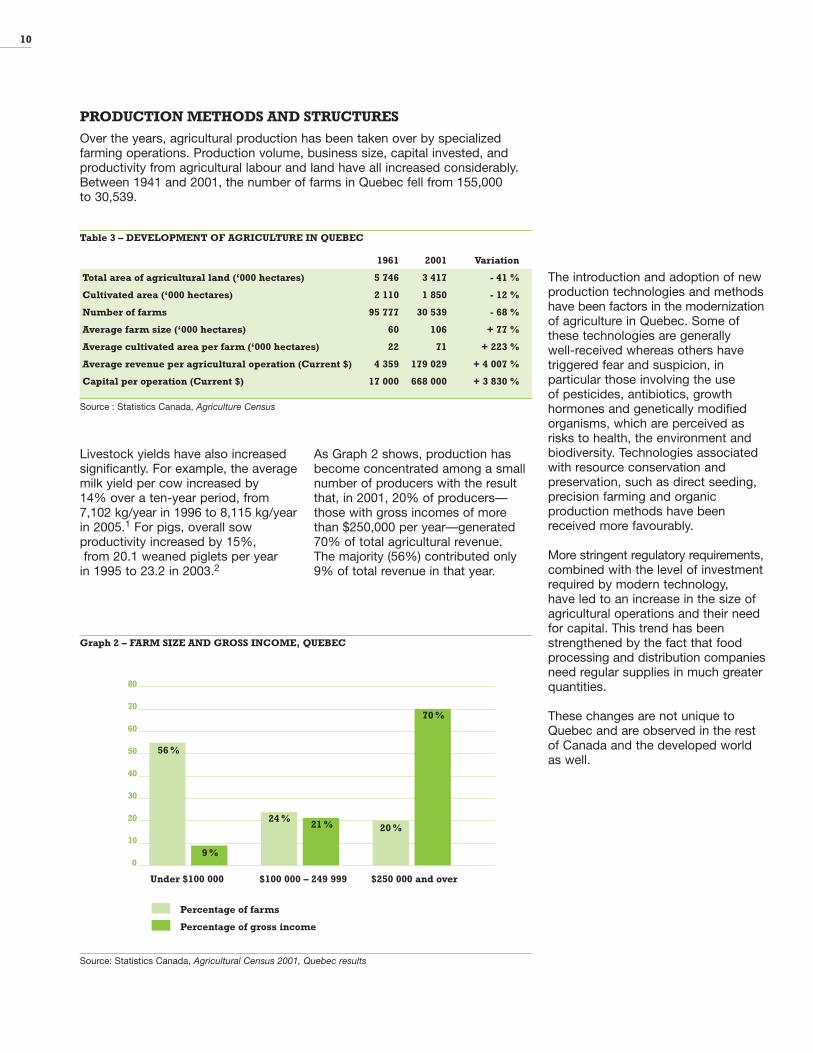
As Graph 2 shows, production hasbecome concentrated among a smallnumber of producers with the resultthat, in 2001, 20% of producers—those with gross incomes of morethan $250,000 per year—generated70% of total agricultural revenue. The majority (56%) contributed only9% of total revenue in that year.
The introduction and adoption of newproduction technologies and methodshave been factors in the modernizationof agriculture in Quebec. Some ofthese technologies are generally well-received whereas others havetriggered fear and suspicion, inparticular those involving the use of pesticides, antibiotics, growthhormones and genetically modifiedorganisms, which are perceived asrisks to health, the environment andbiodiversity. Technologies associatedwith resource conservation andpreservation, such as direct seeding,precision farming and organicproduction methods have beenreceived more favourably.
More stringent regulatory requirements,combined with the level of investmentrequired by modern technology, have led to an increase in the size ofagricultural operations and their needfor capital. This trend has beenstrengthened by the fact that foodprocessing and distribution companiesneed regular supplies in much greaterquantities.
These changes are not unique toQuebec and are observed in the restof Canada and the developed worldas well.
10
PRODUCTION METHODS AND STRUCTURES
Over the years, agricultural production has been taken over by specializedfarming operations. Production volume, business size, capital invested, andproductivity from agricultural labour and land have all increased considerably.Between 1941 and 2001, the number of farms in Quebec fell from 155,000 to 30,539.
Table 3 – DEVELOPMENT OF AGRICULTURE IN QUEBEC
1961 2001 Variation
Total area of agricultural land (‘000 hectares) 5 746 3 417 - 41 %
Cultivated area (‘000 hectares) 2 110 1 850 - 12 %
Number of farms 95 777 30 539 - 68 %
Average farm size (‘000 hectares) 60 106 + 77 %
Average cultivated area per farm (‘000 hectares) 22 71 + 223 %
Average revenue per agricultural operation (Current $) 4 359 179 029 + 4 007 %
Capital per operation (Current $) 17 000 668 000 + 3 830 %
Source : Statistics Canada, Agriculture Census
Graph 2 – FARM SIZE AND GROSS INCOME, QUEBEC
Source: Statistics Canada, Agricultural Census 2001, Quebec results
Under $100 000 $100 000 – 249 999 $250 000 and over
Percentage of farms
Percentage of gross income
50
60
70
80
40
30
20
10
0
56 %
9 %
24 %21 % 20 %
70 %

CONCERN ABOUT THEINCOME OF FARMS ANDFARMING FAMILIES
The income of farmers and farmingfamilies is a constant and majorconcern. Farm families have similarneeds to their city-dwellingcounterparts. On the other hand,rising investments have caused themto accumulate increasingly significantfinancial liabilities. Farm incomes canalso vary from year to year as a resultof price fluctuations, bad weather,natural disasters and otheruncontrollable phenomena.
Agriculture is a capital-intensiveactivity. In other words, the amount of capital required per unit of productsold is generally higher than in othersectors. In Canada’s economy as awhole, a company needs approximately$2 in assets for every $1 in sales,whereas in the agricultural sector, the ratio is between $4 and $6 in assets for every $1 in sales.3
Net farm income, including paymentsfrom government programs, is morestable and slightly higher in Quebecthan elsewhere in Canada.4 However,without subsidies from governmentprograms, net farm income wouldhave been negative in recent years.Low farm incomes are not confined toQuebec since this is a characteristicof most developed economies.
The debt ratio (total debt/total assets)of farms in Quebec has risen steadilysince 1994 and is now even higherthan that of other provinces.5,increasing from 21% in 1994 to 28%in 2004 (compared with 14% to 19%for Canada as a whole.) Although thedebt ratio in Quebec appears to be anindicator of the sector’s fragility, it islower than Canada’s general economy(74%) and therefore does not seem tobe as elevated in comparison.6
The incomes of farming families in many developed countries arecomparable to if not higher than thoseof non-farming families, as studies by the Organisation for Economic Co-operation and Development(OECD) have shown.7 In Quebec, in 2000, farming families had anaverage income of $59,696,compared to $59,297 for Quebecfamilies in general.8 In Canada, in the same year, farming familiesreported average incomes of $66,270compared with $66,160 for non-farming families. This is explained by the fact that, in 2000, Quebec’sfarming families earned 57.6% of theirincome outside the farm. In Canada,the figure was 73.5%. This trend hascontinued; in 2003, off-farm revenuesaccounted for 62.2% of the incomesof farming families in Quebec,compared with 78.8% for farmingfamilies in Canada as a whole. Incomparison, in the United States, off-farm revenue as a percentage ofthe total revenue of farming familiesrose from 53% in 1960 to 95% in 2000.9
Although farm owners in Quebec havehigher debt levels than their Canadiancounterparts, the value of their assetshas also increased; the average netvalue of a farm in Quebec (assetsminus liabilities) was $170,000 in 1981,but had risen to $725,000 in 2004(including production quotas).10
All the above data are averages, andthe situation of individual farms maydiffer significantly.
Accordingly, the Commission wouldlike to hear participants’ reactionsto the following questions:
• What do these trends mean for the future of small, medium-sizedand large farms in Quebec?
• What strategies are required to manage the consequences of these trends?
• What role should be played by the State?
AGRICULTURAL POLICIES
Agricultural policies cover manydifferent aspects of agriculture. The best-known include food safety,plant and animal health, soil andenvironmental protection, incomeimprovement and stabilization,financing, training and labour, researchand development, outreach andtechnology transfers, farm support,and property tax reimbursements.Some of these areas fall under theauthority of both levels of government.
11

In 2003-2004, Quebec rankedsecond among Canada’sprovinces for governmentspending in the agriculturalsector, with $704 million, theequivalent of 12.9% ofagricultural revenue generatedby farms. Alberta ranked firstwith $886 million and 13.4% of farm revenue, while Ontariowas fourth, with $455 million or 5.6% of farm revenue.11
Quebec’s agricultural policies, likethose of most industrialized countries,are aimed mainly at improving andstabilizing farmers’ income andproviding citizens with a regularsupply of food at a price they canafford to pay.
Quebec and Canadian agriculturalpolicies are directed towards threemain areas of focus, namely collectivemarketing, farm income improvementand stabilization, and farm financing.
COLLECTIVE MARKETING
Traditionally, farmers sold their ownproduce to a fairly small set ofintermediaries, who set the conditionsof sale. In the 1950s, the Quebecgovernment created the Comitéd’enquête pour la protection desagriculteurs et des consommateurs(commonly known as the HéonCommission), which tabled its reportin 1955. Its main recommendationwas to establish mechanisms thatwould allow farmers to market theirproducts collectively. The reportstipulated that its recommendationswere designed to trigger a significantincrease in the agricultural sector’s realnet revenue and purchasing power.
Collective marketing, by strength of numbers and centralized salesoperations, helps improve thenegotiating power of farmers. It canbe put into practice in a variety ofways, but there are three approachesin particular that appear to be mostpopular. The first is the voluntaryapproach through a marketing groupor cooperative, with no mandatorymembership. The second involvessetting up a single, mandatory salesorganization for a given product,known as a joint plan. Once accepted,the joint plan must be used by allunits of production supplying thecommodity in question. The thirdapproach is also based on the jointplan, with the addition of productionquotas, which are allocated amongproducers.
In 1956, the government followed up on the Héon Commission’srecommendations by adopting the Act respecting the marketing ofagricultural, food and fish productswhich allowed for the creation of jointmarketing plans for agriculturalproducts. Since then, producers havedeveloped joint plans for dairy,poultry, turkeys, table eggs, hatchingeggs, pork, maple, beef, blueberries,cash crops (grains), rabbits, cannerycrops (vegetables), apples, potatoes,goat and lamb. To implement the jointplans, marketing boards have beenset up at the producers’ request. They are generally controlled byfederations of producers.
The federal government added aquota-based supply managementsystem to the joint plan formulathroughout Canada. Supplies for milk,table eggs, hatching eggs, chickenand turkey are all managed in thisway. The system serves to controland limit production in Canada as awhole and by province, based on therequirements of the domestic market.Supply is set based on estimateddemand in order to obtain a pricecalculated on the cost of production.
When a system like this is introducedfor a given product, the Canadianquota is divided among the producingprovinces based on historicalproduction figures. The provincialmarketing boards administer thequotas and allocate them toproducers based on individualproduction histories, and then takecare of marketing.
The power to set quotas for productionis associated with the ability to controlimports. The Canadian governmentprotects its domestic market by settinghigh customs tariffs for imports:192.3% for table eggs, 280.4% forwhole chickens, 289% for cheddarcheese, and 351.4% for butter.Despite these tariffs, significantquantities of all these products are imported into Canada. This isespecially true of eggs from theUnited States.
Generally speaking, quotas aretransacted individually betweenproducers, or when farms are sold.Their total value in all supply managedsectors in Quebec was estimated atapproximately $9.2 billion in 2005.11
12
Milk is an exception to this generalrule. Quotas are sold through theFédération des producteurs de lait du Québec which has created acentralized quota exchange system.Quota values have risen steadily. InOctober 2006, the quota for the yieldof roughly one dairy cow was sellingat a historical high of over $33,000.The rise in quota prices has becomeof increasing concern to theproducers’ federations, especially inthe dairy sector in Quebec and otherCanadian provinces. The high cost ofa quota now constitutes a barrier toanyone wishing to purchase a farm. It is also one of the main causes ofindebtedness for dairy farmers.
The emergence on the market ofproducts not covered by the sametariff requirements has, in some cases,become a way of circumventing thecustoms barriers protecting sectorswith quotas.
Some new products that were notforeseen when the barriers wereerected can now be found on theCanadian and Quebec markets,including concentrated milk proteinswhich cost less and are used mainlyas substitutes in the production ofcheese and yoghourt, as well asbutter oil-sugar combinations that areused to manufacture ice cream.
Supply management and collectivemarketing methods are not popular inevery quarter. One of the criticismsoften directed at this type ofmechanism is the fact that it does notadjust quickly to changes in demand.It has been claimed that productprices would decline and consumerdemand would increase if quotaswere eliminated, allowing processingcompanies to become morecompetitive. In contrast, there areclaims that deregulation experimentsin other countries have caused adecline in the price paid to producerswith no obvious benefit to consumers.There are also those who would likeother stakeholders, includingprocessing companies, distributorsand consumers, to be involved in themanagement of Quebec’s marketingboards.
INCOME IMPROVEMENTAND STABILIZATIONPROGRAMS
The two levels of government haveintroduced a set of interventionmeasures aimed at reducing theimpact of the inherent risks ofagricultural production and improvingproducers’ revenues. Quebec, forexample, has crop insuranceprograms and farm incomestabilization insurance programs.
The first level of intervention withregard to income improvement andstabilization is the CanadianAgricultural Income StabilizationProgram (CAIS), created in 2003. Its purpose is to stabilize overall farmincome on the basis of historical netincome regardless of actual productionvolume. This type of program isdescribed as “decoupled” because it is not based on production leveland does not offer guaranteed prices for products. Accordingly, it is considered to be in compliancewith the standards negotiated ininternational agreements.
In Quebec, the Program isadministered by La Financièreagricole.13 It is funded by the federal(60%) and Quebec provincial (40%)governments. Financial participationby farmers varies from year to year,depending on differences in insuredincome. In 2004, the Program paid atotal of $181 million to agriculturalproducers. It is currently under review,as part of a new Canadian frameworkstrategy for agriculture, expected tocome into force in 2008.
13
The Commission therefore poses the following questions:
• Do the current collective marketing mechanisms in force for agriculturalproducts allow the agri-food industries to respond quickly and adequatelyto market needs in Quebec, Canada and abroad?
• Do they leave sufficient room for new products and niche production?
• Do marketing strategies based on supply management have a place in thepresent context of market liberalization? If so, what are their advantagesand disadvantages, and how could they be improved?
• Which measures should receive priority for helping supply-managedproduction sectors to deal with international competitors who succeed in circumventing Canada’s high tariff barriers?
• Should the structure of the marketing boards, currently under the authorityof agricultural producers, be expanded to allow for the involvement of other interests, such as those of consumers and processors?
• Should agricultural policies leave more room for the goals of healthy eating and public health?
Farm Income Stabilization Insurance(known by its French acronym ASRA)is a Quebec program that waslaunched in the late 1970s. It isadministered by La Financièreagricole and supplements the federalprogram for 20 commodities.* Itspurpose is to protect producers frommarket risks. Producers themselvesprovide one-third of the funding, andthe government provides the othertwo-thirds. The program recorded adeficit of $373 million in 2005-2006.
ASRA has paid outcompensation every year on 12 of the 20 products itcovers. There is no ceiling per farm on the amount ofcompensation payable.
Because ASRA applies to specificproducts and is based on the pricesreceived by producers for theproducts covered, it is more open tochallenge under international traderules. Although product supportprograms reduce income variability,the OECD feels they also distortmarket rules and allow production tobe maintained independently ofmarket needs. In other words, they donot encourage producers to questiontheir production choices. This form of income support is includedamongst those that are susceptible to being reduced by virtue of theagreements reached within theframework of the WTO negotiations.
The FAO,14 for its part, believes farmsupport should foster environmentalprotection and social aspects ratherthan production objectives.
Other measures also exist to helpmanage the inherent risks of farming,including crop insurance, whichprotects against natural disasters. The crop insurance program coversonly 16 types of production andcertain types of risks. It paid outnearly $56 million in coverage in 2005.
The programs managed by LaFinancière agricole du Québec (FADQ)are funded in part by the Ministère de l’Agriculture, des Pêcheries et de l’Alimentation du Québec. Thedepartment provided the FADQ, in2005-2006, with $305 million whichrepresents about half of its $637.4million budget. In addition, $93.5million was disbursed to producers in the same year by the department to cover the reimbursement of aportion of their property taxes.
The property tax reimbursementprogram takes into account the highlevel of capital investment in thefarming sector compared to othereconomic sectors, and the return oncapital which is lower than in othersectors. The program ensures that thefarming sector is not undulypenalized.
The Commission proposesreflection in the following areas:
• To what extent should the Stateintervene to support or increasethe income of agriculturaloperations?
• What form should Stateinterventions take, in terms of type of agriculture, type offarm and type of production?
• What should the State’s prioritygoals be?
• What type of assistance shouldthe State offer to producers?
• Should financial assistancedepend on the nature and volumeof the farm produce, theoperation’s total income, size or development stage, or othercriteria?
• Should the State continue tosupport types of production thathave been in deficit for 10, 12 and even 20 years?
• What could farmers do to maketheir farms less vulnerable andincrease their flexibility?
14
* Finished hogs, cow-calf, finished beef, grain-fed veal, milk-fed veal, lambs, milk lambs,heavy lambs, grain corn, soya, barley, oats, wheat silage, wheat for human consumption, feedwheat, barley, potatoes (fresh and stored), apples.
THE AGRI-FOOD INDUSTRY:A KEY SECTOR IN QUEBEC’SECONOMY
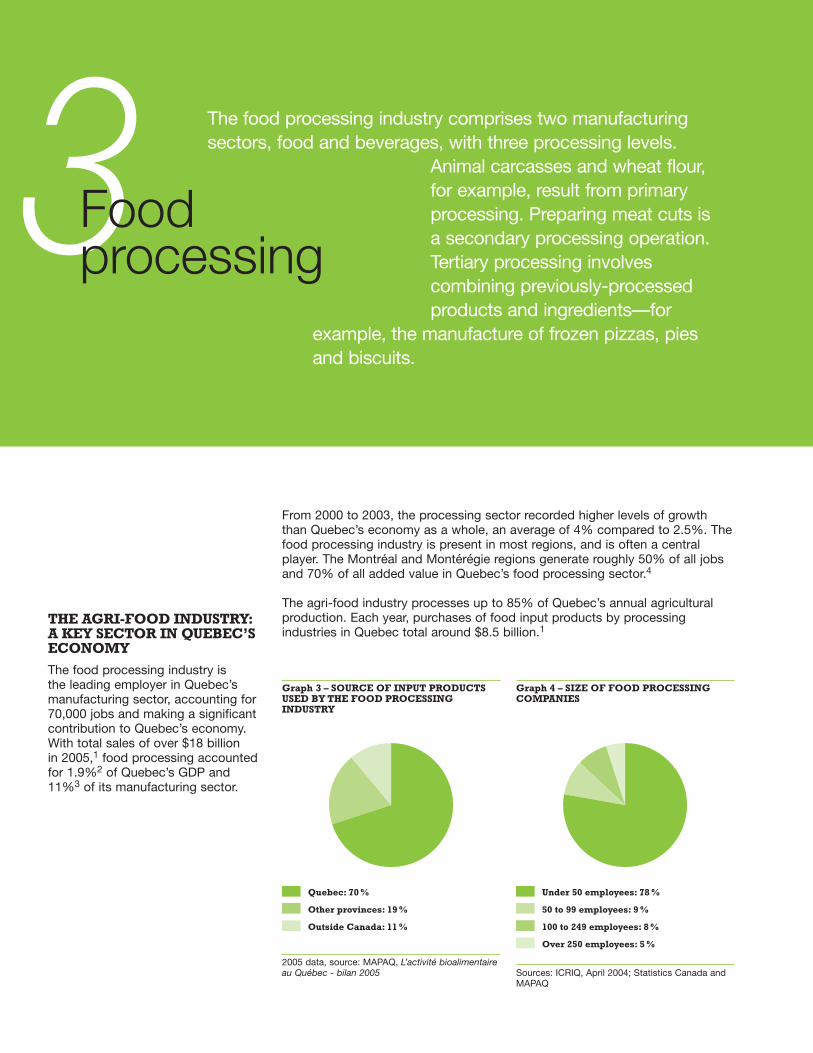
The food processing industry is the leading employer in Quebec’smanufacturing sector, accounting for70,000 jobs and making a significantcontribution to Quebec’s economy.With total sales of over $18 billion in 2005,1 food processing accountedfor 1.9%2 of Quebec’s GDP and 11%3 of its manufacturing sector.
Graph 3 – SOURCE OF INPUT PRODUCTSUSED BY THE FOOD PROCESSINGINDUSTRY
2005 data, source: MAPAQ, L’activité bioalimentaireau Québec - bilan 2005
Graph 4 – SIZE OF FOOD PROCESSINGCOMPANIES
Sources: ICRIQ, April 2004; Statistics Canada andMAPAQ
The food processing industry comprises two manufacturingsectors, food and beverages, with three processing levels.
Animal carcasses and wheat flour, for example, result from primaryprocessing. Preparing meat cuts is a secondary processing operation.Tertiary processing involvescombining previously-processedproducts and ingredients—for
example, the manufacture of frozen pizzas, pies and biscuits.
3Foodprocessing
Quebec: 70 %
Other provinces: 19 %
Outside Canada: 11 %
Under 50 employees: 78 %
50 to 99 employees: 9 %
100 to 249 employees: 8 %
Over 250 employees: 5 %
From 2000 to 2003, the processing sector recorded higher levels of growththan Quebec’s economy as a whole, an average of 4% compared to 2.5%. Thefood processing industry is present in most regions, and is often a centralplayer. The Montréal and Montérégie regions generate roughly 50% of all jobsand 70% of all added value in Quebec’s food processing sector.4
The agri-food industry processes up to 85% of Quebec’s annual agriculturalproduction. Each year, purchases of food input products by processingindustries in Quebec total around $8.5 billion.1

Twenty-two percent of operations withless than 50 employees have fewerthan five employees, 38% have five to 19 employees, and 18% have 20 to49 employees. Together, they provide19.5% of all jobs in the sector.
Graph 5 – PURCHASERS OF PRODUCTSPROCESSED IN QUEBEC
The cooperative sector occupies a key position in Quebec’s foodprocessing industry, accounting forroughly 25% of processed shipments.Cooperatives process around 85% ofthe poultry and over half of the milkand pork produced in Quebec.4
The processing industry is located atthe junction of two highly structuredsystems, downstream from agriculturalproduction and upstream from fooddistribution, both of which are keylinks in the agri-food chain.
PROCESSING ANDAGRICULTURAL PRODUCTION
It is generally recognized that Quebecprocessors can rely on a secure, well-structured supply of raw agriculturalmaterials. A feature of Quebec’sprocessing industry is its strong ties toproduction, especially in the sectorsdirectly connected to livestockproduction (milk, meat, eggs andpoultry) which account for 53% of thevalue of processed shipments; thesesectors spend 70% of their revenueon the purchase of raw agriculturalmaterials.1
A high percentage of Quebec’sagricultural production is marketedcollectively. This gives farmers adegree of leverage in their transactionswith Quebec processors. The foodprocessing industry in Ontario is morediversified and less dependent on thecost of the raw material supply. Someobservers have pointed out thatQuebec and Canada’s joint marketingmechanisms may, in some cases,place upward pressure on supplycosts making processors less cost-effective than their foreigncompetitors. Others consider that thejoint marketing systems are not suitedto the needs of processors producingniche products.
PROCESSING AND FOODDISTRIBUTION
Over the last two decades, in bothQuebec and Canada, there has beena trend towards concentration andconsolidation in the distributionsector. Market access has becomemore difficult, in particular for smalland medium-sized processing firmsthat cannot always supply thevolumes required by the majordistribution networks. Concentrationin the distribution sector has reducedcompetition. In addition, manystrategic decisions in the distributionsector are now made outside Quebec.
Agri-food companies must face thetwin challenge of competitiveness andproductivity. Processing firms inQuebec are less productive than theircounterparts in Ontario. StatisticsCanada reports that the combinedproductivity of the agriculturalproduction/processing chain inOntario is higher than in Quebec.GDP per employment is also regardedas a strong indicator of productivity. In food processing, this figure is 27%lower in Quebec than in Ontario. It hasbeen suggested that this productivitygap can be explained, at least in part,by the fact that there are fewer largecompanies (500 employees and over)in Quebec (2.8% of the total) than inOntario (5%) and elsewhere inCanada (4.2 %).5
Technology is also an importantvector for productivity. In this regard,Quebec’s smaller domestic markethinders access to cutting-edgetechnology, creates fewer opportunitiesfor economies of scale, and reducespurchasing power.
16
Retail sector and HRI, Quebec: 39 %
Retail sector and HRI, other provinces: 26 %
International: 18 %
Production and processing, Quebec: 17 %

The gross margin for Quebec’sfood processing industriesaveraged 23% between 2000and 2003, compared to 27% in Ontario and 20% for all otherCanadian provinces. Otheranalyses show that theprofitability of Canadianprocessing companies is 50%below that of firms in theUnited States.
Quebec firms are also vulnerable to tariff and non-tariff trade barriers,especially in the United States andJapan, which are Quebec’s two mainexport markets.
Worker availability is another importantfactor in productivity. Like severalother manufacturing sectors, the foodprocessing sector is finding it difficultto hire workers.
For both overseas and domesticmarkets, the strength of the Canadiandollar has increased foreigncompetition, particularly from theUnited States.5
Quebec food processing firms can,however, rely on a network ofinstitutional resources to meet theirtraining and research and developmentneeds. The scope and quality ofQuebec’s effective, well-structuredsocial programs, designed to meetthe needs of their employees, areanother significant advantage.Quebec offers some of the mostadvantageous production factors inthe world, including a reliable,abundant and competitively-pricedenergy supply, as well as access to aplentiful supply of high-quality water.
The Commission’s questionsconcern the measures that shouldbe taken to improve the productivityand competitiveness of Quebec’sfood processing industry:
• How can Quebec’s foodprocessing companies put theiradvantages to better use andimprove their competitivecapacity in domestic and foreignmarkets?
• Is the cost of raw agriculturalmaterials a problem? If so, how is it a problem and what are theconsequences?
• How can specialized processorsbe given better access todistribution networks?
• How can companies be assured of the manpower they need?
NEW MARKETDEVELOPMENT
Several stakeholders have mentionedthat few Quebec companies own orcontrol brands that are recognizedthroughout the Canadian market. Onthe other hand, the Quebec market isopen to products sold under brandscontrolled by Canadian corporationsoutside Quebec, or internationalcorporations.
Distributor brands are graduallyincreasing their market share, and the most productive firms are givenpreference when sub-contracts areawarded. As a result, recognition fornational brands controlled by Quebecfirms is a strategic issue.
In several sectors of activity, includingmass-market products, it is hard forQuebec firms to compete with largeCanadian or foreign corporations,especially in export markets. Theneed to supply large volumes on aregular basis prevents many smallfirms from gaining access to thesemarkets.
It has been suggested that theprocessing industry in Quebec can be developed by focusing on nichemarkets with higher added value,such as luxury products, includingfoie gras, ice cider and fine cheeses,health products such as preparedvegetarian dishes, organically-certifiedproducts and health-enhancing foods,and products of high practical valuesuch as pre-cut apples, preparedmeats and dishes, etc.
To capture a market niche,businesses must exhibit creativity, ahighly-developed sense of innovation,and a strong ability to adjust quicklyto a particular context. Many firmshave in fact been successful in nichemarkets showing that versatility,creativity and the ability to innovatecan allow an enterprise to seize newbusiness opportunities.
The Commission would likeparticipants to respond thefollowing questions:
• What are the most promisingmarket sectors?
• What conditions must bedeveloped in order to seizebusiness opportunities?
• What measures can be introduced to ensure thatorganizations at different levelsin the agri-food chain read themarket signals and work jointlyto prepare a response?
• What role should the State play?
• How can processors beencouraged to develop productswith positive impacts on health?
17
CHANGES IN THE RETAILFOOD SECTOR
In the 1950s, food was distributed byretail chains such as A&P, Dominion,Steinberg and Union, and by small,independent grocery stores. This wasfollowed by a period of consolidation,which accelerated at the beginning ofthe 1990s and led to the enlargementand modernization of food retailinginfrastructures.
Today, three companies control75% of retail sales in Quebec,and 57% in Canada: Loblaws(Loblaws, Provigo, Maxi, Maxi& Co., etc.), Sobeys (IGA andIGA Extra, Sobeys, Tradition,BoniChoix, Rachelle-Béry, etc.),and Métro (Métro, Super C,Loeb, A&P, etc.).2
The rest of the market is partlyoccupied by independent grocers,regionally-based chains small storesoffering frozen foods, and specializedstores that are either independent or affiliated with larger chains foundmainly in the niche markets for luxury,organic or health food products. A significant portion of the market is also occupied by non-specializedstores such as Costco, Wal-Mart,Zellers, convenience or corner stores,and pharmacy chains.
The boundary between specialized andnon-specialized stores is increasinglythin. Some food distributors haveextended the range of non-foodproducts they offer in response to sales of food products by non-specialized chains.
The retail food market in Canada and Quebec is characterized by ahigh level of concentration, especiallycompared to the United States wherethe market is still relatively segmented.
Despite their large market shares, the major Canadian distributors arerelatively small in worldwide terms.For example, in 2004, Wal-Mart as the world’s largest food distributor,had total sales of US$309.4 billioncompared to US$22.5 billion forLoblaws, which ranked 30th worldwide.3
There are three categories of foodretailers:
• stores wholly-owned by a distributionchain (corporate or integrated stores);
• independent stores affiliated with a chain and trading under a banner(associated independent stores);
• independent stores.
Food products are distributed through two main but separatechannels: retails sales, and the “HRI” sector, made up of hotels,
restaurants and institutions. In 2004, the two distribution sectors had total sales of over $18 billion and employed over 152,000 people.1
The retail and HRI distribution networkspurchased over 45% of their foodoutside Quebec, including 27% fromother Canadian provinces.2
4Distribution of food produce

The type of connectionbetween a store and its chaininfluences its purchasingdecisions. In particular, it determines the freedom the store has to choose itssuppliers and its ability topurchase products from localproducers or processors.
According to the magazine CanadianGrocer, integrated or corporatestores control a larger market share in Canada (60.7%) than in Quebec(36.7%). However, the combined salesof stores integrated or associated withthe major chains account for a similarmarket share, 95% in Canada and95.9% in Quebec.3 Over the last 20 years, the number of non-associatedindependent stores has decreasedsignificantly. In both Quebec andCanada, they now represent around5% of the market.2
Processing industry representativeshave voiced their concern aboutcommercial practices that increasethe difficulty of placing products insupermarkets. The major chainscharge access fees, called “slotting”fees, and demand large volumes,regular deliveries at fixed times todistribution centres, productstandardization and negotiationthrough a purchasing department. For companies located in outlyingregions, the distance to the decision-making centre compounds thesedifficulties.
A WIDER RANGE OF FOODPRODUCTS
The supply of food products hasnever been so extensive and varied.In 2005, 30,000 products could befound on the shelves of a typicalsupermarket, compared to 6,000 in1953. This is due to the willingness of distributors to respond to theneeds of consumers from a range of cultural backgrounds, and to agrowing diversity of consumer habits.Consumers are also better informedand more receptive to new products.This market shift partly explains thetrend towards the modernization andenlargement of supermarkets inQuebec. It offers business opportunitiesfor producers, processors anddistributors that are able to anticipatetrends and offer innovative, competitiveproducts.
Although these trends create businessopportunities for manufacturers, theyalso increase the marketing challenges.Quebec processors must now advertisetheir products and brands andpersuade consumers, who are shortof time and surrounded by numerousother products, to buy them.
Traditionally, major processors haveinvested heavily to acquire high-volumeproduction equipment and try tomaintain stable, high-volume productionfor as long as possible. However,product life cycles are tending tobecome shorter. Businesses that areslow to adapt lose market share tomore flexible businesses that are ableto adjust quickly to new trends. Thisis the case for the highest-performingsmall and medium-sized businesses,which have become market leadersand have quickly scored impressivebusiness successes with majordistributors.
PRIVATE-LABEL BRANDS
The strong competition betweenCanadian distributors, combined witha fear of US competition, hasgenerated a range of strategies todevelop consumer loyalty. Onestrategy involves promoting productsunder the distributor’s own brandname; the products in question areobviously not available in competingstores. In designing their own-brandstrategies, major distributors can usefirst-hand information on theexpectations and behaviour of theirconsumers, and can adapt swiftly tonew trends. As a result, private-labelbrands such as President’s Choice,Our Compliments and SélectionMérite can compete with nationalbrands owned by processors. Amongother things, these strategies havecreated business opportunities forQuebec companies that do notcontrol dominant national brands.
According to Deloitte & Touche(Benchmarking for Success 2000),private-labels processed foods andbeverages held 27% and 28% of theCanadian market respectively in 1998.It is important to note that privatebrands are stronger in Canada than in the United States. According to AC Nielsen,5 Canada ranks ninthworldwide for the market penetrationof private-label products at 19%compared to 16% in the UnitedStates. Switzerland ranks first at 45%.
19
The gradual opening up of internationaltrade in agricultural and food productsoffers additional business opportunitiesfor major distributors as they takeadvantage of lower-cost supplies,especially for their private-labelproducts. A strong Canadian dollarhas reinforced this trend. Competitionfrom US distributors obtaining suppliesfrom the international market hasencouraged other distributors tofollow the same path.
The competitive capacity of theproduction-processing chain is amajor issue for Quebec’s agri-foodsector.The Commission would liketo hear participants’ thoughts on the following question:
• What steps or measures could be implemented to ensure thatQuebec businesses of all sizes(small, medium and large), and suppliers of niche or localproducts, are able to increasetheir presence within the currentfood distribution system?
FOOD PRODUCT LABELING
The labeling of food products fallsunder the responsibility of theCanadian Food Inspection Agency(CFIA). It has requirements relating tonutritional information, and nutritionaland health claims. In Canada, labelsmust give nutritional information formost food products. This represents a considerable burden for someproducers, who see it as a relativelycostly extra expense. However, thenew requirements may open the wayto new business opportunities byhighlighting the nutritional quality ofcertain products.
Increasingly, consumers want to know what their food contains, andsome go even further and demandinformation on the origin, productionand processing of the food stuffs theyeat. This has been a factor in theproblems caused by the introductionof genetically-modified organisms(GMOs) in the food system, and adebate about the compulsory, asopposed to voluntary, labeling ofGMOs is now under way.
The Commission would like toreceive opinions and comments on the following elements:
• What is the role of labeling? How far should it be taken?
• What information is essential for consumers, and whatinformation should labelscontain?
• Should voluntary GMO labelingbe made compulsory?
• How can the labeling burdenimposed on processing anddistribution companies be takeninto account?
HOTELS, RESTAURANTS ANDINSTITUTIONS (HRI SECTOR)
Hotel, restaurant and institutional food services have grown considerablyin Quebec and represent a keysegment of the market. The percentageof HRI food spending by the Quebecpopulation is increasing although it remains below the level in theUnited States.
In 2004, for the first time in the US, the percentage of HRIspending by consumersexceeded the percentage forgrocery stores. That same year,Quebec’s restaurant sector hadsales of around $7 billion eachyear, a 4.5% increase over2003. Food services in hotelsand institutions accounted foranother $2 billion. The HRIsector employs approximately161,000 people.6
20

The purchasing policies of hotels andrestaurants differ from those of theretail sector. Traditionally, they involvelocating specific products and a moredirect business relationship. There is a clear trend towards consolidation of the HRI distribution sector, in bothQuebec and Canada, and also of themanagement of the major institutionalaccounts and cafeteria services oflarge corporations. Consolidationincreases the purchasing power of the distributors and tends to distancemanufacturers from the decision-makingcentres. One of the effects of the shiftis to add entry barriers for smallproducers and processors who areunable to supply large volumes oftheir products.
Independent restaurants and smallregional chains are often still servicedby local or regional distributors.Quebec reports the highest percentageof firms that are independent and notaffiliated with a chain.
The Commission would like toreceive opinions and comments on the following questions:
• How can Quebec’s agricultureand agri-food sector develop atrue partnership with the HRIsector to take better advantage of the opportunities it offers?
• Should the call for bids issued by public institutions place moreemphasis on Quebec products?
• How can distributors beencouraged to pay more attentionto Quebec products?
STRATEGIC IMPORTANCEOF THE HRI SECTOR
The positioning of processingcompanies with HRI distributors hasoften proved to be a strategic choice.Consumers who are introduced toMexican food, sushi or gastronomy by their experience in a restaurant orthrough the media will often seek outsimilar products on store shelves.
A number of institutions, including the Institut de tourisme et d’hôtelleriedu Québec (ITHQ) and the media,play a key role in guiding consumertrends and raising the visibility of localproducts. The ITHQ has made asignificant contribution to thedevelopment of know-how in therestaurant sector, and has helpedraise Quebec’s profile in this area.
Some stakeholders are still concernedthat the HRI market is neglected byprocessors despite the fact that, inaddition to being strategic, thismarket is generally considered to beless costly and less of a risk. Inaddition, Quebec’s hotel andrestaurant sector is dynamic andcreative, and contributes to theevolution of consumer trends.
21
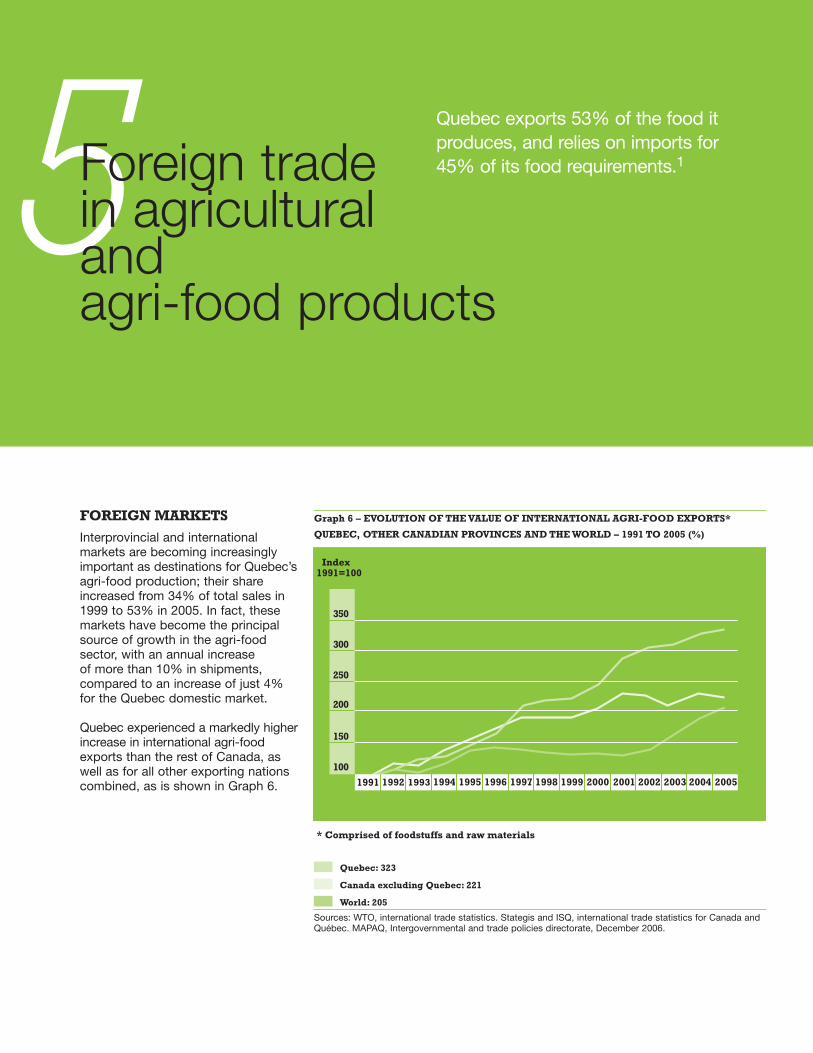
FOREIGN MARKETS
Interprovincial and internationalmarkets are becoming increasinglyimportant as destinations for Quebec’sagri-food production; their shareincreased from 34% of total sales in1999 to 53% in 2005. In fact, thesemarkets have become the principalsource of growth in the agri-foodsector, with an annual increase of more than 10% in shipments,compared to an increase of just 4%for the Quebec domestic market.
Quebec experienced a markedly higherincrease in international agri-foodexports than the rest of Canada, aswell as for all other exporting nationscombined, as is shown in Graph 6.
Quebec exports 53% of the food itproduces, and relies on imports for 45% of its food requirements.15Foreign trade
in agricultural andagri-food products
1991 1992 1993 1994 1995 1996 1997 1999 2000 2001 2002 2003 2004 2005
350
300
250
200
150
100
1998
Graph 6 – EVOLUTION OF THE VALUE OF INTERNATIONAL AGRI-FOOD EXPORTS*
QUEBEC, OTHER CANADIAN PROVINCES AND THE WORLD – 1991 TO 2005 (%)
Index1991=100
* Comprised of foodstuffs and raw materials
Sources: WTO, international trade statistics. Stategis and ISQ, international trade statistics for Canada andQuébec. MAPAQ, Intergovernmental and trade policies directorate, December 2006.
Quebec: 323
Canada excluding Quebec: 221
World: 205

Graph 7 – DESTINATION OF QUEBEC’SFOOD PRODUCTION (2005)
Quebec’s overall international balancefor agri-food trade has been positivesince 1997 mainly as a result of itsexports to the United States. Thebalance of trade with all other countriescontinues to be in deficit; in otherwords, Quebec imports more productsfrom those countries than it exports to them.
Graph 8 – DESTINATION OF QUEBEC’SFOOD EXPORTS (2005)
Quebec’s international exportsincreased by 16% between 2002 and2005. Quebec contributes more than12% of Canada’s total internationalexports, ranking behind Ontario (28%)and Alberta (16%).
International exports rose by morethan 14% in the period 2001 to 2005,and imports by 19%.2 Export growthwas achieved despite a slowdown in2003 that was due, among otherthings, to mad cow disease (bovinespongiform encephalopathy) and thestrength of the Canadian dollar.However, export growth was only 1% in 2004-2005. Data for the firstquarter of 2006 indicates a drop in thevalue of exports. Quebec’s agricultureand agri-food exports accounted formore than 6 % of its total exports in 2003.
A NEW INTERNATIONALMARKET DYNAMIC
Countries such as Mexico, Chile,Brazil, India and China4 are playing a much more important role, offeringproducts at lower prices. Thesecountries enjoy certain advantages,including a labour force and a climatethat allows them to produce rawmaterials and processed products atlittle cost. Their growing presence onthe international stage has emphasizedthe existing downward pressure onprices and will probably alter manyaspects of international trade. However,the increased supply of products hasoccurred in a context where worldwidedemand is also growing. In addition,the cost advantage enjoyed by thesecountries may be counterbalanced bydisadvantages in other areas such asquality, safety, traceability andreliability of shipments.
Competition on international markets islikely to intensify. As a result, Quebec’sfarms and processing companies willneed to be efficient, innovative andflexible to adjust to these changingconditions if they are to maintain orimprove their market position. Inaddition, the probable erosion of tariff protection due to internationalpressure, especially in the tradenegotiations undertaken by the World Trade Organization (WTO), will fragment the domestic marketscurrently under supply management.
Most of the products that areexported are processed products,which in 2005 accounted for nearly85% of Quebec’s exports, comparedwith 76% for Ontario and 60% forCanada as a whole. The principalagri-food exports from Quebec arecomposed of the following notableproducts of animal origin: fresh orfrozen pork, poultry meat, eggs,animal by-products, dairy products,and livestock. The principal exportsfrom plant origin are: cocoa products,miscellaneous food products, fruits andvegetables, honey, maple products andsugar, cereal grains, beverages.
In 2005, Quebec exportedanimal products for a value of$1.6 billion, including $1 billionin fresh or frozen pork.4
23
Quebec: 47 %
Other provinces: 30 %
Exports: 23 %
United States: 63 %
Japan: 14 %
European Union: 6 %
Other: 17 %
Animal products accounted for 43% of total agriculture and agri-foodexports, and pork alone accounted for33%. The vast majority of theseexports went to the American market.Pork exports to the United Statesrose by 58% between 2000 and 2005.Exports of crop products were valuedat $2.2 billion in 2005. The mostimportant individual products werecocoa, with exports valued at $340million or 18% of total food exports,followed by miscellaneous foodstuffsand food products, fruits andvegetables, cereal products, beveragesand maple products.1
It is worth noting that this exportgrowth occurred even as the Canadiandollar soared in value. In the period2002 to 2005, the Canadian dollarrose by 38% against the Americandollar, by 32% against the Yen and by 11% against the Euro.6
The pork industry is Quebec’s primaryexport sector. It is currentlyexperiencing some difficulties and is also facing new internationalcompetitors, including Brazil.1 Meatexports, made up mostly of pork,have declined 20% between 2003and 2005.5
Exports of cocoa derivatives, althoughless at risk for the time being,nevertheless depend on Americansugar policy and the cost of otherproduction factors.
The Commission would like toreceive comments on the followingelements:
• What importance shouldQuebec’s agriculture and agri-food sector ascribe toexports and foreign markets?
• Should our strategies emphasizethe importance of processedproducts?
• In view of worldwide competition,what should Quebec do tomaintain or strengthen itsposition on world markets?
• What can be done to ensure that processing companies arefamiliar with foreign markettrends?
• What kind of balance can bestruck between supplymanagement and exports?
IMPORTS
Quebec’s food product imports fromother provinces and other countriestotaled $3.5 billion in 2005, andincreased by 17% in the period 2002to 2005.7 Imports now satisfy 45% of our food needs and represent 16% of the total value of all Canadianimports. Ontario receives 57% ofCanada’s imports ($12.5 billion).1
Quebec mainly imports processedproducts (more than 70%). The mostimportant imports are beverages (23%),fruits and nuts (19%), cocoa, coffeeand tea (12%), honey and sugar (11%),products containing dairy ingredients(7%) and vegetables (6%).8
The strong Canadian dollar has meantthat imports are more competitive onthe Canadian market. The higher thevalue of the dollar, the more it erodestariff protection measures, especiallyin a context where domestic pricesare rising and world prices are falling.9
This could lead to an increase inimports of certain products, eventhose that are supply-managed andare protected by high tariff barriers.
Clearly, then, Quebec’s economy isfairly dependent on foreign markets,for both consumption and its ownfood production.
Participants are invited to submittheir views on the following points:
• How important is a secure foodsupply in your vision of theagriculture and agri-food sectorin Quebec?
• Do you think the importance ofimports in Quebec is a threat toits own production and to asecure food supply?
• How should the agriculture andagri-food sector deal with theworld trend towards lower tariffbarriers and falling prices?
24
BASIC TRAINING ANDCONTINUING EDUCATION
A broad range of easily-accessibletraining programs at the high school,college and university level areavailable in Quebec. The province’shigh schools dispense more than 20 basic training programs, and 15 of its colleges offer nine additionalprograms.1
The Institut de technologie agroali-mentaire (ITA) has three campuses (La Pocatière, Saint-Hyacinthe andSainte-Anne-de-Bellevue), and is thesector’s largest college-levelinstitution. It has a team of 300 peopleworking on skills development and a well-established reputation that has resulted in a placement rate forits graduates close to 100%. TheInstitution also plays a significant rolein continuing education. In 2004-2005,more than 300 continuing educationsessions were dispensed to nearly4,000 people.2
Université Laval and McGill Universityoffer university-level training inagricultural sciences. Other universitiesand institutes also offer a range ofrelated programs in the fields of biology,the environment and veterinarymedicine.
In the hotel, restaurant and institutionalsector, a number of high schools andcolleges, in addition to the Institut detourisme et d’hôtellerie du Québec(ITHQ), offer educational and trainingprograms. At the ITHQ alone, theapplications for hotel and restaurantmanagement courses remain veryhigh, representing 140% of theavailable places. At the universitylevel, registration in recent years hasgrown by almost 20% each year.3
Human resources in the agriculture and agri-food sector needtraining, advice and expertise if they are to develop their skills
and make the right choices in anincreasingly competitive environment.Research, development, newtechniques and knowledge transferwill all help determine the sector’sfuture. The task of recruiting asufficient number of qualified
employees is also a concern, and workforcedevelopment is yet another challenge for agri-foodenterprises wishing to improve their productivityand innovate.
6Humanresourcedevelopment
As far as agricultural production isconcerned, MAPAQ data reveals a30% drop in high school trainingprogram enrolments between 1999and 2003, and a startling 47% dropfor college program enrolments in thesame period.4 Between 1998 and2006, despite financial incentives,enrolments for the Farm Managementand Technology program offered bythe ITA and a certain number ofCEGEPS fell by 52%.5
Farmers in Quebec have the lowestlevel of education amongst allprovinces.6 In 2000, according toStatistics Canada, the percentage of farmers in Quebec with universityqualifications was the lowest of all the Canadian provinces, and thepercentage of farmers educated toGrade Nine level or less was thehighest. Over the years, however, the gap has been closing. As thefollowing table shows, the nextgeneration of farmers is much morelikely to have been educated at thepost-secondary level, and thepercentage of new farmers with no qualifications is declining.
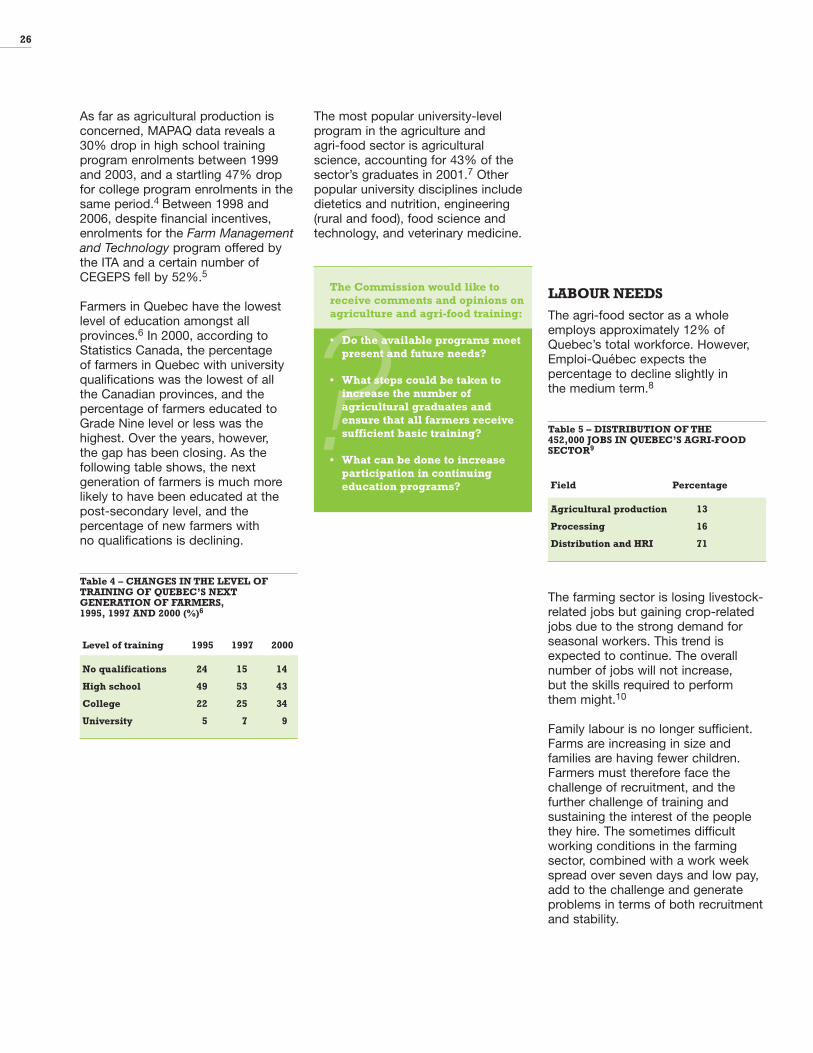
Table 4 – CHANGES IN THE LEVEL OFTRAINING OF QUEBEC’S NEXTGENERATION OF FARMERS, 1995, 1997 AND 2000 (%)6
Level of training 1995 1997 2000
No qualifications 24 15 14
High school 49 53 43
College 22 25 34
University 5 7 9
The most popular university-levelprogram in the agriculture and agri-food sector is agriculturalscience, accounting for 43% of thesector’s graduates in 2001.7 Otherpopular university disciplines includedietetics and nutrition, engineering(rural and food), food science andtechnology, and veterinary medicine.
The Commission would like toreceive comments and opinions onagriculture and agri-food training:
• Do the available programs meetpresent and future needs?
• What steps could be taken toincrease the number ofagricultural graduates andensure that all farmers receivesufficient basic training?
• What can be done to increaseparticipation in continuingeducation programs?
LABOUR NEEDS
The agri-food sector as a wholeemploys approximately 12% ofQuebec’s total workforce. However,Emploi-Québec expects thepercentage to decline slightly in the medium term.8
Table 5 – DISTRIBUTION OF THE 452,000 JOBS IN QUEBEC’S AGRI-FOODSECTOR9
Field Percentage
Agricultural production 13
Processing 16
Distribution and HRI 71
The farming sector is losing livestock-related jobs but gaining crop-relatedjobs due to the strong demand forseasonal workers. This trend isexpected to continue. The overallnumber of jobs will not increase, but the skills required to perform them might.10
Family labour is no longer sufficient.Farms are increasing in size andfamilies are having fewer children.Farmers must therefore face thechallenge of recruitment, and thefurther challenge of training andsustaining the interest of the peoplethey hire. The sometimes difficultworking conditions in the farmingsector, combined with a work weekspread over seven days and low pay,add to the challenge and generateproblems in terms of both recruitmentand stability.
26
In the food processing industries andfood-related services sectors, theproblem of recruiting and sustainingthe interest of workers is common.Difficulties arise from the fact thatmany of the jobs are demanding andthe food industry must compete withother types of firms seeking to attractpeople from the same labour pool.
Agriculture and agri-food enterprisesneed a larger workforce that is bothstable and competent if they are tocontinue to develop.
The Commission would like toreceive comments and opinions onthe strategies required to attractand retain human resources in theagriculture and agri-food sector.
• What strategies should be used to provide agriculture and agri-food enterprises with thequalified workers they need?
• What role should governmentsplay?
• How can a new pool of workers,such as immigrants, be attractedto the agriculture and agri-foodsector?
INNOVATION
In the present, highly competitivecontext, everyone agrees on theimportance of innovation. Research,technology watch activities andknowledge transfers are a source of profit and productivity, productdiversification, adapted solutions and new processes.
In 2002, a total of around $178 millionwas invested in agriculture and agri-food research in Quebec, half bythe industry itself, 36% by the federalgovernment and 14% by the provincialgovernment. R&D spending in thesector increased significantly between1995 and 2002, from $43 million to$89 million.6 This situation reflects, in part, the decision by MAPAQ tosupport the development ofpublic/private corporations. R&Dactivities have also been implementedwith input from the industry, and thistransfer of resources has created newleverage.
In 2002, R&D spending byfood processing companiesaccounted for 0.24% ofshipments, compared with0.15% for Canada as a wholeand 0.16% for Ontario6
In fiscal year 2004-2005, MAPAQdirectly invested a sum of $22.5million in technological innovation in the form of support for centres ofexpertise, research corporations andjoint initiatives.10
Knowledge is transferred via extensionactivities. As an example, every yearthe Centre de reference en agricultureet agroalimentaire du Québec(CRAAQ) reaches approximately20,000 clients through its conferences,publications and web-baseddatabank.11 The federations of theUnion des producteurs agricoles(UPA), cooperatives, MAPAQ officesand many other associations alsoorganize a host of extension activities.A number of specialist publicationsand web sites also disseminateinformation.
Based on your own vision of theagriculture and agri-food sector,what strategies are needed tosupport research, technology watch and new knowledge transferactivities:
• Is sufficient money beinginvested in research, technologywatch and new knowledgetransfer activities, and is themoney being properly targeted?
• Do the investments target themarket niches with the bestfuture potential?
• How can exchanges between thevarious knowledge producers beimproved?
• What can be done to maximizethe impact of investments inresearch and development?
• What can local and regionalauthorities do to supportinnovative activities within theirterritories?
• What role should the State play?
27
SPECIALIZED ADVISORYSERVICES
Advisory services are vital to thetransmission of new knowledge. To play their role properly, consultantsmust be aware of recent findings,especially from applied research. Theymust forge and maintain trust-basedcontacts with their customers.
Farm advisory services used to bealmost exclusively the responsibility of MAPAQ. Twenty years ago, MAPAQchanged its strategy, cutting back ondirect interventions and reducing itsworkforce, and providing financialsupport for group advisory structuresinstead.
The collective formula, developed firstby the farm management clubs,allows groups of farmers working on avoluntary basis to develop a servicethat they themselves manage andpartly fund. Using this model,advisory services were subsequentlydeveloped in the areas of production,agro-environmental techniques andfarm transfers.
Regional advisory networks were also created. The aim was to makeadvisory services more accessibleand to tailor them more to the needsof individual regions.15 Subsidizedadvisory services are used by onlyone-third of Quebec’s agriculturaloperations.12
A number of farm suppliers, financialinstitutions, feed companies andcooperatives have recruitedagronomists and technicians anddeveloped their own advisoryservices. These services are usedextensively and are also valued byproducers, although they areperceived in some quarters as beingless neutral.
The need to coordinate these serviceswhile maintaining their accessibility and increasing the number of users hasreceived a great deal of attention inrecent years. The federal government’sstrategic framework, by leaving moreroom for individual choice by farmmanagers, has also helped to changethe dynamics of the situation, especiallywith regard to the group formula.
Processing and distribution companieshave access to the services of firms of all types offered throughEmploi-Québec, the Ministère duDéveloppement économique, del’Innovation et de l’Exportation andother federal and provincial governmentdepartments and agencies.
Lastly, a number of private companiesjoin with professional, sector-basedassociations in order to obtain theexpertise they need through workshops,conferences, events, and so on.
The Commission proposes thefollowing subjects for reflection,among others:
• How can access to advisoryservices be developed?
• What can be done to guaranteethe quality of all these services?
• What can be done to ensure thatexisting resources work together?
• Does training for advisors andconsultants meet current needs?
28

Our living environment is fragile andwe must take care of it—this is themessage we have received fromcitizens of all backgrounds. Agriculturemust preserve the resources on whichit depends if it is to remain viable.Water and soil quality are essential to its ongoing survival.
The practices best suited to preservingthe environment require work andinvestment by government, farmers,processors and other stakeholders.Although efforts in Quebec comparefavourably to those elsewhere inCanada and around the world, researchtends to show that the results obtainedare not completely satisfactory, andthat we have not yet attained thebalance needed to ensure sustainabledevelopment.2
MAIN OBSERVATIONS
WATER
In Quebec, water management hasbeen based on watersheds since2002. A watershed is a drainage basincomprised of an area of land in whichall surface water drains towards thesame outlet. The watershed approachis designed to take into account allaspects of water management,ecosystems and water usage by allplayers within the watershed.3
Animal, industrial and domesticwaste, including runoff from septicsystems along lakes and rivers,overflow from municipal sewagesystems4, and mineral fertilizers andpesticides, are the main sources ofwater pollution in Quebec.5 If theability of a watershed to supportpollution is exceeded, various typesof algae (including cyanobacteria) andaquatic plants may proliferate makingthe water unsafe for swimming anddrinking.
A sign of the direction in whichthe agri-environment is movingis that over the last three years,the number of bodies of waterin Quebec affected bycyanobacteria has increasedfrom 53 to 73.6 Phosphoroushas been identified as the mainfactor in this proliferation.7
Numerous water supply systems inrural areas that rely on groundwater,as well as private domestic wells, areor have been affected by nitrates. A study entitled La qualité de l’eaupotable dans sept bassins versants en surplus de fumier et impactspotentiels sur la santé, carried out in2004, compared intensive agriculturezones and control zones in sevendifferent watersheds. The resultsshow that wells in agricultural zonescontain more nitrites and nitrates, butsimilar numbers of micro-organisms.8
All human activities have an impact on, and modify, the environment.Agriculture, by its very nature, is a major user of resources such as
land and water. In fact, with 1.9 million hectares of land undercultivation,1 agricultural productionoccupies much of the inhabitedportion of Quebec. Taken together,these two observations underlinean inescapable fact: the quality of our environment, and of itsecosystems, is closely tied to
the quality of our agriculture and agri-food practices.
7Agriculture,agri-food andtheenvironment
The authors of the Suivi 2003 duPortrait agroenvironnemental desfermes du Québec9 state thatcontrolling diffuse pollution generatedby pesticides is a key issue for regionswhere over 50% of the land is treatedwith pesticides, in other words six outof the 14 regions in which agricultureis prevalent.
Within a given watershed, researchhas shown a causal relationshipbetween areas where the land isworked for cultivation purposes, forexample for crops such as corn andpotatoes, and a deterioration in waterquality. There is also a link betweentotal forested area and water qualitywithin a watershed.10
Urban sprawl and agriculturalexpansion have led to thedisappearance of forests andwetlands which act as sponges andhelp stabilize water flow after stormsand snowmelt. This situation hasincreased runoff and the risk of soilerosion.
SOIL
An agricultural soil is a livingenvironment that requires a correctbalance of water, air, living organismsand nutrients. This balance ensuresthe health of the soil. When thebalance is upset, plants can no longergrow at their optimum rate and cropyields may be affected. Nature takesseveral thousand years to “create” a balanced soil.
In recent decades, pork and poultryfarms often have not owned any landunder cultivation. In some cases thiscan lead to an imbalance between thearea of land under cultivation and thevolume of animal waste to be spreadin a given zone.11
The last exhaustive scientific study of soils in Quebec, Inventaire desproblèmes de dégradation des solsagricoles du Québec was published in1990. More recent data from a surveyconducted by IRDA and MAPAQ onthe minerals present in soil, particularlyphosphorous, show that over-fertilization12 exists in watershedswith higher concentrations oflivestock and more intensiveagriculture.
AIR
According to the Ministère duDéveloppement durable, del’Environnement et des Parcs(MDDEP) agriculture contributesaround 9% of Quebec’s greenhousegas emissions, mainly in the form ofnitrogen losses from soil under certainspecific conditions, methane productionfrom bovine digestion, and manureslurry storage. For comparisonpurposes, the transportation sectoremits the most greenhouse gases(37%), followed by the industrialsector (31%).13
Agricultural activities, and especiallythe pork sector, also produce odoursmainly from the spreading of manure.This has led to social problems insome regions where farms are locatedclose to residential areas. In addition,according to MAPAQ, more than 50%of dairy farms now manage theiranimal waste in liquid or semi-liquidform, adding to the odour problem.14
BIODIVERSITY
More than 70% of the forest habitatsin the St. Lawrence Valley havedisappeared. Agriculture, by changingthe habitats of wild species and usinga small number of cultivated plants,results in a reduction of biodiversity. It is estimated that the risk ofbiodiversity loss is high when forestcover falls below 30% in a givenarea.15 Wooded areas on farms havea number of important functions forecosystems, especially by preservingnative animal and plant species in theagricultural environment and by actingas windbreaks.
Transgenic plants are seen by somepeople as a cause for concernbecause they disperse alien genesinto the environment.16 Genetically-modified plants contain genes fromother species, including bacteria,viruses, plants or even animals.Scientific examination has shown thatdispersion may create a risk oftoxicity for insects, an increase inresistant insect populations, and theemergence of herbicide-resistantweeds. Other studies havedemonstrated possible benefits: lowerpesticide use, less toxic pesticides,less tillage and increased agriculturalproduction.
30

31
The Commission would like to hear the views of participantsconcerning strategies and ways of achieving and maintaining abalance between the environmentand agriculture.
• How can the responsibilities ofthe agricultural, industrial andmunicipal sectors with regard toenvironmental protection beexercised more effectively?
• Are the strategies used to manage animal wasteappropriate, especially withregard to water quality?
• What steps should be taken toreduce the negative effects ofliquid manure management?
• Which are the best agronomicpractices, especially inconnection with fertilization, soil conservation and pesticideuse?
• How can agriculture help reducegreenhouse gas emissions andcontribute to the broader effort to reduce global warming?
• What should be done to maintainand increase biodiversity onagricultural land?
• What do you think about the useof genetically-modified plans interms of the risks and benefitsthey represent?
GOVERNMENT POLICIES
Government policies, laws, regulationsand assistance programs based onsustainable development havegradually been introduced to addressthe complex environmental and co-habitation problems faced by the agricultural sector.
• In 2002, the Quebec Water Policyintroduced a watershed approachfollowing extensive publicconsultation by the Bureau des audiences publiques surl’environnement (BAPE).
• The Groundwater CatchmentRegulation is intended to protectgroundwater used for humanconsumption, and to managegroundwater extraction.
• The Protection Policy for Lakeshores,Riverbanks, Coastal zones andFloodplains governs conservationpractices for the areas in question.
• The Regulation on AgriculturalOperations is intended to restore abalance between the volume ofeffluent generated by livestockoperations and the soil’s carryingcapacity for animal waste.Phosphorous levels serve toestablish the limit for applying farmfertilizers. Since 2004, amendmentsto the Regulation have prohibitedthe creation of any new lots ofcultivated land in a large number of municipalities.17
• The Agricultural OperationsRegulation specifies that by 2010,all farms must have access to 100%of the area required to spread theanimal waste they generate fromtheir livestock activities.17 If asufficient area of cultivated land isnot available, they will have toprocess and dispose of the waste inanother way. Many people wonderif this objective is achievable.
• The use of pesticides is governedby the Pesticides Act, the Regulationrespecting permits and certificatesfor the sale and use of pesticidesand the Pesticides ManagementCode. Under these rules, farmersmust pass an examination in orderto obtain a certificate allowing themto use pesticides for agriculturalpurposes.
Financial support measures have beenimplemented by the government, inparticular to help farmers make theinvestments required to comply withenvironmental standards, supportresearch, create incentives for soundagricultural practices and offer advisoryservices in the agri-environmentalfield.18
In 2001, Quebec’s programsand regulations generated the highest level of agri-environmental investmentin Canada, at $4,126 per farm.In the rest of Canada, in the same year, the average amount invested was $1,091 per farm.19
In 2002, the Quebec government set itself the objective of making itsassistance programs eco-conditional;in other words, compliance withenvironmental standards became oneof the eligibility criteria for governmentassistance. La Financière agricole duQuébec and MAPAQ are responsiblefor applying eco-conditional measuresin the agriculture sector, and the Actrespecting La Financière agricole duQuébec was amended accordingly in2004. In 2005, MAPAQ introducedenvironmental compliance conditionsfor one of its principal financial supportprogram, the partial reimbursement ofthe property taxes paid by farms. Tobe eligible for the program, farmersmust submit a phosphorous report on their farm to the MDDEP.
The Commission would like toreceive comments fromparticipants concerning the natureand stringency of environmentalrequirements in the field ofagriculture.
• Do the requirements target theright problems?
• Are the standards sufficient?
• Do the standards produce theexpected results?
• Should farmers alone bear thecost of the environmental normsthey are required to uphold in the collective interest?
• Are current governmental agri-environment policiesadequate?
• How could the policies beimproved?
• Does the government have thetools it needs to enforce andfollow up on its regulations andpolicies? Is the current level of government supervisionadequate?
32
Nevertheless, there are growingconcerns about food quality and theway it is controlled. Several peoplehave suggested a loss of publicconfidence in the food production andprocessing chain.
The agriculture and agri-food sectorhas also been affected by the need toswitch to a healthier lifestyle. One ofthe key challenges of public health isto encourage individuals to eat amore balanced diet and take moreexercise. Many people believe themission and objectives proposed bythe government for the agricultureand agri-food sector should includeobjectives centred on the promotionof consumer health.
FOOD SAFETY
The Canadian Food InspectionAgency, MAPAQ and the Centrequébécois d’inspection des alimentset de santé animale are jointlyresponsible for compliance with foodsafety standards. Several governmentmeasures and programs are designedto ensure that food is safe, clean andtraceable. The overall objective is tomake sure the food supply is safe andminimize the risk of contamination atall stages in the production chain.
In the area of food safety, MAPAQ’spriorities are established on the basisof potential risks for human health.Food products that represent a healthrisk are withdrawn from the market.
A survey carried out in 2005-2006 found that nine out of tenpeople believe the foodproducts on sale in Quebec tobe safe.2
Pesticides are also a cause ofconcern for many people. Amongst agroup of 32 countries, including themembers of the European Union andthe United States, Canada permits thehighest levels of pesticide residue. Inaddition, a comparative analysis withthe European Union and the UnitedStates shows that Canada permits theuse of 60 pesticides that have beeneliminated, prohibited or withdrawn byother jurisdictions.3
It is important to note that Quebec’sPesticides Management Code,4 whichcame into force in 2003, prohibits theuse of more than 100 pesticideproducts within the municipal milieuthat are still used3 in the rest ofCanada. Since 2001, the Regulationrespecting the quality of drinkingwater requires the person in charge ofa water distribution system servingmore than 5,000 people to conductquarterly checks for 25 pesticides.Out of 213 municipal water systemssampled from June 2001 toDecember 2004, 116 showed traces5
of one or more pesticides.
The agriculture and agri-food sector, because of its role as a food producer, has a determining influence on public health.
Life expectancy in Quebec hasprogressed rapidly, from 60 yearsin 1920 to 79.7 years in 2000.1
The general health of thepopulation has also improvedmarkedly in recent decades.
8Healthand consumerconcerns
It has been suggested that illnessesmay be caused by the presence ofundesirable substances in theenvironment and the food supply.However, research is, as of yet,unable to prove that the characteristicsof the agri-food environment have animpact on the incidence of chronicillness.
SANITARY CHALLENGES INLIVESTOCK PRODUCTION
In the winter of 2003, a single case ofbovine spongiform encephalopathy(mad cow disease) in Alberta wasenough to close the border withCanada’s main customer, the UnitedStates. The following year, fears of aglobal epidemic of bird flu led to thewidespread preventive slaughter ofpoultry in infected zones. The recentcontamination of food products byClostridium botulinum, Salmonellaand E. coli bacteria has also raisedconcerns.
Against this background, stakeholdersin the agriculture and agri-food sector,working with the Quebec government,have established a traceability systemthat currently tracks two products:beef and lamb. The Canadiangovernment eventually proposes tomake most retail food productstraceable at all stages of the agri-foodchain.
Many people believe that growthhormones are widely present in foodproducts. They are, in fact, used bybeef cattle producers to promotemuscle development. However, theyare not used at all in the poultry orpork sectors.6
The use of antibiotics is a furtherconcern. Consumers are afraid ofingesting them with their food, or thatthey will spread in the environment.Some poultry and pork producers useantibiotics preventively, or to stimulategrowth.
This use of antibiotics is controversialsince, according to the Institutnational de santé publique, they canpromote the development ofantibiotic-resistant bacteria.7 TheBAPE is also concerned about thepotential risk created by antibioticresidues contained in manure slurry.8
NEW TECHNOLOGIES ANDTRENDS
Over the last few years, food productshave tended to reflect new trendsbased on the most recent scientificdiscoveries: functional, nutraceuticaland antioxidant foods are now amongthe products offered. Grocery storeshave now begun to stock specializedfoods, such as Omega 3 milk,calcium-enriched juices and yoghurtenriched with active bacteria.
The application of certain cutting-edgetechnologies is also a concern. Theuse of genetically-modified organisms(GMOs) is highly controversial inEurope, and to a lesser degree inNorth America.
Currently, around a dozengenetically-modified plantshave been approved inCanada. Three are cultivated inQuebec—grain corn, soya andcanola.9
There are currently no genetically-modified fruits or vegetables on salein grocery stores,9 although someproducts contain GMO derivatives,such as soya lecithin, canola oil andcorn starch. In Canada, the use ofGMOs must be approved by theCanadian Food Inspection Agency,and the provinces are not involved in the approval process.
The Commission would like toreceive comments from participantson the following points:
• Are the standards used in the food inspection system,especially those that set pesticide residue levels,satisfactory?
• How could the food inspectionsystem be improved?
34

HEALTHY FOOD ANDLIFESTYLES
The food we eat depends on ourindividual choices, but also on theprevailing social environment. It isimportant to understand howagriculture and agri-food policies help create this environment.
Consumers are increasingly aware of the content of food products, andtry to avoid various types of fat, salt,and refined and allergenic sugars,while increasing their consumption of products rich in fibre, minerals and vitamins. Organic and fresh local products are also gaining inpopularity.10 Over half of allCanadians (57%) choose foodproducts on the basis of their fibre,antioxidant and fatty acid content,among other things.11 A campaignhas been launched calling for legislationto ban the use of trans fats, as iscurrently the case for restaurants inNew York City.
Data from the Institut national desanté publique (INSP) for the year2005 shows that only 35% of adultmen and 53% of adult women eat fivedaily portions of fruit and vegetables.12
The figures for children aged 16 andunder are also worrying.
In 2004, 57% of Quebec’spopulation had a weightproblem (35% were overweight,22% obese)13 due to poor diet,combined with an inactivelifestyle. Weight-related illnesses(diabetes, high blood pressure,heart disease) are increasinglyprevalent. The direct healthcare costs associated withobesity were estimated at $1.6 billion in 2001, and theindirect costs at $2.7 billion.7
The UN Food and AgricultureOrganization recommends a reductionof the individual daily energy intake offats, sugar and salt.7 The availabilityand affordability of high-qualityproducts, especially fruit andvegetables, is paramount in achievingthis goal.
Because many people eat outside the home, the hotel, restaurant andinstitutional (HRI) sector is increasinglyinvolved in this issue. Many peoplequestion the nutritional quality ofcertain meals, stressing the importanceof offering healthy choices andreducing portion sizes. Daycarecentres and schools, too, are nowbeing encouraged to improve theirmenus. Culinary schools have alsobeen asked to make a contribution by adjusting their programs.
It is generally agreed that currentinformation and education measuresare not sufficient. Action must also betaken with the food environment: theagri-food industry, producers,processors and distributors all play a determining role in supplying high-quality products and, therefore,in ensuring public health.
The World Health Organization (WHO)believes agricultural and economicpolicies can also be used to promotethe supply of safer, more nutritiousand more affordable food. In the viewof the WHO, a key element in the fightagainst obesity and chronic illness isthe ability of a government toestablish a strong partnership with itsagri-food industry.7
The Commission wishes to receiveopinions and comments on thefollowing questions:
• What role do consumers,processors, distributors and theState play in improving healthyeating patterns?
• Is the available information on the nutritional value of foodproducts sufficient and adequate?
• What can agriculture and agri-food policies do to promotebetter eating habits?
• What can be done to ensure thatconsumers are informed in astraight-forward, credible andcoherent manner?
• How can agri-food policiessupport the HRI sector to do more to encourage healthy eating habits?
35
HEALTH OF HUMANRESOURCES IN THEAGRICULTURE AND AGRI-FOOD SECTOR
The health of workers in theagriculture and agri-food sector is another issue that requiresexamination.
A recent survey of thepsychological health of farmers found that onerespondent out of two (50.9%) had a high level of psychological distress,compared to 20.1% forQuebecers as a whole. More than one out of 20 farmers had suicidaltendencies, compared to one person out of 25 in the general population.14
In addition to financial worries, anumber of other factors affect thepsychological health of Quebecfarmers. They include regulatoryrequirements, market instability,animal sickness, workloads,worldwide competition and climatechange.
The agriculture sector also presents a high risk of work-related accidents.Agriculture ranks as the third mostdangerous industry in Canada. The Canadian Agricultural InjurySurveillance Program reports that in Canada, between 1990 and 2003,1,547 people died as a result of awork-related injury.15
In addition, the Commission de lasanté et de la sécurité du travail(CSST, the Quebec workplace healthand safety board) reports that, in2002, the food and beverage sectorhad an injury rate 92% higher thanthe average for other sectors ofactivity.16
The Commission would like toreceive opinions concerning thehealth of farmers, farm workersand food processing workers:
• What measures would ensurebetter protection for the physicaland mental health of humanresources in the agriculture and agri-food sector?
36

AGRICULTURE AND RURALLIFE
Presently, 1,023 out of 1,262municipalities in Quebec areconsidered to be rural municipalities,with fewer than 5,000 inhabitants.They are home to slightly over 1.3million people, and cover 80% of theinhabited land mass.1 It is importantto note that 252 municipalities inQuebec have fewer than 500inhabitants, and the rural landscape ischaracterized by its low populationdensity.2
Data compiled by the Institutde la statistique du Quebecshow that Quebec’s ruralpopulation is decreasing.3Between 1996 and 2005, 53%of all rural municipalities lost atotal of 61,000 inhabitants.4
An ageing population and the exodusof young people to major urbancentres are both recognizedphenomena. For the time being, thegrowing attraction of urbanites to ruralcommunities has not been sufficientto reverse the falling demographiccurve.
The current situation has led to agrowing debate about ways to ensurethe dynamic occupation of Quebec’sterritory. Maintaining the criticalpopulation mass required to ensurethe viability of public and privateservices is another issue. Theindicators published in 2005 by theMinistère du Développementéconomique, de l’Innovation et del’Exportation show that the problem ofeconomic disparity is increasinglyaffecting outlying and resource-basedregions.5
The State has introduced regionaldevelopment policies in the economicand social fields. The Quebecgovernment’s National Policy onRurality, recently updated andextended until 2014, targets ruralcommunities. Its key element is thesigning of rural partnershipagreements with regional countymunicipalities (known as MRCs).Under the agreements, thegovernment and elected municipalofficials in rural areas make a jointcommitment to support projects thatwill ensure the ongoing viability ofrural communities.
Agriculture, too, has undergone aseries of far-reaching changes in
recent decades. Farm specializationand increased size has led to areduction in the number of farms andthe size of the agricultural workforce.
Data from Statistics Canadashow that the agriculturalpopulation fell by 26% between1991 and 2001, and nowaccounts for only 6.4% of therural population and 1.3% ofthe total Quebec population.6
Agriculture and rural life in Quebec have always beenclosely linked.9Rural life
andregionaldevelopment

Problems connected with the transferof farms to the younger generationand access to the farming professionhave been cited, along with thegrowing difficulty of recruiting workers.
For many observers, the long-termvitality of rural communities dependson the diversification of the regionaleconomy: agriculture, forestry andnatural resource extraction must bepart of a more varied economic basethat includes service and processingactivities, as well as a dynamicrecreation and tourism industry.
It is clear that the modernagriculture and agri-food sectorstill plays a vital role in regionaleconomies. MAPAQ’s 2005agri-food profile states thatagriculture still accounts for10% of employment in 13 ofQuebec’s 17 administrativeregions.7
In addition, other jobs are provided by food processing and distributioncompanies. Many jobs linked toagriculture are also found in a rangeof sectors including agriculturalinputs, transportation, machinerysales and maintenance, veterinaryservices, advisory and consultancyservices, construction, financing, and public service.
The agriculture and agri-food sector is an important asset for Quebec’sregions and rural communities. Itprovides employment for many ruralfamilies. It is vitally important toidentify the conditions and strategiesrequired to ensure that the agricultureand agri-food sector contributes aseffectively as possible to the vitalityand ongoing viability of ruralcommunities.
The Commission wishes to receiveopinions and comments concerningthe following questions:
• How can agricultural policiessupport a form of agriculture that will contribute more to rural development?
• How should regional agricultureand agri-food potential be takeninto consideration in the design of public policies?
• What opportunities are offered by modern agriculture?
• What should be done to ensure a better response to the problemof transferring farm ownershipfrom one generation to the next,and to help young people see a future in the agriculture andagri-food sector?
RECONCILING LAND USES
Members of the general public,whether living in an urban or ruralsetting, are increasingly concernedabout environmental protection andquality of life. They want their concernsto be a focus of development, andthey want to be consulted on thisissue.
There have been several recentconflicts concerning land use andsocial acceptability, mainly connectedwith pork production. Although thereare many underlying factors in theseconflicts, most people would agreethat it is not usually livestockproduction itself that is questioned,but rather certain specific practicesand the way in which new facilitiesare positioned in the community.
Since 1997, municipalities have beenresponsible for reconciling agriculturaland non-agricultural activities via theland use and planning tools availableto them.8 Although local authoritieshave been asked to seek a consensusbetween farmers, elected officials andthe non-agricultural population,several have realized that a balancedapproach will require a more openand responsible attitude on the part of agricultural operations, along withadapted practices and methods, anda constant search for new solutionsthat allow enterprises to remaincompetitive.
At the opposite end of the spectrum,the development of other types ofactivity in agricultural areas has alsogenerated friction. Examples includeextension of residential, commercialor industrial usage in agriculturalzones, the construction of isolateddwellings in agricultural zones, andother land uses that have an impacton agricultural land such as hiking,ATV and snowmobile trails, powertransmission lines, oil pipelines, windfarms, new roads, etc.
In 1978, to ensure adequate protectionfor productive farm land in Quebec,the Government passed the Act topreserve agricultural land. Theamendments made to the Act overthe last ten years have extended itsscope, and it is now known as the Act to preserve agricultural land andagricultural activities (APALAP).9
38

The Commission de protection duterritoire agricole du Québec (CPTAQ,the Quebec farm land protectioncommission) manages applications forthe authorization of non-agriculturalactivities in agricultural zones. It facestwo main challenges, namely thepressure of urban development onagricultural land adjacent to urbancentres, and the introduction of non-agricultural (mainly residential)uses in rural areas.
Although the type of pressure onagricultural land is not the same in all communities, few people questionthe relevance and usefulness of theAPALAP. However, some believe itdoes not always take regionalparticularities into account, whileothers suggest that by protecting theagricultural vocation of land with lowproduction potential it can actuallyhinder the revitalization of rural areasin some regions.
Representatives of the farmingcommunity, in turn, point outthat less than 2% of Quebec’sland mass is suitable foragriculture, and that this landmust be protected.10
An increasing number of ruralcommunities must manage theproblem of reconciling agriculturaland non-agricultural activities.
• What steps should be taken to reconcile different land uses in rural areas?
• What should be the role of each player: the CPTAQ,municipalities, the Quebecgovernment and its departmentsand bodies, and otherstakeholders?
• Is the CPTAQ using the rightmanagement framework andmethods?
NEW DEVELOPMENTPROSPECTS
New prospects for agri-fooddevelopment offer potential for local and regional development.
Some countries haveintroduced the concept ofmultifunctionality to measurethe role played by agricultureand its contribution to collectivewealth. This requires anexamination of the institutionalmechanisms, marketmechanisms and agriculturalpolicies used to promote abalance between the differentfunctions of agriculture: foodproduction, land use,stimulation of rural communitiesand maintenance of thecollective heritage.11
Some interesting prospects for non-traditional crops, or crops intendedfor use in biotechnology, have beenproposed. Other suggestions includethe development of smaller-scaleagriculture, part-time agriculture, or the creation of small agriculturalcompanies supported by thecommunity.
Organic agriculture and other“alternative” approaches are oftenproposed as a way of meeting socialand environmental concerns andresponding to the new needs ofgrowing numbers of consumers.However, it has also been suggestedthat the potential market is not largeenough to encourage farmers to makethe switch.
The promotion of local and artisanproducts, as well as agri-tourism have also been suggested as ways ofdiversifying the income of farms andrural communities. Some people havesuggested that the marketing of ruralproducts should be supported by thecreation of a network of dedicatedfarms, and by locally-based processing.Larger-scale production of ruralproducts could be conducive to localprocessing and marketing, or directfarm sales. The creation of alternativedistribution networks for rural productsis another solution that is beingconsidered.
The Commission would like toreceive opinions and comments on the following questions:
• How can food processingcompanies be encouraged tosettle, remain and develop inQuebec’s regions?
• How can the growth and financial viability of new types of production be assured?
• How can sufficient outlets befound for new products, how can they be made profitable, and how can they make adynamic contribution to ruralcommunities?
39
AGRICULTURE AND AGRI-FOOD CANADA
Under the Constitution Act, both thefederal and provincial governmentshave the power to pass legislationconcerning agriculture. However, theAct also states the primacy of federallegislation.1
The actions of Agriculture and Agri-food Canada are based on a pan-Canadian vision of sectordevelopment. One recent example is the Agricultural Policy Framework(APF) that has been in force since2003. It focuses on five complementaryelements: business risk management,the environment, food safety andquality, renewal, and science andtechnology.2
The actions of the federal governmentconcern agri-food trade policy, tradeagreements and negotiations, thepromotion of exports from Canadaand Quebec, food safety, food producttraceability, quality assurance andfood inspection, through the CanadianFood Inspection Agency (CFIA). Finally,the federal government contributes tothe stabilization of farm revenues(CAIS) and the management of farmcash flow through the advancepayment program.
In Quebec, one of the key issuesconnected with the negotiation andimplementation of the AFP isQuebec’s scope for autonomousaction and the recognition of itsprograms. Some people havequestioned the overly rigid nature of Canadian policies and would like to see them take more account ofQuebec’s unique situation, problems,orientations and institutionalstructures.
The agriculture and agri-food sector includes a large numberof players from the government, private, union, cooperative
and volunteer communities, whosepowers and responsibilities are oftenexclusive to Quebec.
The federal and provincial governments,local and regional authorities, La Financière agricole du Québec
(FADQ) and the Union des producteurs agricoles duQuébec (UPA) and cooperatives all play a key role in the governance of the agriculture and agri-food sector.
10Governance

THE MINISTÈRE DEL’AGRICULTURE, DES PÊCHERIES ET DEL’ALIMENTATION DUQUÉBEC
The mission of the Ministère del’Agriculture, des Pêcheries et del’Alimentation du Québec (MAPAQ) is to ensure the growth of Quebec’sagri-food industry with a view tosustainable development.3 In pursuitof its mission, it takes action throughits programs and policies in allsectors: production, processing,distribution, marketing and theconsumption of agriculture and agri-food products and services. It is also active in the field of the agri-environment.
Three government bodies come under MAPAQ’s authority, namely La Financière agricole du Québec, the Régie des marchés agricoles etalimentaires du Québec (RMAAQ) and the Commission de protection du territoire agricole du Québec(CPTAQ).4
The overly narrow economic focus ofMAPAQ and the lack of attention paidto rural matters in its mission statementare a disappointment to some people.In some European countries, and inother Canadian provinces, thedepartment of agriculture is responsiblefor a broader rural vision, often via arural policy. In Quebec, responsibilityfor rural matters is currently entrustedto the Ministère des Affairesmunicipales et des Régions (MAMR).Another aspiration is that MAPAQtake more action in the field ofnutrition.
REGIONAL AND LOCALAUTHORITIES
Quebec’s regional county municipalities(MRCs) and municipalities, throughtheir powers and responsibilities inthe area of land use planning, play arole in the expansion and supervisionof agriculture and agri-food activities.The actions taken by MRCs andmunicipalities are defined byprovincial legislation and guidelines.
Municipalities are legally required to give priority to agriculture as theprimary land use in agricultural zones,and to ensure the harmonious co-habitation of agricultural and non-agricultural land uses.5 Theactions of elected municipal officialsare structured by government landuse guidelines, and their conformitymust be approved by the Minister ofMunicipal Affairs and Regions afterconsulting with the other governmentdepartments concerned. 6 MRCs andmunicipalities are empowered to fileapplications to exclude land from anagricultural zone with the CPTAQ.7
Quebec’s municipalities also exerciseenvironmental responsibilities thathave repercussions on agriculture,including the protection of lakeshores,riverbanks, coastal zones andfloodplains, the determination andenforcement of protection perimetersaround groundwater intakes for humanconsumption, and the treatment ofsewage from individual dwellings.
LA FINANCIÈRE AGRICOLEDU QUÉBEC
In Quebec, financial assistance for farmers is mainly provided by La Financière agricole du Québec(FADQ), a state-owned enterprise thatresulted from the 2001 merger of theRégie des assurances agricoles duQuébec and the Société definancement agricole (SFA).8
It has been pointed out that thecomposition of the FADQ board ofdirectors does not comply with the rulesof governance set out in the policy onthe governance of state-ownedenterprises introduced by the Quebecgovernment in 2006.9 The rules,designed to ensure the independenceof boards of directors, stipulate thattwo-thirds of the members, includingthe chair, must meet certain criteriadesigned to ensure their independence.The purpose of this is to ensure thatthey have no relationships or interestslikely to interfere with the quality oftheir decisions. Since the amountspaid to agricultural operations comemainly from public funding, the largenumber of board members representingthe Union des producteurs agricolesdu Quebec – five out of 11 – has beencalled into question.
La Financière agricole du Québecprovides income protection, cropinsurance and agricultural financingservices for farms, adjusted to thetypes of risks they encounter. Itadministers insured values of almost$4 billion, and its portfolio of securedloans totals over $4 billion. The assetsof the Fonds d’assurance-prêtsagricoles et forestiers (farm and forestloan insurance fund) amount to morethan $120 million. 10
41
THE UNION DESPRODUCTEURS AGRICOLES
The Union des producteurs agricoles(UPA) is the only association certifiedunder Quebec’s Farm ProducersAct,11 a fact that confers a number of special responsibilities such asspeaking on behalf of Quebec’sfarmers and representing them indealings with public authorities. The UPA is made up of 155 localsyndicates, 16 regional federations,222 specialized syndicates and 25 specialized federations. Its membersare classified according to their regionand type of production. 12
Under the Farm Producers Act, no farm producer is obliged to join theUPA, but all must pay a membershipfee. As the sole certified association it can establish, levy, receive andredistribute the fees of all farmproducers even if they are not membersof the association. 11
Compulsory assessment fees alsoexist in Ontario. However, farmproducers can choose to pay them to the agricultural association of theirchoice from a designated list. In theUnited States, France and othercountries, there are no compulsoryassessments paid to agriculturalassociations.
The Government has made the UPAinto a genuine partner by giving itresponsibilities in the management of La Financière agricole and themarketing system supervised by theRégie des marchés agricoles etalimentaires.
COOPERATIVES
Agricultural cooperatives are importantplayers in the agriculture and agri-foodsectors. They play a primordial role inregional development.
For example, the Coop fédérée duQuébec brings together 62,000members from over 100 agriculturalcooperatives. Its mission consists ofproviding supplies and inputs forfarming operations as well asprocessing and marketing their produceon local and international markets.
The Coop fédérée is the 4th largestenterprise in Quebec by revenue and the 7th largest by number ofemployees.13
The Commission would like toreceive opinions and comments on the following questions:
• The Commission would like toreceive opinions and commentson the following questiWhat doyou think about the currentbalance between the roles andpowers of the various players?
• Do Canadian policies pay enough attention to Quebec’sparticularities, problems,orientations and structures?
• Should the mission and policies of MAPAQ be extended to includeconcerns and objectives relating to rural matters, the environmentand nutrition?
• How do you see the future forcooperatives?
42

43
COMMITMENT OF THECOMMISSION
The Commission is systematicallyseeking the comments and opinionsof individuals and groups concernedby the matters that it is looking in to.It has set up a simple, transparentand rigorous consultation processthat is accessible to citizens in everyregion and community in Quebec. The Commission will take the resultsof the consultation process intoaccount when formulating itsrecommendations to the government.It guarantees a transparent, publicapproach, and has adopted a code of ethics and a public consultationpolicy that are publicly available.
REGIONAL PUBLICHEARINGS
The regional public hearings will beheld from February to May, 2007. TheCommission will travel to 15 regionsand 26 municipalities. In each region,the schedule will be adjusted to fit thenumber of individuals and groups whoapply to be heard. In general, theCommission expects to sit in eachregion for two to three days.
The exact date, time and venue of the public hearing in each city will beannounced in the regional media andon the Commission’s website.
How toparticipate
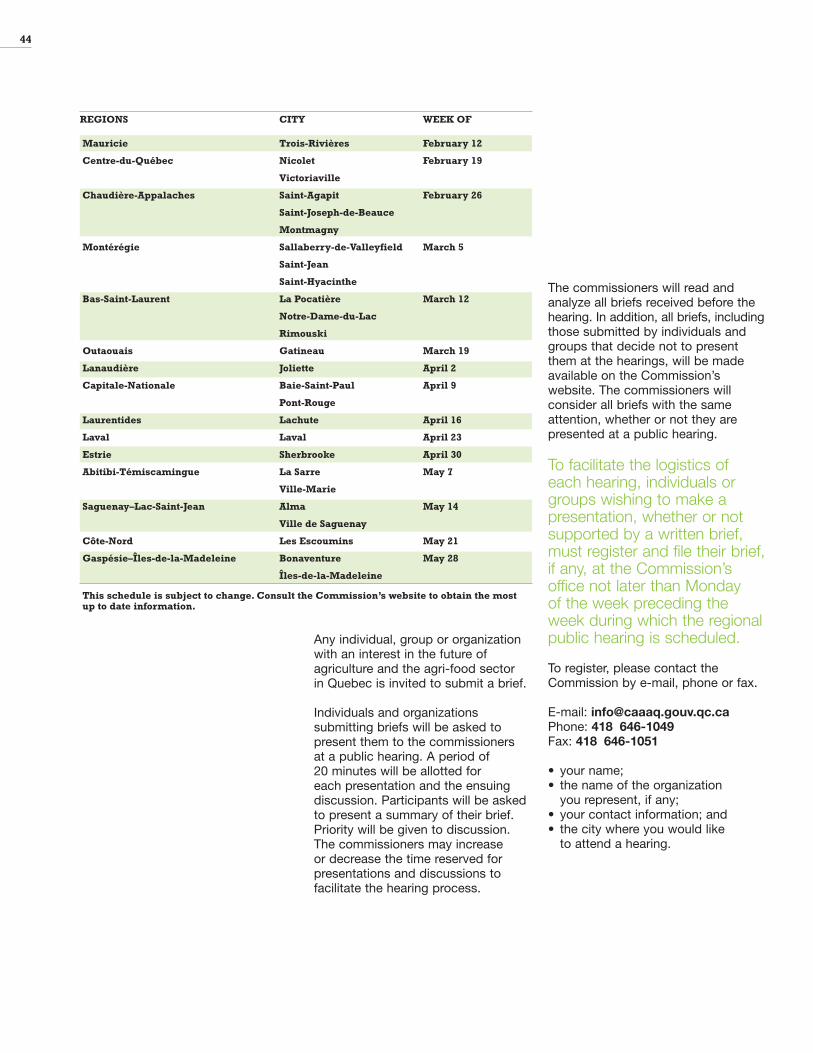
Any individual, group or organizationwith an interest in the future ofagriculture and the agri-food sector in Quebec is invited to submit a brief.
Individuals and organizationssubmitting briefs will be asked topresent them to the commissioners at a public hearing. A period of 20 minutes will be allotted for each presentation and the ensuingdiscussion. Participants will be askedto present a summary of their brief.Priority will be given to discussion.The commissioners may increase or decrease the time reserved forpresentations and discussions tofacilitate the hearing process.
The commissioners will read andanalyze all briefs received before thehearing. In addition, all briefs, includingthose submitted by individuals andgroups that decide not to presentthem at the hearings, will be madeavailable on the Commission’swebsite. The commissioners willconsider all briefs with the sameattention, whether or not they arepresented at a public hearing.
To facilitate the logistics ofeach hearing, individuals orgroups wishing to make apresentation, whether or notsupported by a written brief,must register and file their brief,if any, at the Commission’soffice not later than Monday of the week preceding theweek during which the regionalpublic hearing is scheduled.
To register, please contact theCommission by e-mail, phone or fax.
E-mail: [email protected]: 418 646-1049Fax: 418 646-1051
• your name;• the name of the organization
you represent, if any;• your contact information; and• the city where you would like
to attend a hearing.
44
REGIONS CITY WEEK OF
Mauricie Trois-Rivières February 12
Centre-du-Québec Nicolet February 19
Victoriaville
Chaudière-Appalaches Saint-Agapit February 26
Saint-Joseph-de-Beauce
Montmagny
Montérégie Sallaberry-de-Valleyfield March 5
Saint-Jean
Saint-Hyacinthe
Bas-Saint-Laurent La Pocatière March 12
Notre-Dame-du-Lac
Rimouski
Outaouais Gatineau March 19
Lanaudière Joliette April 2
Capitale-Nationale Baie-Saint-Paul April 9
Pont-Rouge
Laurentides Lachute April 16
Laval Laval April 23
Estrie Sherbrooke April 30
Abitibi-Témiscamingue La Sarre May 7
Ville-Marie
Saguenay–Lac-Saint-Jean Alma May 14
Ville de Saguenay
Côte-Nord Les Escoumins May 21
Gaspésie–Îles-de-la-Madeleine Bonaventure May 28
Îles-de-la-Madeleine
This schedule is subject to change. Consult the Commission’s website to obtain the most up to date information.
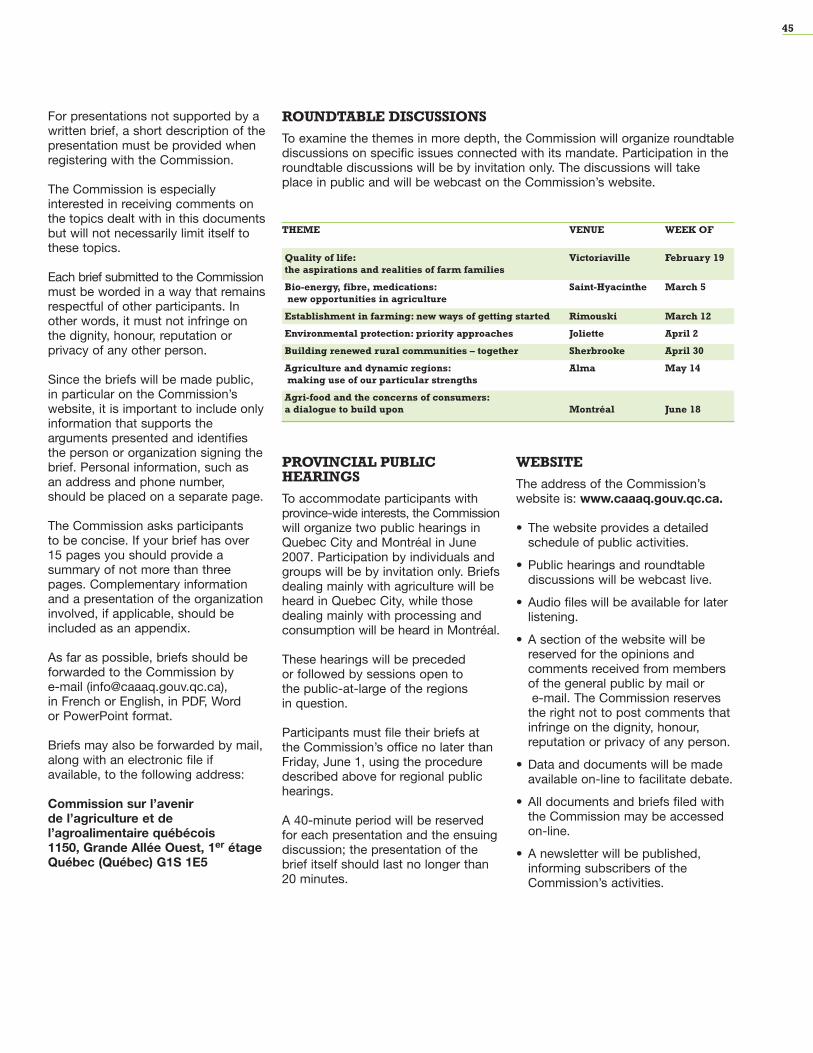
For presentations not supported by awritten brief, a short description of thepresentation must be provided whenregistering with the Commission.
The Commission is especiallyinterested in receiving comments onthe topics dealt with in this documentsbut will not necessarily limit itself tothese topics.
Each brief submitted to the Commissionmust be worded in a way that remainsrespectful of other participants. Inother words, it must not infringe onthe dignity, honour, reputation orprivacy of any other person.
Since the briefs will be made public,in particular on the Commission’swebsite, it is important to include onlyinformation that supports thearguments presented and identifiesthe person or organization signing thebrief. Personal information, such asan address and phone number,should be placed on a separate page.
The Commission asks participants to be concise. If your brief has over15 pages you should provide asummary of not more than threepages. Complementary informationand a presentation of the organizationinvolved, if applicable, should beincluded as an appendix.
As far as possible, briefs should beforwarded to the Commission by e-mail ([email protected]), in French or English, in PDF, Word or PowerPoint format.
Briefs may also be forwarded by mail,along with an electronic file ifavailable, to the following address:
Commission sur l’avenir de l’agriculture et del’agroalimentaire québécois1150, Grande Allée Ouest, 1er étageQuébec (Québec) G1S 1E5
PROVINCIAL PUBLICHEARINGS
To accommodate participants withprovince-wide interests, the Commissionwill organize two public hearings inQuebec City and Montréal in June2007. Participation by individuals andgroups will be by invitation only. Briefsdealing mainly with agriculture will beheard in Quebec City, while thosedealing mainly with processing andconsumption will be heard in Montréal.
These hearings will be preceded or followed by sessions open to the public-at-large of the regions in question.
Participants must file their briefs atthe Commission’s office no later thanFriday, June 1, using the proceduredescribed above for regional publichearings.
A 40-minute period will be reservedfor each presentation and the ensuingdiscussion; the presentation of thebrief itself should last no longer than20 minutes.
WEBSITE
The address of the Commission’swebsite is: www.caaaq.gouv.qc.ca.
• The website provides a detailedschedule of public activities.
• Public hearings and roundtablediscussions will be webcast live.
• Audio files will be available for laterlistening.
• A section of the website will bereserved for the opinions andcomments received from membersof the general public by mail ore-mail. The Commission reserves
the right not to post comments thatinfringe on the dignity, honour,reputation or privacy of any person.
• Data and documents will be madeavailable on-line to facilitate debate.
• All documents and briefs filed withthe Commission may be accessedon-line.
• A newsletter will be published,informing subscribers of theCommission’s activities.
45
ROUNDTABLE DISCUSSIONS
To examine the themes in more depth, the Commission will organize roundtablediscussions on specific issues connected with its mandate. Participation in theroundtable discussions will be by invitation only. The discussions will takeplace in public and will be webcast on the Commission’s website.
THEME VENUE WEEK OF
Quality of life: Victoriaville February 19 the aspirations and realities of farm families
Bio-energy, fibre, medications: Saint-Hyacinthe March 5 new opportunities in agriculture
Establishment in farming: new ways of getting started Rimouski March 12
Environmental protection: priority approaches Joliette April 2
Building renewed rural communities – together Sherbrooke April 30
Agriculture and dynamic regions: Alma May 14 making use of our particular strengths
Agri-food and the concerns of consumers:a dialogue to build upon Montréal June 18

Chapter 1: The food requirements of the population1. STATISTICS CANADA, Survey of Household Spending, December 12,2005, no. 3508.2. INSTITUT DE LA STATISTIQUE DU QUÉBEC, Gouvernement duQuébec, Perspectives de la population, édition 2003.3. INSTITUT DE LA STATISTIQUE DU QUÉBEC, Gouvernement duQuébec, “Si la tendance se maintient… “, Perspectives démographiques,Québec et régions, 2001-2051, édition 2003, November 2004.4. LABRECQUE, J., Les comportements des consommateurs: quelquestendances, Montréal, HEC, March 2005. 5. UNITED NATIONS FOOD AND AGRICULTURE ORGANIZATION(FAO), World agriculture: towards 2015/2030, Summary report, 2002.6. ORGANIZATION FOR ECONOMIC COOPERATION ANDDEVELOPMENT (OECD) and UNITED NATIONS FOOD ANDAGRICULTURE ORGANIZATION (FAO), OECD-FAO Agricultural Outlook,2006-2015, OECD publications.7. JONES, Timothy W., “How much goes where? The corner on foodloss”, in Biocycle, July 2005, p. 2.
Chapter 2: Agricultural production1. Valacta. Rapport de production.2. Compilation by the Centre de développement du porc du Québec.Gestion et exploitation des données, 2005.3. AGRICULTURE AND AGRI-FOOD CANADA, Farm Income, FinancialConditions and Government Assistance, September 2005 andSTATISTICS CANADA, Quarterly financial statistics for enterprises,second quarter, 2006. 4. AGRICULTURE AND AGRI-FOOD CANADA, Farm Income, FinancialConditions and Government Assistance, Table A.3, September 2005.5. STATISTICS CANADA, Balance Sheet of the Agricultural Sector,Table 21-016-XWF, June 2006.6. STATISTICS CANADA, National Balance Sheet Accounts, 4th quarter,2005.7. OECD, OECD Observer, Farm Household Income: Issues and PolicyResponses, october 2004.8. STATISTICS CANADA, Statistics on income of farm families, 2001Census, and catalogue 21-207-XIF, Tables 023 and 018. 9. US DEPARTMENT OF AGRICULTURE, Economic Research Service,Income, Wealth, and the Economic Well-Being of Farm Households,AER-812, Table 2, July 2002. 10. STATISTICS CANADA, Balance Sheet of the Agricultural Sectoron December 31, 2005, Table 1-25, June 2006.11. AGRICULTURE AND AGRI-FOOD CANADA, Farm Income, FinancialConditions and Government Assistance, September 2005 andSTATISTICS CANADA, Quarterly financial statistics for enterprises,second quarter, 2006.12. GOUIN, Daniel-Mercier, La gestion de l’offre dans le secteur laitier,un mode de régulation toujours pertinent, Groupe de recherche enéconomie et politique agricoles (GREPA), Université Laval, September2004, excerpt and partial update, May 2006.13. LA FINANCIÈRE AGRICOLE DU QUÉBEC. Rapport annuel 2005-2006. 14. UNITED NATIONS FOOD AND AGRICULTURE ORGANIZATION(FAO), World agriculture: towards 2015/2030, Summary report, 2002.
Chapter 3: Food processing1. MINISTÈRE DE L’AGRICULTURE, DES PÊCHERIES ET DEL’ALIMENTATION, L’activité bioalimentaire au Québec - Bilan 2005,2006.2. CONFERENCE BOARD OF CANADA, Compilation for Agricultureand Agri-Food Canada, 2003.3. MINISTÈRE DE L’AGRICULTURE, DES PÊCHERIES ET DEL’ALIMENTATION, “L’industrie des aliments et boissons: un stabilisateuréconomique”, Bioclips, Vol. 6 no. 1, June 2003.4. MINISTÈRE DE L’AGRICULTURE, DES PÊCHERIES ET DEL’ALIMENTATION, Profil - industrie de la transformation alimentaire auQuébec, 02-0076.5. FILIÈRE AGROALIMENTAIRE DU QUÉBEC, Diagnostic du secteuragroalimentaire et de l’approche filière du Québec, May 5, 2004,Groupe de travail de la Filière agroalimentaire sur le plan d’action2004-2007.
Chapter 4: Distribution of food produce1. MINISTÈRE DE L'AGRICULTURE, DES PÊCHERIES ET DEL'ALIMENTATION. Information générale sur le secteur bioalimentaire,2005.2. MINISTÈRE DE L'AGRICULTURE, DES PÊCHERIES ET DEL'ALIMENTATION. L'activité bioalimentaire au Québec - Bilan 2005,2006, 43 p.3. MINISTÈRE DE L'AGRICULTURE, DES PÊCHERIES ET DEL'ALIMENTATION. Bottin statistique de l'alimentation, édition 2006,141 p.4. MINISTÈRE DE L'AGRICULTURE, DES PÊCHERIES ET DEL'ALIMENTATION. Réunion des cadres du Ministère, Québec, November 9, 2006.5. AC Nielsen. The power of private label 2005 : a review of growthtrends around the world.6. MINISTÈRE DE L'AGRICULTURE, DES PÊCHERIES ET DEL'ALIMENTATION. Rapport annuel de gestion 2004-2005, 2005.
Chapter 5: Foreign trade in agricultural and agri-food products1. MINISTÈRE DE L’AGRICULTURE, DES PÊCHERIES ET DEL’ALIMENTATION, Conférence sur l’agriculture et l’agroalimentairequébécois, reference document, 1998, update of the tables and graphsfrom a 1998 reference document, November 2006, and STATISTICSCANADA, International trade statistics, 2004, and MINISTÈRE DEL’AGRICULTURE, DES PÊCHERIES ET DE L’ALIMENTATION DUQUÉBEC, Activité bioalimentaire au Québec – bilan 2005, 2006 edition.2. MINISTÈRE DE L'AGRICULTURE, DES PÊCHERIES ET DEL'ALIMENTATION. Valeur des exportations et des importationsinternationales de produits bioalimentaires, Québec, 2001-2006,December 2006.3. MINISTÈRE DE L'AGRICULTURE, DES PÊCHERIES ET DEL'ALIMENTATION. L’industrie bioalimentaire du Québec, 2005.4. MINISTÈRE DE L'AGRICULTURE, DES PÊCHERIES ET DEL'ALIMENTATION. Conférence aux cadres du Ministère sur l'agricultureet l'agroalimentaire québécois, Québec, November 9, 2006. 5. MINISTÈRE DE L'AGRICULTURE, DES PÊCHERIES ET DEL'ALIMENTATION. Bottin statistique de l'alimentation, édition 2006.6. BANK OF CANADA.
46
References
7. INSTITUT DE LA STATISTIQUE DU QUÉBEC, Exportation desprincipaux produits, September 2006 and STATISTICS CANADA,The Daily, November 24, 2006.8. MINISTÈRE DE L'AGRICULTURE, DES PÊCHERIES ET DEL'ALIMENTATION. Bottin statistique de l'alimentation, 2006 edition.9. MINISTÈRE DE L’AGRICULTURE, DES PÊCHERIES ET DEL’ALIMENTATION, Conférence sur l’agriculture et l’agroalimentairequébécois, reference document, 1998, update of the tables andgraphs from a 1998 reference document, November 2006.
Chapter 6: Human resource development 1. MINISTÈRE DE L'AGRICULTURE, DES PÊCHERIES ET DEL'ALIMENTATION DU QUÉBEC. Programmes du secondaire, [on line]www.mapaq.gouv.qc.ca/Fr/Productions/md/formation/2. Institut de technologie agroalimentaire. Cultiver ton avenir! Rapportannuel 2004-2005, 2005, Service des communications.3. Données de l'Institut de tourisme et d'hôtellerie du Québec (ITHQ),2006.4. MINISTÈRE DE L'ÉDUCATION, DU LOISIR ET DU SPORT.Évolution des inscriptions en 1ère année à l'enseignement secondaire etcollégial, 1999-2003. Production animale et végétale, [[on line]]www.mapaq.gouv.qc.ca/Fr/Productions/md/formation/formationstatistiques/inscription/5. MINISTÈRE DE L'ÉDUCATION, DU LOISIR ET DU SPORT. Données d'établissement (déclaration des clientèles au 20 septembrepour 2004, 2005 et 2006), Direction de la recherche, des statistiqueset des indicateurs. 6. MINISTÈRE DE L'AGRICULTURE, DES PÊCHERIES ET DEL'ALIMENTATION DU QUÉBEC. Conférence sur l'agriculture etl'agroalimentaire québécois. Update of the tables and graphs from a 1998 reference document, November 2006.7. MINISTÈRE DE L'AGRICULTURE, DES PÊCHERIES ET DEL'ALIMENTATION DU QUÉBEC. Les diplômés universitaires enagroalimentaire. Tendance 1991-2001, l'innovation technologique en agroalimentaire, 2003.8. MINISTÈRE DE L'EMPLOI ET DE LA SOLIDARITÉ SOCIALE. Vue d'ensemble agriculture et pêches, information sur le marché dutravail, [on line] imt.emploiquebec.net/mtg/inter/noncache/contenu/asp/mtg322_vueensmblsect_01.asp?lang=FRAN&Porte=3&typesect=listesect&asect=3&cregn=QC&listsect=3&sregns=QC&PT1=8&PT2=17&PT3=12&sec=01&cmpregn=QC 9. Groupe AGECO, La rareté de la main-d’œuvre agricole: uneanalyse économique, survey prepared for the sectoral farmingmanpower committee, 2003.10. MINISTÈRE DE L'AGRICULTURE, DES PÊCHERIES ET DEL'ALIMENTATION DU QUÉBEC. Des actions pour le présent. Unevision pour l'avenir. Rapport annuel de gestion 2004-2005, 2005.11. Centre de référence en agriculture et agroalimentaire du Québec.Rapport annuel 2005. 12. MINISTÈRE DE L'AGRICULTURE, DES PÊCHERIES ET DEL'ALIMENTATION DU QUÉBEC. Entente sur les services-conseils auxentreprises agricoles : le ministre M. Laurent Lessard et le présidentde l'UPA, M. Laurent Pellerin, signent une entente favorisant l'accèsaux services-conseils, press release, November 11, 2005.
Chapter 7: Agriculture, agri-food and the environment1. STATISTICS CANADA, Total area of farms, land tenure and land incrops, by province (1981-2001 Censuses of Agriculture), Governmentof Canada, 2001, www40.statcan.ca/102/cst01/agrc25f_f.htm2. BUREAU DES AUDIENCES PUBLIQUES SUR L'ENVIRONNEMENT.Consultation publique sur le développement durable de la productionporcine au Québec - Rapport principal - L'inscription de la productionporcine dans le développement durable, gouvernement du Québec,2003.
3. MINISTÈRE DU DÉVELOPPEMENT DURABLE, DE L'ENVIRONNE-MENT ET DES PARCS, Québec Water Policy, Gouvernement duQuébec, 2002.4. MINISTÈRE DU DÉVELOPPEMENT DURABLE, DE L'ENVIRONNE-MENT ET DES PARCS. Portrait global de la qualité de l'eau desprincipales rivières du Québec, Gouvernement du Québec, 2005,www.mddep.gouv.qc.ca/chronique/ 2005/janvier-mars/050124-portrait.htm5. MINISTÈRE DU DÉVELOPPEMENT DURABLE, DE L'ENVIRONNE-MENT ET DES PARCS. Synthèse des informations environnementalesdisponibles en matière agricole au Québec, Gouvernement du Québec,2003. 6. MINISTÈRES DU DÉVELOPPEMENT DURABLE, DE L'ENVIRONNE-MENT ET DES PARCS, Liste des milieux affectés par les cyanobactéries,Direction du suivi de l'état de l'environnement, Gouvernement duQuébec, 2006.7. BLAIS, S. « La problématique des cyanobactéries (algues bleu-vert)à la baie de Missisquoi en 2001», Agrosol, vol. 13, no 2, 2002, p. 103-110.8. MINISTÈRES DU DÉVELOPPEMENT DURABLE, DE L'ENVIRON-NEMENT ET DES PARCS; DE LA SANTÉ ET DES SERVICES SOCIAUX;DE L'AGRICULTURE, DES PÊCHERIES ET DE L'ALIMENTATION etINSTITUT NATIONAL DE SANTÉ PUBLIQUE DU QUÉBEC. Étude surla qualité de l'eau potable dans sept bassins versants en surplus defumier et impacts potentiels sur la santé, Gouvernement du Québec,2004, 9 volumes. 9. BPR. Suivi 2003 du portrait agroenvironnemental des fermes duQuébec, outil d'aide à l'identification des enjeux prioritaires et despistes d'action, 2005.10. MINISTÈRE DU DÉVELOPPEMENT DURABLE, DE L'ENVIRON-NEMENT ET DES PARCS. Capacité de support des activités agricolespar les rivières : le cas du phosphore total, Gouvernement duQuébec, 2005. 11. MINISTÈRE DE L'AGRICULTURE, DES PÊCHERIES ET DEL'ALIMENTATION DU QUÉBEC. Institut de recherche et dedéveloppement en agroenvironnement, Description statistique despropriétés chimiques des sols minéraux du Québec, 2005.12. MINISTÈRE DE L'AGRICULTURE, DES PÊCHERIES ET DEL'ALIMENTATION DU QUÉBEC. Inventaire des problèmes dedégradation des sols agricoles du Québec, Gouvernement duQuébec, 1990,13 volumes.13. MINISTÈRE DU DÉVELOPPEMENT DURABLE, DE L'ENVIRON-NEMENT ET DES PARCS. Inventaire québécois des émissions de gazà effet de serre en 2003 et évolution depuis 1990, Gouvernement duQuébec, 2006, mddep.gouv.qc.ca/ changements/ges/2003/index.htm14. BPR. Suivi 2003 du Portrait agroenvironnemental des fermes duQuébec, rapport final, 2005.15. BÉLANGER, L., M. GRENIER, S. DESLANDES and D. BOSSÉ,Conservation Atlas of Woodlands in the Agricultural Landscape,Environment Canada, Canadian Wildlife Service, 1998,www.qc.ec.gc.ca/faune/ atlas/html/atlas_f.html16. OGM.gouv.qc.ca. Information source on genetically modifiedorganisms, Gouvernement du Québec, 2006, www.ogm.gouv.qc.ca/17. MINISTÈRE DU DÉVELOPPEMENT DURABLE, DE L'ENVIRON-NEMENT ET DES PARCS. Règlement sur les exploitations agricoles,Gouvernement du Québec, 2002.18. MINISTÈRE DE L'AGRICULTURE, DES PÊCHERIES ET DEL'ALIMENTATION DU QUÉBEC. Rapport annuel de gestion,Gouvernement du Québec, 2006.19. STATISTICS CANADA, VISTA on the Agri-food Industry and theFarm Community, Partial portrait of farm investments in environmentalprotection, Government of Canada, 2004.
47

Chapter 8: Health and consumer concerns1. STATISTICS CANADA, Life expectancy, Government of Canada,2000. 2. MINISTÈRE DE L'AGRICULTURE DES PÊCHERIES ET DEL'ALIMENTATION DU QUÉBEC. Rapport annuel de gestion,Gouvernement du Québec, 2006. 3. David Suzuki Foundation, The Food We Eat: An InternationalComparison of Pesticide Regulations, 2006.4. MINISTÈRE DU DÉVELOPPEMENT DURABLE, DEL’ENVIRONNEMENT ET DES PARCS, Pesticides Management Code,Gouvernement du Québec, 2003. 5. GIROUX, I. « Source d'exposition humaine aux pesticides »,Vecteur environnement, vol. 39, no. 3, 2006, p. 12-14. 6. Ordre des médecins veterinaries, personal communication, 2006.7. MINISTÈRE DE LA SANTÉ ET DES SERVICES SOCIAUX.Préoccupations du Ministère adressées à la Commission sur l'avenir del'agriculture et de l'agroalimentaire québécois, 2006.8. BUREAU DES AUDIENCES PUBLIQUES SUR L'ENVIRONNE-MENT. Consultation publique sur le développement durable de laproduction porcine au Québec - Rapport principal - L'inscription de la production porcine dans le développement durable, Gouvernementdu Québec, 2003.9. OGM.gouv.qc.ca. Source d'information sur les organismes génétiquement modifiés, Gouvernement du Québec, 2006,www.ogm.gouv.qc.ca/10. FILIÈRE BIOLOGIQUE DU QUÉBEC. Plan stratégique du secteur des aliments biologiques du Québec 2004-2009, 2003.11. Sondage Decima Research Inc. AGRICULTURE AND AGRI-FOODCANADA, [on line] www.passeportsante.net/fr/Actualites/Dossiers/ArticleComplementaire.aspx?doc=aliments_fonctionnels_pourquoi_do(viewed June 2004).12. MINISTÈRE DE LA SANTÉ ET DES SERVICES SOCIAUX. Investirpour l'avenir. Plan d'action gouvernemental de promotion des saineshabitudes de vie et de prévention des problèmes reliés au poids,2006-2012, 2006.13. MONGEAU, L., N. AUDET, J. AUBIN et R. BARALDI. L'excès depoids dans la population québécoise de 1987 à 2003, 2005, Institutnational de la santé publique du Québec and Institut de la statistiquedu Québec.14. LAFLEUR, Ginette et col. Enquête sur la santé psychologique desproducteurs agricoles du Québec, Université de Moncton, 2006. 15. Canadian Agricultural Safety Association, Canadian AgriculturalInjury Surveillance Program, Queen’s University, 2006, 2006,meds.queensu.ca/~emresrch/ caisp/bienvenue.html16. COMMISSION DE LA SANTÉ ET DE LA SÉCURITÉ DU TRAVAILDU QUÉBEC. Les travailleuses québécoises et les lésions professionnelles, où en sommes-nous, 2006.
Chapter 9: Rural life and regional development 1. HESNE, L. La situation démographique au Québec. Bilan 2005,Institut de la statistique du Québec, December 2005.2. Solidarité rurale du Québec. Avis pour une nouvelle Politiquenationale de la ruralité, 2006. 3. INSTITUT DE LA STATISTIQUE DU QUÉBEC. Estimation de lapopulation des municipalités du Québec au 1er juillet des années1996 à 2005 selon le découpage géographique au 1er janvier 2006,[on line] www.stat.gouv.qc.ca/donstat/societe/demographie/dons_regnl/regional/index.htm 4. INSTITUT DE LA STATISTIQUE DU QUÉBEC in Solidarité rurale duQuébec. Avis pour une nouvelle Politique nationale de la ruralité, 2006.5. MINISTÈRE DU DÉVELOPPEMENT ÉCONOMIQUE, DEL'INNOVATION ET DE L'EXPORTATION. « Portrait socio-économiquedes régions du Québec », L'Économètre, 2006.
6. STATISTICS CANADA, 2001 Censuses of Agriculture andPopulation, [on line] www40. statcan.ca/l02/cst01/agrc42f_f.htm7. MINISTÈRE DE L'AGRICULTURE, DES PÊCHERIES ET DEL'ALIMENTATION DU QUÉBEC. Profil régional de l'industriebioalimentaire au Québec. Estimation pour 2005, 2006. [on line]www.mapaq.gouv.qc.ca/Fr/md/statistiques/donneesregionales8. MINISTÈRE DES AFFAIRES MUNICIPALES ET DES RÉGIONS. Les orientations du gouvernement en matière d'aménagement. Laprotection du territoire et des activités agricoles, revised supportingdocument, 2001.9. COMMISSION DE PROTECTION DU TERRITOIRE AGRICOLE(CPTAQ). La Commission, [on line] www.cptaq.gouv.qc.ca/index.php?id=commission10. Coalition pour la protection du territoire agricole. Maintenir lapérennité agricole : une priorité, [on line] www.upa.qc.ca/fra/coalition/index.asp11. DEBAILLEUL, G. Développement économique régional, tourismeet agriculture, tourisme rural, in Téoros, Vol. 20, no. 2, summer 2001,p. 52-59.
Chapter 10: Governance1. GOVERNMENT OF CANADA, Constitution Act, 1867, section 95,[on line], laws.justice.gc.ca/en/const/c1867_e.html2. AGRICULTURE AND AGRI-FOOD CANADA, The Agriculture PolicyFramework: An Agricultural Policy for the 21st Century, [on line]www.agr.gc.ca/cb/apf/index_e.php 3. GOUVERNEMENT DU QUÉBEC. Act respecting the Ministère del’Agriculture, des Pêcheries et de l’Alimentation, R.S.Q., chapter M-14,[on line] www.mapaq.gouv.qc.ca/Fr/Ministere/md/Lois/4. MINISTÈRE DE L'AGRICULTURE, DES PÊCHERIES ET DEL'ALIMENTATION DU QUÉBEC. Rapport annuel de gestion 2005-2006,2006.5. GOUVERNEMENT DU QUÉBEC. Act to preserve agricultural landand agricultural activities, R.S.Q., chapter P-41.1. 6. MINISTÈRE DES AFFAIRES MUNICIPALES ET DES RÉGIONS.Orientations gouvernementales en matière d'aménagement : laprotection du territoire et des activités agricoles, 2001 and addendumof 2005.7. MINISTÈRE DES AFFAIRES MUNICIPALES ET DES RÉGIONS. La municipalité régionale de comté : compétences et responsabilités,2004.8. LA FINANCIÈRE AGRICOLE DU QUÉBEC. Historique et mission,[on line] www. fadq.qc.ca/index.php?id=69. MINISTÈRE DES FINANCES. Moderniser la gouvernance dessociétés d'État. Énoncé de politique, 2006.10. LA FINANCIÈRE AGRICOLE DU QUÉBEC. Mission, [on line]www.fadq.qc.ca/index. php?id=611. GOUVERNEMENT DU QUÉBEC. Farm Producers Act, R.S.Q.chapter P-28, [on line] www2.publicationsduQuébec.gouv.qc.ca/dynamicSearch/telecharge.php?type=2&file=%2F%2FP_28%2FP28.htm12. Union des producteurs agricoles du Québec. Qui sommes-nous?Vue d'ensemble, [En ligne] www.upa.qc.ca/fra/qui_sommes_nous/vue_ensemble.asp13. ARTEAU, M., BRASSARD, M. J., MALO, M. C. Les secteurs et lemouvement coopératif québécois : portrait et défis, Centre derecherche sur les innovations sociales, UQAM, 2006, 17 p.
48
Commission sur l’avenir de l’agriculture et de l’agroalimentaire québécois1150, Grande Allée Ouest, 1er étage Québec (Québec) G1S 1E5TÉL. : 418 646-1049TÉLÉC. : 418 646-1051
www.caaaq.gouv.qc.ca