agricultural landscape change in china's yangtze delta, 1942–2002: a case study
TRANSCRIPT

Agricultural landscape change in China’s Yangtze Delta, 1942–2002: A case study
Jun-Xi Wu a,b, Xu Cheng b, Hong-Sheng Xiao c, Hongqing Wang a,1, Lin-Zhang Yang d, Erle C. Ellis a,*a Department of Geography & Environmental Systems, University of Maryland, Baltimore County, 1000 Hilltop Circle, Baltimore, MD 21250, United Statesb Department of Agronomy & Agroecology, China Agricultural University, Beijing 100094, Chinac Institute of Tropical and Subtropical Ecology, South China Agricultural University, Guangzhou, Guangdong 510642, Chinad Institute of Soil Science, Chinese Academy of Sciences, Nanjing, Jiangsu 210008, China
Agriculture, Ecosystems and Environment 129 (2009) 523–533
A R T I C L E I N F O
Article history:
Received 4 July 2008
Received in revised form 1 November 2008
Accepted 11 November 2008
Keywords:
Long-term change
Agricultural history
Environmental history
Traditional agriculture
Agricultural development
Agricultural village landscapes
Ecotope
Land use change
Land cover change
China
A B S T R A C T
Over the past 60 years, China’s ancient agricultural village landscapes have been transformed by
unprecedented changes in rural policy, population and agricultural technology. The village landscapes of
China’s Yangtze Plain are among the most ancient, densely populated and intensively managed in the
world and have undergone extremely rapid development in recent decades, causing the wholesale
transformation of traditional village landscape structure, primarily at fine spatial scales (< 30 m). Here
we investigate the causes and consequences of these fine-scale changes, 1942–2002, using a case study
of landscape change within a regionally representative sample of village landscapes in Yixing County.
High-resolution mapping was coupled with historical data obtained by interviews with elder farmers
and archival sources, with uncertainties quantified using Monte Carlo methods. The already dense
agricultural populations of 1942 had increased by about 50% by 2002, and this was accompanied by an
intensification of land management that caused 53% of land area to undergo a substantial change in
landscape class. Paddy area declined by 22% from 1942 to 2002, and this was coupled with an 8% net
increase in built surfaces, a 14% increase in aquaculture surface, and most surprisingly, by a 5% net
increase in land cover by closed canopy woody vegetation. Most of this change was caused by fine-scale
land transformations that fragmented larger managed features into smaller features that incorporated a
wider variety of management practices, thereby simultaneously increasing both landscape hetero-
geneity and complexity. Population growth, agricultural policy changes and market-oriented land
management strategies combined to produce these significant long-term agricultural landscape
changes. By coupling detailed analysis of fine-scale local landscape transformation processes with land
use history across three time periods, this study identified the causes of ecologically significant
landscape changes and may also help to indicate future change trends within some of the most densely
populated and productive agricultural landscapes in the world.
� 2008 Elsevier B.V. All rights reserved.
Contents lists available at ScienceDirect
Agriculture, Ecosystems and Environment
journal homepage: www.e lsev ier .com/ locate /agee
1. Introduction
Home to more than half a billion rural people, denselypopulated agricultural village landscapes cover approximately 2million square kilometers across China’s Eastern plains and Centraland Southern hilly regions, accounting for about 20% of China’stotal land area and more than a quarter of village landscapesglobally (Ellis, 2004; Ellis and Ramankutty, 2008). Though China’svillages have been cultivated for centuries, some of the mostsignificant ecological changes in their history have likely occurredsince the 1940s, as a result of population growth, the adoption of
* Corresponding author.
E-mail address: [email protected] (E.C. Ellis).1 Current address: Institute of Coastal Ecology and Engineering, University of
Louisiana at Lafayette, Lafayette, LA, USA.
0167-8809/$ – see front matter � 2008 Elsevier B.V. All rights reserved.
doi:10.1016/j.agee.2008.11.008
industrial technologies such as chemical fertilizers and pesticides,and changes in rural policy and its implementation (Han, 1989;Ellis and Wang, 1997; Tong et al., 2003).
The ecological impacts of long-term changes in population,policy and land management practices in agricultural China havebeen studied in terms of fertilizer use and other alterations ofagricultural management practices (Li, 1993; Lindert et al., 1996;Meng et al., 2005), but the role of changes in landscape structureassociated with these remain poorly understood, in part because ofthe challenges of measuring fine-scale landscape changes overlong time periods using conventional land change measurementsystems based on regional remote sensing platforms dating to the1970s, such as Landsat and SPOT (Ellis et al., 2006; Ozdogan andWoodcock, 2006).
The lower reaches of China’s Yangtze River Plain, also known asthe Yangtze Delta and the Tai Lake Region, has long been one of themost densely populated agricultural regions on Earth and is

J.-X. Wu et al. / Agriculture, Ecosystems and Environment 129 (2009) 523–533524
legendary in China for its many centuries of productive rice-basedagriculture and for its long history as one of China’s mosteconomically developed regions (Ellis and Wang, 1997; Li, 2000;Long et al., 2007a). While village landscapes of the Yangtze Deltahave undergone a variety of changes over the centuries, in the pasthalf century this region has witnessed unprecedented changes inpopulation, land tenure, and technology, nearly tripling theagricultural productivity of the region while generating a varietyof negative environmental consequences (Ellis and Wang, 1997).
This study investigates the causes and potential consequencesof fine-scale changes in landscape structure between 1942 and2002 in a sample of village landscapes in China’s Yangtze Delta. Toaccomplish this, we combine field-validated high-resolutionecological mapping from current and historical imagery withelder interviews and historical research across a regionallyselected sample of village landscapes across a field research sitein Yixing County, Jiangsu Province.
2. Background and methods
2.1. Site description
The Yangtze Delta Region comprises the fertile deltaic plains atthe mouth of the Yangtze River and surrounding Tai Lake (Ellis andWang, 1997). The region has a Northern Subtropical Monsoonclimate that is ideal for rice, with 1100–1400 mm of annualprecipitation, annual mean temperatures around 16 8C and a 290day growing season (Xu et al., 1980). The region has a long historyof high-yielding subsistence rice production, and is believed bymany to be a center of rice domestication (Ellis and Wang, 1997).For centuries and during the period of the current study, theregion’s farming system has been dominated by flooded paddy riceproduction in summer, rotated with wheat or rapeseed (Brassica
napus) in winter, supplemented by mulberry production (Morus
alba) on artificially elevated rainfed fields (to supply fodder forhousehold silkworms), and by aquaculture in wetter areas nearpopulation centers (Ellis and Wang, 1997). With the exception ofthe communal period from the 1950s to 1970s, the agriculture of
Fig. 1. Site and sample selection. (a) The Yangtze Plain Region of China. (b) Region with
paddy, +other crops = mostly other crops, +water and village = mostly water and village b
clusters and boundaries of 12 landscape sample cells (IKONOS = IKONOS image footpri
this region has long been famed for its labor intensity, highproductivity, and very small scale of management (King, 1911),with paddy fields usually being the largest and ranging in size fromabout 0.067 to 0.2 ha, and the full landholdings of pre-revolu-tionary households averaging 1.5 ha, with some land owned, somerented (Buck, 1937). Until the 1990s, most households alsocultivated small vegetable gardens near their houses, raised pigs intiny stalls within housing units, and reared a few caged and free-ranging chickens, ducks and geese.
2.2. Site, landscape samples and imagery
A single 100 km2 rectangular (7 km � 14.25 km) field researchsite in Yixing County was selected for study in the Yangtze DeltaRegion of China from a total of three potential field sites examinedacross the region in the field together with regional experts duringan extended site selection period as described by Ellis (2004; Fig. 1;centered on 31.37 Lat., 119.56 Lon.). The site was selected based onthe availability of historical aerial photographs, historical agri-culture surveys and the confirmed absence of any anomalousenvironmental, economic or social conditions compared with theregion as a whole (Ellis, 2004).
Following site selection, a regionally stratified sample of 12500 m � 500 m square landscape sample cells was selected fordetailed study within the site as described by Ellis (2004). This wasaccomplished by first imposing a 500 m grid across the region,stratifying the grid cells thus formed into three regionallydominant land cover patterns identified by applying K-meanscluster analysis to land cover derived from a Landsat ETM+ sceneacross the region (land cover clusters; Fig. 1), and finally byselecting a total of 12 of these grid cells within the site inproportion to the regional area of each of these land cover clusters(Ellis, 2004).
IKONOS 4 band pan-sharpened 1 m resolution GEO imagerywas acquired across the entire Yixing site on 26 September 2002and orthorectified using ground control points obtained bysubmeter accuracy Global Positioning Systems (GPS; Wang andEllis, 2005). Aerial photographs covering the site in the 1940s
Landsat scene and site. (c) Landsat scene with land cover clusters (+paddy = mostly
uiltup area), with site location and Yixing County boundary. (d) Site, with land cover
nt, 1940s = cover by 1940s aerial photographs).

J.-X. Wu et al. / Agriculture, Ecosystems and Environment 129 (2009) 523–533 525
(September 1942; 1:15,000 scale) were obtained from the U.S.National Archives and Record Administration (NARA; RG-373,www.Archives.gov). Aerial photographs for the 1960s (October1963; 1:25,000) are from the Bureau of Geology and MineralResource Survey of Jiangsu Province. Aerial photographs for the1980s (April 1989; 1:35,000) are from the Geological SurveyBureau of Jiangsu Province (GSBJ). Historical aerial photographswere orthorectified (1942) and geometrically corrected (1963,1989) using tie points from orthorectified IKONOS imagery (Wangand Ellis, 2005).
2.3. Landscape mapping
Ecologically distinct landscape features (ecotopes) weremapped across the 12 regionally selected landscape sample cells
Fig. 2. Examples of imagery and ecotope maps across a single landscape sa
within the site using Level 1 anthropogenic ecotope mapping(AEM; Ellis et al., 2006), a standardized fine-scale ecologicalmapping procedure designed for high-resolution ecological changemapping in anthropogenic landscapes. Using this procedure, allecotope features with dimensions �2 m were mapped acrosssample cells by trained interpreters using a Geographic Informa-tion System (GIS; ArcGIS 8.3, Environmental Systems ResearchInstitute, Redland, CA), first by direct interpretation of land use andvegetation cover polygons in orthorectified imagery, and then byrepeated validation and correction of all ecotope features in thefield, assisted by current local land managers (Ellis et al., 2006).
After mapping, features were classified using a four level a priori
ecological classification hierarchy, FORM > USE > COVER >GROUP + TYPE, combining simple landform, land-use and land-cover classes (FORM, USE, and COVER) with a set of more detailed
mple cell in the Yixing site. Ecotope maps have USE + COVER symbols.

J.-X. Wu et al. / Agriculture, Ecosystems and Environment 129 (2009) 523–533526
feature management and vegetation classes (GROUPs) stratifiedinto TYPEs (Ellis et al., 2006; http://www.ecotope.org/aem/classification). Ecotope classes are defined by combining all fourclassification levels within each feature. For example, an irrigated(USE = I = Irrigated) small plot of mature mulberry trees(GROUP + TYPE = dw39) with a closed canopy (>60% woody cover;COVER = P = Perennial) on a floodplain (FORM = FP = Floodplain) isclassified as the ecotope ‘‘FPIPdw39’’ (FORM + USE + COVER + -GROUP + TYPE). Current (2002) ecotope maps were prepared first,followed by historical maps (Fig. 2). Standardized AEM methodol-ogy and training combined with repeated mapping in the fieldfacilitated ecotope mapping with an accuracy �85% (k � 0.85)even across different historical periods and for images meetingbasic standards but varying in quality, including scale (Ellis andWang, 2006).
All levels of ecotope classification are based on structuralcharacteristics of land that are potentially stable for at least 2 yearsor more. For this reason, we do not map specific crops or evencropping systems per se, unless these overlap with stablealterations of land or infrastructure. For example, we differentiateland USE into paddy (seasonally flooded by irrigation systemsspecialized for paddy rice), irrigated (regular use of irrigationsystems not specialized for rice but requiring stable infrastructureincluding pumps, channels, etc.), and rainfed crops (withoutinfrastructure for irrigation), without distinguishing specific cropsor rotations (Ellis et al., 2006). Further, we define fallow land USEnot in terms of a fallow period within a crop rotation, but as an areawithout current use that is recovering from past humandisturbance, we define livestock USE as intensive livestockproduction within artificial structures and we define disturbedUSE features as those with regular human disturbances butwithout consistent use (such as areas with regular but informalfodder and fuel gathering).
2.4. Historical mapping and elder interviews
Historical field research was initiated in 2004 by selecting 20village elders, aged �78 (�16 in 1942), with a lifelong history ofmanaging land�500 m from the sample cells to assist with 1940s-era research. 16 of these elders were divided into 8 separate groupsof 2 and given semi-structured interviews to investigate agricul-tural and resource management conditions in the 1940s, and thento assist in ecotope mapping supported by 1:1200 scale imagemaps and in the field, guided by GPS (Ellis et al., 2006). Afterinterviews and an initial mapping, any remaining mappingconfusion was cleared up by additional visits to the field togetherwith elders. The four remaining elders were selected to assist inmapping remaining confusing areas in sample cells adjacent totheir homes in the 1940s.
In 2005, 26 village elders were chosen to aid in 1960s- and1980s-era research, 12 from the original group and 14 new, withages �72 in 2005 (�27 in 1960) by the same method as above. 22were former leaders of production teams or accountants duringcollective farming of the 1960s or 1970s, and also managed theirown small parcels as farmers. 21 of these elders were divided into10 groups of 2 (one group of 3) and given semi-structuredinterviews on conditions in the 1960s and the 1980s, and thenassisted in historical mapping from image maps and in the field.The remaining five elders assisted the mapping of remainingconfusing areas in sample cells maps near their homes in 1963 and1989. Image quality of 1989 aerial photographs was poorer thanthose of other time periods, so ecotope mapping for this timeperiod also utilized the expertise of current land managers and1:10,000 topographic maps for 1989 made by GSBJ. The cause andtiming of all landscape feature changes that were consistentlyidentified by elders were then identified by open-ended interviews
with elders. Populations in each of the12 landscape sample cellswere estimated by local village leaders for 2002 and by villageelders for 1940s, and were calculated for 1989 and 1963 based onthe agricultural population growth rate from 1989 to 2002 andfrom 1963 to 1989 in Yixing County, respectively (SBYC, 2005).
2.5. Change measurements and uncertainty analysis
We used Monte Carlo (MC) observational uncertainty analysis(Ellis et al., 2000) to calculate area measurement errors in changesfrom one time period to another (Ellis et al., 2006). First, each mapclass area estimate was described using normal probabilitydistribution functions (PDF) using a perimeter-based mappingerror model (Ellis and Wang, 2006). Then, individual map class areaestimates were normalized to 100% across each sample cell bydividing them by their sum, including an ‘‘omitted class’’ PDF (Ellisand Wang, 2006). Finally, MC methods were used to estimatechanges, and their measurement uncertainties, across the 12landscape sample cells, by subtracting estimates for earlier periodsfrom those for later periods (Ellis et al., 2006). Changes andtransformations from one class to another were analyzed byintersecting maps between different time periods, creating‘‘change features’’ with specific land class transitions (Ellis et al.,2006).
3. Results and discussion
3.1. General changes in land use and land cover
Ecologically significant long-term changes in land USE and landCOVER were observed across landscapes from 1942 to 2002 andduring each time period in between, with the greatest overallchanges observed from 1963 to 1989 (Fig. 3). Rice paddy, thelargest land use overall, also experienced the greatest decline overthe long term (22% from 1942 to 2002) and its decline wassignificant in every time period (Fig. 3a), producing relateddeclines in herbaceous (annual) COVER across village landscapes(Fig. 3b). While paddy declined little from 1942 to 1963, majorpaddy loss occurred from 1963 to 1989, mainly by its conversion toirrigated and rainfed crops and constructed surfaces; after 1989,paddy decline resulted mainly from conversion to aquacultureponds and irrigated crops. Fallow, non-productive areas of villagelandscapes also decreased substantially over the long term andduring every time period except 1989–2002, mostly by theintroduction of aquaculture into fallow canals and ponds (Fig. 4).
From 1942 to 2002 aquaculture increased from essentially 0%(0.1%) to 14.5% of village area, as farmers converted fallow watersurfaces and rice paddies to this use (Figs. 3 and 4). From 1942 to1963, most aquaculture was developed by the conversion ofexisting fallow water bodies, with the conversion of paddy toaquaculture becoming significant from 1963 to 1989, andbecoming the dominant conversion pathway from 1989 to 2002(Fig. 4), causing substantial net increases in village water surfacearea during this period (Fig. 3).
Increases in constructed USE were also continuous over time,increasing by a total of 8.5% from 1942 to 2002, mostly by theconstruction of housing in agricultural lands (paddy, rainfed;Fig. 4). Construction, mostly of housing, was especially strong from1963 to 1989, causing large increases in impervious (sealed)COVER during this period (Figs. 3 and 4).
After 1963, irrigated land USE became common, mostly forvegetables and mulberry/silk production, ultimately increasing to8.4% of village land by 2002, mainly by the conversion of Paddy land(Figs. 3 and 4). Remarkably, villages also experienced a long-term netincrease in cover by closed-canopy woody vegetation (perennialcover) from 1942 to 2002, from 2.5% to 7.8% of village land, mostly by

Table 1Land form, land use, land cover and group classes used in figures (Ellis et al., 2006; details at http://ecotope.org/aem/classification/).
Land FORM Land USE Land COVER Group
Code Name Code Name Code Name Code Name
AN Anthropogenic C Constructed S Sealed ac Annual crops
FP Floodplain L Livestock E Bare soil aq Aquaculture
PA Small pond M Mine and Fill W Water db Disturbed and Debris
PB Large pond D Disturbed A Annual dw Deciduous woody crops
CA Small canal O Ornamental M Mixed ho Housing
CB Large canal A Aquaculture P Perennial ir Irrigation
P Paddy ri Hydromorphic crops
I Irrigated wa Water surface
R Rainfed
T Forestry
F Fallow
J.-X. Wu et al. / Agriculture, Ecosystems and Environment 129 (2009) 523–533 527
the planting of mulberry and also by the planting and regrowth ofsmall patches of other woody vegetation and trees.
3.2. Changes in landscape structure and complexity
As land use intensified from 1942 to 2002, fine-scale landscapeheterogeneity increased substantially, as demonstrated both byincreases in feature number and perimeter, and by a decreasingmedian size of ecotope features over time, even though these werealready quite small in 1942 (median area < 0.1 ha; Table 3). Thecomplexity of village landscapes also increased over time, with thenumber of unique ecotope classes more than doubling from 1942 to2002, a trend also evident when only relatively large, reliably-identified ecotope classes were considered (Table 3). While the trendtoward increasing ecotope classes and features over time mightdepend on the memories of village elders and the quality of historical
Table 2Ecotope classes used in figures (Ellis et al., 2006; details at http://ecotope.org/aem/
classification/).
Ecotope code Descriptiona
ANCEir01 �2 m width and permeable irrigation and drainage ditch
ANCSho03 Shared wall or courtyard single-story houses
ANCSho04 Shared wall or courtyard multi-story houses
ANRAac04 Rainfed small-scale staple annual crops on the anthropogenic
ANRPdw39 Rainfed small-scale mature mulberry on the anthropogenic
CAAWaq02 Medium-scale generic freshwater fish culture in small canal
CAAWaq03 Large-scale generic freshwater fish culture in small canal
CAAWaq08 Medium-scale generic or mixed freshwater livestock culture
in small canal
CAFAwa02 Flowing open freshwater, no evidence of aquaculture in small
canal
CBAWaq02 Medium-scale generic freshwater fish culture in large canal
CBAWaq03 Large-scale generic freshwater fish culture in large canal
CBAWaq09 Large-scale generic or mixed freshwater livestock culture
in large canal
CBFAwa02 Flowing open freshwater, no evidence of aquaculture in
large canal
FPDAdb06 Herbaceous regrowth area with structures or debris on
the floodplain
FPDAdb09 Herbaceous regrowth grave located on the floodplain
FPDMdb07 Woody or some tree regrowth area with structures or
debris on the floodplain
FPIAac01 Irrigated small-scale intensive crops on the floodplain
FPIPdw39 Irrigated small-scale mature mulberry on the floodplain
FPPAri01 Rice paddy on the floodplain
FPRAac04 Rainfed small-scale staple annual crops on the floodplain
PBAWaq08 Medium-scale generic or mixed freshwater livestock culture
in large pond
PBAWaq09 Large-scale generic or mixed freshwater livestock culture
in large pond
PBAWaq14 Medium-scale generic or mixed freshwater crab culture
in large pond
a Scales of land management: small-scale = <1000 m2, medium-
scale = �1000 m2 to 1 ha, large-scale = >1 ha.
aerial photographs, the strength of these trends in the larger ecotopeclasses, which have proven to be reliably identified by our historicalmethods, confirms this result (Ellis and Wang, 2006; Ellis et al.,2006). On the whole, the observed trend toward smaller, morenumerous and more ecologically diverse landscape features overtime indicates that as land management intensified over time, itbecame more fragmented and also more diversified and complex.
Observations of ecotope transformations (ecotope to ecotopetransitions) highlight the fine-scale processes by which agricul-tural landscapes tended to become more fragmented over time(Table 4). From 1942 to 2002, 53% of landscape sample areaexperienced a change in ecotope class, with the largest changesapparent from 1963 to 1989 (Table 4). About half of the totalchanged area could be explained by the ten largest ecotope toecotope transformations in any time period, but the remainingchanges were caused by a large number of fairly small ecotopetransformations, with more than 160 specific transformationsrequired to explain 90% of total changed area from 1942 to 2002,even though only 39 of these had significant areas.
3.3. Fine-scale changes in landscape structure
The complexity of fine-scale agricultural landscape transforma-tion processes is evident when observed at the ecotope level(Fig. 5). The remarkable decline in rice paddy from 1942 to 2002provides a good example of this complexity, as it was the combinedresult of increases in irrigated mulberry production (FPIPdw39),medium-scale aquaculture (PBAWaq08) and the construction ofmulti-story shared-wall houses (ANCSho04). Over the same timeperiod, increases in this dense form of rural housing (ANCSho04)also produced the largest ecotope-level increases observed acrossvillage landscapes, caused both by the construction of housing inpaddy land and by demolishing existing single story houses(ANCSho03) and rebuilding.
The extent and process of agricultural landscape changediffered remarkably between time periods (Fig. 5a). From 1942to 1963, just 16% of village landscapes experienced a change atecotope-level, less than half the change observed in the later twotime periods, even though this was a 21-year period of tremendouspolitical change (Table 4). Moreover, the largest change during thistime period was just the modification of small fallow canals(CAFWwa02) for aquaculture (CAAWaq03, CBAWaq03), usually byfencing them in with nets or by introducing dams with sluice gates.Another significant change was the conversion of rainfed staplecrops (FPRAac04) to rice paddy (FPPAri01) and also the conversionof graves (FPDAdb09) situated on productive lands to rainfed cropsafter the revolution, usually by first transferring the remains tocemeteries in the most marginal lands.
The largest overall landscape change was observed from 1963to 1989, which was also the longest time interval in this study (26
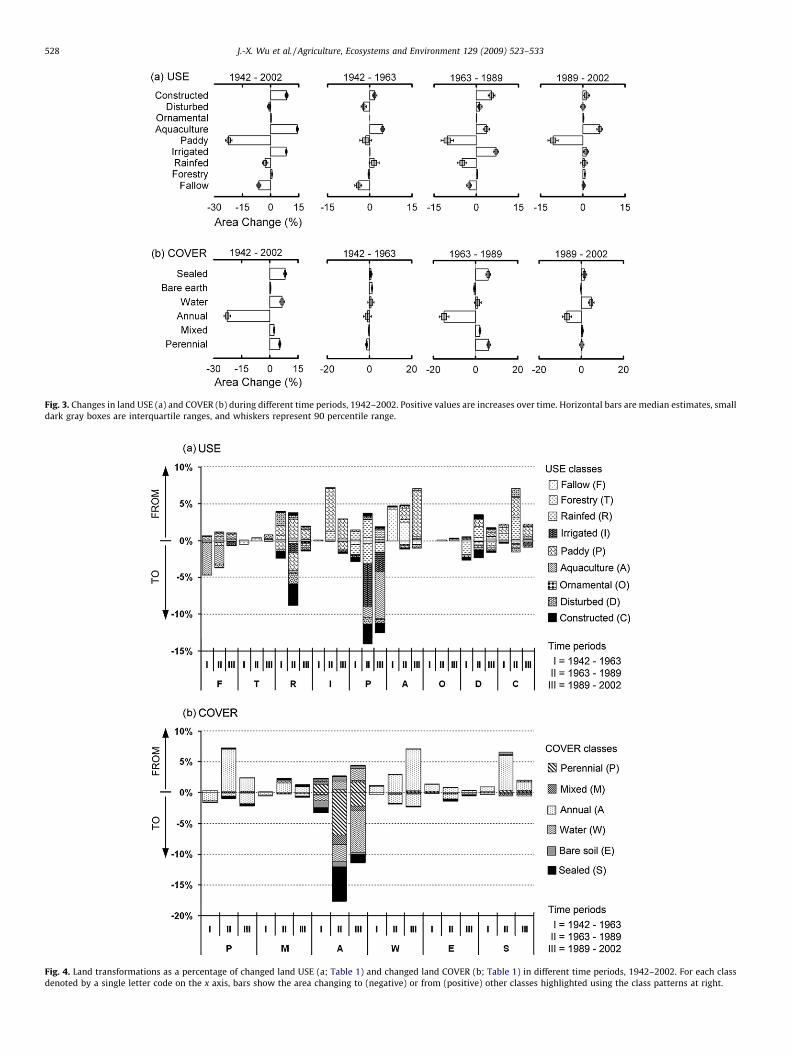
Fig. 3. Changes in land USE (a) and COVER (b) during different time periods, 1942–2002. Positive values are increases over time. Horizontal bars are median estimates, small
dark gray boxes are interquartile ranges, and whiskers represent 90 percentile range.
Fig. 4. Land transformations as a percentage of changed land USE (a; Table 1) and changed land COVER (b; Table 1) in different time periods, 1942–2002. For each class
denoted by a single letter code on the x axis, bars show the area changing to (negative) or from (positive) other classes highlighted using the class patterns at right.
J.-X. Wu et al. / Agriculture, Ecosystems and Environment 129 (2009) 523–533528
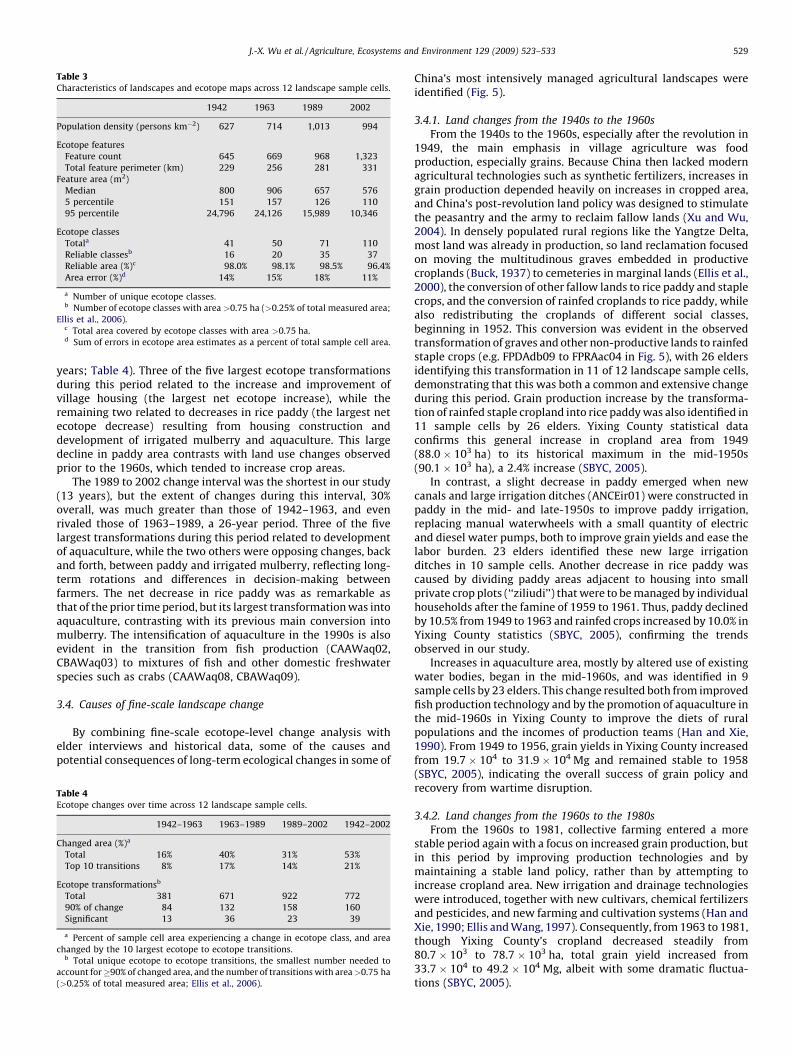
Table 3Characteristics of landscapes and ecotope maps across 12 landscape sample cells.
1942 1963 1989 2002
Population density (persons km�2) 627 714 1,013 994
Ecotope features
Feature count 645 669 968 1,323
Total feature perimeter (km) 229 256 281 331
Feature area (m2)
Median 800 906 657 576
5 percentile 151 157 126 110
95 percentile 24,796 24,126 15,989 10,346
Ecotope classes
Totala 41 50 71 110
Reliable classesb 16 20 35 37
Reliable area (%)c 98.0% 98.1% 98.5% 96.4%
Area error (%)d 14% 15% 18% 11%
a Number of unique ecotope classes.b Number of ecotope classes with area >0.75 ha (>0.25% of total measured area;
Ellis et al., 2006).c Total area covered by ecotope classes with area >0.75 ha.d Sum of errors in ecotope area estimates as a percent of total sample cell area.
J.-X. Wu et al. / Agriculture, Ecosystems and Environment 129 (2009) 523–533 529
years; Table 4). Three of the five largest ecotope transformationsduring this period related to the increase and improvement ofvillage housing (the largest net ecotope increase), while theremaining two related to decreases in rice paddy (the largest netecotope decrease) resulting from housing construction anddevelopment of irrigated mulberry and aquaculture. This largedecline in paddy area contrasts with land use changes observedprior to the 1960s, which tended to increase crop areas.
The 1989 to 2002 change interval was the shortest in our study(13 years), but the extent of changes during this interval, 30%overall, was much greater than those of 1942–1963, and evenrivaled those of 1963–1989, a 26-year period. Three of the fivelargest transformations during this period related to developmentof aquaculture, while the two others were opposing changes, backand forth, between paddy and irrigated mulberry, reflecting long-term rotations and differences in decision-making betweenfarmers. The net decrease in rice paddy was as remarkable asthat of the prior time period, but its largest transformation was intoaquaculture, contrasting with its previous main conversion intomulberry. The intensification of aquaculture in the 1990s is alsoevident in the transition from fish production (CAAWaq02,CBAWaq03) to mixtures of fish and other domestic freshwaterspecies such as crabs (CAAWaq08, CBAWaq09).
3.4. Causes of fine-scale landscape change
By combining fine-scale ecotope-level change analysis withelder interviews and historical data, some of the causes andpotential consequences of long-term ecological changes in some of
Table 4Ecotope changes over time across 12 landscape sample cells.
1942–1963 1963–1989 1989–2002 1942–2002
Changed area (%)a
Total 16% 40% 31% 53%
Top 10 transitions 8% 17% 14% 21%
Ecotope transformationsb
Total 381 671 922 772
90% of change 84 132 158 160
Significant 13 36 23 39
a Percent of sample cell area experiencing a change in ecotope class, and area
changed by the 10 largest ecotope to ecotope transitions.b Total unique ecotope to ecotope transitions, the smallest number needed to
account for�90% of changed area, and the number of transitions with area>0.75 ha
(>0.25% of total measured area; Ellis et al., 2006).
China’s most intensively managed agricultural landscapes wereidentified (Fig. 5).
3.4.1. Land changes from the 1940s to the 1960s
From the 1940s to the 1960s, especially after the revolution in1949, the main emphasis in village agriculture was foodproduction, especially grains. Because China then lacked modernagricultural technologies such as synthetic fertilizers, increases ingrain production depended heavily on increases in cropped area,and China’s post-revolution land policy was designed to stimulatethe peasantry and the army to reclaim fallow lands (Xu and Wu,2004). In densely populated rural regions like the Yangtze Delta,most land was already in production, so land reclamation focusedon moving the multitudinous graves embedded in productivecroplands (Buck, 1937) to cemeteries in marginal lands (Ellis et al.,2000), the conversion of other fallow lands to rice paddy and staplecrops, and the conversion of rainfed croplands to rice paddy, whilealso redistributing the croplands of different social classes,beginning in 1952. This conversion was evident in the observedtransformation of graves and other non-productive lands to rainfedstaple crops (e.g. FPDAdb09 to FPRAac04 in Fig. 5), with 26 eldersidentifying this transformation in 11 of 12 landscape sample cells,demonstrating that this was both a common and extensive changeduring this period. Grain production increase by the transforma-tion of rainfed staple cropland into rice paddy was also identified in11 sample cells by 26 elders. Yixing County statistical dataconfirms this general increase in cropland area from 1949(88.0 � 103 ha) to its historical maximum in the mid-1950s(90.1 � 103 ha), a 2.4% increase (SBYC, 2005).
In contrast, a slight decrease in paddy emerged when newcanals and large irrigation ditches (ANCEir01) were constructed inpaddy in the mid- and late-1950s to improve paddy irrigation,replacing manual waterwheels with a small quantity of electricand diesel water pumps, both to improve grain yields and ease thelabor burden. 23 elders identified these new large irrigationditches in 10 sample cells. Another decrease in rice paddy wascaused by dividing paddy areas adjacent to housing into smallprivate crop plots (‘‘ziliudi’’) that were to be managed by individualhouseholds after the famine of 1959 to 1961. Thus, paddy declinedby 10.5% from 1949 to 1963 and rainfed crops increased by 10.0% inYixing County statistics (SBYC, 2005), confirming the trendsobserved in our study.
Increases in aquaculture area, mostly by altered use of existingwater bodies, began in the mid-1960s, and was identified in 9sample cells by 23 elders. This change resulted both from improvedfish production technology and by the promotion of aquaculture inthe mid-1960s in Yixing County to improve the diets of ruralpopulations and the incomes of production teams (Han and Xie,1990). From 1949 to 1956, grain yields in Yixing County increasedfrom 19.7 � 104 to 31.9 � 104 Mg and remained stable to 1958(SBYC, 2005), indicating the overall success of grain policy andrecovery from wartime disruption.
3.4.2. Land changes from the 1960s to the 1980s
From the 1960s to 1981, collective farming entered a morestable period again with a focus on increased grain production, butin this period by improving production technologies and bymaintaining a stable land policy, rather than by attempting toincrease cropland area. New irrigation and drainage technologieswere introduced, together with new cultivars, chemical fertilizersand pesticides, and new farming and cultivation systems (Han andXie, 1990; Ellis and Wang, 1997). Consequently, from 1963 to 1981,though Yixing County’s cropland decreased steadily from80.7 � 103 to 78.7 � 103 ha, total grain yield increased from33.7 � 104 to 49.2 � 104 Mg, albeit with some dramatic fluctua-tions (SBYC, 2005).

Fig. 5. Ecotope changes across a sample of village landscapes during different time periods, 1942–2002. (a) The top five ecotope to ecotope transformations (past! present)
and (b) the top five decreases (negative; top) and top five increases (positive; below) in ecotope class areas as a percent of total sample cell area. Error bars in (b) are same as in
Fig. 3. Ecotope classes are described in Table 2.
J.-X. Wu et al. / Agriculture, Ecosystems and Environment 129 (2009) 523–533530
By the late 1970s, collective management had proved itselfunable to stimulate maximum production. So agriculture wasagain reformed, this time by the household responsibility system, anew national policy intended to increase the enthusiasm ofChinese farmers by giving households substantial control overboth land management and the profits from their production (Hanand Xie, 1990). While this policy arrived in Yixing in 1982, andprobably caused the largest annual total grain production everachieved in the county, in 1984 (71.6 � 104 Mg total grain;16.7 � 104 Mg summer grain, 54.8 � 104 Mg autumn grain and1.1 � 104 Mg rapeseed), grain production declined thereafter for a
variety of reasons, including the relatively low profits attainablefrom basic grain production and declines in cropland areas (Hanand Xie, 1990; Yang, 1999; SBYC, 2005).
In response to this new freedom in farming decisions, therelative abundance of grain, and a growing interest in moreprofitable activities, paddy land declined significantly. One causeof this was a 5.4% net increase in mulberry production and itseconomic sideline—silk, the main cause of a 6.4% net increase inclosed canopy woody vegetation at the expense of paddy landduring this period (Fig. 3). Another remarkable change was thedramatic increase in constructed area within village lands, mostly

J.-X. Wu et al. / Agriculture, Ecosystems and Environment 129 (2009) 523–533 531
in the form of new and expanded housing and roads, due tosubstantial growth in rural populations (Table 3) and net incomeper peasant (from 79 to 1184 RMB, Chinese currency; SBYC, 2005),which drove housing into paddy and other croplands and increasedthe size and number of stories of houses (Fig. 5). Though many new2 and 3 story houses were built on the foundations of single storyhouses, even more housing was built on the rice paddies andrainfed croplands surrounding existing houses, as identified in 12sample cells by 26 elders.
Interestingly, the construction of new village housing was alsoassociated with the regeneration of woody vegetation and trees inthe land areas adjacent to them, a land change identified in 12sample cells by 26 elders. While this was a relatively small changein the total area of woody vegetation (about a 1% net increase),especially when compared with large changes in mulberryproduction, the planting and regrowth of woody vegetation andtrees around houses and roads is a distinct land change processdriven by the desire of residents to beautify their environment andcreate shade, an effort also encouraged and supported bygovernment since the 1950s (Han and Xie, 1990).
3.4.3. Land changes from the 1980s to the 2000s
Since the mid-1980s, the main drivers of agricultural landscapechange in China have been economic. During this period, grainproduction declined in the Yangtze Delta primarily in response tothe lower net returns for grain production caused by years ofincreasing grain output and the state monopoly on grain purchaseand marketing which kept grain prices very low. Moreover, theselow returns on rice and other grains were coupled with increasingopportunity costs caused by the shifting of rural labor to non-agricultural sectors, particularly rural industries, transport andconstruction (Han and Xie, 1990; Geng, 1992; Yang, 1999). Forexample, 49% of rural labor had shifted to non-agricultural sectorsin Yixing County by 1987 (Han and Xie, 1990).
At the same time, the economic shift away from grain led to adramatic and continuous increase in aquaculture area andmanagement intensity across the Yangtze Delta, which is ideallysituated for profitable aquaculture production (Han and Xie,1990; Song, 1999) and because the net economic return perhectare per year of fishponds was 2–3 times than that of cultivatedland during 1986–1995 (NORPAR, 1997). One result of this wasthe wholesale transformation of rice paddies to large ponds forfish and other freshwater livestock including shrimp and crabs inthe 1990s and today, with aquaculture area in Yixing Countyincreasing from 8.9 � 103 in 1985 to 15.7 � 103 ha in 2002, withespecially rapid growth after the mid-1990s, increasing aquaticproduction from 8.8 � 103 Mg in 1985 to 59.5 � 103 Mg in 2002. Inour study, the move away from grain is readily seen in this majorconversion of rice paddy lands to aquaculture, as identified in 9sample cells by 19 elders, and also by the conversion of paddy tomulberry for silk production, as identified in 6 sample cells by 13elders (Fig. 5).
The market has played a strong role in mulberry/silk productionsince ancient times, with mulberry areas changing frequently inresponse to fluctuations in silk prices (Ellis and Wang, 1997). InYixing County, mulberry area decreased from 1.5 � 103 in 1985 to0.8 � 103 ha in 1988, and then increased and peaked at2.4 � 103 ha in 1995, and then crashed and decreased to0.8 � 103 ha in 1996, and did not recover by 2002 (SBYC, 2005).This dynamic is well demonstrated in our study by largesimultaneous transformations between rice paddy and mulberryand vice versa during the 1989 to 2002 period (Fig. 5), with thetransformation from rice to mulberry identified in 5 sample cellsby 8 elders and the opposite in 4 sample cells by 9 elders.Remarkably, even though our methods can only measure landchanges between time periods directly, we were able to observe
land change dynamics within time periods driven by farmerresponse to market conditions, such as the coupled fluctuations ofrice and mulberry, by combining detailed land mapping withfarmer interviews and historical sources.
Finally, as was observed in smaller amounts before this period,the construction of new village housing and roads was associatedwith the planting and regrowth of woody vegetation and trees inthe land areas adjacent to them, a land change identified in 12sample cells by 26 elders. This side-effect of housing, may explainas much as one fifth of the total net increase in village tree-coversince 1942 (about 0.9% out of 5%), with the remainder causedprimarily by the expansion of mulberry production. These tree-covered areas are nearly always in small patches mixed with otherland uses and land covers, including buildings, paths and smallgardens, making them a prime example of an unexpected andsignificant long-term change in village landscapes that would bevery difficult, if not impossible to observe using conventionalmethods of remote sensing even with higher resolutionapproaches (Ellis et al., 2006).
3.4.4. General observations on land changes in the Yangtze Delta
Our observations of long-term changes in village landscapes atfine spatial scales have much in common with those of previousstudies in China and even in suburban areas of the USA (e.g. Baudryet al., 1999; Yu et al., 1999; Ellis et al., 2006). For example, increasesin population density and economic development over time wereassociated with increases in landscape heterogeneity and vegeta-tion diversity (Baudry et al., 1999; Yu et al., 1999; Ellis et al., 2006)at least partly due to farmer efforts to diversify and strengthenagricultural incomes by incorporating orchards, mulberry, forestryand other economic uses for their land. While the landscapechanges we observed differ in some substantial ways from thoseobserved in different parts of the same region over the same timeperiod (Baudry et al., 1999; Ellis et al., 2000), this is readilyexplained in the case of Baudry et al.’s site, by it’s domination byrainfed agriculture—a very unusual condition in the rice-domi-nated landscapes of the Yangtze Delta Region. In the case of Elliset al.’s (2000) site in Wujin County, Jiangsu, only about 50 km fromour village landscape samples, conditions were more similar, butmulberry was almost entirely eliminated from the site after asevere disease outbreak killed most of the trees in the 1980s. Forthis reason, a long-term net increase in tree and woody cover wasnot observed, but rather a decline. Nevertheless, Ellis et al. (2000)also observed very substantial long-term net declines in villageland area covered by paddy (12%) and fallow land (4%) caused byconversion to buildings and roads (7%), to irrigated and rainfedorchards and vegetable crops (8%), and to new aquaculture ponds(2%).
3.5. Potential ecological consequences of fine-scale landscape changes
Our case study has demonstrated that rural population growth,land policy change, introduction of new agricultural technologiesand economics have all interacted to cause significant fine-scalechanges in densely populated agricultural village landscapes in theYangtze Delta over the past 60 years (Lambin et al., 2001; Doos,2002; Xie et al., 2005; Ellis et al., 2006; Fu et al., 2006; Long et al.,2007a,b). Moreover, this study confirms that substantial long-termchanges can occur in agricultural landscapes even when this is onlythe aggregate result of large numbers of fine-scale landscapetransformations (Ellis et al., 2006). For example, in both 2002 and1942, approximately 5% of village landscape sample area wascovered by canals <30 m wide, too narrow to be identified byconventional remote sensing platforms with resolutions �30 m.Yet there is a vast network of these canals and they have powerfulecological, hydraulic and economic functions in the Yangtze Delta,
J.-X. Wu et al. / Agriculture, Ecosystems and Environment 129 (2009) 523–533532
supporting irrigation, aquaculture, flood control, and transporta-tion while serving as a rapid conduit for nutrients and other non-point pollutants from croplands, aquaculture, and the informalsewage systems of tens of millions of rural households (Yan et al.,2005; Huang et al., 2006; Liu et al., 2008).
The dramatic increase in aquaculture area and intensity that weobserved for the 1990s is a key driver of surface water nutrientpollution in the Yangtze Delta, including Tai Lake (Huang et al.,2006). Except for the new construction of large ponds, these landuse changes are very hard to measure by remote sensing:interviews with land managers were required to identify mostconversions of fallow water bodies to aquaculture.
The ecological consequences of agricultural landscape changeand management change can be both positive and negative andcan be relevant both locally, like increasing soil fertility (Yu et al.,2003) and water pollution (Yan et al., 2005), and globally, such aschanges in soil carbon sequestration (Li et al., 2003; Wang et al.,2003; DeGryze et al., 2004) and greenhouse gas emissions (DeFrieset al., 2004; Zou et al., 2005). In terms of environmental benefitslike soil carbon sequestration, some land transformations areessentially neutral, like the change from rice to mulberry, becausetheir soil organic carbon densities are similar (Wu et al., 2006),even while their vegetation carbon may increase significantly.Another example of this is the introduction of trees and otherwoody vegetation into previously cultivated land around newhouses and roads, which has the potential to sequester significantcarbon in both biomass and soils (DeGryze et al., 2004), whileenhancing local environmental diversity. While these new patchesof woody vegetation and trees were usually too small to observe bycoarser-resolution remote sensing, they increased from about 0.4%of the site in 1942 to about 1% in 2002—a significant change notobservable by conventional remote sensing approaches to landchange measurement (Ellis et al., 2006). Even more complexity isinvolved in evaluating the global climate impacts of some landchanges because of their potential to have conflicting effects onclimate, such as the transition from rice paddy to rainfed crops,which causes significant carbon loss from soils (Nishimura et al.,2008), while substantially reducing methane emissions at thesame time. Another local example of simultaneous environmentalimpacts of a single land use change is the expansion of impervioussurfaces to more than 10% of village landscapes in 2002, which hascertainly caused increased surface water runoff, enhancing waterpollution, while likely enhancing regional warming by a ruralversion of the ‘‘urban heat-island’’ effect (Ellis et al., 2006; Shi et al.,2007).
4. Conclusions
Substantial changes occurred over the past 60 years at finespatial scales in the agricultural village landscapes of China’sYangtze Delta, especially during the period from 1963 to 1989.These changes were caused by rural population growth combinedwith changes in land policy, agricultural technology and increas-ingly, by market-oriented land management. Rice paddy, thematrix of Yangtze Delta landscapes, decreased dramatically, by22% over the long-term, while built surfaces and aquacultureincreased, by 8% and 14%, respectively. Though small, we alsoobserved net increases in tree cover over time, caused in part bythe planting and the regrowth of trees around expanding housingareas, but mostly by a shift toward mulberry production and awayfrom rice paddy. Fine-scale mapping of ecological changes revealedthat land management became increasingly fragmented, diversi-fied and therefore more complex over time. By integrating detailedland change observations with elder interviews and historicalrecords, the causes of ecologically significant changes in denselypopulated and dynamic agricultural landscapes were revealed.
Combining this approach with ecological measurements, such assoil carbon and vegetation biomass, and also with data on land andresource management practices should allow the ecologicalconsequences of these long-term landscape changes to bequantified and potentially modeled in the future.
Acknowledgements
This material is based upon work supported by the U.S. NationalScience Foundation under Grant DEB-0075617 awarded to Erle C.Ellis in 2000 and conducted in collaboration with Prof. Lin-ZhangYang of the Institute of Soil Science, Chinese Academy of Sciences(CAS), Nanjing, China, Prof. Hua Ouyang of the Institute ofGeographic Sciences and Natural Resources Research, CAS, Beijing,China and Prof. Xu Cheng of China Agricultural University, Beijing,China. Additional support was provided by the National BasicResearch Program of China (973 program) of The Ministry ofScience and Technology of China under Grant 2006CB100206 (XuCheng). We are very grateful to Professor Fu-Suo Zhang of theCollege of Resources and Environmental Sciences at ChinaAgricultural University for inspiring research ideas and othersupport. And we are forever grateful to our local field collaboratorsfor assistance in Yixing County, with special thanks to Hong-GuangHuang, Shun-Pei Wu, Rui Shen, Jian-Xiong Lu and Hai-Feng Liao fortheir help in collecting agriculture data, and to the Soil andFertilizer Section of Yixing County Agriculture Bureau, Xushe TownAgriculture Server Center, Yixing County Statistics Bureau andXushe Town Statistics Section. Thanks also to our anonymousreviewers for helpful comments on the manuscript. Any opinions,findings, conclusions or recommendations expressed in thismaterial are those of the authors and do not necessarily reflectthe views of the National Science Foundation.
References
Baudry, J., Yu, Z.R., Wan, C.L., 1999. Landscape patterns changes in two subtropicalChinese villages as related to farming policies. Crit. Rev. Plant Sci. 18 (3), 373–380.
Buck, J.L., 1937. Land Utilization in China. Commercial Press, Shanghai, China.DeFries, R.S., Foley, J.A., Asner, G.P., 2004. Land-use choices: balancing human needs
and ecosystem function. Front. Ecol. Environ. 2, 249–257.DeGryze, S., Six, J., Paustian, K., Morris, S.J., Paul, E.A., Merckx, R., 2004. Soil organic
carbon pool changes following land-use conversions. Global Change Biol. 10,1120–1132.
Doos, B.R., 2002. Population growth and loss of arable land. Global Environ. Change12 (2), 303–311.
Ellis, E.C., 2004. Long-term ecological changes in the densely populated rurallandscapes of China. In: DeFries, R.S., Asner, G.P., Houghton, R.A. (Eds.), Eco-systems and Land Use Change. American Geophysical Union, Washington, DC,pp. 303–320.
Ellis, E.C., Li, R.G., Yang, L.Z., Cheng, X., 2000. Long-term change in village-scaleecosystems in China using landscape and statistical methods. Ecol. Appl. 10,1057–1073.
Ellis, E.C., Ramankutty, N., 2008. Putting people in the map: anthropogenic biomesof the world. Front. Ecol. Environ. 6, 439–447.
Ellis, E.C., Wang, H., 2006. Estimating area errors for fine-scale feature-basedecological mapping. Int. J. Remote Sens. 27 (21), 4731–4749.
Ellis, E.C., Wang, H., Xiao, H.S., Peng, K., Liu, X.P., Li, S.C., Ouyang, H., Cheng, X., Yang,L.Z., 2006. Measuring long-term ecological changes in densely populated land-scapes using current and historical high resolution imagery. Remote Sens.Environ. 100, 457–473.
Ellis, E.C., Wang, S.M., 1997. Sustainable traditional agriculture in the Tai LakeRegion of China. Agric. Ecosyst. Environ. 61, 177–193.
Fu, B.J., Hu, C.X., Chen, L.D., Honnay, O., Gulinck, H., 2006. Evaluating change inagricultural landscape pattern between 1980 and 2000 in the Loess hilly regionof Ansai County, China. Agric. Ecosyst. Environ. 114, 387–396.
Geng, D.C., 1992. Survey on types of activities and incomes of rural households. In:Geng, D.C. (Ed.), Data Collection of Rural Household Economic Behavior andLabour Utilization. Chinese Statistical Publishing House, Beijing, China (inChinese).
Han, C.R., 1989. Recent changes in the rural environment in China. J. Appl. Ecol. 26,803–812.
Han, X.H., Xie, A.P., 1990. Yixing County Record (Yixing Xian Zhi). Editorial com-mittee of Yixing County record (Eds.), Shanghai People’s Publishing House,Shanghai, China. (in Chinese).

J.-X. Wu et al. / Agriculture, Ecosystems and Environment 129 (2009) 523–533 533
Huang, Q., Shen, H., Wang, Z., Liu, X., Fu, R., 2006. Influences of natural andanthropogenic processes on the nitrogen and phosphorus fluxes of the YangtzeEstuary. China Reg. Environ. Change 6, 125.
King, F.H., 1911. Farmers of Forty Centuries, or Permanent Agriculture in China,Korea and Japan, Reprint edition. Rodale Press, Emmaus, PA, USA.
Lambin, E.F., Turner, B.L., Geist, H.J., Agbola, S.B., Angelsen, A., Bruce, J.W., Coomes,O.T., Dirzo, R., Fischer, G., Folke, C., George, P.S., Homewood, K., Imbernon, J.,Leemans, R., Li, X.B., Moran, E.F., Mortimore, M., Ramakrishnan, P.S., Richards,J.F., Skanes, H., Steffen, W., Stone, G.D., Svedin, U., Veldkamp, T.M., Vogel, C., Xu,J.C., 2001. The causes of land-use and land-cover change: moving beyond themyths. Global Environ. Chang. 11 (4), 261–269.
Li, C.S., Zhuang, Y.H., Frolking, S., Galloway, J., Harris, R., Moore III, B., Schimel, D.,Wang, X.K., 2003. Modeling soil organic carbon change in croplands of China.Ecol. Appl. 327–336.
Li, S.Y., 1993. Yield stability and fertilizer efficiency of long-term triple cerealcropping in paddy fields of China. Biol. Fert. Soils 16 (2), 151–153.
Li, Y., 2000. Land Resources in China. China Land Press, Beijing, China (in Chinese).Lindert, P.H., Joann, L., Wu, W.L., 1996. Trends in the soil chemistry of South China
since the 1930s. Soil Sci. 161 (5), 329–342.Liu, C., Wang, Q.X., Mizuochi, M., Wang, K.L., Lin, Y.M., 2008. Human behavioral
impact on nitrogen flow—a case study of rural area of the middle and lowerreaches of the Changjiang River, China. Agric. Ecosyst. Environ. 125, 84–92.
Long, H.L., Heilig, G.K., Li, X.B., Zhang, M., 2007a. Socio-economic development andland-use change: analysis of rural housing land transition in the Transect of theYangtze River, China. Land Use Policy 24, 141–153.
Long, H.L., Tang, G.P., Li, X.B., Heilig, G.K., 2007b. Socio-economic driving forces ofland-use change in Kunshan, the Yangtze River Delta economic area of China. J.Environ. Manage. 83 (3), 351–364.
Meng, L., Ding, W.X., Cai, Z.C., 2005. Long-term application of organic manure andnitrogen fertilizer on N2O emission, soil quality and crop production in a sandyloam soil. Soil Biol. Biochem. 37, 2037–2045.
National Office of the Regional Planning for Agricultural Resources (NORPAR), 1997.Analysis and assessment of the 10-year change of China’s agricultural resources,1986–1995. Beijing, China (in Chinese).
Nishimura, S., Yonemura, S., Sawamoto, T., Shirato, Y., Akiyama, H., Sudo, S., Yagi, K.,2008. Effect of land use change from paddy rice cultivation to upland cropcultivation on soil carbon budget of a cropland in Japan. Agric. Ecosyst. Environ.125, 9–20.
Ozdogan, M., Woodcock, C.E., 2006. Resolution dependent errors in remote sensingof cultivated areas. Remote Sens. Environ. 103 (2), 203–217.
Shi, P.J., Yuan, Y., Zheng, J., Wang, J.A., Ge, Y., Qiu, G.Y., 2007. The effect of landuse/cover change on surface runoff in Shenzhen region, China. Catena 69, 31–35.
Song, Z.W., 1999. Rural aquaculture in China. FAO Regional Office for Asia andthe Pacific, available at: <http://www.fao.org/DOCREP/003/X6945E/X6945E00.htm>.
Statistical Bureau of Yixing County (SBYC), 2005. Yixing County Statistical Year-book. Yixing, China. (in Chinese).
Tong, C.L., Hall, C.A.S., Wang, H., 2003. Land use change in rice, wheat and maizeproduction in China (1961–1998). Agric. Ecosyst. Environ. 95, 523–536.
Wang, H., Ellis, E.C., 2005. Spatial accuracy of orthorectified IKONOS imagery andhistorical aerial photographs across five sites in China. Int. J. Remote Sens. 26,1893–1911.
Wang, S.Q., Tian, H.Q., Liu, J.Y., Pan, S.F., 2003. Pattern and change of soil organiccarbon storage in China: 1960s–1980s. Tellus B. 55, 416–427.
Wu, J.X., Jiao, J.G., Xiao, H.S., Wang, H., Cheng, X., Yang, L.Z., Ellis, E.C., 2006.Landscape structure, management and soil organic carbon in the denselypopulated village landscapes of China’s Yangtze Delta Plain. Acta Ecol. Sin.26 (12), 4135–4147 (in Chinese).
Xie, Y.C., Mei, Y., Tian, G.J., Xing, X.R., 2005. Socio-economic driving forces of arableland conversion: a case study of Wuxian City, China. Global Environ. Chang. PartA 15 (3), 238–252.
Xu, J., Wu, C.F., 2004. Study of Land Management in New China. China Land Press,Beijing, China (in Chinese).
Xu, Q., Lu, Y.C., Liu, Y.C., Zhu, H.G., 1980. The Paddy Soil of Tai-Hu Region in China.Shanghai Scientific and Technical Publishers, Shanghai, China (in Chinese andEnglish).
Yan, W.J., Zhang, S., Chen, X.B., Tang, Y.J., 2005. Nitrogen export by runofffrom agricultural plots in two basins in China. Nutr. Cycl. Agroecosys. 71,121–129.
Yang, H., 1999. Growth in China’s grain production 1978–1997: a disaggregateanalysis. World Dev. 27 (12), 2137–2154.
Yu, H., Huang, J.K., Scott, R., Loren, B., 2003. Soil fertility changes of cultivated land inEastern China. Geograph. Res. 22 (3), 380–388 (in Chinese).
Yu, Z.R., Baudry, J., Zhao, B.P., Zhang, H., Li, S.Q., 1999. Vegetation components of asubtropical rural landscape in China. Crit. Rev. Plant Sci. 18 (3), 381–392.
Zou, J.W., Huang, Y., Jiang, J.Y., 2005. A 3-year field measurement of methane andnitrous oxide emissions from rice paddies in China: Effects of water regime,crop residue, and fertilizer application. Global Biogeochem. CY. 19, GB2021, doi:10.1029/2004GB002401.