agricultural growth and structural changes …ageconsearch.umn.edu/bitstream/42162/2/rr82.pdf ·...
TRANSCRIPT
RESEARCH REPORT
AGRICULTURAL GROWTHAND STRUCTURAL CHANGESIN THE PUNJAB ECONOMY:AN INPUT-OUTPUT ANALYSIS
G. S. BhallaG. K. ChadhaS. P. KashyapR. K. Sharma
August 1990
INTERNATIONALF O O DPOLICYRESEARCHINSTITUTE
In collaboration with the
CENTRE FOR THESTUDY OF REGIONALDEVELOPMENT atJAWAHARLAL NEHRUUNIVERSITY
The International Food Policy ResearchInstitute was established in 1975 to identifyand analyze alternative national and inter-national strategies and policies for meetingfood needs in the world, with particular em-phasis on low-income countries and on thepoorer groups in those countries. While theresearch effort is geared to the precise objec-tive of contributing to the reduction of hun-ger and malnutrition, the factors involvedare many and wide-ranging, requiring analysis of underlying processes and extendingbeyond a narrowly defined food sector. TheInstitute's research program reflects world-wide interaction with policymakers, adminis-trators, and others concerned with increasingfood production and with improving theequity of its distribution. Research resultsare published and distributed to officials andothers concerned with national and international food and agricultural policy.
The Institute receives support as a constitu-ent of the Consultative Group on Interna-tional Agricultural Research from a numberof donors including Australia, Belgium,Canada, the People's Republic of China,the Ford Foundation, France, the FederalRepublic of Germany, India, Italy, Japan,the Netherlands, Norway, the Philippines,the Rockefeller Foundation, Switzerland,the United Kingdom, the United States, andthe World Bank. In addition, a number ofother governments and institutions contrib-ute funding to special research projects.
Board of Trustees
Gerry HelleinerChairman, Canada
Harris Mutio MuleVice Chairman, Kenya
Sjarifuddin BaharsjahIndonesia
Anna Ferro-LuzziItaly
Ibrahim Saad Ahmed HagrassEgypt
Yujiro HayamiJapan
James Charles IngramAustralia
Roberto JunguitoColombia
Dharma KumarIndia
Theodore W. SchultzU.S.A.
Leopoldo Soli'sMexico
M. SyeduzzamanBangladesh
Charles Valy TuhoCote d'lvoire
Just Faaland, DirectorEx Officio, Norway
AGRICULTURAL GROWTHAND STRUCTURAL CHANGESIN THE PUNJAB ECONOMY:AN INPUT-OUTPUT ANALYSIS
G. S. BhallaG. K. ChadhaS. P. KashyapR. K. Sharma
Research Report 82International Food Policy Research Institutein collaboration with theCentre for the Study of Regional Developmentat Jawaharlal Nehru UniversityAugust 1990
Copyright 1990 International Food PolicyResearch Institute.
All rights reserved. Sections of this report maybe reproduced without the express permissionof but with acknowledgment to the InternationalFood Policy Research Institute.
Library of Congress Cataloging-in-Publication Data
Agricultural growth and structural changes inthe Punjab economy : an input-output analysis /G. S. Bhalla . . . [et al.].
p. cm. — (Research report / InternationalFood Policy Research Institute ; 82)
"August 1990."Includes bibliographical references.ISBN 0-89629-085-91. Agriculture—Economic aspects—India—
Punjab. 2. Punjab (India)—Economic condi-tions. 3. Input-output analysis—India—Punjab.I. Bhalla, G. S. II. Jawaharlal Nehru University.Centre for the Study of Regional Development.III. Series: Research report (International FoodPolicy Research Institute) : 82.
HD2075.P8A74 1990 90-5108338.1'0954'5—dc20 CIP
CONTENTS
Foreword
1. Summary 9
2. Growth of the Punjab EconomySince 1960/61 12
3. Method of Compilation and Sourcesof Data 32
4. Structural Features of the PunjabEconomy 41
5. Linkage Analysis of the PunjabEconomy 57
6. Income and Employment Multi-pliers in the Punjab Economy 71
7. Conclusions and Policy Implica-tions 87
Appendix 1: Supplementary Tables 89
Appendix 2: Description of Sectorsof the Punjab Economy,1979/80 108
Appendix 3: Methodology for Calcu-lating Multipliers 112
Bibliography 117
TABLES
1. Net state domestic product atfactor cost, by industry of origin,1960/61-1983/84 13
2. Area, output, yield, and growthrates of principal crops of Punjab,1950/51-1984/85 16
3. Sectoral allocation of total ex-penditure in the five-year plansof Punjab, 1951-56 to 1980-85 20
4. Educational facilities in ruralPunjab, 1966-83 21
5. Capital structure in Punjab agri-culture, 1951-82 23
6. Input structure in Punjab agri-culture, 1960/61-1980/81 24
7. Value of output, factor shares invalue added, and labor produc-tivity in wheat cultivation in-Punjab, 1970/71-1983/84 25
8. Regression results for value ofoutput, factor shares in valueadded, and labor productivity inwheat cultivation in Punjab,1970/71-1983/84 25
9. Rural poverty ratio in major In-dian states, 1970/71, 1977/78,and 1983/84 27
10. Levels and growth of productionand employment in selected in-dustries in Punjab, 1970/71-1982/83 29
11. Sectoral classifications of thePunjab economy, 1979/80 and1969/70 33
12. Sectoral trade margins: pur-chasers'-producers' price ratios,1979/80 34
13. Sectoral distribution of net valueadded and gross value of outputin Punjab, 1969/70 42
14. Sectoral distribution of net valueadded and gross value of outputin Punjab, 1979/80 43
15. Sectoral distribution of workersand of output and value addedper worker in Punjab, 1969/70 46
16. Sectoral distribution of workersand of output and value addedper worker in Punjab, 1979/80 47
17. Distribution of final expenditurein Punjab, 1969/70 and 1979/80, and in India, 1979/80 49
18. Per capita consumption expen-diture and its distribution inPunjab, 1969/70 51
19. Per capita consumption expen-diture and its distribution inPunjab, 1979/80 52
20. Distribution of average monthlyper capita expenditure on majorcommodity groups in rural Pun-jab, 1964/65-1983 53
21. Commodity expenditure elasti-cities for cultivating householdsin rural Punjab, 1974/75 54
22. Interindustrial flows and pat-terns of final demand in Punjab,1979/80 58
23. Interindustry coefficient table,Punjab, 1979/80 59
24. Interindustrial flows and pat-terns of final demand in India,1979/80 60
25. Interindustry coefficient table,India, 1979/80 61
26. Leontief inverse for the Punjabinterindustry table, without im-port leakages, 1979/80 61
27. Leontief inverse for the Punjabinterindustry table, with importleakages, 1979/80 61
28. Leontief inverse for the Indiainterindustry table, without im-port leakages, 1979/80 62
29. Leontief inverse for the Indiainterindustry table, with importleakages, 1979/80 62
30. Linkage analysis of Punjab'seconomy, without import leak-ages, 1969/70 and 1979/80 68
31. Linkage analysis of Punjab'seconomy, with import leakages,1969/70 and 1979/80 69
32. Direct and indirect sectoral in-come and multipliers in Punjab,with import leakages, 1969/70 73
33. Direct and indirect sectoral in-come and multipliers in Punjab,with import leakages, 1979/80 74
34. Direct, indirect, and inducedsectoral income and multipliersin Punjab, with import leakages,1969/70 75
35. Direct, indirect, and inducedsectoral income and multipliersin Punjab, with import leakages,1979/80 76
36. Direct and indirect sectoral em-ployment and multipliers inPunjab, with import leakages,1969/70 78
37. Direct and indirect sectoral em-ployment and multipliers inPunjab, with import leakages,1979/80 79
38. Direct, indirect, and inducedsectoral employment and mul-tipliers in Punjab, with importleakages, 1969/70 80
39. Direct, indirect, and inducedsectoral employment and mul-tipliers in Punjab, with importleakages, 1979/80 81
40. Direct and indirect sectoralwage incomes and multipliers inPunjab, with import leakages,1969/70 82
41. Direct and indirect sectoralwage incomes and multipliers inPunjab, with import leakages,1979/80 83
42. Direct, indirect, and inducedsectoral wage incomes and mul-tipliers in Punjab, with importleakages, 1969/70 84
43. Direct, indirect, and inducedsectoral wage incomes and mul-tipliers in Punjab, with importleakages, 1979/80 85
ILLUSTRATIONS
44. Interindustry flows and patternsof final demand in Punjab, 1979/80 89
45. Linkage analysis of Punjab'seconomy, without import leak-ages, 1969/70 100
46. Linkage analysis of Punjab'seconomy, with import leakages,1969/70 102
47. Linkage analysis of Punjab'seconomy, without import leak-ages, 1979/80 104
48. Linkage analysis of Punjab'seconomy, with import leakages,1979/80 106
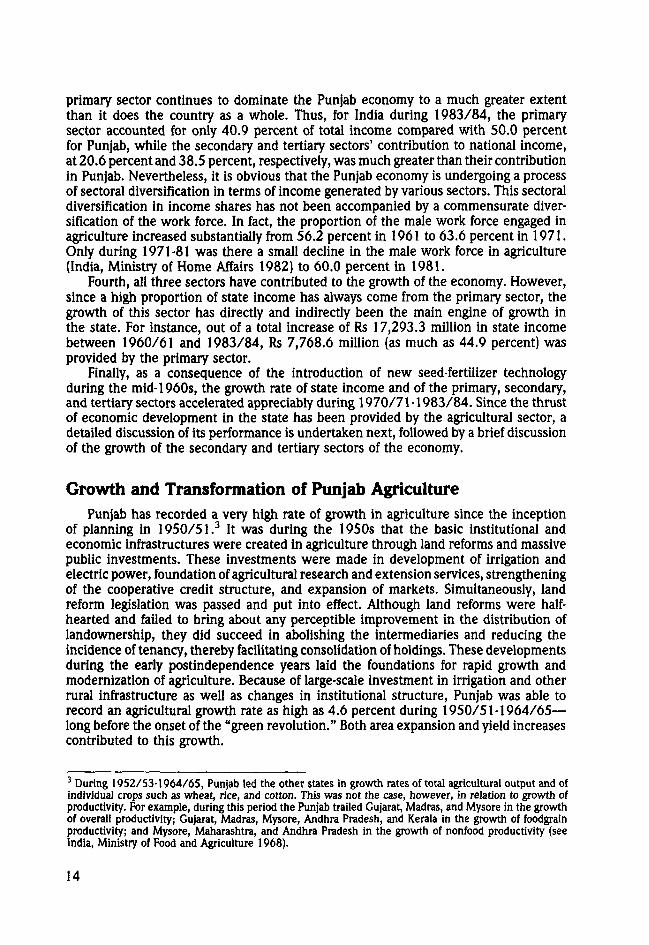
1. Index of agricultural production:India and Punjab, 1960/611986/87 17
2. Index of agricultural productivity:India and Punjab, 1960/61-1983/84 18
FOREWORD
This research report is part of IFPRI's continuous efforts to understand the relation-ship between technological change in agriculture and overall economic growth thatexpands employment and income opportunities for the poor in developing countries.The research is a collaborative effort with the Centre for the Study of Regional Develop-ment at Jawaharlal Nehru University in New Delhi.
The study documents and analyzes the structural changes that have occurred inthe Punjab economy since the green revolution of the mid-1960s. With two input-outputtables—one for 1969/70 and the other for 1979/80—the authors have traced thesources of structural changes and examined the changes in the intersectoral linkagesand the quantum of indirect and induced income and employment generated by differentsectors. Thus the study provides information and critical understanding required todevelop programs that enhance the sectoral income and employment multipliers.
The study highlights changes in the relative importance of the primary, secondary,and tertiary sectors in the economy of Punjab in the wake of improvements in agriculturalproduction technology. It also brings out significant structural changes within thesesectors. For instance, within the primary sector, the relative share of crop productionhas declined, whereas that of animal husbandry has increased. Similarly, within man-ufacturing a notable change has been the emergence of machine- and metal-basedindustries. These changes are reflected in the operation of the economy at a highertechnological level and in the increased labor productivity in most sectors.
Pointing to the large public investment in rural infrastructure that both precededand followed the introduction of the new agricultural technology, the authors concludethat while the primary importance of agricultural development cannot be denied, itssuccess is by no means independent of other factors.
It is notable that the agricultural breakthroughs in Punjab stimulated growth inother sectors of the economy, but not as much as had resulted from similar breakthroughsin other regions or countries, perhaps because of the large net outflow of capital fromPunjab. This observation raises important issues on the role of further agriculturalgrowth as well as the problem of interregional disparities and how best to deal with them.
Just Faaland
Washington, D.C.August 1990
ACKNOWLEDGMENTS
The funds for this study were provided by the International Food Policy ResearchInstitute. We are indebted to John W. Mellor for his support of and interest in thestudy and for his insightful comments on earlier drafts. We are also grateful to PeterHazell, Gunvant Desai, Raisuddin Ahmed, Sheila Bhalla, and S. K. Goyal for theirvaluable suggestions.
Any errors and omissions that remain are the sole responsibility of the authors.
1SUMMARY
This report analyzes the structural changes that have taken place in the Punjabeconomy as a consequence of rapid economic growth since the introduction of thenew seed-fertilizer agricultural technology during the mid-1960s. The report also at-tempts to identify the contribution made by agriculture in the growth process of the state.
Agriculture has been a vibrant sector in the state, thanks to large investmentsundertaken in irrigation both before and after independence in 1947. But the introduc-tion of seed-fertilizer technology during the mid-1960s brought about a qualitativechange and led to unprecedented growth in agricultural output, particularly for wheatand rice. Because of close input, output, and consumption linkages, rapid agriculturalgrowth was accompanied by even faster growth in the secondary (industrial) and tertiary(service) sectors. Consequently, both total and per capita incomes have increasedrapidly. With the state income rising at an annual rate of 5.0 percent from 1960/61to 1983/84, the primary (mainly agricultural) sector recorded an annual growth rateof 4.5 percent, the secondary sector grew at 5.6 percent a year, and the tertiary sectorat 6.8 percent. These growth rates were significantly higher than those registered bythe rest of the country.
Some of the structural changes that have taken place in the Punjab economyconsequent to its rapid growth are worth noting. First, even though the primary sectorcontinues to dominate the Punjab economy to a much greater extent than it does thecountry as a whole, the economy is undergoing a perceptible process of diversification.Whereas the share of the primary sector declined from 59.9 percent in 1960/61 to50.0 percent in 1983/84, that of the secondary sector increased from 14.6 to 17.2percent, and that of the tertiary sector from 25.4 to 32.8 percent during the same period.
Second, the new technology has resulted in phenomenal increases in wheat andrice yields. This, in turn, has made wheat and rice the dominant crops in the state,accounting for nearly 60 percent of the total gross cropped area. Modernization andadoption of new technology has necessitated an increasing use of intermediate non-agricultural inputs in the production process, thus strengthening the intersectoral linkages.
Further, because of the increasing use of intermediate inputs in agricultural produc-tion, value added as a proportion of value of output has tended to decline. Importantchanges have also taken place in the relative shares of factor incomes in value added inagriculture. In particular, the share of interest and depreciation as a proportion of valueadded has tended to grow because of increasing use of capital in the production process.
The new seed-fertilizer technology in wheat (and later in rice) was no doubt exog-enous to start with. But a noteworthy achievement in Punjab was the rapid process ofinternalization of this technology and its successful exploitation by Punjab farmers. Themost crucial element in making this possible was large public investment in irrigationand power, scientific research, extension services, roads, markets, and other ruralinfrastructure. Because of assured profitability of the new technology, public investmentsin infrastructure were supplemented by large private investments. Along with improvedagriculture, important technological improvements have also taken place in some man-ufacturing lines because of upgraded skills, use of power, and general improvementsin infrastructure.
Manufacturing continues to be dominated by agroprocessing industries, with textilesaccounting for about one-fourth of total manufacturing activity in both value of outputand value added. This is followed by other agriculture-based industries, particularlyfood processing and dairying. However, a notable change is that basic metal industries,metal products, manufacture and repair of vehicles, and bicycles and parts had by1979/80 become fairly important manufacturing sectors in Punjab. The emergence ofmachine-based and metal-based industries reflects the deepening industrial structureof the state.
Because of the much higher level of agricultural output and manufacturing activity,trade and transport and other services such as public administration and banking andinsurance have significantly increased their share in the state economy. The Punjabeconomy, which continues to be dominated by agriculture and agriculture-based indus-tries, is snowing signs of a slow and gradual transition toward a more diversified economy.
An analysis of intersectoral linkages in the Punjab economy shows that a higheruse of intermediate inputs in agriculture has led to more roundabout methods ofproduction and much larger direct and indirect increases in the demand for nonagricul-tural inputs and generation of significant linkages. But the total effect of direct, indirect,and induced demand on the Punjab economy is considerably reduced because of large-scale imports of intermediate inputs and consumption goods. The incremental directand indirect output requirements from the domestic economy are notably smaller inPunjab than in India as a whole because of the high level of imports of industrial goods.The gains of the "green revolution" in Punjab are, therefore, increasingly shared withthe rest of the country. This is evident from the considerable number of workers whocome from outside the state during the planting and peak harvesting seasons.
A comparison of 1969/70 and 1979/80 input-output tables brings out some of thechanges that have taken place in the disposal of gross domestic product (GDP) at marketprices among various elements of final demand during this period. Consumption remainsthe most important activity, accounting for nearly 60 percent of gross domestic expen-ditures during both 1969/70 and 1979/80. A significant change is a marked increasein the share of gross fixed capital formation in GDP during 1979/80 compared with1969/70. Another notable feature of the Punjab economy is that despite very largeimports of industrial products as inputs for the agricultural and manufacturing sectorsand for final consumption, the increasing exports of wheat, rice, and cotton and ofsome agroprocessing and other industries have made it a highly export-surplus economy.Whereas substantial resources were transferred to Punjab for both rehabilitation andinfrastructural investment for a number of years after independence, there is evidenceto suggest that considerable savings from the Punjab economy have been used forinvestment outside the state since it became surplus in agricultural production. A majorchallenge for policymakers is to create a climate that encourages the investment ofthese savings within Punjab, thereby accelerating the growth rate of the secondary andtertiary sectors.
An analysis of forward and backward linkages among various sectors in the Punjabeconomy shows that some important changes have taken place in the nature andnumber of these linkages. During 1969/70, only the agricultural sectors, includinganimal husbandry, and some agroprocessing sectors were generating high forward andbackward linkages on account of income and wage income with and without importleakages. During 1979/80, many more sectors joined this group (when linkages areconsidered without or with import leakages), indicating that the economy was function-ing at a higher technological level. The important new sectors with import leakages
10
are some machine-based and metal-based industries on the one hand, and trade andtransport, other services, banking, and real estate on the other.
The multiplier analysis further confirms that important changes took place in thestructure of the Punjab economy during 1969/70-1979/80. For example, in 1969/70,it was primarily the agriculture-based industries that recorded the highest indirectincome and employment. In 1979/80, in addition to these, other industries such asbasic metals, metal products, other chemicals, machine goods, electrical and nonelec-trical machinery, and drugs and Pharmaceuticals also began to show high indirectincome and employment levels. It is also found that, since major economic activity isdevoted to meeting the consumption needs of the Punjab population, those sectorsthat have an important place in the consumption basket have very high induced incomes.
The rapid growth and structural transformation of the Punjab economy has takenplace primarily as a result of technological breakthroughs in agriculture. The Punjabexperience underlines that in an agriculture-dominant, labor-surplus economy, rapidgrowth in agriculture has widespread effects and can become a powerful instrumentfor marked acceleration of the overall growth of the economy.
The Punjab experience also emphasizes that it is possible for a region within alarge country to enjoy the fruits of specialization and comparative advantage in aconstrained "open" economy context. Punjab was able to derive the maximum benefitsof specialization in agriculture because, being a state of India, it could freely export itsagricultural surpluses at favorable prices, import modern agricultural and industrialinputs from the rest of India, and attract a large number of agricultural laborers fromother Indian states.
11
GROWTH OF THE PUNJAB ECONOMYSINCE 1960/61
Input-output analysis is a powerful tool for understanding the structural features ofan economy and baring the underlying intersectoral linkages in it. The existence oftwo input-output tables for Punjab, one for 1969/70 (Alagh, Bhalla, and Kashyap 1980,104-113) and the other for 1979/80 (Appendix 1, Table 44), should be helpful forunderstanding not only the structural features but also the changes that have takenplace in the Punjab economy over this period. However, by its very nature, an input-outputtable is a snapshot of an economy at a point of time. Although a comparison of thetwo snapshots can certainly provide some understanding of structural changes, it failsto give any insight on the dynamics of change during this period. In order to providea background for further analysis and to fully appreciate the nature of these changes,the pattern of sectoral growth is reviewed by examining the behavior of the net statedomestic product by industry of origin between 1960/61 and 1983/84.
Overall GrowthPunjab is one of the smallest states of India, accounting for 1.65 percent of the
country's area and about 2.45 percent of its population. This state bore the main bruntof the partition of India in 1947. However, within a few years after this shatteringexperience, Punjab was able not only to rehabilitate its economy but also to emergeas the richest state in India. By 1983/84, the per capita income in Punjab was 3,560rupees (Rs) compared with a national average of Rs 2,288. Table 1 shows severalfeatures of the remarkable rate of growth since 1960. First, as a result of an annualgrowth rate of about 5 percent in net state domestic product during 1960/61 -1983/84,the per capita income recorded a growth of nearly 3 percent a year and almost doubledover this period.1 During the same period, national income and per capita income inthe country as a whole grew at annual rates of nearly 3.5 and 1.3 percent, respectively.
Second, although all sectors of the Punjab economy have been growing at impressiverates, growth has been particularly high in the secondary and tertiary sectors; forexample, during 1960/61-1983/84 the primary sector grew at an annual rate of 4.1percent, while the secondary sector had a growth rate of 5.6 percent and the tertiarysector, 6.8 percent.2 The respective growth rates of these sectors at the national level
1 Since the Punjab was reorganized in 1966/67, time series data on state income are available only from1966/67 onward. The Economic Adviser to the Government of Punjab has given a figure for 1960/61,but NSDP figures for 1960/61-1965/66 have not been estimated. In addition, all data up to 1969/70 areat 1960/61 constant prices and the later data are at 1970/71 constant prices. In view of this, it is difficultto obtain exact growth rates for the entire period 1960/61-1983/84. An attempt has been made to convertthe 1960s figures to 1970/71 constant prices, but the limitations of this exercise are worth noting. Growthrates from 1970/71 to 1983/84 are more reliable for this reason.2 The three sectors of the economy are defined as follows: Primary—agriculture; animal husbandry; forestryand logging; fishing; and mining and quarrying; Secondary—manufacturing; construction; and electricity,gas, and water supply; Tertiary—transport, storage, and communications; trade, hotels, and restaurants;banking and insurance; real estate and ownership of dwellings; public administration and defense; andother services. To simplify the text, all subsectors within these categories are also referred to as sectorsthroughout the report.
12
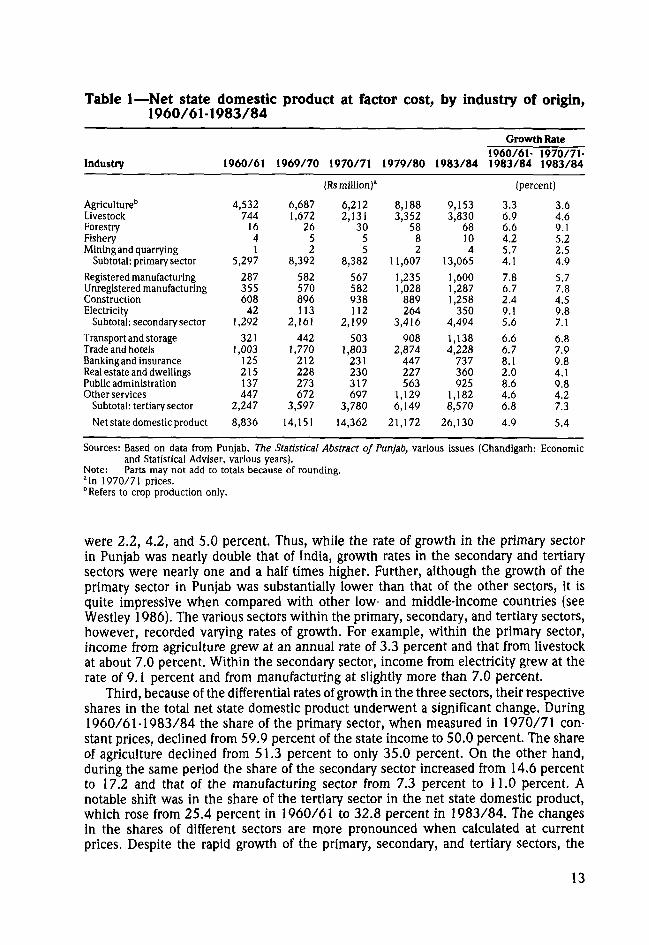
Table 1—Net state domestic product at factor cost, by industry of origin,1960/61-1983/84
Industry
Agriculture11
LivestockForestryFisheryMining and quarrying
Subtotal: primary sector
Registered manufacturingUnregistered manufacturingConstructionElectricity
Subtotal: secondary sector
Transport and storageTrade and hotelsBanking and insuranceReal estate and dwellingsPublic administrationOther services
Subtotal: tertiary sector
Net state domestic product
1960/61
4,532744
1641
5,297
287355608
421,292
3211,003
125215137447
2,247
8,836
1969/70
6,6871,672
2652
8,392
582570896113
2,161
4421,770
212228273672
3,597
14,151
1970/71
(Rs million)3
6,2122,131
3055
8,382
567582938112
2,199
5031,803
231230317697
3,780
14,362
1979/80
8,1883,352
5882
11,607
1,2351,028
889264
3,416
9082,874
447
in563
1,1296,149
21,172
1983/84
9,1533,830
68104
13,065
1,6001,2871,258
3504,494
1,1384,228
737360925
1,1828,570
26,130
Growth Rate1960/61-1983/84
1970/71-1983/84
(percent)
3.36.96.64.25.74.1
7.86.72.49.15.6
6.66.78.12.08.64.66.8
4.9
3.64.69.15.22.54.9
5.77.84.59.87.1
6.87.99.84.19.84.27.3
5.4
Sources: Based on data from Punjab, The Statistical Abstract of Punjab, various issues (Chandigarh: Economicand Statistical Adviser, various years).
Note: Parts may not add to totals because of rounding.aIn 1970/71 prices.b Refers to crop production only.
were 2.2, 4.2, and 5.0 percent. Thus, while the rate of growth in the primary sectorin Punjab was nearly double that of India, growth rates in the secondary and tertiarysectors were nearly one and a half times higher. Further, although the growth of theprimary sector in Punjab was substantially lower than that of the other sectors, it isquite impressive when compared with other low- and middle-income countries (seeWestley 1986). The various sectors within the primary, secondary, and tertiary sectors,however, recorded varying rates of growth. For example, within the primary sector,income from agriculture grew at an annual rate of 3.3 percent and that from livestockat about 7.0 percent. Within the secondary sector, income from electricity grew at therate of 9.1 percent and from manufacturing at slightly more than 7.0 percent.
Third, because of the differential rates of growth in the three sectors, their respectiveshares in the total net state domestic product underwent a significant change. During1960/61-1983/84 the share of the primary sector, when measured in 1970/71 con-stant prices, declined from 59.9 percent of the state income to 50.0 percent. The shareof agriculture declined from 51.3 percent to only 35.0 percent. On the other hand,during the same period the share of the secondary sector increased from 14.6 percentto 17.2 and that of the manufacturing sector from 7.3 percent to 11.0 percent. Anotable shift was in the share of the tertiary sector in the net state domestic product,which rose from 25.4 percent in 1960/61 to 32.8 percent in 1983/84. The changesin the shares of different sectors are more pronounced when calculated at currentprices. Despite the rapid growth of the primary, secondary, and tertiary sectors, the
13
primary sector continues to dominate the Punjab economy to a much greater extentthan it does the country as a whole. Thus, for India during 1983/84, the primarysector accounted for only 40.9 percent of total income compared with 50.0 percentfor Punjab, while the secondary and tertiary sectors' contribution to national income,at 20.6 percent and 38.5 percent, respectively, was much greater than their contributionin Punjab. Nevertheless, it is obvious that the Punjab economy is undergoing a processof sectoral diversification in terms of income generated by various sectors. This sectoraldiversification in income shares has not been accompanied by a commensurate diver-sification of the work force. In fact, the proportion of the male work force engaged inagriculture increased substantially from 56.2 percent in 1961 to 63.6 percent in 1971.Only during 1971-81 was there a small decline in the male work force in agriculture(India, Ministry of Home Affairs 1982) to 60.0 percent in 1981.
Fourth, all three sectors have contributed to the growth of the economy. However,since a high proportion of state income has always come from the primary sector, thegrowth of this sector has directly and indirectly been the main engine of growth inthe state. For instance, out of a total increase of Rs 17,293.3 million in state incomebetween 1960/61 and 1983/84, Rs 7,768.6 million (as much as 44.9 percent) wasprovided by the primary sector.
Finally, as a consequence of the introduction of new seed-fertilizer technologyduring the mid-1960s, the growth rate of state income and of the primary, secondary,and tertiary sectors accelerated appreciably during 1970/71-1983/84. Since the thrustof economic development in the state has been provided by the agricultural sector, adetailed discussion of its performance is undertaken next, followed by a brief discussionof the growth of the secondary and tertiary sectors of the economy.
Growth and Transformation of Punjab AgriculturePunjab has recorded a very high rate of growth in agriculture since the inception
of planning in 1950/51.3 It was during the 1950s that the basic institutional andeconomic infrastructures were created in agriculture through land reforms and massivepublic investments. These investments were made in development of irrigation andelectric power, foundation of agricultural research and extension services, strengtheningof the cooperative credit structure, and expansion of markets. Simultaneously, landreform legislation was passed and put into effect. Although land reforms were half-hearted and failed to bring about any perceptible improvement in the distribution oflandownership, they did succeed in abolishing the intermediaries and reducing theincidence of tenancy, thereby facilitating consolidation of holdings. These developmentsduring the early postindependence years laid the foundations for rapid growth andmodernization of agriculture. Because of large-scale investment in irrigation and otherrural infrastructure as well as changes in institutional structure, Punjab was able torecord an agricultural growth rate as high as 4.6 percent during 1950/51-1964/65—long before the onset of the "green revolution." Both area expansion and yield increasescontributed to this growth.
3 During 1952/53-1964/65, Punjab led the other states in growth rates of total agricultural output and ofindividual crops such as wheat, rice, and cotton. This was not the case, however, in relation to growth ofproductivity. For example, during this period the Punjab trailed Gujarat, Madras, and Mysore in the growthof overall productivity; Gujarat, Madras, Mysore, Andhra Pradesh, and Kerala in the growth of foodgrainproductivity; and Mysore, Maharashtra, and Andhra Pradesh in the growth of nonfood productivity (seeIndia, Ministry of Food and Agriculture 1968).
14
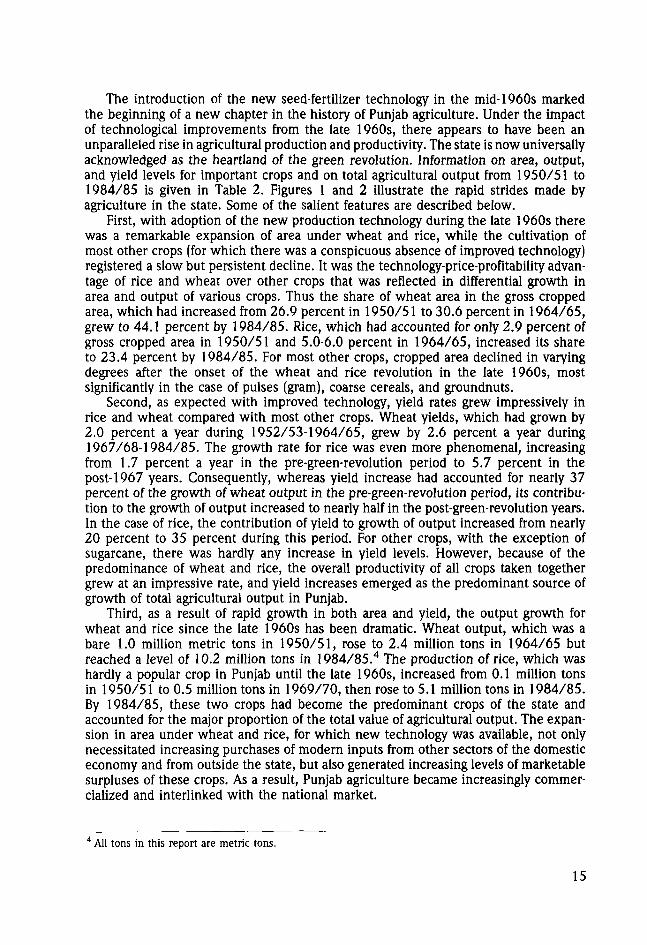
The introduction of the new seed-fertilizer technology in the mid-1960s markedthe beginning of a new chapter in the history of Punjab agriculture. Under the impactof technological improvements from the late 1960s, there appears to have been anunparalleled rise in agricultural production and productivity. The state is now universallyacknowledged as the heartland of the green revolution. Information on area, output,and yield levels for important crops and on total agricultural output from 1950/51 to1984/85 is given in Table 2. Figures 1 and 2 illustrate the rapid strides made byagriculture in the state. Some of the salient features are described below.
First, with adoption of the new production technology during the late 1960s therewas a remarkable expansion of area under wheat and rice, while the cultivation ofmost other crops (for which there was a conspicuous absence of improved technology)registered a slow but persistent decline. It was the technology-price-profitability advan-tage of rice and wheat over other crops that was reflected in differential growth inarea and output of various crops. Thus the share of wheat area in the gross croppedarea, which had increased from 26.9 percent in 1950/51 to 30.6 percent in 1964/65,grew to 44.1 percent by 1984/85. Rice, which had accounted for only 2.9 percent ofgross cropped area in 1950/51 and 5.0-6.0 percent in 1964/65, increased its shareto 23.4 percent by 1984/85. For most other crops, cropped area declined in varyingdegrees after the onset of the wheat and rice revolution in the late 1960s, mostsignificantly in the case of pulses (gram), coarse cereals, and groundnuts.
Second, as expected with improved technology, yield rates grew impressively inrice and wheat compared with most other crops. Wheat yields, which had grown by2.0 percent a year during 1952/53-1964/65, grew by 2.6 percent a year during1967/68-1984/85. The growth rate for rice was even more phenomenal, increasingfrom 1.7 percent a year in the pre-green-revolution period to 5.7 percent in thepost-1967 years. Consequently, whereas yield increase had accounted for nearly 37percent of the growth of wheat output in the pre-green-revolution period, its contribu-tion to the growth of output increased to nearly half in the post-green-revolution years.In the case of rice, the contribution of yield to growth of output increased from nearly20 percent to 35 percent during this period. For other crops, with the exception ofsugarcane, there was hardly any increase in yield levels. However, because of thepredominance of wheat and rice, the overall productivity of all crops taken togethergrew at an impressive rate, and yield increases emerged as the predominant source ofgrowth of total agricultural output in Punjab.
Third, as a result of rapid growth in both area and yield, the output growth forwheat and rice since the late 1960s has been dramatic. Wheat output, which was abare 1.0 million metric tons in 1950/51, rose to 2.4 million tons in 1964/65 butreached a level of 10.2 million tons in 1984/85.4 The production of rice, which washardly a popular crop in Punjab until the late 1960s, increased from 0.1 million tonsin 1950/51 to 0.5 million tons in 1969/70, then rose to 5.1 million tons in 1984/85.By 1984/85, these two crops had become the predominant crops of the state andaccounted for the major proportion of the total value of agricultural output. The expan-sion in area under wheat and rice, for which new technology was available, not onlynecessitated increasing purchases of modern inputs from other sectors of the domesticeconomy and from outside the state, but also generated increasing levels of marketablesurpluses of these crops. As a result, Punjab agriculture became increasingly commer-cialized and interlinked with the national market.
4 All tons in this report are metric tons.
15
T CO ro — O m coro — O m cof * "1 °- - - 1 .
in* in" u-T <T rC
MONmtOOO -o CO <~ m CM
I/)
oo
00
oif)
©
COCM_CM
ro <-oo N m io o^N(O(O t O —
— — .— — cs oq
oCM
CM
-— rn <N r o ro fo (N ro TJ t c
O ;O
I
oCM
oO;CM"
fCMO
ooCM
I
COinco
in
09
13
f
U 1 « t n Om !N rq — — m o
<s <o CM
co in o o - 1 o- co(S co e> o o- o- o— — CM ro <N — —
o ro in c> f o oo ~~ o> in ro co co*o oo co co o >o in
CMCO
CMCM
dCMCO
o(0
ITO
O O l & Om O O rr ro —
TJ- ro co co oM/lfON
m
sIf
I
• * CM o m m -o oCM T o ro o o tvO ^ O OCOOO
coco
1 - I - 9.-^J" ^ ^"--T CM" CM" co"
CM O CO CM O -O ^ tO O CM CM O O t^co o c M o r « o
— — — — C M CO
N a - m i/i - TJ
— CM co *r m o^o^
•as^^ ^ CM CM CO CO •
inin
ooo
00 O
oo -d
CM tvCO 00
-d d
•a
0>
I I
16
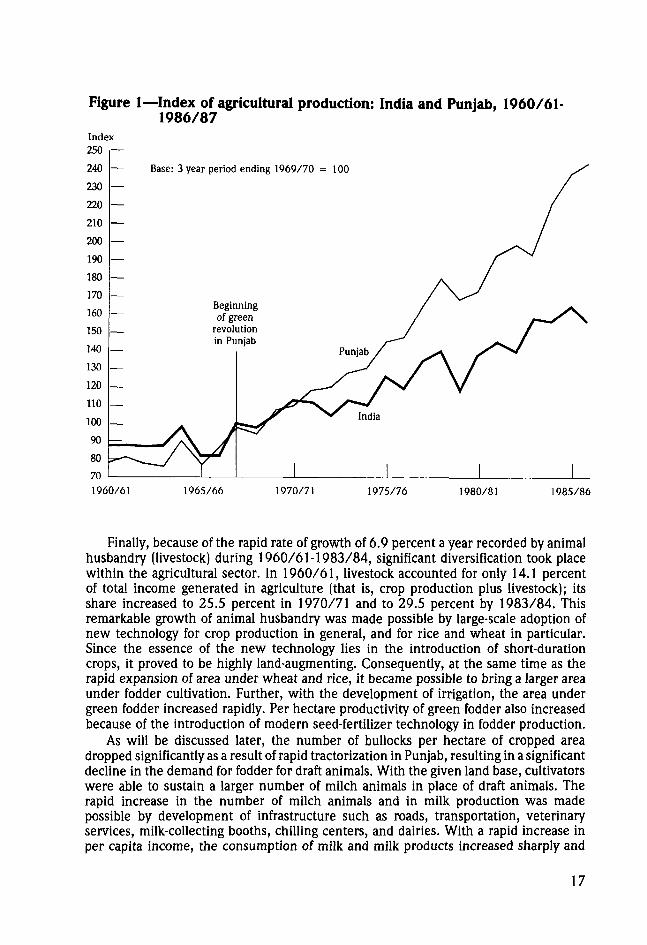
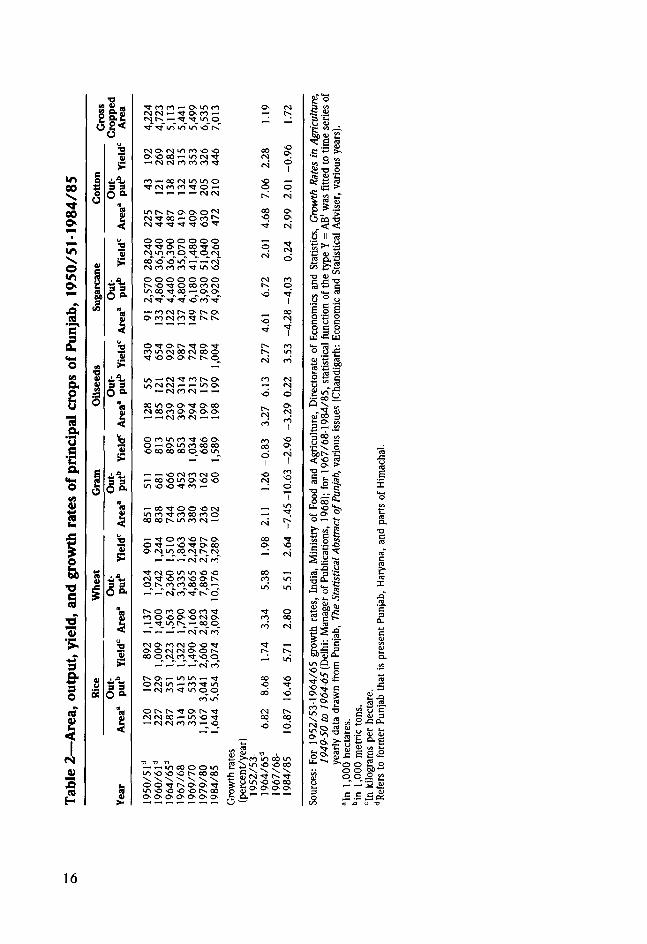
Figure 1—Index of agricultural production: India and Punjab, 1960/61-1986/87
Base: 3-year period ending 1969/70 = 100
Beginningof green
revolutionin Punjab
1960/61 1965/66 1970/71 1975/76 1980/81 1985/86
Finally, because of the rapid rate of growth of 6.9 percent a year recorded by animalhusbandry (livestock) during 1960/61-1983/84, significant diversification took placewithin the agricultural sector. In 1960/61, livestock accounted for only 14.1 percentof total income generated in agriculture (that is, crop production plus livestock); itsshare increased to 25.5 percent in 1970/71 and to 29.5 percent by 1983/84. Thisremarkable growth of animal husbandry was made possible by large-scale adoption ofnew technology for crop production in general, and for rice and wheat in particular.Since the essence of the new technology lies in the introduction of short-durationcrops, it proved to be highly land-augmenting. Consequently, at the same time as therapid expansion of area under wheat and rice, it became possible to bring a larger areaunder fodder cultivation. Further, with the development of irrigation, the area undergreen fodder increased rapidly. Per hectare productivity of green fodder also increasedbecause of the introduction of modern seed-fertilizer technology in fodder production.
As will be discussed later, the number of bullocks per hectare of cropped areadropped significantly as a result of rapid tractorization in Punjab, resulting in a significantdecline in the demand for fodder for draft animals. With the given land base, cultivatorswere able to sustain a larger number of milch animals in place of draft animals. Therapid increase in the number of milch animals and in milk production was madepossible by development of infrastructure such as roads, transportation, veterinaryservices, milk-collecting booths, chilling centers, and dairies. With a rapid increase inper capita income, the consumption of milk and milk products increased sharply and
17
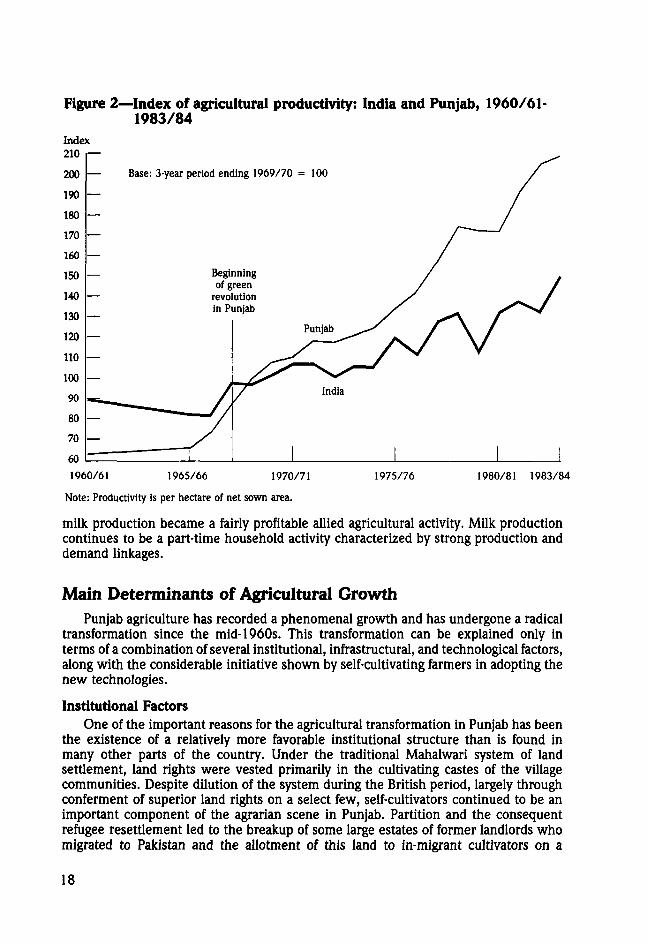
Figure 2—Index of agricultural productivity: India and Punjab, 1960/61-1983/84
Index
200
190
180
170
160
150
140
130
120
110
100
90
80
70
60
— Base: 3-year period ending 1969/70 = 1 0 0 /
— Begiof g
— revoinP
—
— " " " " /
— y1
ining /reen / /ution / /Nab / ^<(^ f V
Punjab ^ y / \ /
/ a
i i i1960/61 1965/66 1970/71
Note: Productivity is per hectare of net sown area.
1975/76 1980/81 1983/84
milk production became a fairly profitable allied agricultural activity. Milk productioncontinues to be a part-time household activity characterized by strong production anddemand linkages.
Main Determinants of Agricultural GrowthPunjab agriculture has recorded a phenomenal growth and has undergone a radical
transformation since the mid-1960s. This transformation can be explained only interms of a combination of several institutional, infrastructural, and technological factors,along with the considerable initiative shown by self-cultivating farmers in adopting thenew technologies.
Institutional FactorsOne of the important reasons for the agricultural transformation in Punjab has been
the existence of a relatively more favorable institutional structure than is found inmany other parts of the country. Under the traditional Mahalwari system of landsettlement, land rights were vested primarily in the cultivating castes of the villagecommunities. Despite dilution of the system during the British period, largely throughconferment of superior land rights on a select few, self-cultivators continued to be animportant component of the agrarian scene in Punjab. Partition and the consequentrefugee resettlement led to the breakup of some large estates of former landlords whomigrated to Pakistan and the allotment of this land to in-migrant cultivators on a
18
much-reduced scale. The various land reform laws, despite their limitations, resultedin the emergence of self-cultivation as the predominant mode of production. In 1953/54,in United Punjab (comprising the present Punjab, Haryana, and parts of HimachalPradesh) about 60.0 percent of net operated area was under self-cultivation; by 1971/72this had risen to 74.2 percent.
The Role of InfrastructureDevelopment of infrastructure has played a major role in the agricultural transfor-
mation of Punjab. The state enjoyed an initial advantage in irrigation development, aslarge-scale investments in canal irrigation had been undertaken by the colonial govern-ment during the last part of the nineteenth century and the early twentieth century.Thus, on the eve of independence in 1947, East Punjab (the present Punjab, Haryana,and parts of Himachal Pradesh) had about 33 percent of its area irrigated, comparedwith only 18 percent for the country as a whole (Hirashima 1978).
With the launching of planned development in 1951, the policymakers in Indiagave high priority to investment for the development of rural infrastructure. In Punjabthe plan strategy consisted of developing agriculture—the most dominant sector—alongwith a network of small-scale agroprocessing, agro-input, and consumer goods industries.The policymakers were keenly aware of the importance of irrigation and other ruralinfrastructure such as power, credit, roads, markets, research, extension, and ruraleducation for rapid development of agriculture and allied industries.
It is significant that Punjab was able to maintain a high level of per capita develop-ment expenditure during the entire planning period. In terms of plan outlay, the stateoccupied the top position during the first three plan periods (1951-66) and has sincebeen in second place among all the major states of India. For the first three plans, thishigh level of expenditure was financed mainly through high levels of per capita centralassistance, but it was sustained afterward through larger internal resources.
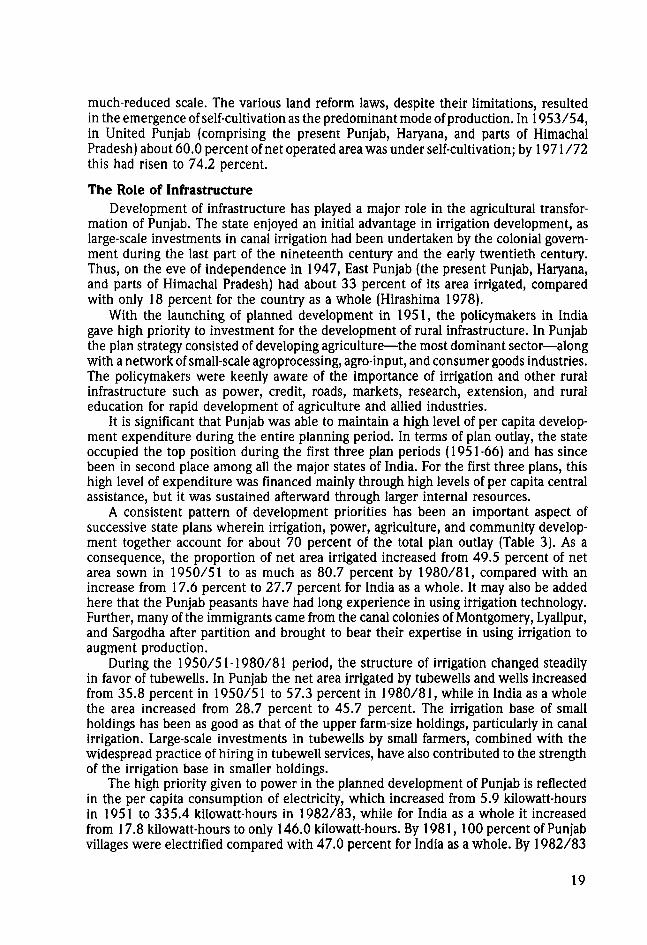
A consistent pattern of development priorities has been an important aspect ofsuccessive state plans wherein irrigation, power, agriculture, and community develop-ment together account for about 70 percent of the total plan outlay (Table 3). As aconsequence, the proportion of net area irrigated increased from 49.5 percent of netarea sown in 1950/51 to as much as 80.7 percent by 1980/81, compared with anincrease from 17.6 percent to 27.7 percent for India as a whole. It may also be addedhere that the Punjab peasants have had long experience in using irrigation technology.Further, many of the immigrants came from the canal colonies of Montgomery, Lyallpur,and Sargodha after partition and brought to bear their expertise in using irrigation toaugment production.
During the 1950/51-1980/81 period, the structure of irrigation changed steadilyin favor of tubewells. In Punjab the net area irrigated by tubewells and wells increasedfrom 35.8 percent in 1950/51 to 57.3 percent in 1980/81, while in India as a wholethe area increased from 28.7 percent to 45.7 percent. The irrigation base of smallholdings has been as good as that of the upper farm-size holdings, particularly in canalirrigation. Large-scale investments in tubewells by small farmers, combined with thewidespread practice of hiring in tubewell services, have also contributed to the strengthof the irrigation base in smaller holdings.
The high priority given to power in the planned development of Punjab is reflectedin the per capita consumption of electricity, which increased from 5.9 kilowatt-hoursin 1951 to 335.4 kilowatt-hours in 1982/83, while for India as a whole it increasedfrom 17.8 kilowatt-hours to only 146.0 kilowatt-hours. By 1981, 100 percent of Punjabvillages were electrified compared with 47.0 percent for India as a whole. By 1982/83
19
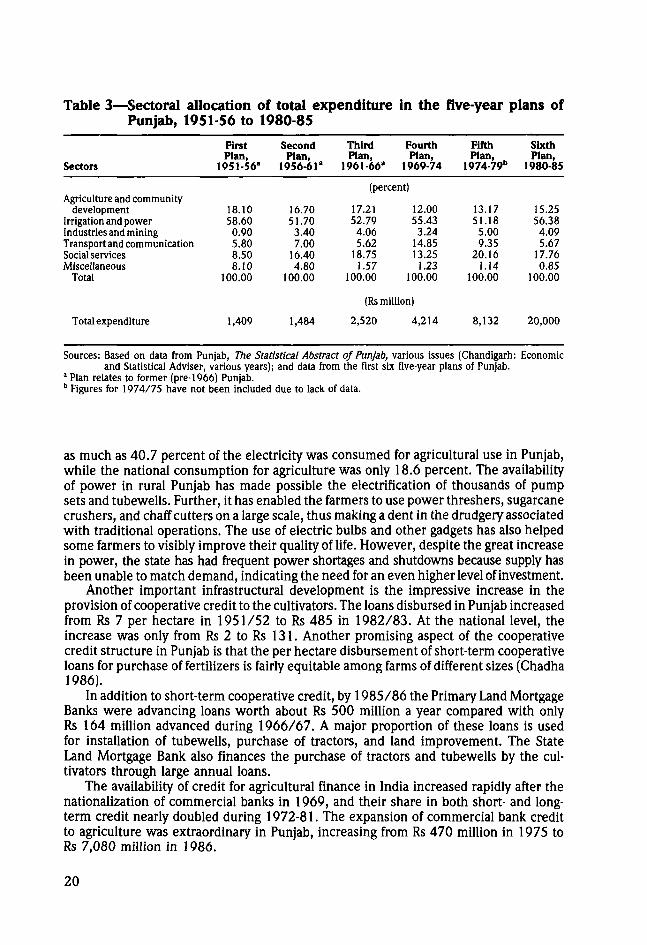
Table 3—Sectoral allocation of total expenditure in the five-year plans ofPunjab, 1951-56 to 1980-85
Sectors
Agriculture and communitydevelopment
Irrigation and powerIndustries and miningTransport and communicationSocial servicesMiscellaneous
Total
Total expenditure
FirstPlan,
1951-56"
18.1058.600.905.808.508.10
100.00
1,409
SecondPlan,
1956-61"
16.7051.703.407.00
16.404.80
100.00
1,484
ThirdPlan,
1961-66"
FourthPlan,
1969-74
(percent)
17.2152.794.065.62
18.751.57
100.00
12.0055.433.24
14.8513.25
1.23100.00
(Rs million)
2,520 4,214
FifthPlan,
1974-79"
13.1751.185.009.35
20.161.14
100.00
8,132
SixthPlan,
1980-85
15.2556.384.095.67
17.760.85
100.00
20,000
Sources: Based on data from Punjab, The Statistical Abstract of Punjab, various issues (Chandigarh: Economicand Statistical Adviser, various years); and data from the first six five-year plans of Punjab.
a Plan relates to former (pre-1966) Punjab.b Figures for 1974/75 have not been included due to lack of data.
as much as 40.7 percent of the electricity was consumed for agricultural use in Punjab,while the national consumption for agriculture was only 18.6 percent. The availabilityof power in rural Punjab has made possible the electrification of thousands of pumpsets and tubewells. Further, it has enabled the farmers to use power threshers, sugarcanecrushers, and chaff cutters on a large scale, thus making a dent in the drudgery associatedwith traditional operations. The use of electric bulbs and other gadgets has also helpedsome farmers to visibly improve their quality of life. However, despite the great increasein power, the state has had frequent power shortages and shutdowns because supply hasbeen unable to match demand, indicating the need for an even higher level of investment.
Another important infrastructural development is the impressive increase in theprovision of cooperative credit to the cultivators. The loans disbursed in Punjab increasedfrom Rs 7 per hectare in 1951/52 to Rs 485 in 1982/83. At the national level, theincrease was only from Rs 2 to Rs 131. Another promising aspect of the cooperativecredit structure in Punjab is that the per hectare disbursement of short-term cooperativeloans for purchase of fertilizers is fairly equitable among farms of different sizes (Chadha1986).
In addition to short-term cooperative credit, by 1985/86 the Primary Land MortgageBanks were advancing loans worth about Rs 500 million a year compared with onlyRs 164 million advanced during 1966/67. A major proportion of these loans is usedfor installation of tubewells, purchase of tractors, and land improvement. The StateLand Mortgage Bank also finances the purchase of tractors and tubewells by the cul-tivators through large annual loans.
The availability of credit for agricultural finance in India increased rapidly after thenationalization of commercial banks in 1969, and their share in both short- and long-term credit nearly doubled during 1972-81. The expansion of commercial bank creditto agriculture was extraordinary in Punjab, increasing from Rs 470 million in 1975 toRs 7,080 million in 1986.
20
Punjab has also undertaken massive programs of infrastructural development inroads, extension services, agricultural research, and education. By 1985, 98 percentof all villages in the state were linked by paved roads. The surfaced road length per1,000 population increased from 0.56 kilometer in 1960/61 to 2.20 kilometers in1982/83 compared with the national average of 1.07 kilometers. In 1982/83, therewere 73.5 kilometers of surfaced roads per 100 square kilometers of area in Punjabcompared with 22.8 kilometers for India as a whole. Between 1965 and 1983, thenumber of passenger vehicles in Punjab increased by nearly 150 times and goodsvehicles by more than 50 times. There has also been a remarkable increase in thenumber of regulated markets and in storage capacity. This has greatly facilitated thesmooth marketing of huge surpluses of wheat and paddy during the peak harvestingseason (Punjab, Economic and Statistical Adviser, various years).
The state has also tried to develop a network of extension services for agriculturaldevelopment. Several programs, such as the National Extension Programme, the Pan-chayati Raj5, and the Community Development Programme, were introduced duringthe 1950s, and as a consequence, a hierarchy of trained agricultural extension workerswas created. The Punjab Agricultural University at Ludhiana has made a signal contri-bution in the development of new seed varieties and has been actively involved in theextension and training programs in the state.
A great deal of investment has also been made in education and health. Punjab,once educationally backward, now figures among the leading states in educationalfacilities at the school and university levels as well as in engineering and medicine.The state's literacy rate has also shown a sharp rise, though it lags far behind that ofKerala (Table 4).
Table 4—Educational facilities in rural Punjab, 1966-83
Level of Education
Primary
Middle
High and highersecondary
College
Year
196619771983196619771983
196619771983
196619771983
Rural Enrollment as aShare of Total EnrollmentMale
87.2487.5087.0582.8493.3480.6336.6966.5756.7618.5522.8022.01
Female
(percent)
81.5887.5886.0275.6791.1671.75
27.5760.9648.2912.0913.6113.80
Rural Shareof Total StateExpenditureon Education
96.7399.62
n.a.90.5497.67
n.a.66.4491.11
n.a.n.a.n.a.n.a.
Sources: Based on data from Punjab, Educational Statistics of Punjab, Publication No. 333 (Chandigarh: Economicand Statistical Organization, n.d.), 116119, 130-131, 146-147; and personal visits to the Directorateof Public Instruction, Chandigarh.
Note: n.a. means not available.
5 A traditional system of self-government in Indian villages. The panchayat (village council) runs the routineaffairs of the village and settles many local disputes. Soon after independence the panchayats were givenmany additional statutory powers in matters pertaining to local development.
21
Agricultural Price PolicyAnother important factor in the rapid growth of agriculture in India, and particularly
in Punjab, is the existence of a favorable price climate since the establishment of theAgricultural Price Commission in the mid-1960s. The commission, by its terms ofreference, is expected to recommend prices for agricultural commodities that are remun-erative to the cultivators and give them sufficient incentive to invest in new technology.
Most studies have shown that the minimum support prices fixed by the governmenton the recommendations of the commission were indeed remunerative. The establish-ment of the Food Corporation of India, which is required to undertake purchases ofthe entire market arrival of foodgrains at the minimum support prices, and the creationof market and transport infrastructure provided the assurance needed to persuadefarmers to invest in new technology and thereby augment production. The Punjabfarmers were the major beneficiaries of the new price policy, as they brought largesurpluses of (first) wheat and (later) rice into the market and were able to obtainprofitable prices for these and other commodities.
Political Clout of Prosperous PeasantryIn Punjab, unlike many other states in India, political power has shifted decisively
from the urban trading and money-lending bourgeoisie to the prosperous rural peasantrysince independence. Irrespective of their political affiliation, each successive stategovernment in Punjab has taken positive policy measures to further the interests ofthis section of the population. These include the rural bias in planned expenditure oninfrastructure; provision of essential inputs such as water and power at highly subsidizedrates; stabilization of agricultural prices; availability of cheap loans both directly andthrough the cooperatives; provision of inputs such as fertilizers, better seeds, andinsecticides; and the organization of agricultural research and extension.
Given this infrastructure, and offered opportunities to better their lot through theadoption of new techniques, the Punjab peasants accepted the challenges by takingthe necessary risks and brought about the agricultural breakthrough. The new technol-ogy was first adopted by large landholders who had the initial wherewithal and capacityto take risks, but was soon extended to peasants with smaller holdings. The profitabilityof the new technology prompted cultivators to make large investments in tubewellsand complimentary irrigation structures in a bid to reap the technological benefits.This investment was facilitated by the availability of large amounts of subsidized institu-tional credit that greatly complimented the farmers' own resources.
To sum up, the Punjab has built a developed rural infrastructure over the years outof its own and central resources. In fact, the state had succeeded in creating therequisite infrastructure before full modernization commenced in the late 1960s. Theavailability of this well-developed infrastructural base, in conjunction with the appropri-ate institutional framework and a positive agricultural price policy, provides the mostconvincing explanation for the rapid growth of agriculture in Punjab through adoptionof the new seed-fertilizer technology.
Modern Inputs and Increasing MechanizationAlong with the use of high-yielding varieties of seeds, the rapid expansion of
fertilizer application since 1965/66 is a crucial ingredient of the new technology.Fertilizer use per hectare of cropped area increased from a mere 8.8 kilograms in1965/66 to 37.6 kilograms in 1970/71 and 149.4 kilograms in 1984/85. The fertilizersare used predominantly for wheat and rice.
22
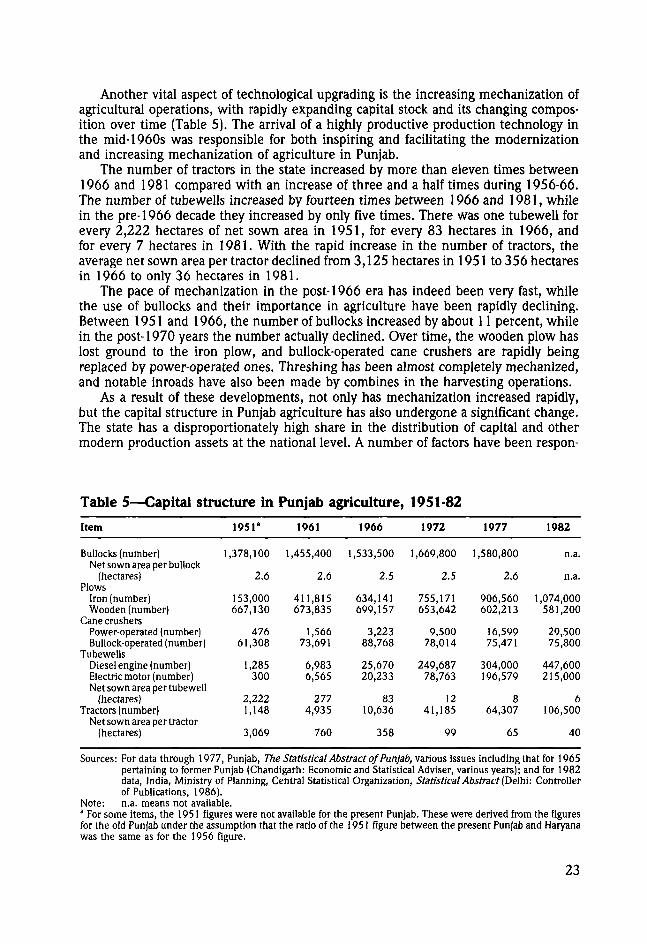
Another vital aspect of technological upgrading is the increasing mechanization ofagricultural operations, with rapidly expanding capital stock and its changing compos-ition over time (Table 5). The arrival of a highly productive production technology inthe mid-1960s was responsible for both inspiring and facilitating the modernizationand increasing mechanization of agriculture in Punjab.
The number of tractors in the state increased by more than eleven times between1966 and 1981 compared with an increase of three and a half times during 1956-66.The number of tubewells increased by fourteen times between 1966 and 1981, whilein the pre-1966 decade they increased by only five times. There was one tubewell forevery 2,222 hectares of net sown area in 1951, for every 83 hectares in 1966, andfor every 7 hectares in 1981. With the rapid increase in the number of tractors, theaverage net sown area per tractor declined from 3,125 hectares in 1951 to 356 hectaresin 1966 to only 36 hectares in 1981.
The pace of mechanization in the post-1966 era has indeed been very fast, whilethe use of bullocks and their importance in agriculture have been rapidly declining.Between 1951 and 1966, the number of bullocks increased by about 11 percent, whilein the post-1970 years the number actually declined. Over time, the wooden plow haslost ground to the iron plow, and bullock-operated cane crushers are rapidly beingreplaced by power-operated ones. Threshing has been almost completely mechanized,and notable inroads have also been made by combines in the harvesting operations.
As a result of these developments, not only has mechanization increased rapidly,but the capital structure in Punjab agriculture has also undergone a significant change.The state has a disproportionately high share in the distribution of capital and othermodern production assets at the national level. A number of factors have been respon-
Table 5—Capital structure in Punjab agriculture, 1951-82
Item
Bullocks (number)Net sown area per bullock
(hectares)Plows
Iron (number)Wooden (number)
Cane crushersPower-operated (number)Bullock-operated (number)
' 1 * • 1^ rti • j n l i e
i uuewciid
Diesel engine (number)Electric motor (number)Net sown area per tubewell
(hectares)Tractors (number)
Net sown area per tractor(hectares)
1951"
1,378,100
2.6
153,000667,130
47661,308
1,285300
2,2221,148
3,069
1961
1,455,400
2.6
411,815673,835
1,56673,691
6,9836,565
2774,935
760
1966
1,533,500
2.5
634,141699,157
3,22388,768
25,67020,233
8310,636
358
1972
1,669,800
2.5
755,171653,642
9,50078,014
249,68778,763
1241,185
99
1977
1,580,800
2.6
906,560602,213
16,59975,471
304,000196,579
864,307
65
1982
n.a.
n.a.
1,074,000581,200
29,50075,800
447,600215,000
6106,500
40
Sources: For data through 1977, Punjab, The Statistical Abstract of Punjab, various issues including that for 1965pertaining to former Punjab (Chandigarh: Economic and Statistical Adviser, various years); and for 1982data, India, Ministry of Planning, Central Statistical Organization, Statistical Abstract (Delhi: Controllerof Publications, 1986).
Note: n.a. means not available.a For some items, the 1951 figures were not available for the present Punjab. These were derived from the figuresfor the old Punjab under the assumption that the ratio of the 1951 figure between the present Punjab and Haryanawas the same as for the 1956 figure.
23
sible for the rapid mechanization of agriculture in Punjab. The spurt in tubewell instal-lation was caused by the need to increase and regulate the flow of irrigation to permitadoption of the highly profitable new technology in wheat and rice. The drive towardmechanization was necessitated mainly by the relative scarcity of labor (due to the lowman-land ratio in the state) and high wage rates, particularly during peak agricultural•operations. In the post-1966 years the spurt in tractors was caused by the need forboth timely completion of field crop operations and relief from the pressure on labordemand. Tractors were also increasingly used for transport purposes and soon becamea status symbol, driving quite a few medium and even small farmers to purchase oneregardless of the size of their holding. Large-scale investment in tubewells and otherfarm mechanization was facilitated partly by ready availability of subsidized institutionalcredit and partly through remittances from abroad.
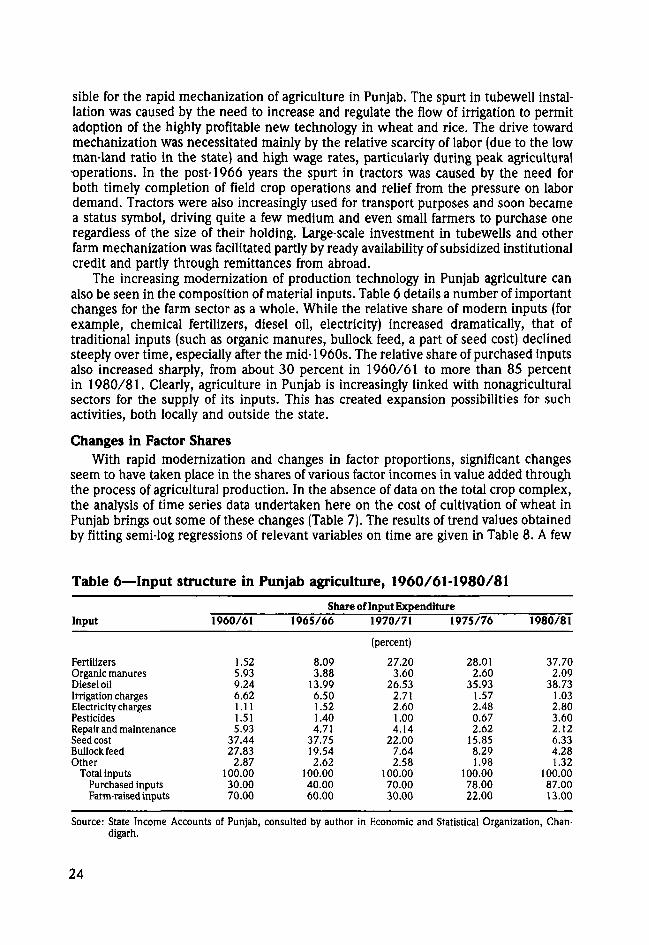
The increasing modernization of production technology in Punjab agriculture canalso be seen in the composition of material inputs. Table 6 details a number of importantchanges for the farm sector as a whole. While the relative share of modern inputs (forexample, chemical fertilizers, diesel oil, electricity) increased dramatically, that oftraditional inputs (such as organic manures, bullock feed, a part of seed cost) declinedsteeply over time, especially after the mid-1960s. The relative share of purchased inputsalso increased sharply, from about 30 percent in 1960/61 to more than 85 percentin 1980/81. Clearly, agriculture in Punjab is increasingly linked with nonagriculturalsectors for the supply of its inputs. This has created expansion possibilities for suchactivities, both locally and outside the state.
Changes in Factor SharesWith rapid modernization and changes in factor proportions, significant changes
seem to have taken place in the shares of various factor incomes in value added throughthe process of agricultural production. In the absence of data on the total crop complex,the analysis of time series data undertaken here on the cost of cultivation of wheat inPunjab brings out some of these changes (Table 7). The results of trend values obtainedby fitting semi-log regressions of relevant variables on time are given in Table 8. A few
Table 6—Input structure in Punjab agriculture, 1960/61-1980/81
Share of Input ExpenditureInput
FertilizersOrganic manuresDiesel oilIrrigation chargesElectricity chargesPesticidesRepair and maintenanceSeed costBullock feedOther
Total inputsPurchased inputsFarm-raised inputs
Source: State Income Accounts of Punjab, consulted by author in Economic and Statistical Organization, Chan-digarh.
24
1960/61
1.525.939.246.621.111.515.93
37.4427.832.87
100.0030.0070.00
1965/66
8.093.8813.996.501.521.404.71
37.7519.542.62
100.0040.0060.00
1970/71
(percent)
27.203.60
26.532.712.601.004.14
22.007.642.58
100.0070.0030.00
1975/76
28.012.60
35.931.572.480.672.6215.858.291.98
100.0078.0022.00
1980/81
37.702.09
38.731.032.803.602.126.334.281.32
100.0087.0013.00
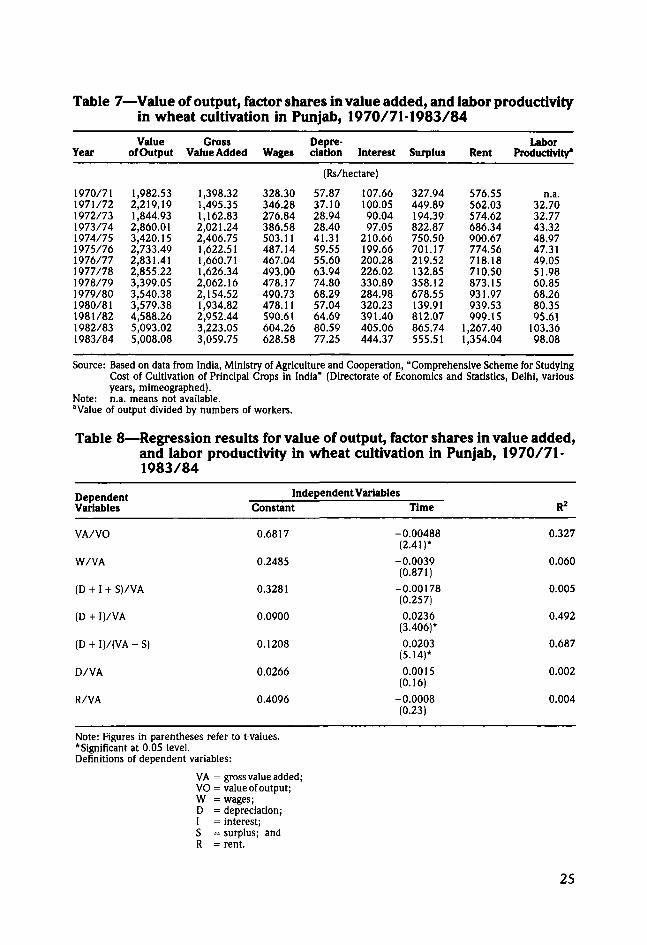
Table 7—Value of output, factor shares in value added, and labor productivityin wheat cultivation in Punjab, 1970/71-1983/84
Year
1970/711971/721972/731973/741974/751975/761976/771977/781978/791979/801980/811981/821982/831983/84
Valueof Output
1,982.532,219.191,844.932,860.013,420.152,733.492,831.412,855.223,399.053,540.383,579.384,588.265,093.025,008.08
GrossValue Added
1,398.321,495.351,162.832,021.242,406.751,622.511,660.711,626.342,062.162,154.521,934.822,952.443,223.053,059.75
Wages
328.30346.28276.84386.58503.11487.14467.04493.00478.17490.73478.11590.61604.26628.58
Depre-ciation Interest
(Rs/hectare)
57.8737.1028.9428.4041.3159.5555.6063.9474.8068.2957.0464.6980.5977.25
107.66100.0590.0497.05
210.66199.66200.28226.02330.89284.98320.23391.40405.06444.37
Surplus
327.94449.89194.39822.87750.50701.17219.52132.85358.12678.55139.91812.07865.74555.51
Rent
576.55562.03574.62686.34900.67774.56718.18710.50873.15931.97939.53999.15
1,267.401,354.04
LaborProductivity*
n.a.32.7032.7743.3248.9747.3149.0551.9860.8568.2680.3595.61
103.3698.08
Source: Based on data from India, Ministry of Agriculture and Cooperation, "Comprehensive Scheme for StudyingCost of Cultivation of Principal Crops in India" (Directorate of Economics and Statistics, Delhi, variousyears, mimeographed).
Note: n.a. means not available.aValue of output divided by numbers of workers.
Table 8—Regression results for value of output, factor shares in value added,and labor productivity in wheat cultivation in Punjab, 1970/71-1983/84
DependentVariables
Independent VariablesConstant Time R2
VA/VO
W/VA
(D + I + S)/VA
(D + I)/VA
(D
D/VA
R/VA
0.6817
0.2485
0.3281
0.0900
0.1208
0.0266
0.4096
-0.00488(2.41)*
-0.0039(0.871)
-0.00178(0.257)0.0236(3.406)*
0.0203(5.14)*
0.0015(0.16)
-0.0008(0.23)
0.327
0.060
0.005
0.492
0.687
0.002
0.004
Note: Figures in parentheses refer to t-values.* Significant at 0.05 level.Definitions of dependent variables:
VA = gross value added;VO = value of output;W = wages;D = depreciation;I = interest;S = surplus; andR = rent.
25
conclusions can be drawn. First, value added as a proportion of value of output hasshown a declining trend that is statistically significant. This tends to confirm that, whilethe share of intermediate inputs in the value of output has increased, the share ofvalue added has notably declined.
Second, as expected, the share of interest and depreciation in value added hasshown an increasing trend, and the result is statistically significant.
Third, no firm conclusions can be drawn concerning the share of wages in valueadded. Although the regression equation has the expected negative sign, the result isstatistically insignificant. Furthermore, with increased labor productivity, a correspond-ing increase in wage rates over time would have been expected. Nominal wage rates,when regressed on the money value of wheat output per worker (labor productivity)from 1971 /72 to 1983/84, give the following equation (figure in parentheses is t-value):
log (wages) = 55.04 + 0.51 (labor productivity); (1)(5.98)
R2 = 0.765.
The relationship between the two variables is quite significant and the value of theregression coefficient is 0.51. Accordingly, the growth rate of wages constitutes only51 percent of the growth rate of labor productivity in the case of wheat.
Finally, there does not seem to be any significant change in the share of rent invalue added. In fact, the regression coefficient has a negative sign and the value ishighly insignificant.
Sharing the Gains of the Green RevolutionThe above results are important in explaining the emerging changes in factor shares
along with changes in the structure of production, but these do not indicate thedistribution of gains of new technology among various categories of cultivators andlandless labor. Unfortunately, no up-to-date secondary data or studies exist on incomedistribution among various sections of the peasantry in Punjab.
As far back as 1975/76, an empirical study was conducted on the impact of thegreen revolution on income generation and income distribution and on the standardof living of various categories of cultivator households (Bhalla and Chadha 1983).Another study on the income levels of landless labor households refers to the sameyear (Singh 1986). Based on these studies, some broad generalizations can be madeon income distribution in Punjab.
It is generally agreed that a higher growth rate in agriculture tends to reduce ruralpoverty. The available data show that the state of Punjab, which has had a highagricultural growth rate over a long period, has the lowest poverty ratio among themajor states of India (Table 9). The gains from the new technology seem to have trickleddown to all sections of the rural population. However, since these gains are distributedmore or less in proportion to the initial landholding position, and the landholdingdistribution is very skewed, the distribution of gains has been quite inequitable. Interms of production efficiency, the marginal and small farmers in the state, despitetheir limited land base, have a total crop output and farm business income per unit ofarea that is almost as large as those of the larger farmers. This is because their techno-logical level is nearly as good and they make optimum use of surplus family labor. Theyare also able to supplement their earnings with wage and other income from nonagricul-tural occupations. In spite of this, many of them are still living below the poverty line.Although there is evidence to suggest that landless labor has also shared somewhat in
26
Andhra PradeshBiharGujaratHaryanaKarnatakaKeralaMadhya PradeshMaharashtraOrissaPunjabRajasthanTamil NaduUttar PradeshWest Bengal
All India
41.0059.0043.80
b
47.2062.0052.9046.6065.0023.6041.8057.3040.6070.1049.10
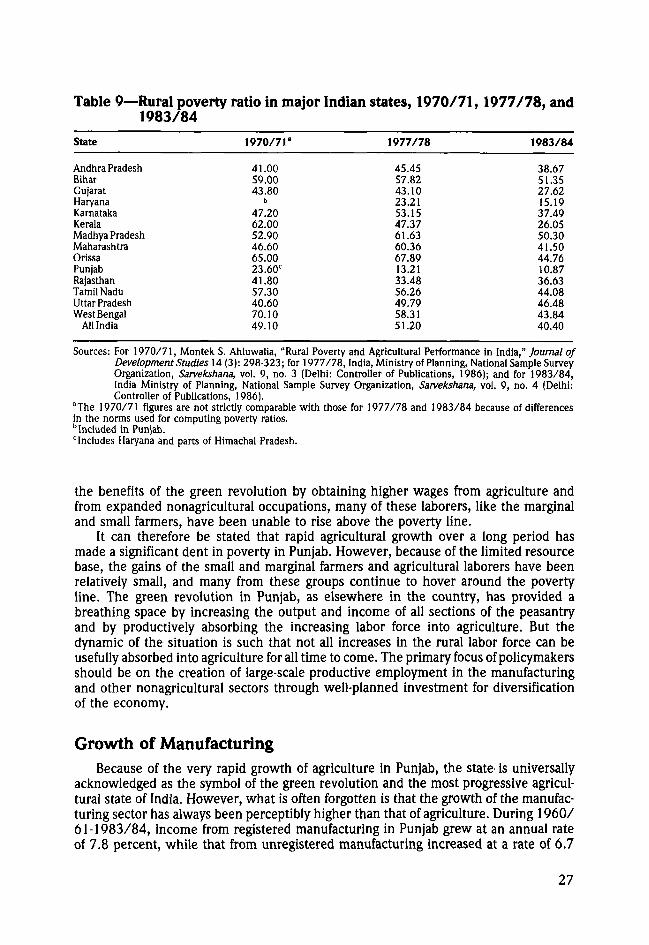
Table 9—Rural poverty ratio in major Indian states, 1970/71,1977/78, and1983/84
State 1970/71" 1977/78 1983/84
45.45 38.6757.82 51.3543.10 27.6223.21 15.1953.15 37.4947.37 26.0561.63 50.3060.36 41.5067.89 44.7613.21 10.8733.48 36.6356.26 44.0849.79 46.4858.31 43.8451.20 40.40
Sources: For 1970/71, Montek S. Ahluwalia, "Rural Poverty and Agricultural Performance in India," Journal ofDevelopment Studies 14 (3): 298-323; for 1977/78, India, Ministry of Planning, National Sample SurveyOrganization, Sarvekshana, vol. 9, no. 3 (Delhi: Controller of Publications, 1986); and for 1983/84,India Ministry of Planning, National Sample Survey Organization, Sarveksnana, vol. 9, no. 4 (Delhi:Controller of Publications, 1986).
aThe 1970/71 figures are not strictly comparable with those for 1977/78 and 1983/84 because of differencesin the norms used for computing poverty ratios.b Included in Punjab.includes Haryana and parts of Himachal Pradesh.
the benefits of the green revolution by obtaining higher wages from agriculture andfrom expanded nonagricultural occupations, many of these laborers, like the marginaland small farmers, have been unable to rise above the poverty line.
It can therefore be stated that rapid agricultural growth over a long period hasmade a significant dent in poverty in Punjab. However, because of the limited resourcebase, the gains of the small and marginal farmers and agricultural laborers have beenrelatively small, and many from these groups continue to hover around the povertyline. The green revolution in Punjab, as elsewhere in the country, has provided abreathing space by increasing the output and income of all sections of the peasantryand by productively absorbing the increasing labor force into agriculture. But thedynamic of the situation is such that not all increases in the rural labor force can beusefully absorbed into agriculture for all time to come. The primary focus of policymakersshould be on the creation of large-scale productive employment in the manufacturingand other nonagricultural sectors through well-planned investment for diversificationof the economy.
Growth of ManufacturingBecause of the very rapid growth of agriculture in Punjab, the state is universally
acknowledged as the symbol of the green revolution and the most progressive agricul-tural state of India. However, what is often forgotten is that the growth of the manufac-turing sector has always been perceptibly higher than that of agriculture. During 1960/61-1983/84, income from registered manufacturing in Punjab grew at an annual rateof 7.8 percent, while that from unregistered manufacturing increased at a rate of 6.7
27

percent. During this period the growth rate of income from manufacturing in India asa whole was only 4.3 percent. Because of its significantly higher growth, Punjab canno longer be considered relatively backward in industrialization. In 1961, with percapita value added in the factory sector amounting to only Rs 4, the state ranked lowestin the level of industrialization among the 14 major states of India. By 1981, per capitavalue added in the factory sector had increased to Rs 136 (at current prices), and thestate ranked seventh in industrialization. By 1985/86, Punjab had further improvedits position to fifth place (India, Ministry of Planning, various years [c]).
The nature and composition of manufacturing has undergone a notable change,especially since the advent of the green revolution in the mid-1960s. The 1960switnessed a phase of rapid agro-industrialization, and the output of small units manufac-turing agricultural tools and implements showed particularly fast growth in responseto mounting demand from rapidly growing agriculture. In addition, the increase inrural income led to much higher demand for consumption goods. Consequently, manysmall-scale consumer goods industries came into being. The agro-industries manufactur-ing agricultural implements and machine tools, fertilizers, pipes and fittings, and auto-mobile parts, and the processing industries such as cotton textiles, sugar, wheat flour,and rice-shelling grew continuously over the 1960/61-1983/84 period. Village indus-tries such as the processing of cereals and pulses, gar (brown sugar), and khandsari(coarse sugar); oil extraction; pottery; soap; lime; fiber and leather; carpentry; andblacksmithing also showed varying degrees of growth. Another area of rapid develop-ment was repair and maintenance activities.
Over time these small-scale units developed into medium- and large-scale units inmany instances. With the establishment of some new large industries such as fertilizers,electronics, and tractors in the public sector, and the expansion of the private sectorin textiles and hosiery because of export demand, many consumer goods industries inthe registered sector also started to grow rapidly.
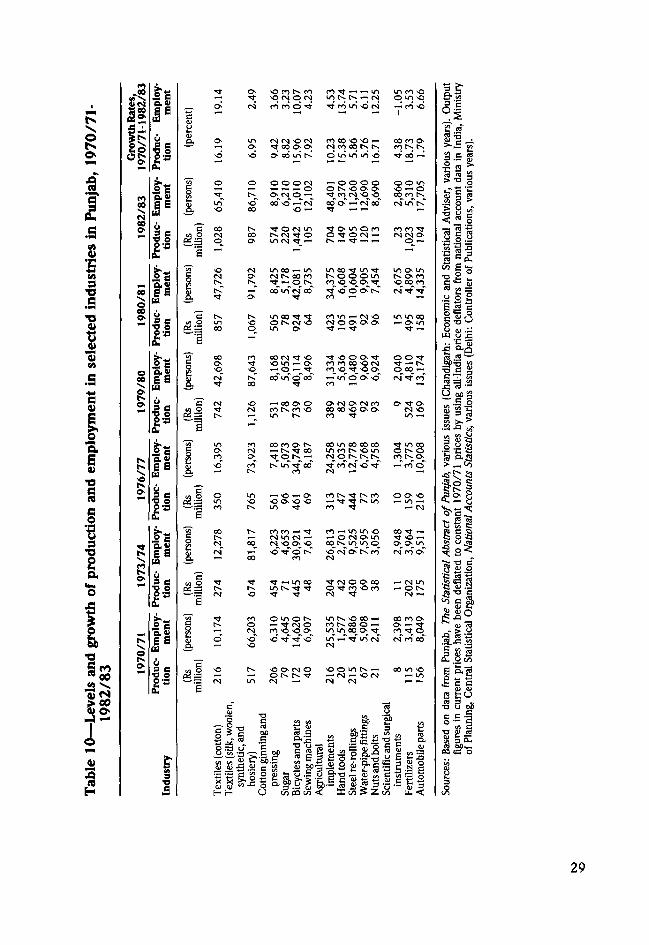
Within the manufacturing sector, detailed data on output and employment areavailable for the registered industries only. (Under the Indian Factories Act of 1948,a registered industry is defined as any premises or precincts thereof where 10 or moreworkers work with the aid of power or where 20 or more workers work withoutpower.) Table 10 gives data on the levels and growth of output and employment inselected industries of Punjab. The data on output provided by the state Economic andStatistical Organization has been deflated at constant 1970/71 prices by using appro-priate indexes of prices. It is clear from the table that cotton textiles, the largest industryin the state, recorded a very high rate of growth in both output and employment during1970/71-1982/83. Apart from catering to domestic demand from Punjab and otherstates, textiles in general, and hosiery goods in particular, have found a profitableexport market, especially in the Soviet Union.
Besides textiles, many durable consumer goods industries such as bicycles, sewingmachines, and television sets, and agro-input industries such as fertilizers, agriculturalimplements, and hand tools have shown remarkable growth in output and employment.The respective growth rates of employment and production given in Table 10 showthat the employment elasticity with respect to output is quite high for a wide rangeof industries, particularly for cotton textiles, steel re-rolling, and automobile parts.
To a large extent, rapid growth and gradual modernization in manufacturing (as inagriculture) have been made possible by rapid development of the power sector, whichshowed a growth rate of 9.1 percent ayear in net value added during 1967/68-1983/84.As noted earlier, from the beginning of planning in 1950/51, Punjab has given very
28
— *-* in ino in NO
i NO' c-j —' co' NO
I ( S N -O <••)Tf 00 O- O
n oo -o NO —NMOONN
ooomt-.
BOO.rotNtNTJ 00 —
CO
•jONifl t c m o co co co TTS(N)NtO O ^ O f N l - CM CM O-tn CM •sr *— r^ *— ^t —< ~ - o —
00
IOt
in oo i—' m?s rv. oo ro
rs, ^" ^H o f**«--' oo'irTc^oo*
m o int ^ ON roNO 00 CO
m oo ^- nONNOm o-
ro in »— f ^ o inw>coNO o o> o ^-om
o-o
es -q- oin — o-
^ O O O tCO CO CO NO PN]ro NO Tt NO O -
aI 3NO " O O OCNJ ro tv co N— in r^
O PNI ON r<)coCO CO NO O- O-co •**
ONI N O
m —
isS. 2
co co ON tv^- c^ r t oo
oo in co oo com co tv-o m
3 ON S O
-m
—"co'cT
I1 tsfO 0 0>>0
sr co co —* ^t^- cs in (N ~-CO CNl N O O N N O
co — m m NO co •* —— o c s o - m "JNO —•- • o-_o-_m
CM" CO"ON"
tso •-HlflOO •^•(SJOONCO ^-
)CxrtTf O ^ C O N O C O ~
<>5 c
O N
& 2
,203
66,
517
owios— Tt rN) oCO NO NO ON
-o-xt M;NO
NO ON CN) O
CM —
,535
,577
,886
,908
,411
i n - •<]• m o
NO o m tv —
CM O)
,398
,413
,049
CM CO 0 0
co m o^- in
2 I
DS
29
high priority to investment in power. From two-thirds to three-fourths of the total planoutlay in all the plan periods has gone to power and irrigation.
The estimates of net value added in construction have been thoroughly revised forall the years after 1970/71 by the state Economic and Statistical Organization? Theannual growth rate of net value added by construction was about 5.0 percent during1970/71-1983/84.
It can be legitimately argued that given the high growth of agriculture in Punjab,the growth of manufacturing in the state has fallen considerably short of expectedlevels. To some extent the growth rate may appear understated when calculated forvalue added and not value of output. An annual growth rate of about 7 percent forvalue added in manufacturing (as in Table 1) may imply a growth rate of about 9-10percent in value of output. However, even this order of manufacturing growth couldnot be considered consistent with the agricultural growth recorded in the state.
A few reasons can be advanced for manufacturing growth lagging behind expecta-tions. The first is import leakages. As will be discussed in detail, Punjab's economy islinked with the rest of the country. This has enabled the state to derive a great dealof comparative advantage through specialization, both in certain crops and in somemanufacturing lines. However, historically determined regional distribution of manufac-turing capacities, particularly in agroprocessing and agro-input industries, often doesnot conform with present patterns of agricultural output.
Second, because of the extraordinary increase in output in many cases, the existingprocessing capacities fall far short of requirements. Sufficient investment has not beenundertaken to increase processing capacities, particularly in new areas that have recentlystarted to produce substantial marketable surpluses. Both these factors have militatedagainst a rapid rise of manufacturing in the state. In particular, lack of sufficientinvestment in agroprocessing seems to have acted as a major constraint. For example,as of January 1, 1983, with a 16.2 percent share in the production of raw cotton,Punjab had only 1.7 percent of all installed spindles and 0.6 percent of all looms inIndia. With 21.4 percent of wheat output and a 62.0 percent share in wheat procuredby the Food Corporation of India, the state had merely 5.8 percent of the roller flourmill capacity in the country. With the recent development of a new variety (COJ 64),Punjab has emerged as one of the most efficient producers of sugarcane, but with 3.4percent of total cane output, the state had only 1.8 percent of the national capacity forcane conversion. Thus lack of investment in agroprocessing seems to be one importantreason for the slower-than-expected growth rate of manufacturing.
Other reasons are perhaps sociological. It takes a long time for peasant societies toswitch over to the regular rhythm and discipline of industrial culture. Also, the tensionsin Punjab during the 1980s have certainly resulted in further reducing industrialinvestments in the state and in driving away prospective entrepreneurs.
Changes in the Tertiary SectorFrom 1960/61 to 1983/84, while income from the tertiary sector as a whole
recorded an annual growth rate of 6.8 percent, that from trade and transport grew ata rate of more than 6.5 percent, banking and insurance at 8.1 percent, and public
6 The estimate of net product from construction rose from Rs 440 million in 1969/70 to Rs 960 millionin 1970/71. Since these series were not carried back to the 1960s, the growth rates for 1960/61 -1983/84calculated from available data can be misleading.
30
administration at 8.6 percent. Growth of the tertiary sector is an essential concomitantof a growing economy. For example, the rapid growth of trade and transport is inresponse to marked increases in marketed agricultural surpluses, much larger activityin agroprocessing and agro-input industries, and increased flow of exports and imports.
Of particular interest in this context is the role of small market villages and townsthat lie on main roads connecting larger townships. These villages and towns havegradually become hubs of economic activity, not only in trading and agroprocessingand repairs but also in the provision of social services, health, and recreation. In manycases they have emerged as tiny growth centers serving a network of peripheral villages.The rapid growth of trade, hotels and restaurants, and personal services is in responseto increased consumption expenditure. Government and private expenditure on educa-tion, health, and other services is also rising rapidly. Rapid growth of public adminis-tration is primarily due to the growing role of the state in the development process aswell as the excessive overstaffing characteristic of developing countries.
31

METHOD OF COMPILATION ANDSOURCES OF DATA
The Punjab input-output table for the year 1969/70, which was published in astudy on Punjab, Haryana, and Gujarat (Alagh, Bhalla, and Kashyap 1980), contains anelaborate account of the method of compilation of the interindustry table and thesources of data, including the sectorization scheme, the limitations of the data, andthe various improvisations made by the authors. In view of this, instead of giving fulldetails, only a brief description of the methodology used to compile the 1979/80input-output table (Appendix 1, Table 44) and its sources of data is contained in thepresent report.
Compilation of Input-Output TableThe first step in the preparation of the 1979/80 input-output table was the sector-
ization of the economic activities in Punjab, with the main aim of having as detailedand meaningful a picture of the economy as possible within the framework of availabledata. In this table the state economy is divided into 39 sectors, compared with 36sectors in the 1969/70 table. A description of the sector scheme of the 1979/80 table,along with a comparative sector scheme used in 1969/70, is given in Table 11. Adetailed description of activities included in each sector is provided in Appendix 2.
Several features of the sector scheme are worth noting. First, since agricultureconstitutes a major part of the economy, it has been subdivided into seven sectorscontaining the main crops in the state. The 1969/70 table had nine sectors for agricul-ture. However, since baj'ra (pearl millet) and maize have ceased to be important cropsin the state, they have been combined with other agriculture and forestry in the1979/80 table.
Second, in the 1969/70 table, separate vectors were constructed for the ordinaryand improved varieties of wheat, rice, cotton, and maize, but that has not been donein the 1979/80 table, primarily because by 1979/80 almost the entire area underwheat, rice, and cotton had been brought under improved varieties.
Third, an important feature of the 1979/80 table is that trade, transport and storage,services, banking and insurance, and ownership of dwellings, which were put belowthe line in the earlier table, are treated as independent sectors in the structural matrix.This was done because these sectors have assumed considerable importance with thegrowth of the economy.
Fourth, another important feature of the 1979/80 table is that, compared with1969/70, much better estimates have been made of exports and imports. Althoughthe Railways Board regularly publishes data on interstate movement of commoditiesby rail (India, Ministry of Railways), data on interstate movement of commodities byroad became available for the first time for 1978/79 as a result of a special surveyconducted by the Railways India Technical and Economic Services (RITES). The unpub-lished data, obtained from RITES, have been updated for the present study to derivethe export and import vectors for 1979/80.
32
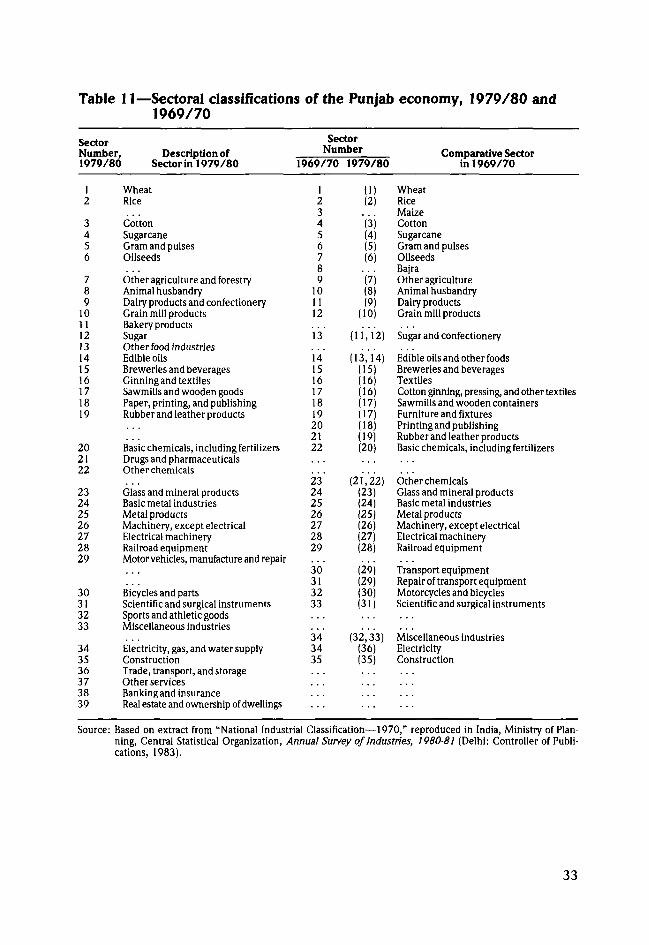
Table 11—Sectoral classifications of the Punjab economy, 1979/80 and1969/70
SectorNumber,1979/80
12
3456
789
10111213141516171819
202122
23242526272829
30313233
343536373839
Description ofSector in 1979/80
WheatRice
CottonSugarcaneGram and pulsesOilseeds
Other agriculture and forestryAnimal husbandryDairy products and confectioneryGrain mill productsBakery productsSugarOther food industriesEdible oilsBreweries and beveragesGinning and textilesSawmills and wooden goodsPaper, printing, and publishingRubber and leather products
Basic chemicals, including fertilizersDrugs and PharmaceuticalsOther chemicals
Glass and mineral productsBasic metal industriesMetal productsMachinery, except electricalElectrical machineryRailroad equipmentMotor vehicles, manufacture and repair
Bicycles and partsScientific and surgical instrumentsSports and athletic goodsMiscellaneous industries
Electricity, gas, and water supplyConstructionTrade, transport, and storageOther servicesBanking and insuranceReal estate and ownership of dwellings
1Sector
Number1969/70 1979/80
123456789
101112
13
141516171819202122
23242526272829
30313233
343435
(1)(2)
'(3)(4)(5)(6)
"(7)(8)(9)
(10)
(11,' 12)
(13,'l4)(15)(16)(16)(17)(17)(18)(19)(20)
(21,22)(23)(24)(25)(26)(27)(28)
(29)(29)(30)(31). . .
(32,33)(36)(35)
Comparative Sectorin 1969/70
WheatRiceMaizeCottonSugarcaneGram and pulsesOilseedsBajraOther agricultureAnimal husbandryDairy productsGrain mill products
Sugar and confectionery
Edible oils and other foodsBreweries and beveragesTextilesCotton ginning, pressing, and other textilesSawmills and wooden containersFurniture and fixturesPrinting and publishingRubber and leather productsBasic chemicals, including fertilizers
Other chemicalsGlass and mineral productsBasic metal industriesMetal productsMachinery, except electricalElectrical machineryRailroad equipment
Transport equipmentRepair of transport equipmentMotorcycles and bicyclesScientific and surgical instruments
Miscellaneous industriesElectricityConstruction
Source: Based on extract from "National Industrial Classification—1970," reproduced in India, Ministry of Plan-ning, Central Statistical Organization, Annual Survey of Industries, 1980-81 (Delhi: Controller of Publi-cations, 1983).
33
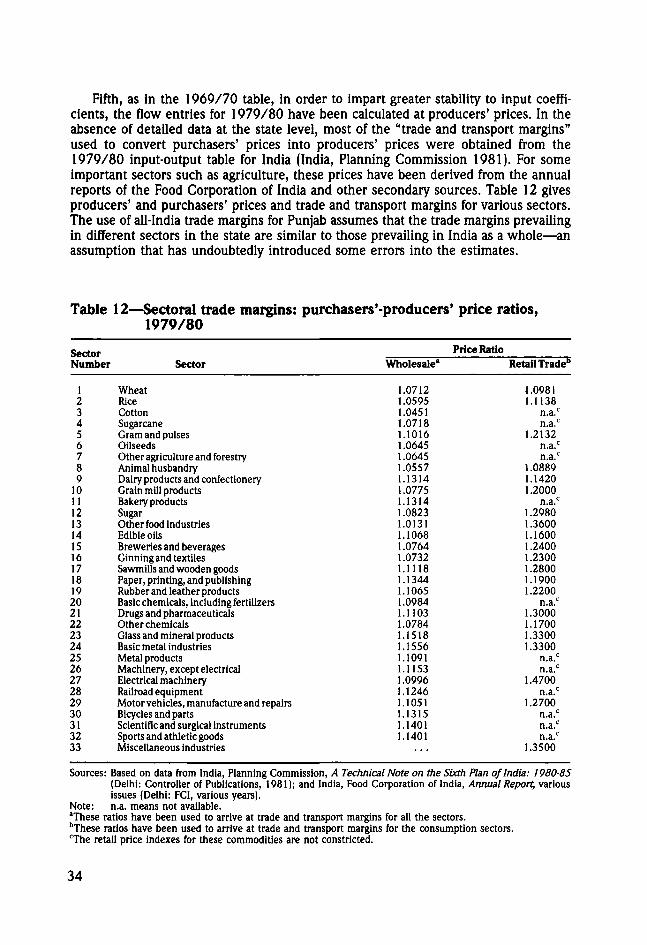
Fifth, as in the 1969/70 table, in order to impart greater stability to input coeffi-cients, the flow entries for 1979/80 have been calculated at producers' prices. In theabsence of detailed data at the state level, most of the "trade and transport margins"used to convert purchasers' prices into producers' prices were obtained from the1979/80 input-output table for India (India, Planning Commission 1981). For someimportant sectors such as agriculture, these prices have been derived from the annualreports of the Food Corporation of India and other secondary sources. Table 12 givesproducers' and purchasers' prices and trade and transport margins for various sectors.The use of all-India trade margins for Punjab assumes that the trade margins prevailingin different sectors in the state are similar to those prevailing in India as a whole—anassumption that has undoubtedly introduced some errors into the estimates.
Table 12—Sectoral trade margins: purchasers'-producers' price ratios,1979/80
SectorNumber
123456789
101112131415161718192021222324252627282930313233
Sector
WheatRiceCottonSugarcaneGram and pulsesOilseedsOther agriculture and forestryAnimal husbandryDairy products and confectioneryGrain mill productsBakery productsSugarOther food industriesEdible oilsBreweries and beveragesGinning and textilesSawmills and wooden goodsPaper, printing, and publishingRubber and leather productsBasic chemicals, including fertilizersDrugs and PharmaceuticalsOther chemicalsGlass and mineral productsBasic metal industriesMetal productsMachinery, except electricalElectrical machineryRailroad equipmentMotor vehicles, manufacture and repairsBicycles and partsScientific and surgical instrumentsSports and athletic goodsMiscellaneous industries
Wholesale*
1.07121.05951.04511.07181.10161.06451.06451.05571.13141.07751.13141.08231.01311.10681.07641.0732.1118
1.1344.1065
1.09841.1103.0784.1518.1556.1091.1153.0996.1246.1051.1315.1401.1401
Price RatioRetail Trade"
1.09811.1138
n.a.c
n.a.c
1.2132n.a.c
n.a.c
1.08891.14201.2000
n.a.c
1.29801.36001.16001.24001.23001.28001.19001.2200
n.a.c
1.30001.17001.33001.3300
n.a.c
n.a.c
1.4700n.a.c
1.2700n.a.c
n.a.c
n.a.c
1.3500
Sources: Based on data from India, Planning Commission, A Technical Note on the Sixth Plan of India: 1980-85(Delhi: Controller of Publications, 1981); and India, Food Corporation of India, Annual Report, variousissues (Delhi: FCI, various years).
Note: n.a. means not available.aThese ratios have been used to arrive at trade and transport margins for all the sectors.bThese ratios have been used to arrive at trade and transport margins for the consumption sectors.cThe retail price indexes for these commodities are not constricted.
34
Sources of DataLike the 1969/70 input-output table, the 1979/80 table has been compiled mainly
on the basis of secondary data. The only source of primary data was a survey ofunregistered urban industries conducted by the authors during this study to deriveinput-output coefficients for the unregistered small-scale units and for some unorganizedactivities in the tertiary sector. Most of the data for both the 1969/70 and 1979/80tables were obtained from the Economic and Statistical Organization of the Governmentof Punjab, particularly from the state income section of this organization. The dataprovided by this organization have been supplemented from numerous other secondarysources. A brief description of the sources of data is given below by sector.
Agricultural Sectors
In the 1979/80 input-output table (Appendix 1, Table 44), agriculture is brokeninto seven sectors: wheat, rice, cotton, sugarcane, gram and pulses, oilseeds, and otheragriculture and forestry. Detailed input vectors by crop have been prepared by usingthe data obtained from the Comprehensive Scheme on Cost of Cultivation of PrincipalCrops for Punjab compiled by the Directorate of Economics and Statistics, Ministry ofAgriculture, Government of India. Some of these data are published in reports of theAgricultural Prices Commission. After input coefficients for these crops were obtained,all the inputs were inflated by the estimates of outputs by crop (Punjab, Economic andStatistical Adviser, various years). The input figures by crop for major items such ascost of fertilizers, electricity charges, and cost of bullocks and implements were thenaggregated and adjusted by using as control figures the data on total inputs suppliedby the Economic and Statistical Adviser. Figures for value added for each included cropwere similarly kept within the control figures.
Animal HusbandryThe basic information on levels of output, value added, and input costs for animal
husbandry was obtained from the Punjab Economic and Statistical Adviser. Two majorchanges have been made for 1979/80 in calculating value added in this sector. First,unlike the method followed in the state income estimates, bullocks have been treatedas a part of the animal husbandry sector and not the agricultural sectors. Second, bothdepreciation of bullocks and the changes in their stock have been shown in the animalhusbandry sector. Depreciation of bullocks has been estimated from the data on com-prehensive cost of cultivation, while data on changes in their stock were obtained fromthe recent publications of the government (Punjab, Economic and Statistical Organiza-tion 1980b, 1980c, 1980d).
Industrial SectorsOf the 39 sectors in the 1979/80 Punjab input-output table, 24 pertain to industries
and public utilities. In India, the registered factories are covered under the FactoriesAct of 1948 and are required to submit detailed returns to the government containing,among other things, information on output, inputs, value added, workers, and wages.The data for both the census and the sample sectors are published, with some timelag, in the Annual Survey of Industries. For the registered factories in Punjab, therelevant data for 1979/80 were obtained from the Economic and Statistical Adviser.These have since been published (India, Ministry of Planning 1989).
35
Unregistered Industrial SectorsThe state income section of the Punjab Economic and Statistical Organization pre-
pares the value of output and value added estimates for the unorganized industries,classified according to the National Industrial Classification. Since these estimates referonly to value added and output, they cannot be used to prepare the input vectors forthe unregistered industries.
With the basic aim of obtaining input vectors for the unregistered industries, asurvey of 803 industrial units in 10 urban centers in Punjab was conducted by theauthors during 1982/83. The results obtained from this survey have been used toarrive at the input structure for most of the industries in the unregistered sector. Theseparate input-output vectors prepared for the registered and unregistered industrieshave been combined in the 1979/80 input-output table.
An important additional source of information on rural and urban household indus-tries was the 29th round (July 1974-June 1975) of the National Sample Survey Organi-zation on Survey of Self-Employment in Nonagricultural Enterprises (India, Ministry ofPlanning 1978). Although this survey does not give details of the input structure ofvarious household industries, it does contain useful information on the estimated num-ber of workers wholly or partly employed in household industries, including valueadded and wages per worker. Nevertheless, the unavailability of reliable data on theinput structure of the unregistered and household industries is a serious limitation onthe industrial statistics for Punjab.
Electricity and Water SupplyData on total output, value added, number of workers, and input structure were
obtained by analyzing the Statement of Accounts for 1979/80 and the AdministrationReport for 1979/80 of the Punjab State Electricity Board (Punjab, Electricity Board1980). It has been assumed that the Punjab share of hydroelectric power from BhakraDam is being produced within the state. Due to the unavailability of data, it was notpossible to include the input vector for the water-supply undertakings in Punjab.
Other SectorsThe Punjab Economic and Statistical Organization provides separate data on value
added in construction, trade, transport and storage, other services, banking and insur-ance, real estate and ownership of dwellings (Punjab, Economic and Statistical Adviser,various years). However, no details are available regarding their input structure. In the1979/80 Punjab input-output table, the input structure for each of these sectors hasbeen borrowed from the all-India input-output table for 1979/80 (India, PlanningCommission 1981).
Final DemandHousehold Consumption
The National Sample Survey Organization (NSSO) collects Information on consumerexpenditure through its various rounds. The expenditure estimates are given separatelyfor the rural and urban population of all the states for 21 aggregate commodity groupsand are also available at a disaggregated level for 321 commodities. The latest informa-tion available to the authors on consumption expenditure in Punjab pertains to calendaryear 1983. This was available from the 38th round of the National Sample Survey(India, Ministry of Planning 1986b). Similar information for 1977/78 was availablefrom the 32nd round (India, Ministry of Planning 1986a).
36
The task of the present study was to derive the per capita consumption expenditureand its composition for the year 1979/80. The per capita consumption figures for1977/78 given in the 32nd round of the National Sample Survey have been extrapolatedto estimate the per capita expenditure for 1979/80, while the 38th round data havebeen used to derive the share of consumption expenditure by commodity for 1979/80.
Several steps were involved and several adjustments became necessary to deriveper capita consumption expenditure for 1979/80 from the 1977/78 estimates. Thefirst step was to multiply the 1977/78 per capita estimated consumption expenditureof Rs 1,372.68 per month in rural households and Rs 1,256.48 per month in urbanhouseholds by the 1979/80 rural and urban population estimated by the authors. Atotal estimated consumption expenditure amounting to more than Rs 22.7 billion wasobtained for 1979/80 at per capita income levels and prices of 1977/78.
The second adjustment was made to take into account the increase in consumptionas a result of the increase in real per capita income since 1977/78. At constant 1970/71prices, between 1970/71 and 1983/84 real per capita income rose at an annual rateof 3.2 percent. Thus, assuming the income elasticity of consumption to be 0.7, totalconsumption for 1979/80 increased by 4.6 percent. After this adjustment, total con-sumption is nearly Rs 23.8 billion.
The above consumption estimates for 1979/80 were at 1977/78 prices. During1977/78-1979/80, the consumer price index for agricultural labor rose by 12 percentand that for nonmanual employees by 11.48 percent. Inflating the 1977/78 estimatesby 12 percent, an estimate of more than Rs 26.6 billion was obtained for total consump-tion in the state during 1979/80 at current prices.
The last adjustment was made by comparing the National Sample Survey consump-tion estimates with those of the Central Statistical Organization (CSO), Governmentof India. At the all-India level, the consumption estimates by the CSO were considerablyhigher than the consumption figures estimated by the NSSO. Thus, total 1977/78consumption as estimated by the CSO was 10.2 percent higher than that estimatedby the NSSO. In 1983/84 the NSSO estimates fell short of the CSO estimates by asmuch as 23.5 percent. Keeping in mind the gross underestimation of consumption bythe NSSO, the authors inflated their figure by about 10.0 percent (9.0 percent for ruraland 11.7 percent for urban households) and estimated the total consumption in Punjabduring 1979/80 at about Rs 29.2 billion. This consumption level gives an averagepropensity to consume of 63.4 percent in relation to GDP. In the 1969/70 input-outputtable the estimated average propensity to consume was about 61.1 percent.
The above adjustments were necessary because of the absence of direct estimatesof consumption by the Punjab Economic and Statistical Organization. The limitationsof the authors' consumption estimates should be kept in mind.
Government ConsumptionThe main source of statistics on the state government's current and capital expen-
diture is the Economic and Functional Classification of the Punjab Government Budgetfor 1979/80 (Punjab, Economic and Statistical Organization 1980a). That publication,however, does not contain a breakdown of expenditure on commodities according tothe sector classification used in this study. For 1969/70, the information on the inputstructure of the government sector was obtained from the Controller of Stores, Govern-ment of Punjab. In the 1979/80 input-output table, distribution of current expenditurehas been done according to the 1969/70 table. In addition, the details about currentand capital expenditures of the municipalities and local bodies were obtained from theEconomic and Functional Classification of the Municipal Budget in Punjab for 1980/81
37
(Punjab, Economic and Statistical Organization 1981). Since the value added in thegovernment sector, amounting to more than Rs 2 billion, has been included in theservice sector, this figure is not shown separately under government consumption.
Gross Fixed Capital FormationThe available information on gross fixed capital formation is not very comprehensive.
For the registered industries, detailed data on investment, along with their breakdowninto construction and machinery, are regularly collected through the Annual Survey ofIndustries conducted by the CSO in the Ministry of Planning. No regular data areavailable on gross fixed capital formation in the unregistered industrial sectors or inthe agriculture, animal husbandry, or service sectors.
In 1980, for the first time, the Government of Punjab brought out three importantpublications on capital formation in rural households, in urban households, and bystate government and local authorities (Punjab, Economic and Statistical Organization1980b, 1980c, 1980d). These publications have helped considerably in filling the datagap and have been extensively used in this study to build estimates on capital formationin the various sectors. For example, data on capital formation in agricultural andnonagricultural enterprises and by state government and public enterprises—brokendown into buildings, plants and machinery, tools, transport equipment, tubewells, landreclamation, and so forth—have been taken from these sources.
In addition, the Annual Survey of Industries has been used to obtain data oninvestment in various registered industries (India, Ministry of Planning 1989). Sinceno direct information is available on capital formation in the unregistered industrialsector, these data have been estimated from the publications on capital formation(Punjab, Economic and Statistical Organization 1980b, 1980c, 1980d).
The Economic and Statistical Organization gives independent estimates of valueadded in the construction sector. Whereas the input structure for the constructionsector has been estimated by using the ratios in the all-India table for 1979/80 (India,Planning Commission 1981), the entire output in construction has been allocated to"gross fixed capital formation."
Changes in StocksThe information on changes in stocks has been collected from several sources. For
registered industries, it is available in the Annual Survey of Industries (India, Ministryof Planning 1989). For the government sector and the government administration aswell as government departments, this information is available in the Economic andFunctional Classification of the Budget (Punjab, Economic and Statistical Organization1980a), as is information on changes in foodgrain stocks on government account. Noready information is available regarding changes in stocks in the unregistered or house-hold industries or in agriculture. However, very detailed information on changes instocks of rural and urban households, the state government and local authorities, anddepartmental enterprises has been obtained from the publications on capital formation(Punjab, Economic and Statistical Organization 1980b, 1980c, 1980d).
Exports and ImportsDetailed time series information is available on the physical quantities of exports
and imports of goods hauled by railways, but no comprehensive time series data areavailable on the quantities exported and imported into Punjab through road transport.For 1978/79, however, Railways India Technical and Economic Services (RITES), a
38
subsidiary of Indian Railways, conducted a special survey to collect information onexports from and imports into various states of India. For the present study, thisinformation, obtained from RITES, has been updated in order to derive the export andimport estimates. In addition, the export and import information for wheat and ricehas been obtained from the annual reports of the Food Corporation of India. It shouldbe noted that the export and import data given by Indian Railways and by RITES arein quantities and not in value terms. Various sources have been used to obtain theprices of traded commodities and thereby derive value estimates of exports and imports.For some sectors for which export and import figures are not available from any source,the figures have been derived as residuals.
The imports into Punjab have been divided into two sets, namely, competitive andnoncompetitive. All imports of commodities that are not produced within the statehave been allocated to noncompetitive imports. The export-import estimates for thePunjab input-output in 1979/80 have considerably improved due to the availability ofthe RITES data on interstate commodity flow by road, although there is still room forimprovement.
Entries Below the LineApart from factor payments, the other entries below the line are noncompetitive
imports, repair and maintenance, work done by others, taxes, duties and subsidies,consumable stores, and depreciation. For the agricultural sector, information on theseentries has been obtained from the reports of the Comprehensive Scheme of Cost ofCultivation prepared by the Economic and Statistical Adviser, Government of India.For the registered sector, this information has been taken from the Annual Survey ofIndustries for 1979/80 (India, Ministry of Planning). For the unregistered sector, theestimates for noncompetitive imports, repair and maintenance, and work done byothers have been prepared by using a variety of sources. For example, for the 1979/80input-output table, noncompetitive imports have been estimated as a residual, sincethere are intermediate inputs and components of final demand that are not beingproduced in the state. Again, data available for 1975-77 (in the 1982 Statistical Abstractof Punjab) on such items as output and employment in repair services for the unregis-tered manufacturing industrial units have been projected to derive 1979/80 estimates.
WagesThe most important entry below the line pertains to net value added and its
breakdown into wages and other factor payments. In this study, only the calculationof wages is considered. Separate information on interest, rent, wages, and profits inthe agricultural sector is not directly available because, in most cases, the cultivatorhimself provides all or part of land, capital, and labor in the process of agriculturalproduction. The data collected under the Comprehensive Scheme of Cost of Cultivation(India, Agricultural Prices Commission, various years) have been used to estimate theshare of wages in net value added by various agricultural sectors. Information from theAnnual Survey of Industries (India, Ministry of Planning), which gives detailed informa-tion on factor payments for each industry in the registered sectors, has been used toestimate the wages paid in these sectors.Wages in the unregistered and service sectors have been obtained from various sources.The National Accounts Statistics (India, Ministry of Planning, various years) provideinformation on compensation to employees in nine sector classifications. This informa-tion has been used to obtain the ratio of wages to net value added in each of these
39
sectors, and thus to derive wages. The Labor Commissioner of Punjab provides infor-mation on the average annual earnings of workers in some occupations in the unregis-tered sectors, and this information, as published in the Statistical Abstract of Punjab(Punjab, Economic and Statistical Adviser, various years) has also been used to calculatewages.
In addition, the results of the 29th round of the National Sample Survey of ruraland urban household industries (India, Ministry of Planning 1978) have been used tocalculate wages in various household industries. For the 1979/80 input-output table,the wages received in the registered, unregistered, and household industries have beencombined to calculate the aggregate wages by sectors included in the table. For publicadministration and other services, including sanitary services, wages are derived bytaking the ratio of employee compensation to value added in this sector, as given inthe National Accounts Statistics. Although reliable information has been available forwages in many sectors, for the unregistered and unorganized sectors such as agriculture,forestry, animal husbandry, personal services, real estate and dwellings, trade, transport,and communications, this information is weak.
WorkersThe population census of India for 1981 (India, Ministry of Home Affairs 1982)
gives details about workers employed in the agriculture and manufacturing sectors atthe three-digit level. This census was the main source for estimating workers by sectors.The information on total workers in agriculture was broken down into various cropsectors by using the data given in the Comprehensive Scheme of Cost of Cultivation.
For animal husbandry, the census information refers to workers engaged in animalhusbandry on a full-time basis. In India, animal husbandry continues to be a part-timeactivity for most cultivating and noncultivating rural households. Instead of the datagiven by the census, the number of workers in the animal husbandry sector has beenestimated on the assumption that value added per worker in this sector equals that in"other agriculture." The data on the number of workers in registered industries hasbeen obtained directly from the Annual Survey of Industries. The census data havebeen used to obtain estimates of workers engaged in various sectors in the unorganizedand household industries.
Person-hoursIn preparing the 1979/80 Punjab input-output table, it is assumed that a worker
in the agricultural sector works 261 days a year on average. Data on person-hours aredirectly available for the registered industrial sectors. For other sectors, days workedduring a year have been estimated from various other sources such as the StatisticalAbstract of Punjab and the NSSO's survey of rural and urban household industries(29th round).
40
STRUCTURAL FEATURES OF THEPUNJAB ECONOMY
This chapter briefly discusses the structural features of the Punjab economy andchanges in them over time by using the input-output tables for 1969/70 (Alagh, Bhalla,and Kashyap 1980) and 1979/80 (Appendix 1, Table 44). These interindustry flowtables for Punjab present a complete production and income account of the includedproducing sectors along with the details of disposition of sectoral outputs for inter-mediate use and final demand. These tables can therefore be used to bring out therelative importance of various sectors and of changes in income and output, laborproductivity, and components of final demand that occurred between 1969/70 and1979/80.
Distribution of Sectoral Income and OutputThe data on real net state domestic product (NSDP) by industry of origin for 1969/70
and 1979/80 at constant 1970/71 prices are contained in Table 1. Tables 13 and 14give comparable data on state income and output and their sectoral distribution forboth 1969/70 and 1979/80 at current prices.
It is clear from Tables 13 and 14 that although the combined share of the agricultureand animal husbandry sectors in total NSDP declined from 61.4 percent in 1969/70to 47.2 percent in 1979/80, these sectors continue to occupy a predominant place inthe Punjab economy.7 That the state is relatively more dependent on the primary sectoris obvious, since in India this sector contributed only 37.5 percent of the net nationalproduct in 1979/80. Another notable feature is that in 1979/80, with a 47.2 percentshare in value added, the contribution of the primary sector to the gross value of outputin Punjab was only 33.9 percent, indicating that because of less use of intermediateinputs relative to other sectors, this sector has significantly higher value added perunit of output.
The secondary sector in Punjab, which at current prices accounted for 15.9 percentof NSDP in 1969/70, increased its share to 20.8 percent in 1979/80. During thesame period, the manufacturing sector's share in NSDP increased only from 11.4percent to 13.0 percent. Despite rapid growth, it is clear that Punjab continues to berelatively less industrialized than India as a whole, since the share of manufacturingin the total net national product of India rose from 14.0 in 1969/70 to 15.9 percentin 1979/80.
The tertiary sector, which accounted for only 22.7 percent of Punjab's NSDP in1969/70, contributed 32.0 percent of NSDP 1979/80. In India during this period theshare of the tertiary sector in the total net national product increased from 30.5 percentto 36.9 percent (India, Ministry of Planning, various years[b]).
7 The shares given in Tables 13 and 14 are taken from the two input-output tables and are at currentprices. These figures are therefore not comparable to those contained in Table 1, where all data are atconstant 1970/71 prices.
41

Table 13—Sectoral distribution of net value added and gross value of outputin Punjab, 1969/70
SectorNumber
123456789
10
11121314
151617
18
19202122
2324252627282930313233
34
3536
37383940
Sector
WheatRiceMaizeCottonSugarcaneGram and pulsesOilseedsBajraOther agriculture and forestry
Subtotal: agricultureAnimal husbandry
Subtotal: primaryb
Dairy productsGrain mill productsSugar and confectioneryEdible oils and other food-
processing industriesBreweries and beveragesTextilesCotton ginning, pressing, and
other textilesSawmills and wooden
containersFurniture and fixturesPrinting and publishingRubber and leather productsBasic chemicals, including
fertilizersOther chemicalsGlass and mineral productsBasic metal industriesMetal productsMachinery, except electricalElectrical machineryRailroad equipmentTransport equipmentRepair of transport equipmentMotorcycles and bicyclesScientific and surgical
instrumentsMiscellaneous industries
Subtotal: manufacturingConstructionElectricity
Subtotal: secondaryTrade, transport and storageOther servicesBanking and insuranceReal estate
Subtotal: tertiaryTotal
NetValueAdded
(Rs million)1
3,199327357169312285176122871
5,8182,9188,736
125613
984
394
24
36921361
9326944997
154241938
645
36146
1,629464166
2,2591,824
987156263
3,23014,225
Distri-butionofNetValueAdded
Share ofAgricul-
ture, Manu-facturing,
and TertiarySectors
* (percent)22.49
2.302.511.192.192.001.240.866.12
40.9020.5161.41
0.080.390.09
0.690.032.77
0.17
0.250.650.090.43
0.650.180.660.340.681.080.170.130.270.040.33
0.251.03
11.453.261.17
15.8812.826.941.101.85
22.71100.00
54.975.626.142.905.374.903.032.09
14.98100.00
0^713.410.80
5.990.25
24.21
1.49
2.205.640.813.78
5.691.585.753.005.959.461.461.172.310.402.76
2.218.97
100.00
56.4330.59
4.828.16
100.00
GrossValue ofOutput
(Rs million)4,114
442476244463390251163
1,0737,6173,697
11,314217653100
66428
1,618
508
131272
36216
22513334837035651012027
12216
180
58530
7,4391,179
1908,808
n.a.n.a.n.a.n.a.n.a.n.a.
Distri-bution
of GrossValue ofOutput
Share ofAgricul-
ture, Manu-facturing,
and TertiarySectors
a (percent)
20.452.202.371.212.301.941.250.815.33
37.8518.3756.22
1.083.240.50
3.300.148.04
2.53
0.651.350.181.07
1.120.661.731.841.772.530.600.130.610.080.89
0.292.63
31.105.860.95
37.91n.a.n.a.n.a.n.a.n.a.n.a.
54.025.816.253.206.085.133.292.13
14.09100.00
2^928.771.35
8.930.37
21.75
6.84
1.763.660.482.90
3.021.794.684.974.786.851.620.361.650.222.42
0.797.12
100.00
n.a.n.a.n.a.n.a.n.a.n.a.
Source: Based on Punjab input-output table for 1969/70 in Y. K. Alagh, G. S. Bhalla, and S. P. Kashyap, StructuralAnalysis ofGujarat, Punjab, andHaryana Economies—An Input-OutputSft/dj^New Delhi: Allied, 1980).
Notes: n.a. means not available. Parts may not add to totals because of rounding.aAt current prices.bBecause of neglible contributions, fishing and mining and quarrying have not been included in the primary sector.
42

Table 14—Sectoral distribution of net value added and gross value of outputin Punjab, 1979/80
SectorNumber
1234567
8
9
101112131415161718
1920
212223242526272829
3031
3233
3435
36373839
Sector
WheatRiceCottonSugarcaneGram and pulsesOilseedsOther agriculture and forestry
Subtotal: agricultureAnimal husbandry
Subtotal: primaryDairy products and
confectioneryGrain mill productsBakery productsSugarOther food industriesEdible oilsBreweries and beveragesGinning and textilesSawmills and wooden goodsPaper, printing, and
publishingRubber and leather productsBasic chemicals, including
fertilizersDrugs and PharmaceuticalsOther chemicalsGlass and mineral productsBasic metal industriesMetal productsMachinery, except electricalElectrical machineryRailroad equipmentMotor vehicles, manufac-
ture and repairBicycles and partsScientific and surgical
instrumentsSports and athletic goodsMiscellaneous industries
Subtotal: manufacturingElectricity, gas, water supplyConstruction
Subtotal: secondaryTrade, transport, and storageOther servicesBanking and insuranceReal estate and ownership of
dwellingsSubtotal: tertiary
Total
NetValueAdded
(Rs million)5,4213,5741,573
650365367
2,44814,3985,598
19,996
1551575334
14014047
1,251234
51233
2717
3656139228024111228
399412
25102133
5,494946
2.3938,8338,6493,494
877
53013,55042,379
Distri-butionof NetValueAdded
Share ofAgricul-
ture, Manu-facturing,
and TertiarySectors
a (percent)12.798.433.711.530.860.875.78
33.9713.2147.18
0.370.370.120.080.330.330.112.950.55
0.120.55
0.640.020.091.320.930.660.570.260.07
0.940.97
0.060.240.31
12.962.235.65
20.8420.41
8.242.07
1.2531.97
100.00
37.6524.8210.934.512.532.55
17.01100.00
2.822.850.960.622.562.560.86
22.784.26
0.924.25
4.920.120.66
10.217.145.094.382.040.51
7.267.50
0.451.862.42
100.00
63.8325.78
6.47
3.92100.00
GrossValue ofOutput
(Rs million)3
9,7355,1892,196
813479454
2,94421,810
7,97629,786
6691,874
156195512
1,876285
6,932601
144890
1,08539
2331,4884,3281,3771,119
53665
1,0731,313
86412193
27,4811,6576,853
35,99113,8416,5111,064
81022,22588,002
Distri-bution
of GrossValue ofOutput
Share ofAgricul-
ture, Manu-facturing,
and TertiarySectors
(percent)11.065.902.500.920.540.523.35
24.789.06
33.84
0.762.130.180.220.582.130.327.880.68
0.161.01
1.230.040.271.694.921.571.270.610.07
1.221.49
0.100.470.22
31.231.887.79
40.9015.737.401.21
0.9225.26
100.00
44.6323.7910.073.732.202.08
13.50100.00
2.436.820.570.711.866.831.04
25.222.19
0.523.24
3.950.140.855.42
15.755.014.071.950.24
3.904.78
0.311.500.70
100.00
62.2829.29
4.79
3.64100.00
Source: Based on Punjab input-output table for 1979/80 (Table 44, Appendix 1).Note: Parts may not add to totals because of rounding.aAt current prices.bBecause of negligible contributions, fishing and mining and quarrying have not been included in the primary sector.
43
Some significant structural changes can be discerned within the primary, secondary,and tertiary sectors in Punjab during this period. The first important change is therapid growth in rice and wheat output and the emergence of rice, along with wheat,as one of the two major crops in the state. Whereas the output of wheat increased by62 percent, from 4.87 million tons in 1969/70 to 7.90 million tons in 1979/80, thatof rice increased nearly six times, from 0.54 million tons to 3.04 million tons (seeTable 2). Table 13 shows that in 1969/70 wheat accounted for 54.0 percent and ricefor only 5.8 percent of the total value of agricultural output. In 1979/80, the contributionof wheat to the total value of agricultural output declined to 44.6 percent, while thatof rice increased to 23.8 percent (Table 14). Thus these two crops together accountedfor 68.4 percent of the total value of agricultural output in 1979/80. A similar pictureemerges from the contribution of these crops to total value added in agriculture.Whereas wheat accounted for 55.0 percent and rice for 5.6 percent of total value addedin agriculture in 1969/70, the contribution of wheat declined in 1979/80 to 37.7percent, but that of rice increased to 24.8 percent. As discussed earlier, the croppingpattern in Punjab has become increasingly dominated by wheat and rice, and in 1979/80these two crops accounted for about 61.0 percent of total cropped area in the state(Table 2).
Second, because of widespread adoption of the new seed-fertilizer technology, theuse of intermediate inputs, in general, and that of modern inputs, in particular, increasedmarkedly in rice and wheat between 1969/70 and 1979/80. For example, whilefertilizers accounted for only 4.4 percent of the total value of wheat output in 1969/70,they contributed 14.5 percent of its value in 1979/80. Noncompetitive imports (fuelsand lubricants), which constituted only 0.9 percent of the total value of wheat outputin 1969/70, accounted for 13.7 percent in 1979/80. In the case of rice, the proportionof fertilizer to total output increased from 5.7 percent in 1969/70 to 12.5 percent in1979/80, and that of fuels and lubricants increased from 1.2 percent to 8.7 percent.Consequently, during this period value added as a proportion of value of output regis-tered a notable decline in both these crops, falling from 77.7 percent in 1969/70 to55.7 percent in 1979/80 for wheat and from 74.0 percent to 68.9 percent for rice.
On the other hand, a perceptible decline occurred in animal draft power used inagricultural production. The expenditure on bullocks (animal husbandry sector), whichconstituted 7.7 percent of the value of wheat output in 1969/70, accounted for only2.8 percent in 1979/80. For rice, a similar decline took place in the expenditure onbullocks—from 5.5 percent to 1.4 percent of its value of output during this period.The main cause of this decline is the gradual replacement of animal draft power withmechanical energy such as that of tractors. (See the 1969/70 Punjab input-output tablein Alagh, Bhalla, Kashyap 1980 and the 1979/80 Punjab input-output table in Appendix1 of this study [Table 44].)
Although industrial output recorded a large increase during 1969/70-1979/80,few significant changes occurred in the structure and composition of the manufacturingsector in Punjab. Thus the textile industry continued to be the dominant industry inthe state, accounting for nearly one-fourth of the total value of manufacturing outputand slightly more than one-fifth of value added in this sector in both 1969/70 and1979/80. The food products industry, including dairy products, grain mill products,sugar, edible oil, bakery, and other foods, which together accounted for 22.3 percentof the total value of manufacturing output in 1969/70, constituted about 20.3 percentin 1979/80. However, basic metal and metal products industries emerged as majorindustrial sectors. Together they accounted for 20.8 percent of the total value ofmanufacturing output and 12.2 percent of total value added in 1979/80, compared
44
with a contribution of 9.8 percent to total output and 9.0 percent to total value addedin manufacturing in 1969/70. Manufacture and repair of motor vehicles and manufac-ture of bicycles and parts also acquired more weight, together accounting for 14.8percent of value added in the manufacturing sector in 1979/80 compared with only0.6 percent in 1969/70.
Otherwise, the basic industrial structure of Punjab continues to consist of agriculture-based industries such as cotton textiles, grain mill products, food processing, and edibleoils; some agro-input industries such as nonelectrical machinery, basic chemicals, andfertilizers; and some consumer durables such as bicycles, sewing machines, and rubberand leather products.
Taking the secondary sector as a whole, the contribution of both construction andelectricity to the value added and value of output of the sector increased significantlybetween 1969/70 and 1979/80. The share of value added in construction8 increasedfrom 20.6 percent of total value added in the secondary sector in 1969/70 to 27.1percent in 1979/80, and that of value added in electricity increased from 7.3 percentto 10.7 percent.
Since the value of total output was not estimated for the tertiary sector in 1969/70,it is not possible to delineate the changes in the distribution of value of output for thatsector. However, the data on value added in the tertiary sector indicate that this sectorrecorded an even higher growth than the primary and the secondary sectors andconsequently registered a significant increase in its share of total value added—from22.7 percent in 1969/70 to 32.0 percent in 1979/80. While trade and transportcontributed 12.8 percent to NSDP in 1969/70, its contribution increased to 20.4percent in 1979/80. During the same period, the contribution made by sectors suchas banking, insurance, real estate, public administration, and other services also increasedat a rapid rate.
Output and ProductivityTables 15 and 16 give details by sector on output and value added per worker in
Punjab in 1969/70 and 1979/80. There are large intersectoral variations in outputper worker, due to different technologies employed and uneven distribution of produc-tively invested capital over the sectors. The differences in partial labor productivitymeasured this way give an idea of the relative efficiency of the work force in varioussectors in 1969/70 and 1979/80. Since value of output and value added figures arein current prices, it is not possible to use these statistics to measure changes from1969/70 to 1979/80.
It is, however, possible to get an idea of changes in labor productivity in real termsin the primary and the secondary sectors by using the data on state income in Table1. During 1969/70-1979/80, per worker value added in real terms increased in boththe primary and the secondary sectors. Thus, in constant prices, value added per workerincreased from Rs 3,615 in 1969/70 to Rs 4,417 in 1979/80 in the primary sectorand from Rs 3,634 to Rs 4,282 in the secondary sector.
Regarding intersectoral differences in labor productivity (at current prices), as shownin Tables 15 and 16, labor productivity was substantially higher in the manufacturing
8 As noted earlier, the results for construction should be treated with caution because sectoral incomeestimates were thoroughly revised in 1970/71 and net value added in construction, which was only Rs 440million in 1969/70, was raised to Rs 960 million in 1970/71.
45
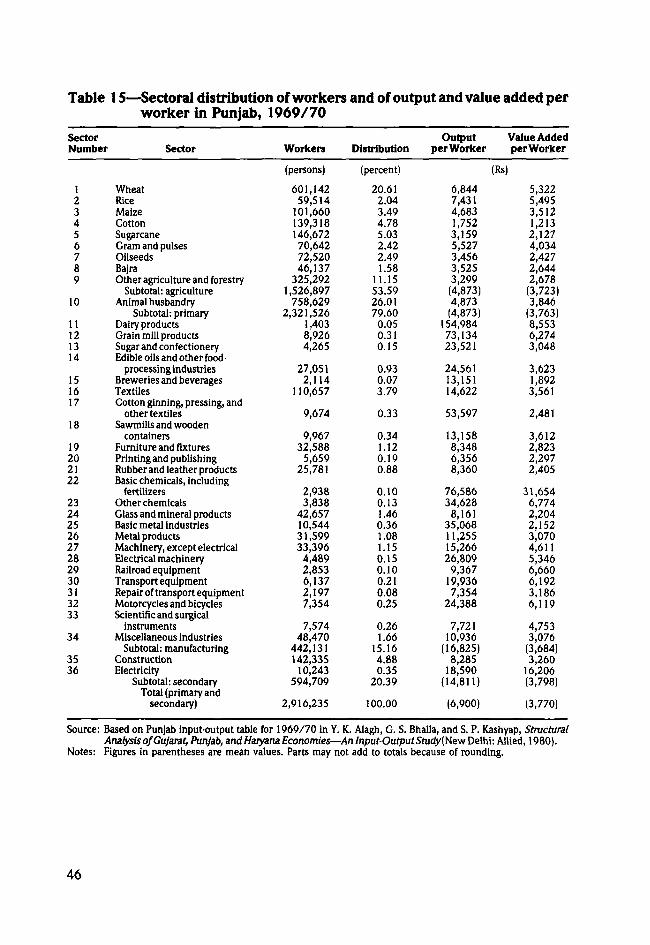
Table 15—Sectoral distribution of workers and of output and value added perworker in Punjab, 1969/70
SectorNumber
123456789
10
11121314
151617
18
19202122
2324252627282930313233
34
3536
Sector
WheatRiceMaizeCottonSugarcaneGram and pulsesOilseedsBajraOther agriculture and forestry
Subtotal: agricultureAnimal husbandry
Subtotal: primaryDairy productsGrain mill productsSugar and confectioneryEdible oils and other food-
processing industriesBreweries and beveragesTextilesCotton ginning, pressing, and
other textilesSawmills and wooden
containersFurniture and fixturesPrinting and publishingRubber and leather productsBasic chemicals, including
fertilizersOther chemicalsGlass and mineral productsBasic metal industriesMetal productsMachinery, except electricalElectrical machineryRailroad equipmentTransport equipmentRepair of transport equipmentMotorcycles and bicyclesScientific and surgical
instrumentsMiscellaneous industries
Subtotal: manufacturingConstructionElectricity
Subtotal: secondaryTotal (primary and
secondary)
Workers
(persons)
601,14259,514
101,660139,318146,67270,64272,52046,137
325,2921,526,897
758,6292,321,526
1,4038,9264,265
27,0512,114
110,657
9,674
9,96732,588
5,65925,781
2,9383,838
42,65710,54431,59933,396
4,4892,8536,1372,1977,354
7,57448,470
442,131142,335
10,243594,709
2,916,235
Distribution
(percent)
20.612.043.494.785.032.422.491.58
11.1553.5926.0179.60
0.050.310.15
0.930.073.79
0.33
0.341.120.190.88
0.100.131.460.361.081.150.150.100.210.080.25
0.261.66
15.164.880.35
20.39
100.00
Outputper Worker
6,8447,4314,6831,7523,1595,5273,4563,5253,299(4,873)4,873
(4,873)154,98473,13423,521
24,56113,15114,622
53,597
13,1588,3486,3568,360
76,58634,628
8,16135,06811,25515,26626,809
9,36719,9367,354
24,388
7,72110,936
(16,825)8,285
18,590(14,811)
(6,900)
Value AddedperWorker
(Rs)
5,3225,4953,5121,2132,1274,0342,4272,6442,678
(3,723)3,846
(3,763)8,5536,2743,048
3,6231,8923,561
2,481
3,6122,8232,2972,405
31,6546,7742,2042,1523,0704,6115,3466,6606,1923,1866,119
4,7533,076
(3,684)3,260
16,206(3,798)
(3,770)
Source: Based on Punjab input-output table for 1969/70 in Y. K. Alagh, G. S. Bhalla, and S. P. Kashyap, StructuralAnalysis of Gujarat, Punjab, and Haryana Economies—An Input-Output Srudy(NewDelhi: Allied, 1980).
Notes: Figures in parentheses are mean values. Parts may not add to totals because of rounding.
46
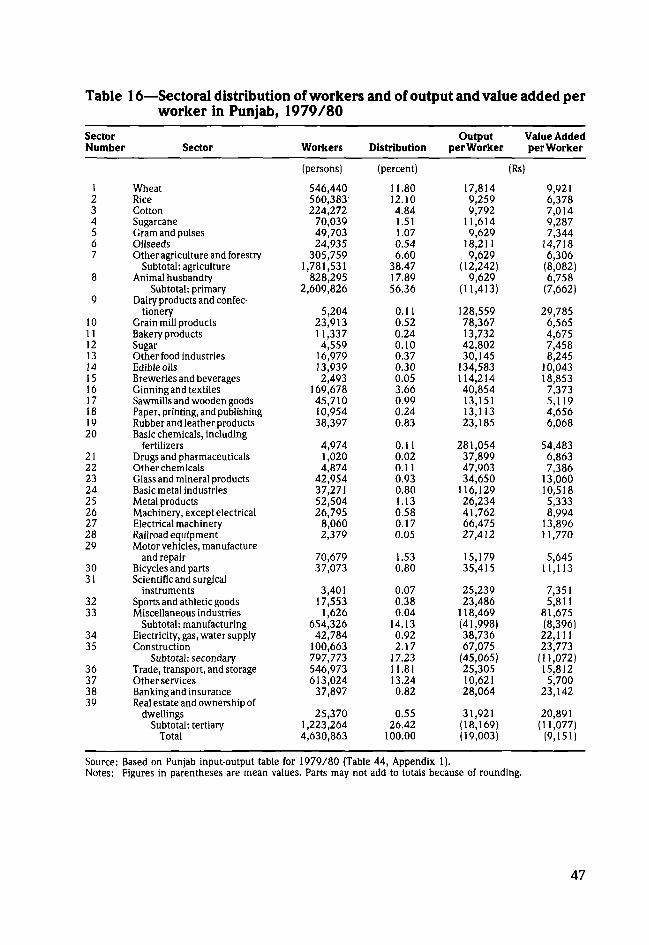
Table 16—Sectoral distribution of workers and of output and value added perworker in Punjab, 1979/80
SectorNumber
1234567
8
9
1011121314151617181920
212223242526272829
3031
3233
3435
36373839
Sector
WheatRiceCottonSugarcaneGram and pulsesOilseedsOther agriculture and forestry
Subtotal: agricultureAnimal husbandry
Subtotal: primaryDairy products and confec-
tioneryGrain mill productsBakery productsSugarOther food industriesEdible oilsBreweries and beveragesGinning and textilesSawmills and wooden goodsPaper, printing, and publishingRubber and leather productsBasic chemicals, including
fertilizersDrugs and PharmaceuticalsOther chemicalsGlass and mineral productsBasic metal industriesMetal productsMachinery, except electricalElectrical machineryRailroad equipmentMotor vehicles, manufacture
and repairBicycles and partsScientific and surgical
instrumentsSports and athletic goodsMiscellaneous industries
Subtotal: manufacturingElectricity, gas, water supplyConstruction
Subtotal: secondaryTrade, transport, and storageOther servicesBanking and insuranceReal estate and ownership of
dwellingsSubtotal: tertiary
Total
Workers
(persons)
546,440560,383224,272
70,03949,70324,935
305,7591,781,531
828,2952,609,826
5,20423,91311,3374,559
16,97913,9392,493
169,67845,71010,95438,397
4,9741,0204,874
42,95437,27152,50426,795
8,0602,379
70,67937,073
3,40117,5531,626
654,32642,784
100,663797,773546,973613,024
37,897
25,3701,223,2644,630,863
Distribution
(percent)
11.8012.104.841.511.070.546.60
38.4717.8956.36
0.110.520.240.100.370.300.053.660.990.240.83
0.110.020.110.930.801.130.580.170.05
1.530.80
0.070.380.04
14.130.922.17
17.2311.8113.240.82
0.5526.42
100.00
Outputper Worker
17,8149,2599,792
11,6149,629
18,2119,629
(12,242)9,629
(11,413)
128,55978,36713,73242,80230,145
134,583114,21440,85413,15113,11323,185
281,05437,89947,90334,650
116,12926,23441,76266,47527,412
15,17935,415
25,23923,486
118,469(41,998)38,73667,075
(45,065)25,30510,62128,064
31,921(18,169)(19,003)
Value Addedper Worker
(Rs)
9,9216,3787,0149,2877,344
14,7186,306
(8,082)6,758
(7,662)
29,7856,5654,6757,4588,245
10,04318,8537,3735,1194,6566,068
54,4836,8637,386
13,06010,5185,3338,994
13,89611,770
5,64511,113
7,3515,811
81,675(8,396)
22,11123,773
(11,072)15,8125,700
23,142
20,891(11,077)
(9,151)
Source: Based on Punjab input-output table for 1979/80 (Table 44, Appendix 1).Notes: Figures in parentheses are mean values. Parts may not add to totals because of rounding.
47
sectors than in the labor-intensive agricultural sectors in both 1969/70 and 1979/80.Thus, in 1969/70 the productivity in manufacturing was about three and a half timesthe output of Rs 4,873 per worker in agriculture. In 1979/80 productivity in themanufacturing sectors was Rs 41,998 compared with an average productivity of Rs12,242 per worker in agriculture. Overall productivity in the tertiary sector was higherthan that in the primary sector but much lower than that in the secondary sector.
Thiere are large variations in productivity per worker within the primary, secondary,and tertiary sectors. Within agriculture, for example, output per worker in the produc-tion of wheat, sugarcane, and oilseeds, where new technology has been adopted, ismuch higher than that for most other crops. In 1979/80, the highest per workerproductivity among all the crops was in oilseeds, even though in 1969/70 oilseedsranked fairly low in labor productivity. The main reason is that over this period therelative prices of oilseeds vis-a-vis other agricultural crops rose at a much higher rate.
The output per worker in animal husbandry shown in Tables 15 and 16 is quitelow both for 1969/70 and 1979/80. This is primarily because reliable data on workersand person-days are not available, since animal husbandry is a part-time activity. Theestimates have therefore been derived from certain assumptions, giving only a notionalvalue of productivity to this sector.
Within manufacturing, too, there are large variations in labor productivity. In 1969/70 the highest output per worker was in manufacturing of dairy products, followed bybasic chemicals, grain mill products, cotton ginning, and basic metal industries. In1979/80, basic chemicals, including fertilizers, had the highest rank in output perworker, followed by edible oils, grain mill products, miscellaneous industries, andbreweries. The lowest output per worker was in printing and publishing and bakeryproducts. Sawmills and manufacture of motor vehicles and parts continued to have lowproductivity. Within the secondary sector, both construction and electricity showed ahigh level of labor productivity. In the tertiary sector, output per worker was very lowin services but was notably above average in trade and transport, banking, and realestate and dwellings.
The intersectoral variations in labor productivity, though quite significant, are muchlower when labor productivity is measured in terms of value added per worker insteadof value of output per worker. Thus, within the primary sector, value added per workerranged between Rs 1,213 and Rs 5,495 in 1969/70 and between Rs 6,306 and Rs 9,921in 1979/80 (except for oilseeds, with nearly Rs 15,000). In the manufacturing sector,in 1969/70 the highest value added per worker was Rs 31,654 in the basic chemicalssector. Dairy products, which ranked highest in output per worker, had a value addedproductivity of only Rs 8,553. Value added per worker in other manufacturing sectorsranged between Rs 1,892 and Rs 6,774. In 1979/80 the highest value added perworker was in miscellaneous industries, followed by basic chemicals and dairy products.For other manufacturing sectors, value added per worker was between Rs 4,656 andRs 18,853. The range was much higher for value of output per worker in theseindustries. Value added per worker was high in both construction and electricity during1979/80.
In the tertiary sector, in 1979/80 value added per worker was quite high in tradeand transport, banking, and real estate, while it was rather low in other services.
Changes in the Pattern of Final DemandTable 17 shows how final demand was met in Punjab in 1969/70 and 1979/80
and, for comparison, in India in 1979/80. In both 1969/70 and 1979/80 a major
48
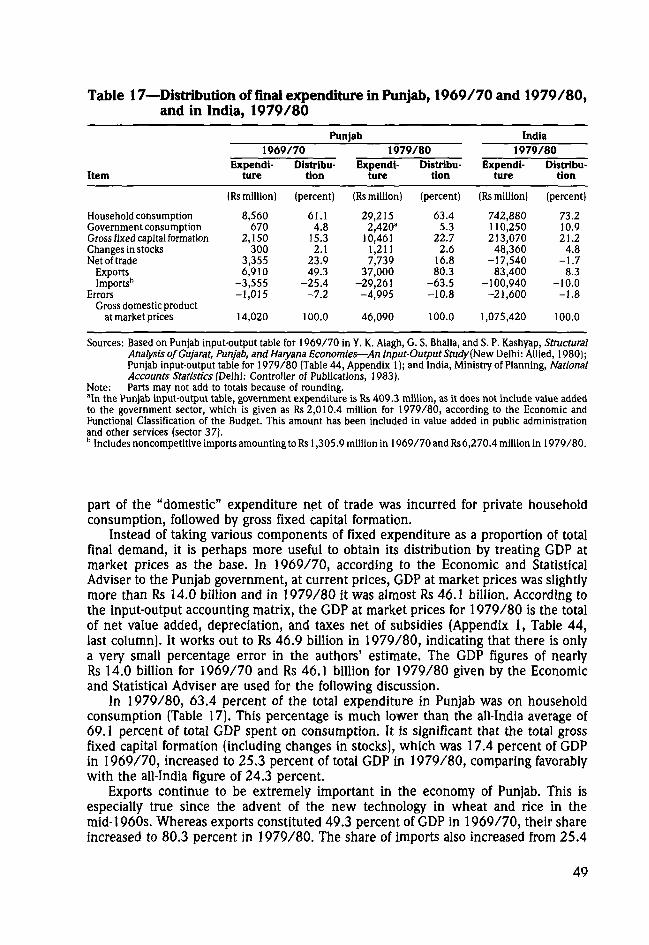
Table 17—Distribution of final expenditure in Punjab, 1969/70 and 1979/80,and in India, 1979/80
Punjab India
Item
1969/70Expendi-
ture
Rs million)
8,560670
2,150300
3,3556,910
-3,555-1,015
Distribu-tion
(percent)
61.14.8
15.32.1
23.949.3
-25.4-7.2
1979/80Expendi-
ture
(Rs million)
29,2152,420a
10,4611,2117,739
37,000-29,261-4,995
Distribu-tion
(percent)
63.45.3
22.72.6
16.880.3
-63.5-10.8
1979/80Expendi-
ture
(Rs million)
742,880110,250213,070
48,360-17,540
83,400-100,940
-21,600
Distribu-tion
(percent)
73.210.921.2
4.8-1.7
8.3-10.0-1.8
Household consumptionGovernment consumptionGross fixed capital formationChanges in stocksNet of trade
ExportsImports'5
ErrorsGross domestic product
at market prices 14,020 100.0 46,090 100.0 1,075,420 100.0
Sources: Based on Punjab input-output table for 1969/70 in Y. K. Alagh, G. S. Bhalla, and S. P. Kashyap, StructuralAnalysis of Gujarat, Punjab, and Haryana Economies—An Input-Output Study{New Delhi: Allied, 1980);Punjab input-output table for 1979/80 (Table 44, Appendix 1); and India, Ministry of Planning, NationalAccounts Statistics (Delhi: Controller of Publications, 1983).
Note: Parts may not add to totals because of rounding.aIn the Punjab input-output table, government expenditure is Rs 409.3 million, as it does not include value addedto the government sector, which is given as Rs 2,010.4 million for 1979/80, according to the Economic andFunctional Classification of the Budget. This amount has been included in value added in public administrationand other services (sector 37).b Includes noncompetitive imports amounting to Rs 1,305.9 million in 1969/70 and Rs 6,270.4 million in 1979/80.
part of the "domestic" expenditure net of trade was incurred for private householdconsumption, followed by gross fixed capital formation.
Instead of taking various components of fixed expenditure as a proportion of totalfinal demand, it is perhaps more useful to obtain its distribution by treating GDP atmarket prices as the base. In 1969/70, according to the Economic and StatisticalAdviser to the Punjab government, at current prices, GDP at market prices was slightlymore than Rs 14.0 billion and in 1979/80 it was almost Rs 46.1 billion. According tothe input-output accounting matrix, the GDP at market prices for 1979/80 is the totalof net value added, depreciation, and taxes net of subsidies (Appendix 1, Table 44,last column). It works out to Rs 46.9 billion in 1979/80, indicating that there is onlya very small percentage error in the authors' estimate. The GDP figures of nearlyRs 14.0 billion for 1969/70 and Rs 46.1 billion for 1979/80 given by the Economicand Statistical Adviser are used for the following discussion.
In 1979/80, 63.4 percent of the total expenditure in Punjab was on householdconsumption (Table 17). This percentage is much lower than the all-India average of69.1 percent of total GDP spent on consumption. It is significant that the total grossfixed capital formation (including changes in stocks), which was 17.4 percent of GDPin 1969/70, increased to 25.3 percent of total GDP in 1979/80, comparing favorablywith the all-India figure of 24.3 percent.
Exports continue to be extremely important in the economy of Punjab. This isespecially true since the advent of the new technology in wheat and rice in themid-1960s. Whereas exports constituted 49.3 percent of GDP in 1969/70, their shareincreased to 80.3 percent in 1979/80. The share of imports also increased from 25.4
49
percent to 63.5 percent, indicating an increasing linkage between the Punjab economyand the national economy.
Household Consumption
In both 1969/70 and 1979/80, household consumption was by far the mostimportant component of final demand, accounting for nearly two-thirds of NSDP. Tables18 and 19 show the annual per capita consumption expenditure of rural and urbanhouseholds along with its composition. In nominal terms, per capita consumptionexpenditure in the rural and urban areas in 1969/70 was Rs 636 and Rs 695, respec-tively, and increased to Rs 1,744 and Rs 1,936, respectively, in 1979/80.
The composition of expenditure shows that although cereals, including grain millproducts, are the most important components of consumption, their share in the totalexpenditure for rural households dropped from 26.9 percent in 1969/70 to 15.0percent in 1979/80. In the consumption basket of urban household expenditure,cereals and grain mill products declined from 26.8 percent to 13.8 percent. Whilethere was a notable fall in the proportion of expenditure on milk and dairy productsby rural households, from 32.0 percent in 1969/70 to 19.5 percent in 1979/80, theexpenditure on milk by urban households declined only slightly, from 19.5 percent in1969/70 to 16.8 percent in 1979/80. It appears that the expenditure on animalhusbandry products by rural households obtained from the Punjab Economic and Statis-tical Organization was overestimated in the state sample of the round of the NationalSample Survey for 1969/70, which constituted the basis for estimates in the presentstudy. The combined state and central sample for 1968/69 shows that rural householdsspent 22.2 percent—not the 32.0 percent shown in Table 18 for 1969/70—of theirexpenditure on dairy products compared with 19.5 percent in 1979/80 (India, Ministryof Planning 1979, 1986a, 1986b). Cereals and milk, as well as edible oils, sugar, andcloth, remained important components of consumption expenditure for both rural andurban households.
A notable change was a substantial increase in the proportion of expenditure ontrade and transport, banking and insurance, other services, and real estate by ruralhouseholds in 1979/80. For rural households, the share of expenditure on these tertiaryactivities substantially increased from 12.4 percent in 1969/70 to 22.1 percent in1979/80.9 During the same period, the share spent on these activities by urbanhouseholds increased only marginally from 20.0 percent to 20.5 percent.
Except for the change in expenditure on the tertiary sector, the relative prioritiesattached to individual commodity groups in both urban and rural areas remained moreor less unchanged between 1969/70 and 1979/80. The first and second prioritieswere expenditures on cereals and milk, followed by sugar, salt, and other food andnonfood items, indicating that the consumption pattern in both rural and urban Punjabcontinued to be heavily food-oriented and that there was no significant difference inthe consumption basket between rural and urban households. But a perceptible declinein the proportion of expenditure on cereals indicates that, with a rise in per capitaincome, the consumption pattern became more diversified.
The temporal changes in the consumption pattern are shown in Table 20, whichgives the distribution of monthly per capita expenditure by rural households in Punjab
9 The 1969/70 input-output table (see Table 13) does not contain any data on banking, insurance services,and real estate. But the distribution of per capita expenditure of rural households given in the 27th round(1972/73) shows that the percentage of expenditure incurred on "services" was 12.4 percent. See India,Ministry of Planning 1979.
50
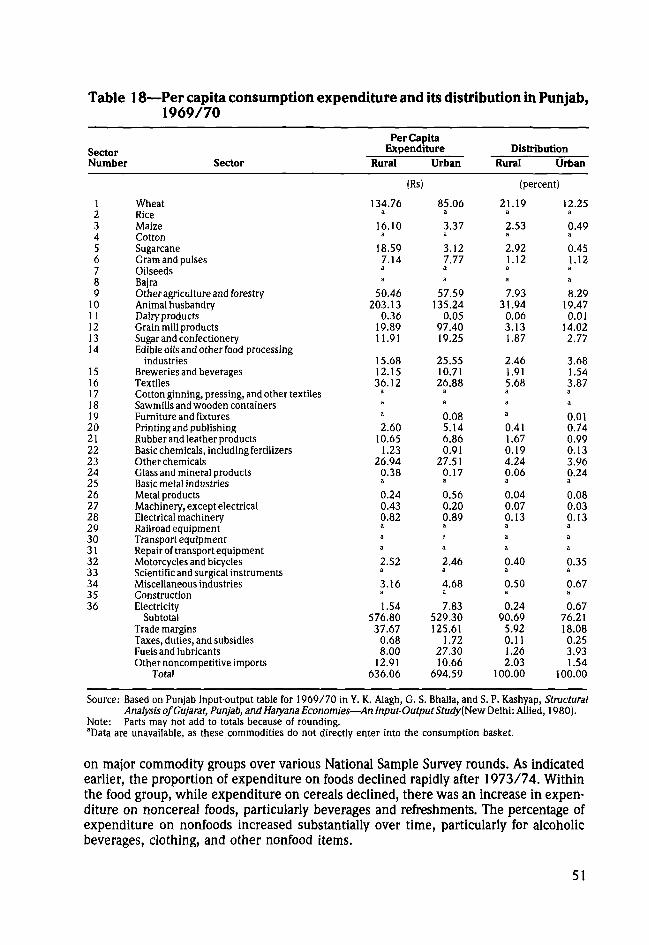
Table 18—Per capita consumption expenditure and its distribution in Punjab,1969/70
SectorNumber
123456789
1011121314
15161718192021222324252627282930313233343536
Sector
WheatRiceMaizeCottonSugarcaneGram and pulsesOilseedsBajraOther agriculture and forestryAnimal husbandryDairy productsGrain mill productsSugar and confectioneryEdible oils and other food-processing
industriesBreweries and beveragesTextilesCotton ginning, pressing, and other textilesSawmills and wooden containersFurniture and fixturesPrinting and publishingRubber and leather productsBasic chemicals, including fertilizersOther chemicalsGlass and mineral productsBasic metal industriesMetal productsMachinery, except electricalElectrical machineryRailroad equipmentTransport equipmentRepair of transport equipmentMotorcycles and bicyclesScientific and surgical instrumentsMiscellaneous industriesConstructionElectricity
SubtotalTrade marginsTaxes, duties, and subsidiesFuels and lubricantsOther noncompetitive imports
Total
Per CapitaExpenditure
Rural Urban
(Rs)
134.76a
16.10a
18.597.14aa
50.46203.13
0.3619.8911.91
15.6812.1536.12
a
aa
2.6010.65
1.2326.94
0.38a
0.240.430.82a3
a
2.52a
3.16a
1.54576.8037.67
0.688.00
12.91636.06
85.06a
3.37a
3.127.77aa
57.59135.24
0.0597.4019.25
25.5510.7126.88
a
a
0.085.146.860.91
27.510.17a
0.560.200.89aaa
2.46a
4.68a
7.83529.30125.61
1.7227.3010.66
694.59
DistributionRural Urban
(percent)
21.19a
2.53a
2.921.12aa
7.9331.94
0.063.131.87
2.461.915.68a
aa
0.411.670.194.240.06a
0.040.070.13aaa
0.40a
0.50a
0.2490.695.920.111.262.03
100.00
12.25a
0.49a
0.451.12aa
8.2919.470.01
14.022.77
3.681.543.87a
a
0.010.740.990.133.960.24a0.080.030.13aaa
0.35a
0.67a
0.6776.2118.080.253.931.54
100.00
Source: Based on Punjab input-output table for 1969/70 in Y. K. Alagh, G. S. Bhalla, and S. P. Kashyap, StructuralAnalysis of Gujarat, Punjab, andHaryana Economies—An Input-Output Study [New Delhi: Allied, 1980).
Note: Parts may not add to totals because of rounding.aData are unavailable, as these commodities do not directly enter into the consumption basket.
on major commodity groups over various National Sample Survey rounds. As indicatedearlier, the proportion of expenditure on foods declined rapidly after 1973/74. Withinthe food group, while expenditure on cereals declined, there was an increase in expen-diture on noncereal foods, particularly beverages and refreshments. The percentage ofexpenditure on nonfoods increased substantially over time, particularly for alcoholicbeverages, clothing, and other nonfood items.
51
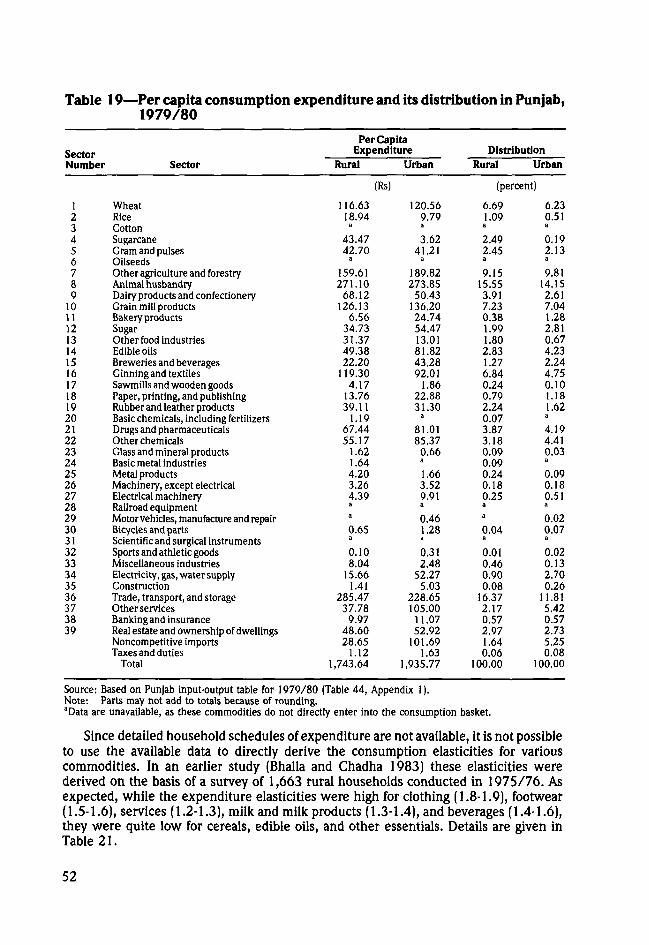
Table 19—Per capita consumption expenditure and its distribution in Punjab,1979/80
SectorNumber
123456789
101112131415161718192021222324252627282930313233343536373839
Sector
WheatRiceCottonSugarcaneGram and pulsesOilseedsOther agriculture and forestryAnimal husbandryDairy products and confectioneryGrain mill productsBakery productsSugarOther food industriesEdible oilsBreweries and beveragesGinning and textilesSawmills and wooden goodsPaper, printing, and publishingRubber and leather productsBasic chemicals, including fertilizersDrugs and PharmaceuticalsOther chemicalsGlass and mineral productsBasic metal industriesMetal productsMachinery, except electricalElectrical machineryRailroad equipmentMotor vehicles, manufacture and repairBicycles and partsScientific and surgical instrumentsSports and athletic goodsMiscellaneous industriesElectricity, gas, water supplyConstructionTrade, transport, and storageOther servicesBanking and insuranceReal estate and ownership of dwellingsNoncompetitive importsTaxes and duties
Total
Per CapitaExpenditure
Rural
(Rs)
116.6318.94
a
43.4742.70
a
159.61271.1068.12
126.136.56
34.7331.3749.3822.20
119.304.17
13.7639.11
1.1967.4455.17
1.621.644.203.264.39aa
0.65a
0.108.04
15.661.41
285.4737.78
9.9748.6028.65
1.121,743.64
Urban
120.569.79a
3.6241.21
a
189.82273.85
50.43136.2024.7454.4713.0181.8243.2892.01
1.8622.8831.30
a
81.0185.370.66a
1.663.529.91a
0.461.28a
0.312.48
52.275.03
228.65105.0011.0752.92
101.691.63
1,935.77
DistributionRural Urban
(percent)
6.691.09a
2.492.45a
9.1515.553.917.230.381.991.802.831.276.840.240.792.240.073.873.180.090.090.240.180.25aa
0.04a
0.010.460.900.08
16.372.170.572.971.640.06
100.00
6.230.51a
0.192.13a
9.8114.152.617.041.282.810.674.232.244.750.101.181.62a
4.194.410.03a
0.090.180.51a
0.020.07a
0.020.132.700.26
11.815.420.572.735.250.08
100.00
Source: Based on Punjab input-output table for 1979/80 (Table 44, Appendix 1).Note: Parts may not add to totals because of rounding.aData are unavailable, as these commodities do not directly enter into the consumption basket.
Since detailed household schedules of expenditure are not available, it is not possibleto use the available data to directly derive the consumption elasticities for variouscommodities. In an earlier study (Bhalla and Chadha 1983) these elasticities werederived on the basis of a survey of 1,663 rural households conducted in 1975/76. Asexpected, while the expenditure elasticities were high for clothing (1.8-1.9), footwear(1.5-1.6), services (1.2-1.3), milk and milk products (1.3-1.4), and beverages (1.4-1.6),they were quite low for cereals, edible oils, and other essentials. Details are given inTable 21.
52
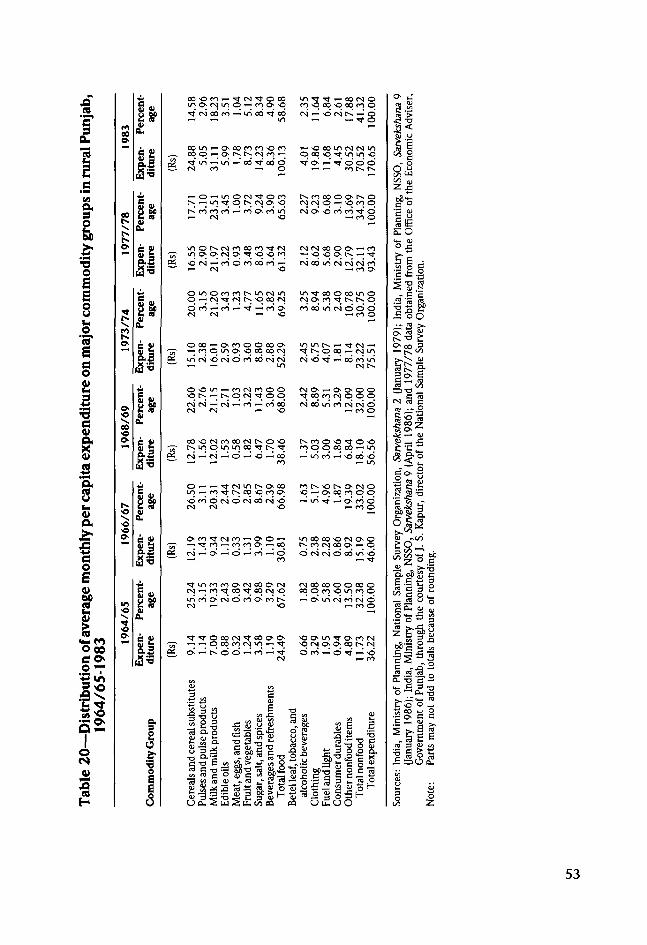
8ft
y
s.
IIg
LDO'— co o
— -o (N r- — O— — t o
coin^-ooorocooco ~ - s
f s j c o ^ o ~-^coc-^ r^
— ro o
~ <N 00 in <N <N <N CO
co oo iri CN o oo
o o o— ro O
ooo — o -coooooo - K i m S H ' , . .
O-O in — CO o) CO O O <M O ^- O O- O O< ) t ^ ^ r ^ p ( S ^ p p TfoOfONOOO<N<N tS^CO"CO00CM (N — O
CO-ONrtCONNO-O M<1001t0 '0•- " - — coppooco^-in
' —'• <> CO -O— m
o o r j o— O; CO ro p p" O- fO O
— CO O
[rHronOv^-oo C^cO(Slooo^-0
- CO ~ t
_ - . . . (NOOOOOOCOOI —< co -q; eq - J; oq <N) -q oq o co o in co o
CN ^- o r-coo
>-^^J; <>rvjO;0;oor-.(N• ^ o co ^ o * ^ ^
<N — CO
ca;
s i l l 8"-asti HIP
"-^^^^lic^m « GtSuo
rt^-
53
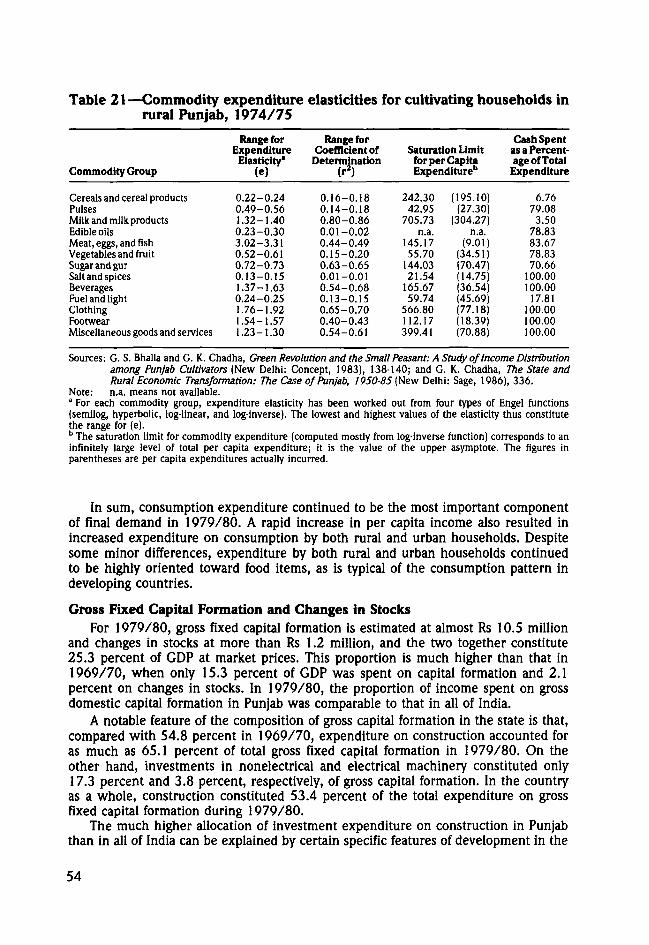
Table 21—Commodity expenditure elasticities for cultivating households inrural Punjab, 1974/75
Commodity Group
Cereals and cereal productsPulsesMilk and milk productsEdible oilsMeat, eggs, and fishVegetables and fruitSugar and gurSalt and spicesBeveragesFuel and lightClothingFootwearMiscellaneous goods and services
Range forExpenditure
Elasticity*(e)
0.22-0.240.49-0.561.32-1.400.23-0.303.02-3.310.52-0.610.72-0.730.13-0.151.37-1.630.24-0.251.76-1.921.54-1.571.23-1.30
Range forCoefficient of
Determination(r2)
0.16-0.180.14-0.180.80-0.860.01-0.020.44-0.490.15-0.200.63-0.650.01-0.010.54-0.680.13-0.150.65-0.700.40-0.430.54-0.61
Saturation Limitfor per CapitaExpenditure"
242.3042.95
705.73n.a.
145.1755.70
144.0321.54
165.6759.74
566.80112.17399.41
(195.10)(27.30)
(304.27)n.a.
(9.01)(34.51)(70.47)(14.75)(36.54)(45.69)(77.18)(18.39)(70.88)
Cash Spentas a Percent-age of Total
Expenditure
6.7679.08
3.5078.8383.6778.8370.66
100.00100.00
17.81100.00100.00100.00
Sources: G. S. Bhalla and G. K. Chadha, Green Revolution and the Small Peasant: A Study of Income Distributionamong Punjab Cultivators (New Delhi: Concept, 1983), 138-140; and G. K. Chadha, The State andRural Economic Transformation: The Case of Punjab, 1950-85(New Delhi: Sage, 1986), 336.
Note: n.a. means not available.a For each commodity group, expenditure elasticity has been worked out from four types of Engel functions(semilog, hyperbolic, log-linear, and log-inverse). The lowest and highest values of the elasticity thus constitutethe range for (e).b The saturation limit for commodity expenditure (computed mostly from log-inverse function) corresponds to aninfinitely large level of total per capita expenditure; it is the value of the upper asymptote. The figures inparentheses are per capita expenditures actually incurred.
In sum, consumption expenditure continued to be the most important componentof final demand in 1979/80. A rapid increase in per capita income also resulted inincreased expenditure on consumption by both rural and urban households. Despitesome minor differences, expenditure by both rural and urban households continuedto be highly oriented toward food items, as is typical of the consumption pattern indeveloping countries.
Gross Fixed Capital Formation and Changes in StocksFor 1979/80, gross fixed capital formation is estimated at almost Rs 10.5 million
and changes in stocks at more than Rs 1.2 million, and the two together constitute25.3 percent of GDP at market prices. This proportion is much higher than that in1969/70, when only 15.3 percent of GDP was spent on capital formation and 2.1percent on changes in stocks. In 1979/80, the proportion of income spent on grossdomestic capital formation in Punjab was comparable to that in all of India.
A notable feature of the composition of gross capital formation in the state is that,compared with 54.8 percent in 1969/70, expenditure on construction accounted foras much as 65.1 percent of total gross fixed capital formation in 1979/80. On theother hand, investments in nonelectrical and electrical machinery constituted only17.3 percent and 3.8 percent, respectively, of gross capital formation. In the countryas a whole, construction constituted 53.4 percent of the total expenditure on grossfixed capital formation during 1979/80.
The much higher allocation of investment expenditure on construction in Punjabthan in all of India can be explained by certain specific features of development in the
54
state. During the 1960s, because of exceptionally high levels of profitability in theadoption of new technology, the cultivators undertook large investments in tubewells,tractors, other agricultural machinery, farm houses, and other construction. Since thelife of agricultural machinery is quite long and a great deal of investment was undertakenduring the 1960s and 1970s, further investment in machinery seems to be petering out.
Further, during the late 1970s, gross fixed investment in agriculture was charac-terized by an unusually high component of construction. For example, a room isnormally constructed along with a tubewell, and a shed accompanies the purchase ofa tractor. Large investments have also been undertaken in the construction of godownsand warehouses by both the central and the state governments, by public sector agencies,and by private individuals for the storage of wheat and rice surpluses. Finally, in thesocioeconomic context of Punjab, where a very high priority is accorded to residentialhouses, increased incomes have resulted in larger investments in residential construction.
Exports and ImportsThe Punjab continues to be a highly export-surplus economy. In 1979/80 exports
constituted as much as 80.3 percent of the total GDP compared with 49.3 percent in1969/70 (Table 17). On the other hand, the share of imports also increased—to 63.5percent of GDP in 1979/80 from only 25.4 percent in 1969/70. But despite largeimports in 1979/80, the balance of trade had a net surplus of more than Rs 7.7 billion,or 16.8 percent of GDP. In 1969/70, the net surplus of the economy was almost Rs 3.4billion, or 23.9 percent of GDP. Agricultural commodities continue to be important inthe export basket; in 1979/80 they constituted 33.8 percent of all exports. Animalhusbandry contributed another 6.4 percent to total exports. Within the agriculturalsector, wheat and rice together accounted for 27.3 percent of total exports from the state.
During the 1970s some of the manufacturing industries also made significant con-tributions to exports, and some of these found an export market not only in the restof India but in foreign countries as well. Consequently, manufactures remained impor-tant in the export market, contributing nearly 43 percent to total exports comparedwith about 42 percent in 1969/70. Within manufacturing, the sectors that contributedfairly large proportions to exports are basic metals and alloys (8.8 percent), otherchemicals (9.9 percent), textiles (5.0 percent), bicycles (3.3 percent), and motor vehicles(1.9 percent). Large exports also took place from the tertiary sector, with trade andtransport accounting for 5.9 percent and other services for 11.5 percent of total exportsfrom Punjab.
With modernization of agriculture and industry, growth of income, and a growinginterrelationship with the rest of the country, imports have also risen at a rapid rate.For example, at current prices, competitive imports amounted to more than Rs 2.2billion and noncompetitive imports to about Rs 1.3 billion in 1969/70. The totalimports into the state's economy in 1979/80 were almost Rs 23.0 billion for competitiveand Rs 6.3 billion for noncompetitive imports. As is to be expected, a major proportionof imports were used up as inputs for agricultural production, followed by industrialproduction. For example, the largest imports were those of basic chemicals and fertilizersand other chemicals, which accounted for 29 percent of total imports into Punjab.These were followed by basic metals and alloys, electrical and nonelectrical machinery,and nonmetallic mineral products. As in 1969/70, most of the noncompetitive importsconsisted of diesel oil, petrol, and other petroleum products.
A peculiar feature of the manufacturing sector in Punjab is that because of nonavail-ability of raw materials, except in agriculture-based industry, most of the industrialraw materials such as iron and steel, coal, diesel, and petroleum needed for basic
55
metals, machine tools, and durable consumer goods industries are imported from therest of India. These raw materials are used to produce manufactured goods that areprimarily exported to the rest of the country. A significant development that has resultedin considerable reduction in imports is the establishment of two large fertilizer plantsin the public sector in Punjab.
Within the consumption basket, imports included drugs and Pharmaceuticals (7.8percent); other agriculture, mainly wood (5.5 percent); dairy products and confectionery(4.0 percent); edible oils (3.6 percent); sugar (2.5 percent); rubber and leather products(3.0 percent); and textiles (4.7 percent).
56
LINKAGE ANALYSIS OF THEPUNJAB ECONOMY
The Punjab input-output tables for 1969/70 (Alagh, Bhalla, and Kashyap 1980)and 1979/80 (Appendix 1, Table 44) were used in Chapter 4 to analyze the mainfeatures and changes in the structure of the Punjab economy during 1969/70-1979/80.One of the important uses of an input-output table is to lay bare the structure ofproduction in an economy and the interdependencies between various sectors.
This chapter examines the nature and extent of sectoral interdependence in Punjabthrough calculation of the direct and indirect input use and output disposal of eachsector. In particular, an attempt will be made to quantify the relationship betweenagriculture and the nonagricultural sectors of the Punjab economy.
Some notable attempts have been made to analyze the relationship between agricul-tural growth and industrial development by defining the major points of influence andby quantifying the various relationships between the two sectors (see Rangarajan 1982).It is beyond the scope of this report to build an econometric model with a new viewto undertaking a comprehensive study of production, demand, and savings and invest-ment types of linkages through which agriculture influences industry or vice versa.However, the input-output analysis does permit quantification of the extent of intersec-toral interdependence, including backward and forward linkages.
An input-output table only quantifies the direct and indirect dependence of varioussectors on one another within a general equilibrium framework without implying anycausality of relationships. It appears that some of the causal hypotheses advanced bysome scholars using this framework may lack much theoretical validity.
Before an in-depth analysis of the pattern of linkages is undertaken for all 39 sectorsin the 1979/80 Punjab input-output table, an overview of the interrelationships amongvarious sectors in the Punjab economy is provided by aggregating the 39 sectors intoonly 5 sectors. The Indian input-output table for 1979/80 (India, Planning Commission1981) has also been condensed into 5 equivalent sectors to bring out the main differ-ences in the structure of production in Punjab and in India as a whole. This is followedby a detailed analysis of changes in the linkage patterns in Punjab during 1969/70-1979/80.The pattern of backward and forward linkages and changes therein have been studiedby use of the Rasmussen method, working out Rasmussen indices separately for 1969/70and 1979/80 for all the disaggregated sectors contained in the Punjab input-outputtables for these years.
An Overview of Agriculture-Nonagriculture LinkagesThe extent of intersectoral linkages depends on the density of the input structure
of various sectors in an economy. That the production structure of agriculture in Punjabis different from that in the rest of the country is brought out by a comparison of thecondensed five-sector input-output flow and coefficient tables for Punjab and India for1979/80 (Tables 22-25). Some of the differences are detailed below.
First, whereas intermediate inputs (including such inputs as noncompetitive imports)constituted 24.8 percent of the value of agricultural output in India, their share was
57
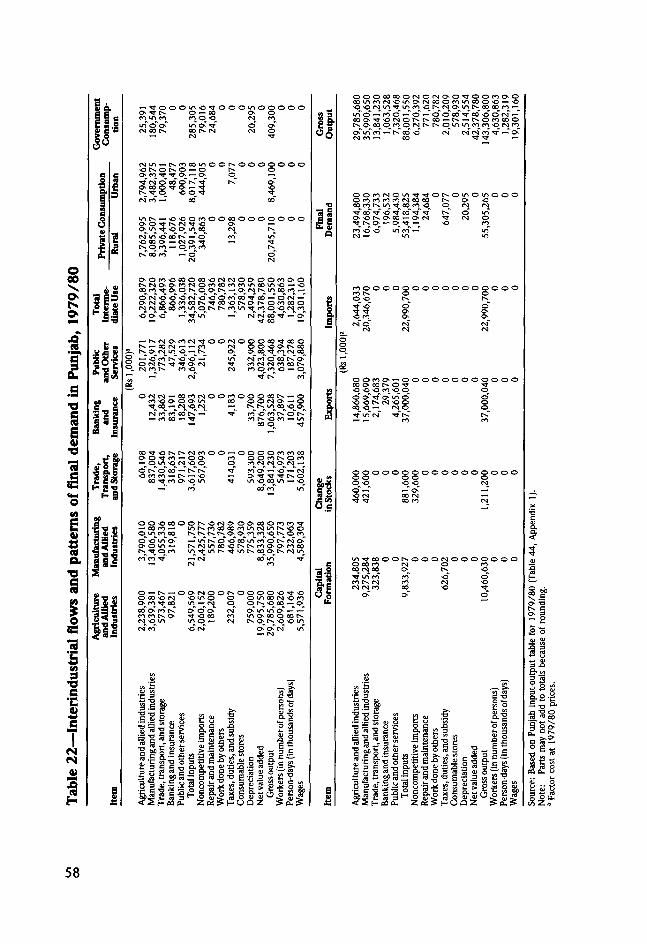
p" »
Nifl-NWCOmOONO N O N O - O t*-.
r-fin" -©"oo't-C-^©" co"
rCoo'rn' —"o"
4
1ifXIsoc
OMO'Ocom^O'OSOO' rs ^- o> N M ^ <o rt r-CT (N O^ <T fi" O O O PT 00 ^ " 0 0 ^ " cT <vf
i30)
I
— f* (N
tsntN
o PO
so^>
« PO
PO >O
JNOOOeo^ooO
T o" oo" i
-S-OaNOONOOCN -O m O O
l c""l *t °*! "I^.**! G-" T " C T " ^ o" in" in" o"'—" ^m o oo o oo c
II ID" o" " ro" o" -" cT —"OOO^OtSONN
3 PO ~-5"o"f>r—*"
g r<f PO ^ ^T
t oo M
POOOOOOOOOOOOOOOOOPO r- o o
£OOPOO-^OOOOOOOOOOOO00 O> 00 t-* O Tf ^
>ooooooooooooooo
mO 0oo o
60,
10,4
S.44
,
•sP
/80
ing.
— -a ^
58
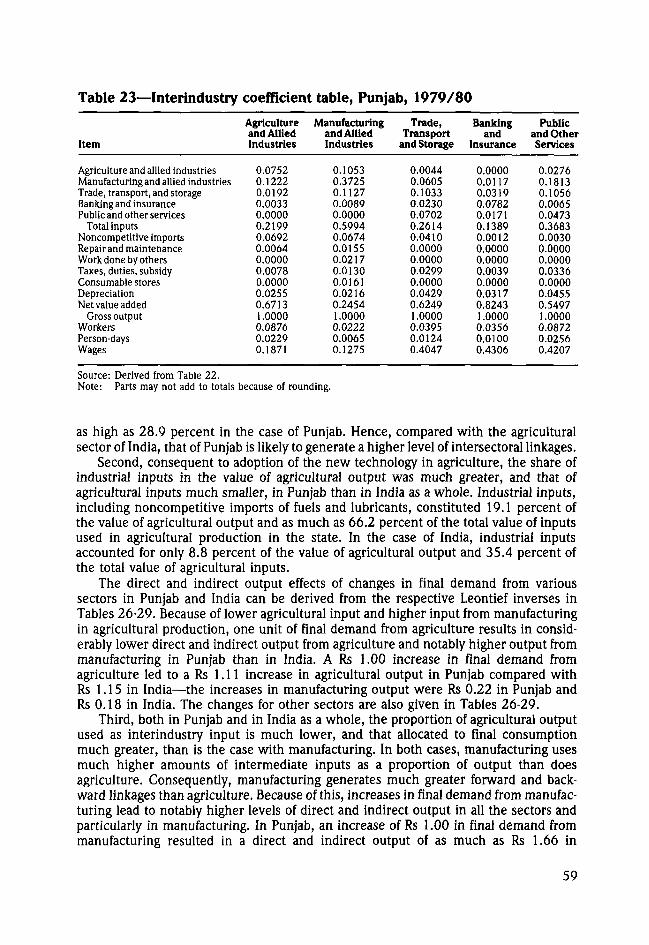
Table 23—Interindustry coefficient table, Punjab, 1979/80
Item
Agriculture and allied industriesManufacturing and allied industriesTrade, transport, and storageBanking and insurancePublic and other services
Total inputsNoncompetitive importsRepair and maintenanceWork done by othersTaxes, duties, subsidyConsumable storesDepreciationNet value added
Gross outputWorkersPerson-daysWages
Agricultureand AlliedIndustries
0.07520.12220.01920.00330.00000.21990.06920.00640.00000.00780.00000.02550.67131.00000.08760.02290.1871
Manufacturingand AlliedIndustries
0.10530.37250.11270.00890.00000.59940.06740.01550.02170.01300.01610.02160.24541.00000.02220.00650.1275
Trade,Transport
and Storage
0.00440.06050.10330.02300.07020.26140.04100.00000.00000.02990.00000.04290.62491.00000.03950.01240.4047
Bankingand
Insurance
0.00000.01170.03190.07820.01710.13890.00120.00000.00000.00390.00000.03170.82431.00000.03560.01000.4306
Publicand OtherServices
0.02760.18130.10560.00650.04730.36830.00300.00000.00000.03360.00000.04550.54971.00000.08720.02560.4207
Source: Derived from Table 22.Note: Parts may not add to totals because of rounding.
as high as 28.9 percent in the case of Punjab. Hence, compared with the agriculturalsector of India, that of Punjab is likely to generate a higher level of intersectoral linkages.
Second, consequent to adoption of the new technology in agriculture, the share ofindustrial inputs in the value of agricultural output was much greater, and that ofagricultural inputs much smaller, in Punjab than in India as a whole. Industrial inputs,including noncompetitive imports of fuels and lubricants, constituted 19.1 percent ofthe value of agricultural output and as much as 66.2 percent of the total value of inputsused in agricultural production in the state. In the case of India, industrial inputsaccounted for only 8.8 percent of the value of agricultural output and 35.4 percent ofthe total value of agricultural inputs.
The direct and indirect output effects of changes in final demand from varioussectors in Punjab and India can be derived from the respective Leontief inverses inTables 26-29. Because of lower agricultural input and higher input from manufacturingin agricultural production, one unit of final demand from agriculture results in consid-erably lower direct and indirect output from agriculture and notably higher output frommanufacturing in Punjab than in India. A Rs 1.00 increase in final demand fromagriculture led to a Rs 1.11 increase in agricultural output in Punjab compared withRs 1.15 in India—the increases in manufacturing output were Rs 0.22 in Punjab andRs 0.18 in India. The changes for other sectors are also given in Tables 26-29.
Third, both in Punjab and in India as a whole, the proportion of agricultural outputused as interindustry input is much lower, and that allocated to final consumptionmuch greater, than is the case with manufacturing. In both cases, manufacturing usesmuch higher amounts of intermediate inputs as a proportion of output than doesagriculture. Consequently, manufacturing generates much greater forward and back-ward linkages than agriculture. Because of this, increases in final demand from manufac-turing lead to notably higher levels of direct and indirect output in all the sectors andparticularly in manufacturing. In Punjab, an increase of Rs 1.00 in final demand frommanufacturing resulted in a direct and indirect output of as much as Rs 1.66 in
59
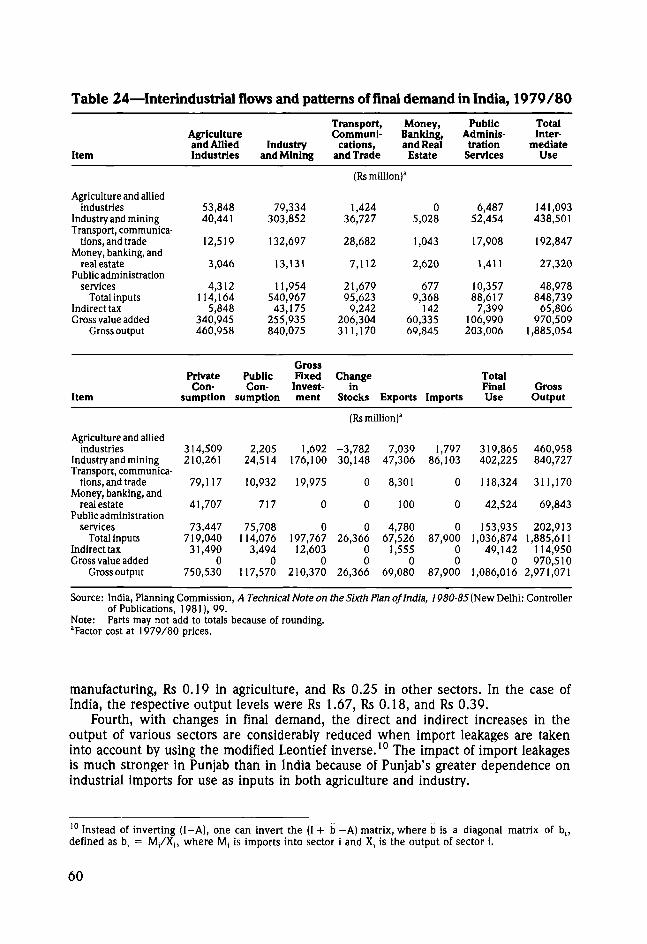
Table 24—Interindustrial flows and patterns of final demand in India, 1979/80
Item
Agriculture and alliedindustries
Industry and miningTransport, communica-
tions, and tradeMoney, banking, and
real estatePublic administration
servicesTotal inputs
Indirect taxGross value added
Gross output
Item
Agriculture and alliedindustries
Industry and miningTransport, communica-
tions, and tradeMoney, banking, and
real estatePublic administration
servicesTotal inputs
Indirect taxGross value added
Gross output
Agricultureand AlliedIndustries
53,84840,441
12,519
3,046
4,312114,164
5,848340,945460,958
PrivateCon-
Industryand Mining
79,334303,852
132,697
13,131
11,954540,96743,175
255,935840,075
GrossPublic FixedCon- Invest-
sumption sumption merit
314,509210,261
79,117
41,707
73,447719,040 1
31,4900
2,205 1,69224,514 176,100
10,932 19,975
717 0
75,708 014,076 197,7673,494 12,603
0 0750,530 117,570 210,370
Transport,Communi-
cations,and Trade
Money,Banking,and Real
Estate
(Rs million)3
1,42436,727
28,682
7,112
21,67995,623
9,242206,304311,170
Changein
Stocks 1
05,028
1,043
2,620
6779,368
14260,33569,845
Exports Imports
(Rs million)3
-3,78230,148
0
0
026,366
00
26,366
7,039 1,79747,306 86,103
8,301 0
100 0
4,780 067,526 87,900
1,555 00 0
69,080 87,900
PublicAdminis-
trationServices
6,48752,454
17,908
1,411
10,35788,617
7,399106,990203,006
TotalFinal
i Use
319,865402,225
118,324
42,524
153,9351,036,874
49,1420
1,086,016
TotalInter-
mediateUse
141,093438,501
192,847
27,320
48,978848,739
65,806970,509
1,885,054
GrossOutput
460,958840,727
311,170
69,843
202,9131,885,611
114,950970,510
2,971,071
Source: India, Planning Commission, A Technical Note on the Sixth Plan of India, 1980-85 (New Delhi: Controllerof Publications, 1981), 99.
Note: Parts may not add to totals because of rounding.'Factor cost at 1979/80 prices.
manufacturing, Rs 0.19 in agriculture, and Rs 0.25 in other sectors. In the case ofIndia, the respective output levels were Rs 1.67, Rs 0.18, and Rs 0.39.
Fourth, with changes in final demand, the direct and indirect increases in theoutput of various sectors are considerably reduced when import leakages are takeninto account by using the modified Leontief inverse.10 The impact of import leakagesis much stronger in Punjab than in India because of Punjab's greater dependence onindustrial imports for use as inputs in both agriculture and industry.
10 Instead of inverting (I-A), one can invert the (I + b -A) matrix, where b is a diagonal matrix of b,,defined as b, = M/X|, where M( is imports into sector i and X, is the output of sector i.
60
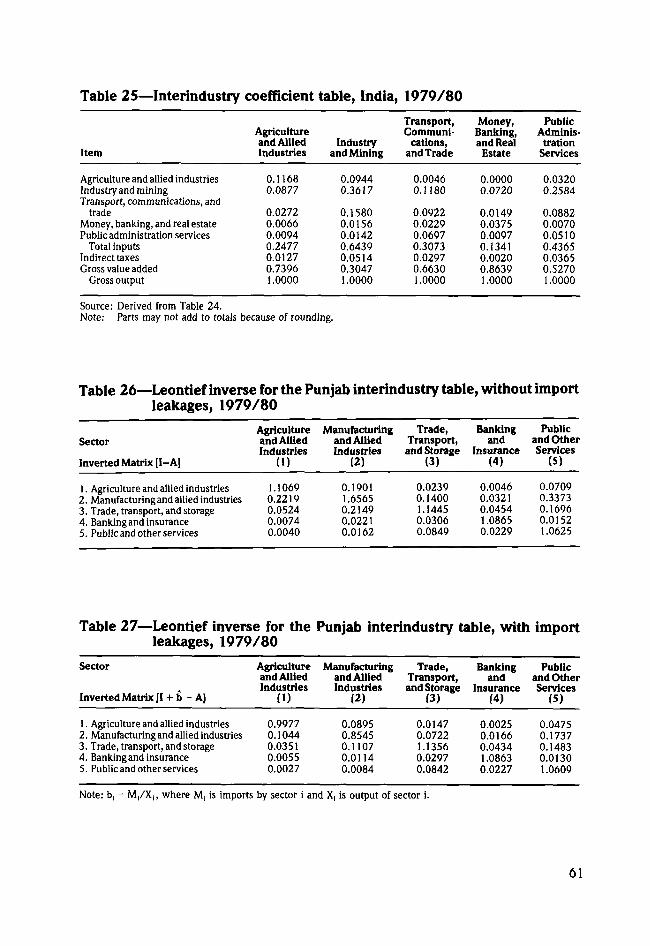
Table 25—Interindustry coefficient table, India, 1979/80
Item
Agriculture and allied industriesIndustry and miningTransport, communications, and
tradeMoney, banking, and real estatePublic administration services
Total inputsIndirect taxesGross value added
Gross output
Agricultureand AlliedIndustries
0.11680.0877
0.02720.00660.00940.24770.01270.73961.0000
Industryand Mining
0.09440.3617
0.15800.01560.01420.64390.05140.30471.0000
Transport,Communi-
cations,and Trade
0.00460.1180
0.09220.02290.06970.30730.02970.66301.0000
Money,Banking,and RealEstate
0.00000.0720
0.01490.03750.00970.13410.00200.86391.0000
PublicAdminis-
trationServices
0.03200.2584
0.08820.00700.05100.43650.03650.52701.0000
Source: Derived from Table 24.Note: Parts may not add to totals because of rounding.
Table 26—Leontief inverse for the Punjab interindustry table, without importleakages, 1979/80
Sector
Inverted Matrix [I-A]
1. Agriculture and allied industries2. Manufacturing and allied industries3. Trade, transport, and storage4. Banking and insurance5. Public and other services
Agricultureand AlliedIndustries
(1)
1.10690.22190.05240.00740.0040
Manufacturingand AlliedIndustries
(2)
0.19011.65650.21490.02210.0162
Trade,Transport,and Storage
(3)
0.02390.14001.14450.03060.0849
Bankingand
Insurance(4)
0.00460.03210.04541.08650.0229
Publicand OtherServices
(5)
0.07090.33730.16960.01521.0625
Table 27—Leontief inverse for the Punjab interindustry table, with importleakages, 1979/80
Sector
Inverted Matrix fl + b - A]
Agriculture Manufacturing Trade, Banking Publicand Allied and Allied Transport, and and OtherIndustries Industries and Storage Insurance Services
(1) (2) (3) (4) (5)
1. Agriculture and allied industries2. Manufacturing and allied industries3. Trade, transport, and storage4. Banking and insurance5. Public and other services
0.99770.10440.03510.00550.0027
0.08950.85450.11070.01140.0084
0.01470.07221.13560.02970.0842
0.00250.01660.04341.08630.0227
0.04750.17370.14830.01301.0609
Note: b, = M/X,, where M, is imports by sector i and X, is output of sector i.
61
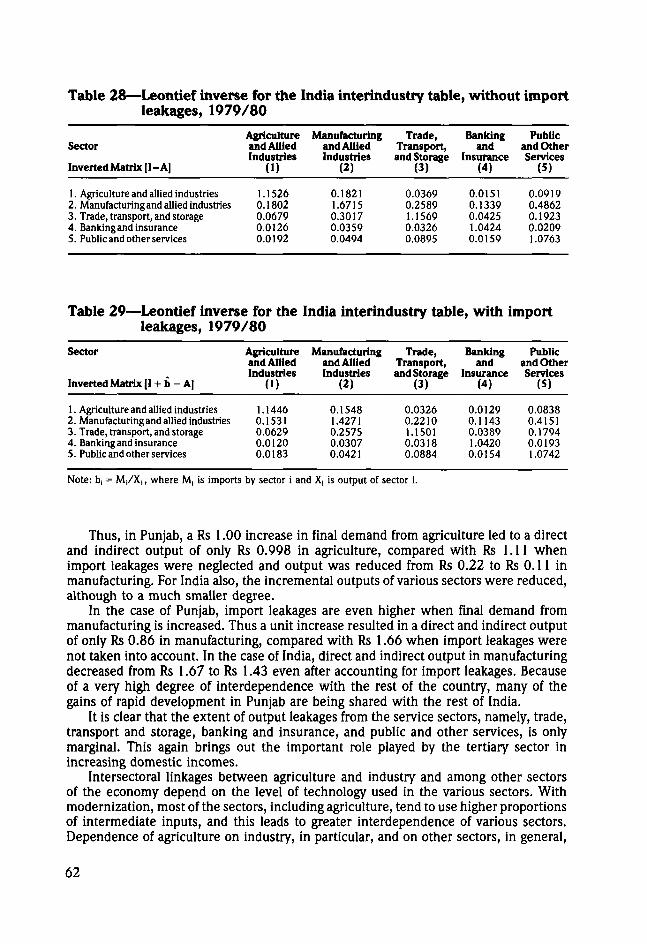
Table 28—Leontief inverse for the India interindustry table, without importleakages, 1979/80
Sector
Inverted Matrix [I-A|
1. Agriculture and allied industries2. Manufacturing and allied industries3. Trade, transport, and storage4. Banking and insurance5. Public and other services
Agricultureand AlliedIndustries
(1)
1.15260.18020.06790.01260.0192
Manufacturingand AlliedIndustries
(2)
0.18211.67150.30170.03590.0494
Trade,Transport,and Storage
(3)
0.03690.25891.15690.03260.0895
Bankingand
Insurance(4)
0.01510.13390.04251.04240.0159
Publicand OtherServices
(5)
0.09190.48620.19230.02091.0763
Table 29—Leontief inverse for the India interindustry table, with importleakages, 1979/80
Sector
Inverted Matrix |I + b - A]
1. Agriculture and allied industries2. Manufacturing and allied industries3. Trade, transport, and storage4. Banking and insurance5. Public and other services
Agricultureand AlliedIndustries
(1)
1.14460.15310.06290.01200.0183
Manufacturingand AlliedIndustries
(2)
0.15481.42710.25750.03070.0421
Trade,Transport,and Storage
(3)
0.03260.22101.15010.03180.0884
Bankingand
Insurance(4)
0.01290.11430.03891.04200.0154
Publicand OtherServices
(S)
0.08380.41510.17940.01931.0742
Note: b, = M/X,, where M, is imports by sector i and X, is output of sector i.
Thus, in Punjab, a Rs 1.00 increase in final demand from agriculture led to a directand indirect output of only Rs 0.998 in agriculture, compared with Rs 1.11 whenimport leakages were neglected and output was reduced from Rs 0.22 to Rs 0.11 inmanufacturing. For India also, the incremental outputs of various sectors were reduced,although to a much smaller degree.
In the case of Punjab, import leakages are even higher when final demand frommanufacturing is increased. Thus a unit increase resulted in a direct and indirect outputof only Rs 0.86 in manufacturing, compared with Rs 1.66 when import leakages werenot taken into account. In the case of India, direct and indirect output in manufacturingdecreased from Rs 1.67 to Rs 1.43 even after accounting for import leakages. Becauseof a very high degree of interdependence with the rest of the country, many of thegains of rapid development in Punjab are being shared with the rest of India.
It is clear that the extent of output leakages from the service sectors, namely, trade,transport and storage, banking and insurance, and public and other services, is onlymarginal. This again brings out the important role played by the tertiary sector inincreasing domestic incomes.
Intersectoral linkages between agriculture and industry and among other sectorsof the economy depend on the level of technology used in the various sectors. Withmodernization, most of the sectors, including agriculture, tend to use higher proportionsof intermediate inputs, and this leads to greater interdependence of various sectors.Dependence of agriculture on industry, in particular, and on other sectors, in general,
62
is bound to increase with modernization of agriculture. Similarly, because of relativelyhigh density in the input structure of various sectors, the growth of manufacturing byitself is bound to increase interdependence among them. In short, the pattern of linkagesamong sectors is determined by the nature of structural changes in the productionpattern. It is apparent that the extent of import leakages is quite high in the case ofmanufacturing in Punjab. This indicates that the scope for further development ofagro-input as well as agroprocessing industries merits careful examination.
Intersectoral Linkages—Disaggregated AnalysisThis section will discuss the nature of inducement effects that are the outcome of
interlinkages among all 39 producing sectors contained in the 1979/80 Punjab input-output table and the 36 sectors in the 1969/70 table. Expansion of an industry leadsto a series of effects due to interlinkages. The first-order effects are felt by the directinput-supplying industries, which in turn affect the activities that supply inputs to theindustries affected in the first round, and the process continues until it fades out. Thedegree of responsiveness depends upon the nature of the industry that is affectedinitially, as well as the extent to which the system of industries shows an integratedor a decomposable structure. The main point is that different industries have variedinducements in the economy, depending upon the strength of linkages.
One of the important objectives of all developing countries is to achieve rapidgrowth in their per capita incomes. Since high per capita income is associated with arising share of industry in GDP, the acknowledged strategy for achieving this objectiveis to accelerate the process of industrialization. It is in this context that a great dealof debate has taken place about the criteria for choosing the optimal set of industriesin the process of industrialization. One school of thought has argued that the extentof forward and backward linkages should constitute the most important basis for thischoice. The industrialization process can be carried out in a number of ways.
The original suggestion of some authors (see, for example, Hirschman 1985) wasto rank sectors by their potential stimuli for growth via the inducement mechanismand to select for promotion those key sectors that had the highest backward and forwardlinkages. This corresponds to what may be termed ex-ante linkage analysis and shouldbe based on technology coefficients (a ) (Blumer-Thomas 1978). It is argued that thebenefits of production stimuli provided by the backward and forward linkages generallyrepresent an externality and may not be reflected in the market prices. Consequently,the social benefits of investments with high backward and forward linkages couldexceed the private benefits.
Hirschman (1985) proposed developing those sectors that ranked high in terms oflinkages in the developed countries. This proposal was based on the finding that therewas considerable similarity in the pattern of sectoral interdependence between thedeveloping and the advanced industrial countries (Chenery and Watanabe 1958),suggesting that there is indeed something like a fundamental structure of production(Simpson and Tsukui 1965). This approach may be applicable only if the developingcountries show an interdependence pattern approximate to that found in developedcountries today. For this to be so, a number of assumptions need to be made, such as(1) the commodity composition of the underdeveloped country's output has somestructural resemblance to that of the country on whose input-output tables we performthe statistics; and (2) any real choice of techniques is absent.
Raj (1975) has argued that neither of these assumptions was realistic, and evenwith rising incomes, consumer demand in less-developed countries could fail to approx-
63
imate that in developed countries because of differences in such matters as tastes,distribution of income, relative prices, and historical traditions. Thus, sectoral inter-dependence and the path to industrialization in developing countries are not necessarilymirrored in developed countries.
Hirschman (1985) realized that there was no guarantee that the potential stimulusmeasured by backward and forward linkages would be translated into actual growth;the stimulus might simply be absorbed as increased imports, higher prices, or under-utilized capacity unless certain conditions were met. These conditions include theexistence of a minimum market size consistent with capacity expansion, availabilityof complementary inputs (such as credit and skilled labor), and government policiesconsistent with the ranking of sectors. That sectoral linkages do not necessarily providea stimulus to growth was brought out in a major study of linkages for several countriesundertaken by Panchmukhi (1975). For example, he found that the simple correlationcoefficient between the size of linkages and capacity underutilization in India wassignificant and positive, suggesting that in the absence of a rapid increase in theirdomestic demand, the expansion of sectors with high linkages may simply producespare capacity rather than growth stimulus. In another study of Central America (Blumer-Thomas 1976), it was found that the difference between potential and actual linkagesover a five-year period had not narrowed, indicating that government policy and thestructure of protection were not conducive to expansion of supplying industries at theexpense of imports. In such cases the only alternative would be to take policy measuresthat increase domestic demand for the products of these sectors.
A more fundamental set of objections to linkage analysis can be considered. Indus-trialization is not usually considered as an objective in itself, but as a proxy for the risein real incomes that is supposed to accompany it. If, however, real income growth percapita is considered as the main objective, then each investment needs to be evaluatedin terms of its direct and indirect effects on income rather than on output. Panchmukhi(1975) made clear that output increases do not necessarily lead to increases in income,and in fact, there is an inverse relationship between a sector's output and incomemultiplier effects. This suggests that the selection of key sectors by reference to theirinput and output linkage indices may not satisfy the income generation objective. It isalso possible that the sectors with high backward linkages may have a high dependenceon intermediate goods, which are typically capital-intensive. In that case, linkage analysiswould suggest that priority be given to sectors that, directly or indirectly, are capital-intensive. This strategy would obviously not be suitable for developing countries withlimited access to capital.
Finally, there is no consideration of efficiency or comparative costs in the selectionof "key" sectors chosen with reference to linkage indices. This is particularly seriousin cases where much of the potential stimulus provided by expansion of a key sectoris translated into growth through a deliberate policy of import substitution. Linkageanalysis does not permit a distinction between the cases where (1) the stimulus islarge enough to justify establishing a supplying or using industry that is efficient; and(2) the stimulus is large enough to justify establishing a supplying or using industrythat is not efficient. In the first case, government policy should ensure that the stimulusis translated into growth, while in the second, it should do so only if the subsidy neededto make the activity competitive is justified by other criteria.
Not all potential linkages can be translated into actual linkages. This suggests theneed for a modified form of linkage analysis in which technological coefficients areappropriately adjusted, keeping in view the specific constraints in a country that tendto reduce the impact of growth stimuli. These constraints may be determined by
64
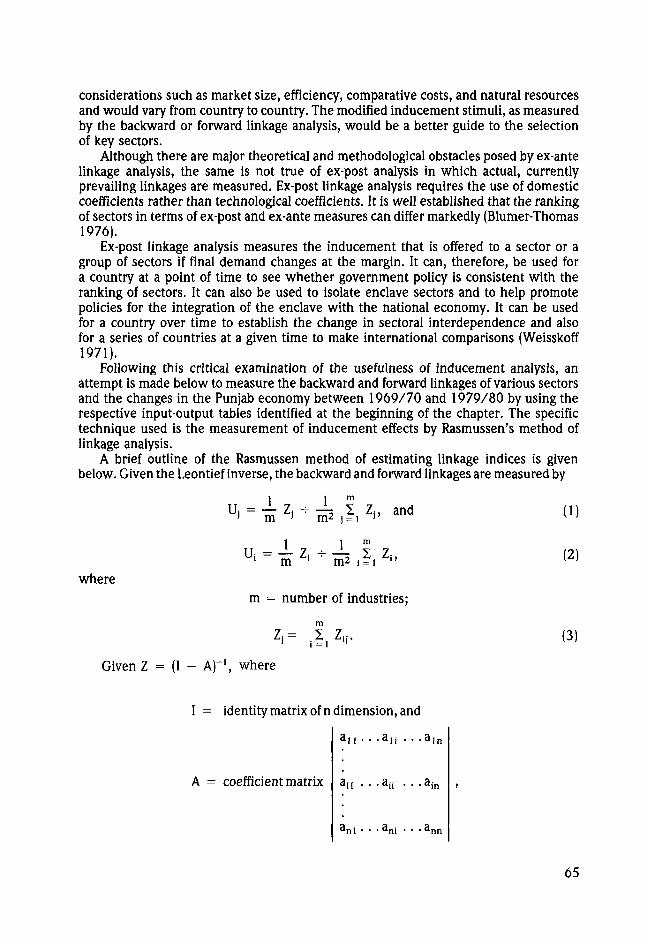
considerations such as market size, efficiency, comparative costs, and natural resourcesand would vary from country to country. The modified inducement stimuli, as measuredby the backward or forward linkage analysis, would be a better guide to the selectionof key sectors.
Although there are major theoretical and methodological obstacles posed by ex-antelinkage analysis, the same is not true of ex-post analysis in which actual, currentlyprevailing linkages are measured. Ex-post linkage analysis requires the use of domesticcoefficients rather than technological coefficients. It is well established that the rankingof sectors in terms of ex-post and ex-ante measures can differ markedly (Blumer-Thomas1976).
Ex-post linkage analysis measures the inducement that is offered to a sector or agroup of sectors if final demand changes at the margin. It can, therefore, be used fora country at a point of time to see whether government policy is consistent with theranking of sectors. It can also be used to isolate enclave sectors and to help promotepolicies for the integration of the enclave with the national economy. It can be usedfor a country over time to establish the change in sectoral interdependence and alsofor a series of countries at a given time to make international comparisons (Weisskoff1971).
Following this critical examination of the usefulness of inducement analysis, anattempt is made below to measure the backward and forward linkages of various sectorsand the changes in the Punjab economy between 1969/70 and 1979/80 by using therespective input-output tables identified at the beginning of the chapter. The specifictechnique used is the measurement of inducement effects by Rasmussen's method oflinkage analysis.
A brief outline of the Rasmussen method of estimating linkage indices is givenbelow. Given the Leontief inverse, the backward and forward linkages are measured by
where
1 1 m
Uj = — Zj H- — S^ Zj, and
1 1 m
Ui = "5? Zi ^ 155 , ? ,
m = number of industries;
(1)
(2)
Z i = (3)
Given Z = (I - A)"1, where
I = identity matrix of n dimension, and
a n . . . a n . . .a
A = coefficient matrix
ln
i l • • > a i i • • > a in
. . . a n
65
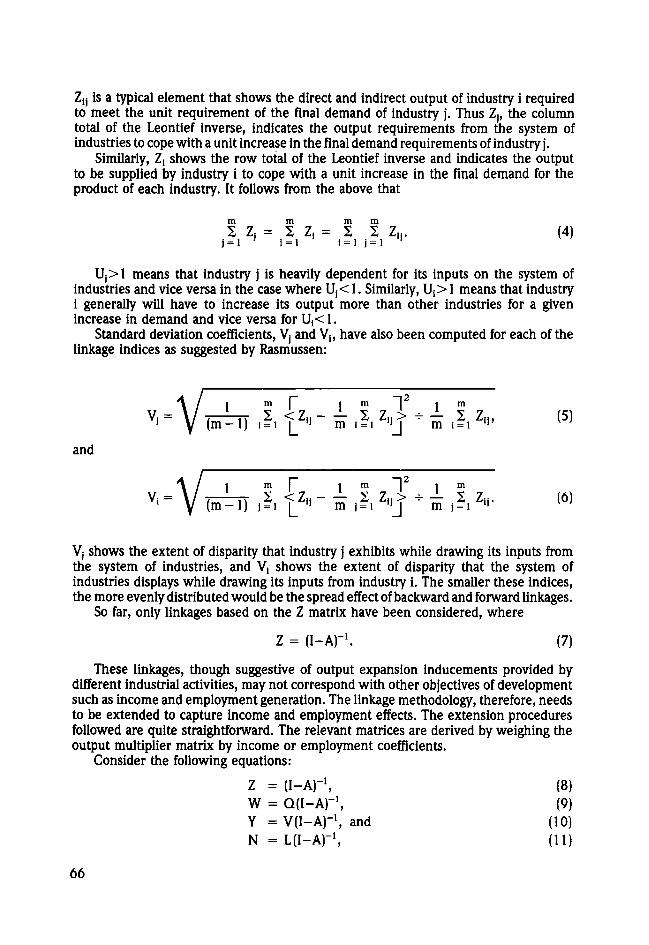
Zu is a typical element that shows the direct and indirect output of industry i requiredto meet the unit requirement of the final demand of industry j . Thus Zj( the columntotal of the Leontief inverse, indicates the output requirements from the system ofindustries to cope with a unit increase in the final demand requirements of industry j .
Similarly, Z, shows the row total of the Leontief inverse and indicates the outputto be supplied by industry i to cope with a unit increase in the final demand for theproduct of each industry. It follows from the above that
tn m mm2 Z, = S Z, = X 2 ZtJ. (4)
i = i ' i = i i = i 1 = 1 '
UJ>1 means that industry j is heavily dependent for its inputs on the system ofindustries and vice versa in the case where Uj< 1. Similarly, U,> 1 means that industryi generally will have to increase its output more than other industries for a givenincrease in demand and vice versa for Ui< 1.
Standard deviation coefficients, Vj and Vj, have also been computed for each of thelinkage indices as suggested by Rasmussen:
V m F m ~]2
V = \ / ' 1 <Z - — 1 Z >V | Xl '- - 1 ) i = i i z " m i = i •» i
and
V i
Vj shows the extent of disparity that industry j exhibits while drawing its inputs fromthe system of industries, and V, shows the extent of disparity that the system ofindustries displays while drawing its inputs from industry i. The smaller these indices,the more evenly distributed would be the spread effect of backward and forward linkages.
So far, only linkages based on the Z matrix have been considered, where
Z = (I-A)-1. (7)
These linkages, though suggestive of output expansion inducements provided bydifferent industrial activities, may not correspond with other objectives of developmentsuch as income and employment generation. The linkage methodology, therefore, needsto be extended to capture income and employment effects. The extension proceduresfollowed are quite straightforward. The relevant matrices are derived by weighing theoutput multiplier matrix by income or employment coefficients.
Consider the following equations:
Z = (I-A)-1, (8)W = Q(I-A)-1, (9)Y = V(I-A)-1, and (10)N = L(I-A)-1, (11)
66
whereZ = output multiplier matrix,Q = diagonal matrix of sectoral wage-output ratio,V = diagonal matrix of sectoral value added-output ratio, andL = diagonal matrix of sectoral labor-output ratio.
Given W, Y, and N matrices, the Ui( Uj and Vj,Vj for each of the matrices can becomputed.
So far, the measurement of linkage indices does not take into account the importleakages. Thus the indices given above provide an idea about the "potential" inducementeffects of different industrial activities. To the extent that noncompetitive imports areexogenously determined in the input-output models, the inevitable leakages are alreadyaccounted for in the above exercises. It may be mentioned that actual linkages realizedby a system of industries would differ from potential linkages where leakages due tocompetitive imports are taken into account. This has been done, and linkage indiceshave also been estimated after allowing for import leakages. A simple methodology isfollowed for allowing import leakages. Let us define
R = (I + b - A)"1, (12)
where b = a diagonal matrix of import coefficients m,, so that
where M; is imports into the ith sector and X; is the output level of the ith sector.
It is apparent that, depending upon the propensity to import, equation (12) allowsfor the fact that some of the input requirements would be met through competitiveimports. Given R matrix, W, Y', and N' matrices can be estimated as follows:
W = Q(I + b - A)"1, (13)
Y' = V(I + b - A)"1, and (14)
N' = L (I + b - A}"1. (15)
These matrices would now give employment and income effects after allowing forimport leakages, and U,, U, and V,, Vi for each of the above matrices can be similarlycomputed.
Estimates of Linkage IndicesImportant changes took place in the structure of the Punjab economy between
1969/70 and 1979/80, as is shown by an analysis of the forward and backward linkagesamong various sectors in the Punjab economy derived from the detailed 1969/70 and1979/80 input-output tables. The estimates of various linkage indices without importleakages and with import leakages are presented along with their ranks in Appendix1, Tables 45 and 46, for the period 1969/70 and in Tables 47 and 48 for 1979/80.The detailed results, as given in these tables, have been summarized in Tables 30 and 31.
In 1969/70 not many sectors showed both high forward and high backward linkageson account of output, income, wages, and employment, with or without import leakages.
67
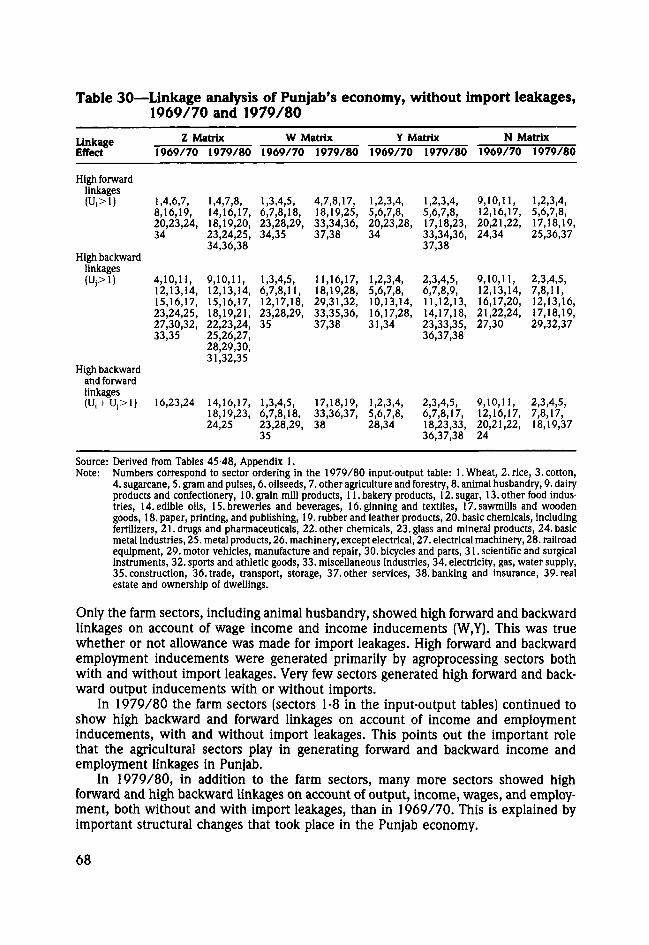
Table 30—Linkage analysis of Punjab's economy, without import leakages,1969/70 and 1979/80
LinkageEffect
Z Matrix W Matrix Y Matrix N Matrix1969/70 1979/80 1969/70 1979/80 1969/70 1979/80 1969/70 1979/80
High forwardlinkages( U 1 )
High backwardlinkages( U 1 )
High backwardand forwardlinkages(U U 1 )
1,4,6,7, 1,4,7,8, 1,3,4,5, 4,7,8,17, 1,2,3,4, 1,2,3,4, 9,10,11, 1,2,3,4,8,16,19, 14,16,17, 6,7,8,18, 18,19,25, 5,6,7,8, 5,6,7,8, 12,16,17, 5,6,7,8,20.23.24, 18,19,20, 23,28,29, 33,34,36, 20,23,28, 17,18,23, 20,21,22, 17,18,19,34 23,24,25, 34,35 37,38 34 33,34,36, 24,34 25,36,37
34,36,38 37,38
4,10,11, 9,10,11, 1,3,4,5, 11,16,17, 1,2,3,4, 2,3,4,5, 9,10,11, 2,3,4,5,12,13,14, 12,13,14, 6,7,8,11, 18,19,28, 5,6,7,8, 6,7,8,9, 12,13,14, 7,8,11,15,16,17, 15,16,17, 12,17,18, 29,31,32, 10,13,14, 11,12,13, 16,17,20, 12,13,16,23.24.25, 18,19,21, 23,28,29, 33,35,36, 16,17,28, 14,17,18, 21,22,24, 17,18,19,27,30,32, 22,23,24, 35 37,38 31,34 23,33,35, 27,30 29,32,3733,35 25,26,27, 36,37,38
28,29,30,31,32,35
16,23,24 14,16,17, 1,3,4,5, 17,18,19, 1,2,3,4, 2,3,4,5, 9,10,11, 2,3,4,5,18,19,23, 6,7,8,18, 33,36,37, 5,6,7,8, 6,7,8,17, 12,16,17, 7,8,17,24,25 23,28,29, 38 28,34 18,23,33, 20,21,22, 18,19,37
35 36,37,38 24
Source: Derived from Tables 45-48, Appendix 1.Note: Numbers correspond to sector ordering in the 1979/80 input-output table: 1. Wheat, 2. rice, 3. cotton,
4. sugarcane, 5. gram and pulses, 6. oilseeds, 7. other agriculture and forestry, 8. animal husbandry, 9. dairyproducts and confectionery, 10. grain mill products, 11. bakery products, 12. sugar, 13. other food indus-tries, 14. edible oils, 15. breweries and beverages, 16. ginning and textiles, 17. sawmills and woodengoods, 18. paper, printing, and publishing, 19. rubber and leather products, 20. basic chemicals, includingfertilizers, 21. drugs and Pharmaceuticals, 22. other chemicals, 23. glass and mineral products, 24. basicmetal industries, 25. metal products, 26. machinery, except electrical, 27. electrical machinery, 28. railroadequipment, 29. motor vehicles, manufacture and repair, 30. bicycles and parts, 31. scientific and surgicalinstruments, 32. sports and athletic goods, 33. miscellaneous industries, 34. electricity, gas, water supply,35. construction, 36. trade, transport, storage, 37. other services, 38. banking and insurance, 39. realestate and ownership of dwellings.
Only the farm sectors, including animal husbandry, showed high forward and backwardlinkages on account of wage income and income inducements (W,Y). This was truewhether or not allowance was made for import leakages. High forward and backwardemployment inducements were generated primarily by agroprocessing sectors bothwith and without import leakages. Very few sectors generated high forward and back-ward output inducements with or without imports.
In 1979/80 the farm sectors (sectors 1-8 in the input-output tables) continued toshow high backward and forward linkages on account of income and employmentinducements, with and without import leakages. This points out the important rolethat the agricultural sectors play in generating forward and backward income andemployment linkages in Punjab.
In 1979/80, in addition to the farm sectors, many more sectors showed highforward and high backward linkages on account of output, income, wages, and employ-ment, both without and with import leakages, than in 1969/70. This is explained byimportant structural changes that took place in the Punjab economy.
68
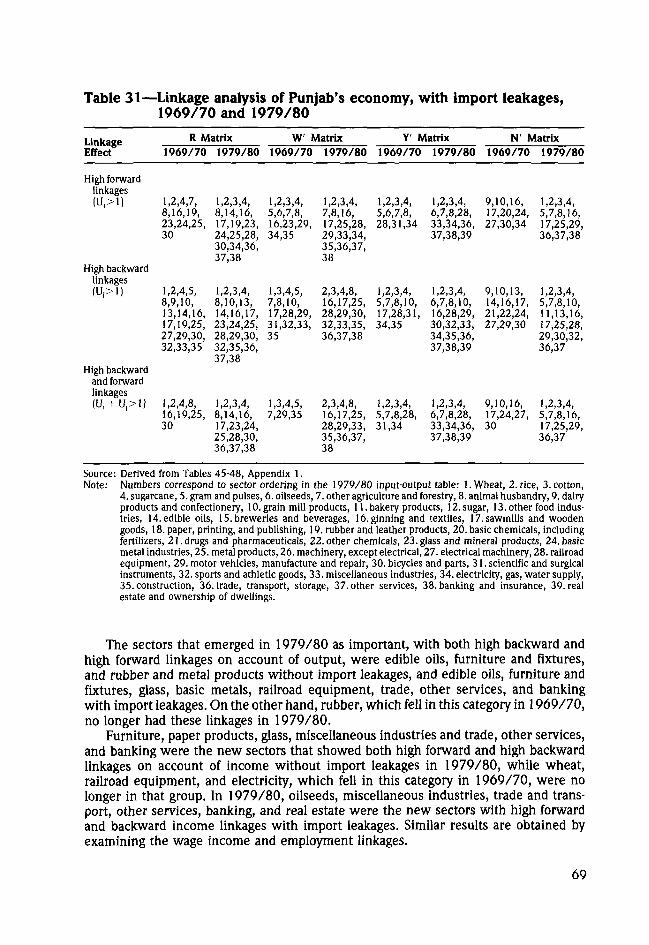
Table 31—Linkage analysis of Punjab's economy, with import leakages,1969/70 and 1979/80
LinkageEffect
High forwardlinkages(U,>1)
High backwardlinkages(U,>1)
High backwardand forward
u images(U, + U,>1)
R Matrix1969/70
1,2,4,7,8,16,19,23,24,25,30
1,2,4,5,8,9,10,13,14,16,17,19,25,27,29,30,32,33,35
1,2,4,8,16,19,25,30
1979/80
1,2,3,4,8,14,16,17,19,23,24,25,28,30,34,36,37,38
1,2,3,4,8,10,13,14,16,17,23,24,25,28,29,30,32,35,36,37,38
1,2,3,4,8,14,16,17,23,24,25,28,30,36,37,38
W Matrix1969/70
1,2,3,4,5,6,7,8,16,23,29,34,35
1,3,4,5,7,8,10,17,28,29,31,32,33,35
1,3,4,5,7,29,35
1979/80
1,2,3,4,7,8,16,17,25,28,29,33,34,35,36,37,38
2,3,4,8,16,17,25,28,29,30,32,33,35,36,37,38
2,3,4,8,16,17,25,28,29,33,35,36,37,38
Y' Matrix1969/70
1,2,3,4,5,6,7,8,28,31,34
1,2,3,4,5,7,8,10,17,28,31,34,35
1,2,3,4,5,7,8,28,31,34
1979/80
1,2,3,4,6,7,8,28,33,34,36,37,38,39
1,2,3,4,6,7,8,10,16,28,29,30,32,33,34,35,36,37,38,39
1,2,3,4,6,7,8,28,33,34,36,37,38,39
N Matrix1969/70
9,10,16,17,20,24,27,30,34
9,10,13,14,16,17,21,22,24,27,29,30
9,10,16,17,24,27,30
1979/80
1,2,3,4,5,7,8,16,17,25,29,36,37,38
1,2,3,4,5,7,8,10,11,13,16,17,25,28,29,30,32,36,37
1,2,3,4,5,7,8,16,17,25,29,36,37
Source: Derived from Tables 45-48, Appendix 1.Note: Numbers correspond to sector ordering in the 1979/80 input-output table: 1. Wheat, 2. rice, 3. cotton,
4. sugarcane, 5. gram and pulses, 6. oilseeds, 7. other agriculture and forestry, 8. animal husbandry, 9. dairyproducts and confectionery, 10. grain mill products, 11. bakery products, 12. sugar, 13. other food indus-tries, 14. edible oils, 15. breweries and beverages, 16. ginning and textiles, 17. sawmills and woodengoods, 18. paper, printing, and publishing, 19. rubber and leather products, 20. basic chemicals, includingfertilizers, 21. drugs and Pharmaceuticals, 22. other chemicals, 23. glass and mineral products, 24. basicmetal industries, 25. metal products, 26. machinery, except electrical, 27. electrical machinery, 28. railroadequipment, 29. motor vehicles, manufacture and repair, 30. bicycles and parts, 31. scientific and surgicalinstruments, 32. sports and athletic goods, 33. miscellaneous industries, 34. electricity, gas, water supply,35. construction, 36. trade, transport, storage, 37. other services, 38. banking and insurance, 39. realestate and ownership of dwellings.
The sectors that emerged in 1979/80 as important, with both high backward andhigh forward linkages on account of output, were edible oils, furniture and fixtures,and rubber and metal products without import leakages, and edible oils, furniture andfixtures, glass, basic metals, railroad equipment, trade, other services, and bankingwith import leakages. On the other hand, rubber, which fell in this category in 1969/70,no longer had these linkages in 1979/80.
Furniture, paper products, glass, miscellaneous industries and trade, other services,and banking were the new sectors that showed both high forward and high backwardlinkages on account of income without import leakages in 1979/80, while wheat,railroad equipment, and electricity, which fell in this category in 1969/70, were nolonger in that group. In 1979/80, oilseeds, miscellaneous industries, trade and trans-port, other services, banking, and real estate were the new sectors with high forwardand backward income linkages with import leakages. Similar results are obtained byexamining the wage income and employment linkages.
69
Regarding high forward linkages, in 1969/70, irrespective of import leakage assump-tions, wheat, sugarcane, other agriculture, and animal husbandry showed high forwardlinkage inducements on account of output, wage income, and income. There were fewnonfarm activities in 1969/70 that had high patterns of forward linkage inducements.Only the forward linkage pattern of electricity showed high output, income, and wageincome inducements with or without import leakages. Similarly, when linkages bothwith and without import leakages were considered, only the forward linkages of basicmetal industries had high employment and output inducements. In 1979/80 the farmsectors, including animal husbandry, showed high forward linkages on all four accounts,namely, output, income, wages, and employment, both with and without import leak-ages. Among the nonagricultural sectors, trade, transport, and storage and servicesshowed high forward linkages on account of employment, income, and wage income,irrespective of import leakages. Similarly, sawmills, metal alloys, trade, transport, andstorage, and services had high forward employment and output inducements.
Not many sectors showed high forward linkages on various counts in both 1969/70and 1979/80. Only electricity showed high forward linkages on output, wage income,and total income inducements in both periods, irrespective of import leakages.
High backward linkages in 1969/70 were also confined to a few sectors. Whenimport leakages were allowed, most of the agricultural sectors, namely, wheat, maize,sugarcane, other agriculture, and animal husbandry, showed high backward linkagesin terms of output, income, and wages, but only two sectors, grain mill products andfurniture and fixtures, showed high backward linkages on all four counts (Z,W,Y,N inTables 30 and 31). Without import leakages, only grain mill products, edible oils, otherfoods, and furniture and fixtures show high output, employment, and income induce-ments (Z, N, Y). In 1979/80 many farm sectors showed high backward linkages withoutimport leakages on account of income and employment. However, only three sectors,bakery products, sawmills, and printing and publishing, showed strong backward link-ages on all four counts (Z,W,Y,N) without import leakages. On the other hand, in1979/80 many sectors—rice, cotton, sugarcane, animal husbandry, textiles, railroadequipment, motor vehicles, bicycles and parts, sports goods, trade, transport, andstorage, and services—showed high backward linkages on all counts (Z,W,Y,N) withimport leakages.
It is obvious that with the development that has taken place, the structure of thePunjab economy has undergone some important changes. In 1979/80 many newsectors showed high backward and high forward linkages, indicating that the economyhad by then started functioning at a higher technological level than it had achievedearlier. It is significant that in 1979/80 the farm and agroprocessing sectors were theones to show a high forward and backward linkage pattern on all counts when importleakages were taken into account. This underlines the importance of agriculture andagriculture-related activities in the state.
Also in 1979/80, in addition to the farm and agroprocessing sectors, many newmanufacturing sectors such as metal and nonmetallic products, machine goods, andbicycles and parts generated high forward and backward output, income, wage income,and employment linkages, indicating a relative deepening of the industrial structureof the Punjab economy. In addition, trade and transport, other services, banking, andreal estate showed a high degree of forward and backward linkages on account ofoutput, income, wages, and employment. Most of the above services were kept outsidethe structural matrix in 1969/70. Nevertheless, it is clear that along with the primarysector and the agroprocessing, basic metals, and machine goods sectors, the tertiarysector played an important role in generating backward and forward linkages on accountof output, income, wage incomes, and employment.
70
INCOME AND EMPLOYMENT MULTIPLIERSIN THE PUNJAB ECONOMY
In this chapter, input-output analysis is used to calculate direct and indirect sectoralincome and employment generated in the economy as a result of increases in consump-tion, government expenditure, investment, or exports. This analysis can be used byplanners to obtain an idea of the overall impact of their policy decisions regarding investmentor other government expenditure on sectoral outputs, incomes, and employment.
The coefficient table in an input-output matrix gives the direct income and employ-ment generated per unit of output in different sectors in the production process.However, because of interrelations among various sectors, any increase in final demandfrom a sector sets off a process of incremental production not only in that particularsector but also in many related sectors. This is because a unit of final demand from asector can be satisfied only by producing, in the first instance, at least one extra unitof output in that sector. However, the production of an extra unit of output requirescertain direct intermediate inputs. These inputs themselves have to be produced bythe respective sectors by using inputs from various other sectors. In the same way,the second round inputs and then the third round inputs must be produced, and so on.
Whereas the direct income and employment per unit of output in a sector aredependent on degrees of capital and labor intensity in its production process, its indirectoutput requirements from various sectors are determined by the density of its inputstructure. In a developing economy, because of lack of modernization and use of limitedintermediate inputs, the indirect effects are rather small, even though relatively highdirect income and employment per unit of output are generated in the agriculturalsectors. On the other hand, the manufacturing sectors, which are characterized by theuse of relatively higher intermediate inputs, generate higher indirect output, thoughin their case direct income and employment per unit of output are generally relativelymuch lower. Thus there is no necessary correspondence between direct income andindirect income gains for various sectors.
In order to obtain a comprehensive picture, the relative contribution of any sectorto the economy ought to be considered by taking into account not only the directincome and employment per unit of the sector's output but also the indirect incomeand employment generated by the sector in the production process. The Leontiefinverse, premultiplied by the income and employment coefficients, is especially suitedto capturing the total direct and indirect income and employment effect of a unit increasein final demand from any sector. The direct and indirect sectoral income and employ-ment associated with the unit of final demand can be converted to those of a unit ofoutput from the respective sectors to make them comparable with the direct incomeand employment per unit of output generated in each sector. For more meaningfulcomparisons between sectors, direct and indirect income and employment can bestandardized and sectoral multipliers calculated by dividing the direct and indirectvalues by their respective direct income and employment.
It should, however, be noted that income and employment sectoral multiplierscalculated by using the unadjusted Leontief inverse can be misleading, as import leakagesare not taken into account. But it is possible to overcome this limitation through a
71
modification of the Leontief inverse where import coefficients are introduced withinthe structural matrix. The values of indirect income and employment are considerablyreduced once this adjustment is made. The higher the imports by a particular sectorand the higher the import content of its various inputs, the higher the extent ofreduction in the indirect income generated by it.11 (See Appendix 3 for a discussionof the methodology.)
The above methodology does not take into account rather large interindustry effectsthat are generated by consumption, which is a major activity in all developing economies.As an economic activity, consumption leads to increased incomes, which in turn setin motion a chain of interindustry reactions that further increase output, income, andemployment and bring about a still further increase in household consumption, andso on. It is possible to capture the induced effects of consumption through an input-outputtable by closing the structural matrix with respect to consumption.
In the next section an attempt is made to calculate for 1979/80 the direct andindirect income generated in each sector and the direct and indirect sectoral incomemultipliers per unit of output after taking into account import leakages. This is followedby a calculation of direct, indirect, and induced income effects and multipliers afterincluding consumption in the structural matrix. Similar exercises have been done forworkers employed and wage incomes. Since these multipliers were also calculated in1969/70, any changes that took place between 1969/70 and 1979/80 in the rankingof different sectors in terms of the value of different types of multipliers are also discussed.
Direct and Indirect Income Multiplierswith Import Leakages
Because of the introduction of new technology and the use of much higher levelsof intermediate inputs, the net value added per unit of output in the main agriculturalsectors was considerably lower in 1979/80 than in 1969/70. Nevertheless, in both1969/70 and 1979/80 direct income (net value added) generated per unit of outputin Punjab was relatively much higher in the agricultural sectors and in animal husbandry.The range in 1979/80 was from 55.7 percent of the value of output in wheat to 83.1percent in agriculture and forestry. On the other hand, net value added per unit ofoutput in the industrial sectors was 8.4 percent of the value of output for grain millproducts, 68.9 percent for miscellaneous industries,12 and 43.3 percent for railroadequipment. In the electricity sector, value added constituted 57.1 percent of value ofoutput in 1979/80 compared with 87.0 percent in 1969/70. In the tertiary sectoralso, value added as a proportion of value of output is quite high.
To standardize direct and indirect incomes and make them comparable, sectoralmultipliers have been calculated by dividing the direct and indirect values by theirrespective direct income. As expected, the industrial sectors, in general, and morecapital-intensive sectors with fewer direct and indirect imports, in particular, recordmuch larger income gains than the agricultural sectors. In 1969/70, the highest valuesof income multipliers per unit of output were obtained in the agroprocessing industries
" As in Chapter 5, import coefficient b, is defined here as M, divided by X,, that is, imports into ith sectordivided by its output.12 Since the vector for miscellaneous industries has been constructed by aggregating numerous industriesnot included in the other sectors, the net value added of 0.6894 per unit of output in this case should betreated with due caution.
72
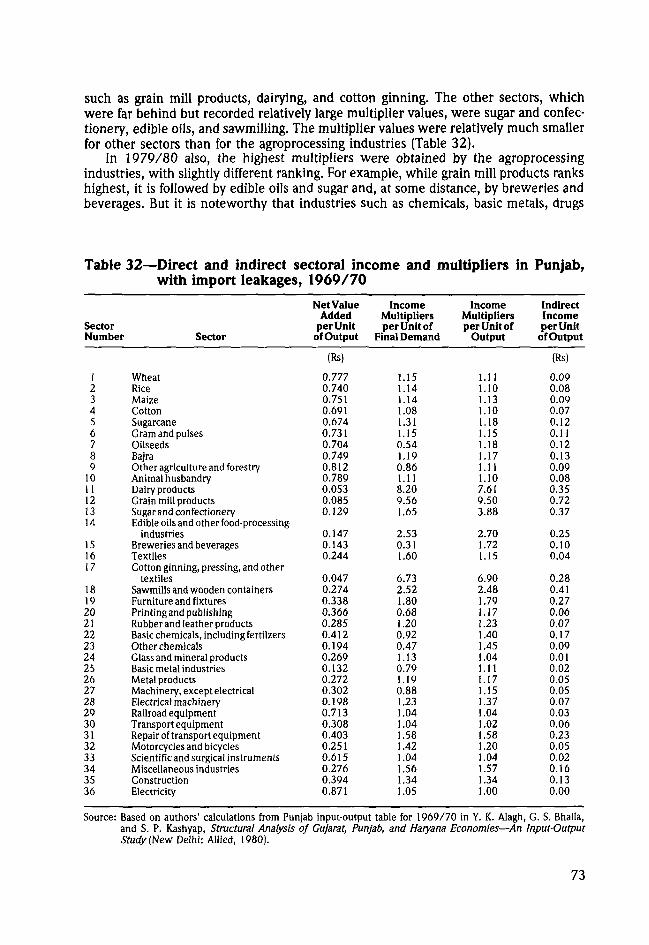
such as grain mill products, dairying, and cotton ginning. The other sectors, whichwere far behind but recorded relatively large multiplier values, were sugar and confec-tionery, edible oils, and sawmilling. The multiplier values were relatively much smallerfor other sectors than for the agroprocessing industries (Table 32).
In 1979/80 also, the highest multipliers were obtained by the agroprocessingindustries, with slightly different ranking. For example, while grain mill products rankshighest, it is followed by edible oils and sugar and, at some distance, by breweries andbeverages. But it is noteworthy that industries such as chemicals, basic metals, drugs
Table 32—Direct and indirect sectoral income and multipliers in Punjab,with import leakages, 1969/70
SectorNumber
123456789
1011121314
151617
18192021222324252627282930313233343536
Sector
WheatRiceMaizeCottonSugarcaneGram and pulsesOilseedsBajraOther agriculture and forestryAnimal husbandryDairy productsGrain mill productsSugar and confectioneryEdible oils and other food-processing
industriesBreweries and beveragesTextilesCotton ginning, pressing, and other
textilesSawmills and wooden containersFurniture and fixturesPrinting and publishingRubber and leather productsBasic chemicals, including fertilzersOther chemicalsGlass and mineral productsBasic metal industriesMetal productsMachinery, except electricalElectrical machineryRailroad equipmentTransport equipmentRepair of transport equipmentMotorcycles and bicyclesScientific and surgical instrumentsMiscellaneous industriesConstructionElectricity
Net ValueAdded
per Unitof Output
(Rs)
0.7770.7400.7510.6910.6740.7310.7040.7490.8120.7890.0530.0850.129
0.1470.1430.244
0.0470.2740.3380.3660.2850.4120.1940.2690.1320.2720.3020.1980.7130.3080.4030.2510.6150.2760.3940.871
IncomeMultipliersper Unit of
Final Demand
1.151.141.14.08
1.311.150.541.190.861.118.209.56
.65
2.530.311.60
6.732.52
.800.681.200.920.471.130.791.190.881.231.041.041.581.421.041.561.341.05
IncomeMultipliersper Unit of
Output
.11
.10
.13
.10
.18
.15
.18
.17
.11
.107.619.503.88
2.701.721.15
6.902.481.791.17.23
1.401.451.041.11.17
1.151.371.041.021.581.201.041.571.341.00
IndirectIncomeper Unit
of Output
{Rs)
0.090.080.090.070.120.110.120.130.090.080.350.720.37
0.250.100.04
0.280.410.270.060.070.170.090.010.020.050.050.070.030.060.230.050.020.160.130.00
Source: Based on authors' calculations from Punjab input-output table for 1969/70 in Y. K. Alagh, G. S. Bhalla,and S. P. Kashyap, Structural Analysis of Gujarat, Punjab, and Haryana Economies—An Input-OutputStudy (New Delhi: Allied, 1980).
73
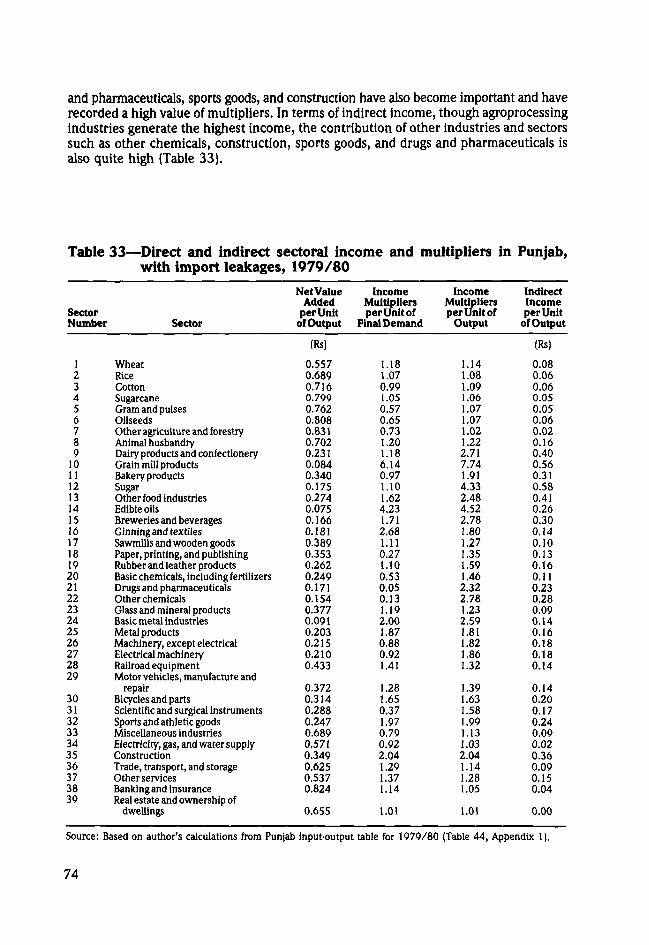
and Pharmaceuticals, sports goods, and construction have also become important and haverecorded a high value of multipliers. In terms of indirect income, though agroprocessingindustries generate the highest income, the contribution of other industries and sectorssuch as other chemicals, construction, sports goods, and drugs and Pharmaceuticals isalso quite high (Table 33).
Table 33—Direct and indirect sectoral income and multipliers in Punjab,with import leakages, 1979/80
SectorNumber
123456789
1011121314151617181920212223242526272829
30313233343536373839
Sector
WheatRiceCottonSugarcaneGram and pulsesOilseedsOther agriculture and forestryAnimal husbandryDairy products and confectioneryGrain mill productsBakery productsSugarOther food industriesEdible oilsBreweries and beveragesGinning and textilesSawmills and wooden goodsPaper, printing, and publishingRubber and leather productsBasic chemicals, including fertilizersDrugs and PharmaceuticalsOther chemicalsGlass and mineral productsBasic metal industriesMetal productsMachinery, except electricalElectrical machineryRailroad equipmentMotor vehicles, manufacture and
repairBicycles and partsScientific and surgical instrumentsSports and athletic goodsMiscellaneous industriesElectricity, gas, and water supplyConstructionTrade, transport, and storageOther servicesBanking and insuranceReal estate and ownership of
dwellings
NetValueAdded
per Unitof Output
(Rs)
0.5570.6890.7160.7990.7620.8080.8310.7020.2310.0840.3400.1750.2740.0750.1660.1810.3890.3530.2620.2490.1710.1540.3770.0910.2030.2150.2100.433
0.3720.3140.2880.2470.6890.5710.3490.6250.5370.824
0.655
IncomeMultipliersper Unit of
Final Demand
1.181.070.991.050.570.650.731.201.186.140.971.101.624.231.712.681.110.271.100.530.050.131.192.001.870.880.921.41
1.281.650.371.970.790.922.041.291.371.14
1.01
IncomeMultipliersper Unit of
Output
.141.081.09.06
1.071.071.02.22
2.717.741.914.332.484.522.78
.801.271.351.591.462.322.781.232.591.811.821.861.32
1.391.631.581.991.131.032.041.141.281.05
1.01
IndirectIncomeper Unitof Output
(Rs)
0.080.060.060.050.050.060.020.160.400.560.310.580.410.260.300.140.100.130.160.110.230.280.090.140.160.180.180.14
0.140.200.170.240.090.020.360.090.150.04
0.00
Source: Based on author's calculations from Punjab input-output table for 1979/80 (Table 44, Appendix 1).
74
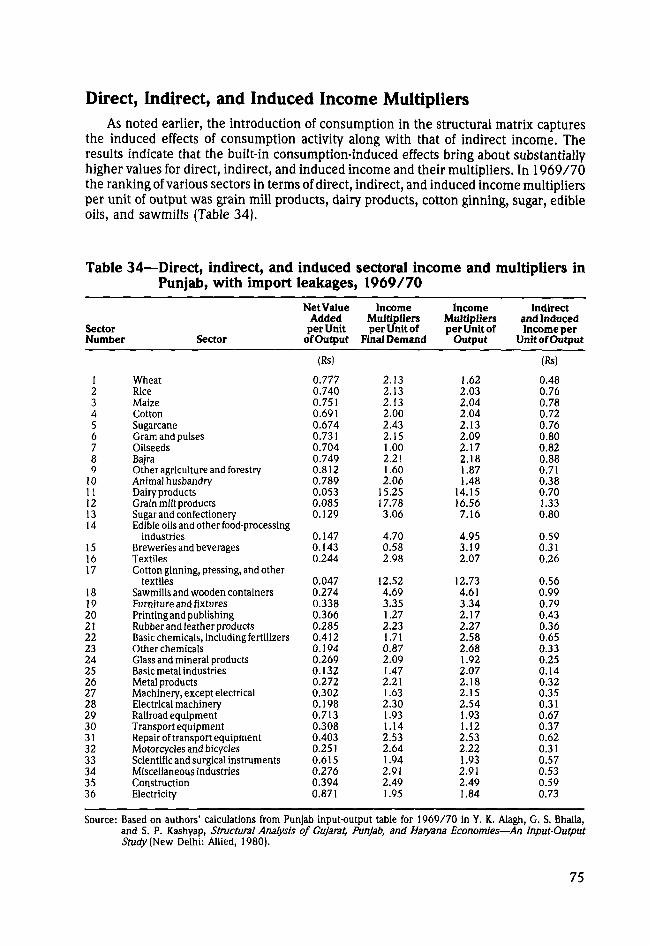
Direct, Indirect, and Induced Income MultipliersAs noted earlier, the introduction of consumption in the structural matrix captures
the induced effects of consumption activity along with that of indirect income. Theresults indicate that the built-in consumption-induced effects bring about substantiallyhigher values for direct, indirect, and induced income and their multipliers. In 1969/70the ranking of various sectors in terms of direct, indirect, and induced income multipliersper unit of output was grain mill products, dairy products, cotton ginning, sugar, edibleoils, and sawmills (Table 34).
Table 34—Direct, indirect, and induced sectoral income and multipliers inPunjab, with import leakages, 1969/70
SectorNumber
123456789
1011121314
151617
18192021222324252627282930313233343536
Sector
WheatRiceMaizeCottonSugarcaneGram and pulsesOilseedsBajraOther agriculture and forestryAnimal husbandryDairy productsGrain mill productsSugar and confectioneryEdible oils and other food-processing
industriesBreweries and beveragesTextilesCotton ginning, pressing, and other
textilesSawmills and wooden containersFurniture and fixturesPrinting and publishingRubber and leather productsBasic chemicals, including fertilizersOther chemicalsGlass and mineral productsBasic metal industriesMetal productsMachinery, except electricalElectrical machineryRailroad equipmentTransport equipmentRepair of transport equipmentMotorcycles and bicyclesScientific and surgical instrumentsMiscellaneous industriesConstructionElectricity
NetValueAdded
per UnitofOutput
(Rs)
0.7770.7400.7510.6910.6740.7310.7040.7490.8120.7890.0530.0850.129
0.1470.1430.244
0.0470.2740.3380.3660.2850.4120.1940.2690.1320.2720.3020.1980.7130.3080.4030.2510.6150.2760.3940.871
IncomeMultipliersper Unit of
Final Demand
2.132.132.132.002.432.151.002.211.602.06
15.2517.783.06
4.700.582.98
12.524.693.351.272.231.710.872.091.472.211.632.301.931.142.532.641.942.912.491.95
IncomeMultipliersper Unit of
Output
1.622.032.042.042.132.092.172.181.871.48
14.1516.567.16
4.953.192.07
12.734.613.342.172.272.582.681.922.072.182.152.541.931.122.532.221.932.912.491.84
Indirectand InducedIncome per
Unit ofOutput
(Rs)
0.480.760.780.720.760.800.820.880.710.380.701.330.80
0.590.310.26
0.560.990.790.430.360.650.330.250.140.320.350.310.670.370.620.310.570.530.590.73
Source: Based on authors' calculations from Punjab input-output table for 1969/70 in Y. K. Alagh, G. S. Bhalla,and S. P. Kashyap, Structural Analysis of Gujarat, Punjab, and Haryana Economies—An Input-OutputStudy (New Delhi: Allied, 1980).
75
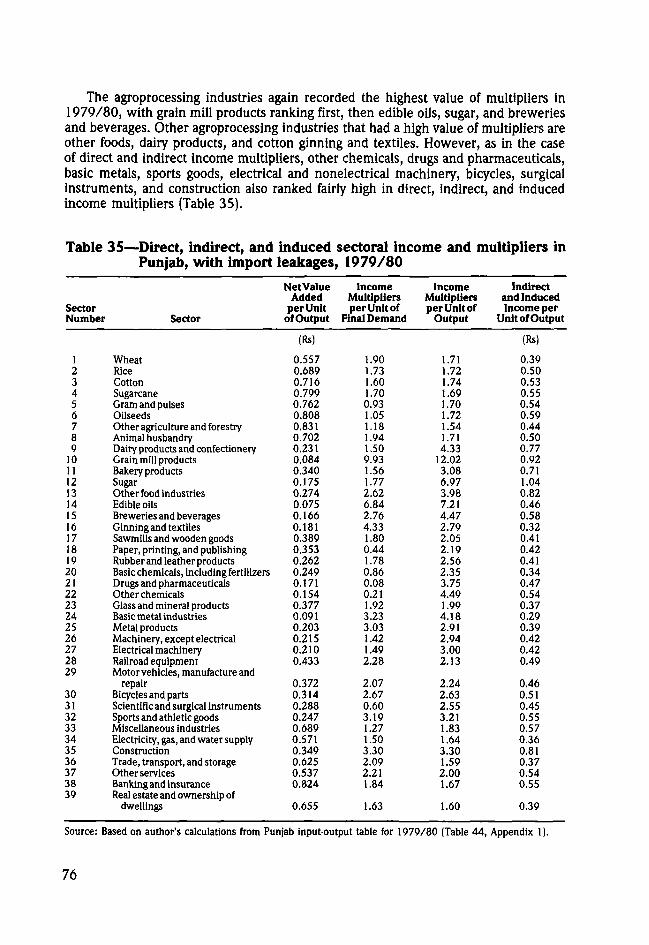
The agroprocessing industries again recorded the highest value of multipliers in1979/80, with grain mill products ranking first, then edible oils, sugar, and breweriesand beverages. Other agroprocessing industries that had a high value of multipliers areother foods, dairy products, and cotton ginning and textiles. However, as in the caseof direct and indirect income multipliers, other chemicals, drugs and Pharmaceuticals,basic metals, sports goods, electrical and nonelectrical machinery, bicycles, surgicalinstruments, and construction also ranked fairly high in direct, indirect, and inducedincome multipliers (Table 35).
Table 35—Direct, indirect, and induced sectoral income and multipliers inPunjab, with import leakages, 1979/80
SectorNumber
123456789
1011121314151617181920212223242526272829
30313233343536373839
Sector
WheatRiceCottonSugarcaneGram and pulsesOilseedsOther agriculture and forestryAnimal husbandryDairy products and confectioneryGrain mill productsBakery productsSugarOther food industriesEdible oilsBreweries and beveragesGinning and textilesSawmills and wooden goodsPaper, printing, and publishingRubber and leather productsBasic chemicals, including fertilizersDrugs and PharmaceuticalsOther chemicalsGlass and mineral productsBasic metal industriesMetal productsMachinery, except electricalElectrical machineryRailroad equipmentMotor vehicles, manufacture and
repairBicycles and partsScientific and surgical instrumentsSports and athletic goodsMiscellaneous industriesElectricity, gas, and water supplyConstructionTrade, transport, and storageOther servicesBanking and insuranceReal estate and ownership of
dwellings
NetValueAdded
per Unitof Output
(Rs)
0.5570.6890.7160.7990.7620.8080.8310.7020.2310.0840.3400.1750.2740.0750.1660.1810.3890.3530.2620.2490.1710.1540.3770.0910.2030.2150.2100.433
0.3720.3140.2880.2470.6890.5710.3490.6250.5370.824
0.655
IncomeMultipliersper Unit of
Final Demand
1.901.731.601.700.931.051.181.941.509.931.561.772.626.842.764.331.800.441.780.860.080.211.923.233.031.421.492.28
2.072.670.603.191.271.503.302.092.211.84
1.63
IncomeMultipliersper Unit of
Output
1.711.721.741.691.701.721.541.714.33
12.023.086.973.987.214.472.792.052.192.562.353.754.491.994.182.912.943.002.13
2.242.632.553.211.831.643.301.592.001.67
1.60
Indirectand InducedIncome per
Unit of Output
(Rs)
0.390.500.530.550.540.590.440.500.770.920.711.040.820.460.580.320.410.420.410.340.470.540.370.290.390.420.420.49
0.460.510.450.550.570.360.810.370.540.55
0.39
Source: Based on author's calculations from Punjab input-output table for 1979/80 (Table 44, Appendix 1).
76
In 1969/70 it was discovered that induced income gains were unevenly distributedamong the various sectors, and substantial induced income gains were recorded onlyby those sectors that were relatively more important in the consumption basket. Thesewere grain mill products, sawmills, ginning, bajra, and oilseeds.
The consumption-oriented sectors also showed high indirect and induced incomegains in 1979/80. The ranking of various sectors in terms of induced income gainswas sugar, grain mill products, other food industries, dairy products, and bakery prod-ucts. Induced income gains in construction were also quite high and considerableinduced incomes were generated by trade and transport, other services, banking andinsurance, and real estate.
Direct and Indirect Employment MultipliersIn 1969/70 direct employment in terms of both workers and person-hours was
highest in the agricultural sectors, ranging from 0.135 workers per Rs 1,000 of outputin rice to 0.571 workers in cotton. In the industrial sectors, the employment intensitywas much lower and ranged from 0.006 workers per Rs 1,000 of output in dairyproducts to 0.157 workers in printing and publishing (Table 36).
In 1979/80 also, the highest direct employment was generated in the agriculturalsectors, although its intensity was relatively much lower, varying between 0.055 workersper Rs 1,000 of output in oilseeds to 0.108 workers in rice. The manufacturing sectorsagain recorded a much lower employment intensity, ranging from 0.007 workers perRs 1,000 of output in edible oils to 0.076 workers in printing and publishing. Asexpected, services are highly labor-intensive (Table 37).
In 1969/70 the highest values of employment multipliers per unit of output werein the agroprocessing industries such as dairy products, followed by grain mill products,cotton ginning, sugar and confectionery, edible oils, and sawmills.
The agroprocessing industries also generated the highest employment multipliersin 1979/80, although the ranking was slightly different. The first position in terms ofemployment multipliers was once again occupied by dairy products, followed by grainmill products, edible oils, breweries, and sugar. Besides the agroprocessing industries,other sectors that had high employment multipliers were construction, basic metals,basic chemicals, and other chemicals.
Direct, Indirect, and Induced EmploymentMultipliers
The introduction of consumption into the structural matrix resulted in a significantincrease in the value of multipliers, particularly in sectors that are important in theconsumption basket. In 1969/70 dairy products ranked highest in terms of direct,indirect, and induced employment multipliers, followed by grain mill products, basicchemicals, cotton ginning, sugar, edible oils, sawmills, other chemicals, and electricalmachinery (Table 38).
In 1979/80 dairy products again recorded the highest rank in terms of the direct,indirect, and induced employment multipliers. Next came miscellaneous industries,grain mill products, basic chemicals, breweries, edible oils, and construction. Theranking in terms of indirect- and induced-employment gains is also similar to that of1969/70 (Table 39).
77
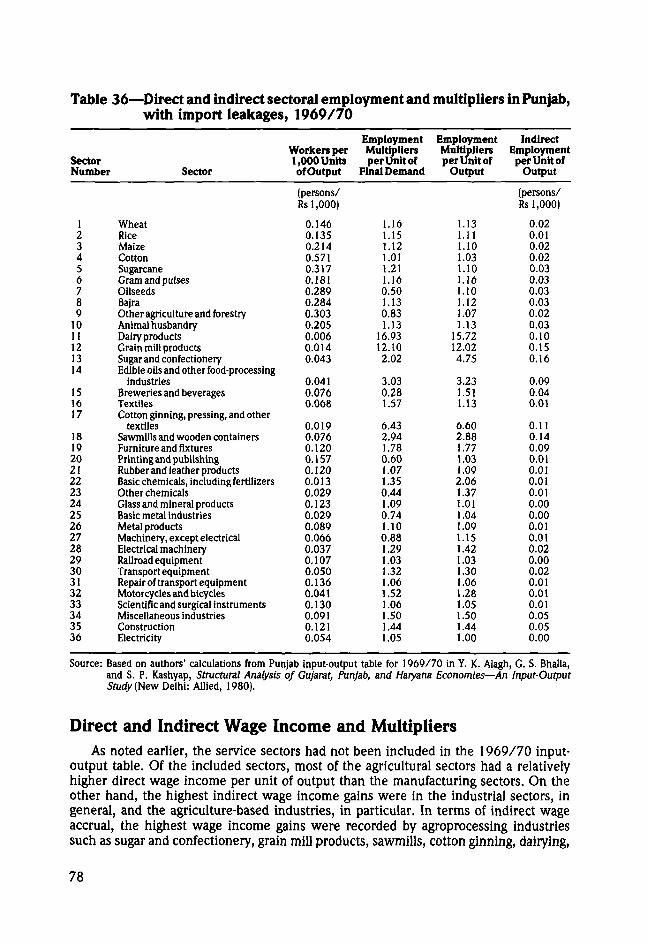
Table 36—Direct and indirect sectoral employment and multipliers in Punjab,with import leakages, 1969/70
SectorNumber
123456789
to11121314
151617
18192021222324252627282930313233343536
Sector
WheatRiceMaizeCottonSugarcaneGram and pulsesOilseedsBajraOther agriculture and forestryAnimal husbandryDairy productsGrain mill productsSugar and confectioneryEdible oils and other food-processing
industriesBreweries and beveragesTextilesCotton ginning, pressing, and other
textilesSawmills and wooden containersFurniture and fixturesPrinting and publishingRubber and leather productsBasic chemicals, including fertilizersOther chemicalsGlass and mineral productsBasic metal industriesMetal productsMachinery, except electricalElectrical machineryRailroad equipmentTransport equipmentRepair of transport equipmentMotorcycles and bicyclesScientific and surgical instrumentsMiscellaneous industriesConstructionElectricity
Workers per1,000 Unitsof Output
(persons/Rs 1,000)
0.1460.1350.2140.5710.3170.1810.2890.2840.3030.2050.0060.0140.043
0.0410.0760.068
0.0190.0760.1200.1570.1200.0130.0290.1230.0290.0890.0660.0370.1070.0500.1360.0410.1300.0910.1210.054
EmploymentMultipliersper Unit of
Final Demand
1.161.151.121.011.211.160.501.130.831.13
16.9312.102.02
3.030.281.57
6.432.941.780.601.071.350.441.090.741.100.881.291.031.321.061.521.061.501.441.05
EmploymentMultipliersper Unit of
Output
.13
.11
.10
.031.10.16.10.12.07.13
15.7212.024.75
3.231.511.13
6.602.881.771.031.092.061.371.011.041.091.15.42
1.03.30
1.061.281.051.50.44.00
IndirectEmployment
per Unit ofOutput
(persons/Rs 1,000)
0.020.010.020.020.030.030.030.030.020.030.100.150.16
0.090.040.01
0.110.140.090.010.010.010.010.000.000.010.010.020.000.020.010.010.010.050.050.00
Source: Based on authors' calculations from Punjab input-output table for 1969/70 in Y. K. Alagh, G. S. Bhalla,and S. P. Kashyap, Structural Analysis of Gujarat, Punjab, and Haryana Economies—An Input-OutputStudy (New Delhi: Allied, 1980).
Direct and Indirect Wage Income and MultipliersAs noted earlier, the service sectors had not been included in the 1969/70 input-
output table. Of the included sectors, most of the agricultural sectors had a relativelyhigher direct wage income per unit of output than the manufacturing sectors. On theother hand, the highest indirect wage income gains were in the industrial sectors, ingeneral, and the agriculture-based industries, in particular. In terms of indirect wageaccrual, the highest wage income gains were recorded by agroprocessing industriessuch as sugar and confectionery, grain mill products, sawmills, cotton ginning, dairying,
78
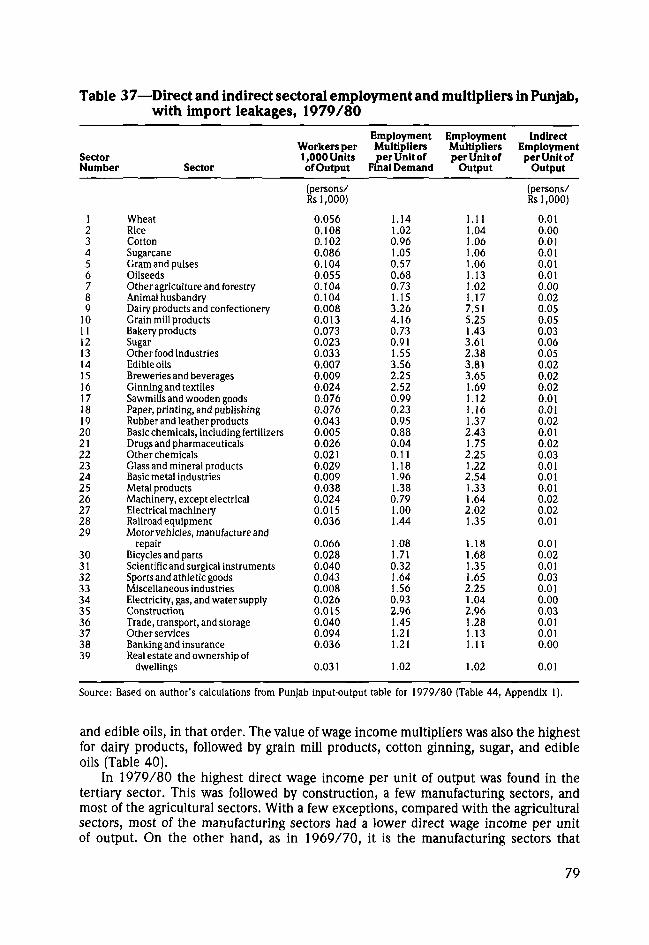
Table 37—Direct and indirect sectoral employment and multipliers in Punjab,with import leakages, 1979/80
SectorNumber
123456789
1011121314151617IS1920212223242526272829
30313233343536373839
Sector
WheatRiceCottonSugarcaneGram and pulsesOilseedsOther agriculture and forestryAnimal husbandryDairy products and confectioneryGrain mill productsBakery productsSugarOther food industriesEdible oilsBreweries and beveragesGinning and textilesSawmills and wooden goodsPaper, printing, and publishingRubber and leather productsBasic chemicals, including fertilizersDrugs and PharmaceuticalsOther chemicalsGlass and mineral productsBasic metal industriesMetal productsMachinery, except electricalElectrical machineryRailroad equipmentMotor vehicles, manufacture and
repairBicycles and partsScientific and surgical instrumentsSports and athletic goodsMiscellaneous industriesElectricity, gas, and water supplyConstructionTrade, transport, and storageOther servicesBanking and insuranceReal estate and ownership of
dwellings
Workers per1,000 Unitsof Output
(persons/Rs 1,000)
0.0560.1080.1020.0860.1040.0550.1040.1040.0080.0130.0730.0230.0330.0070.0090.0240.0760.0760.0430.0050.0260.0210.0290.0090.0380.0240.0150.036
0.0660.0280.0400.0430.0080.0260.0150.0400.0940.036
0.031
EmploymentMultipliersper Unit of
Final Demand
1.141.020.961.050.570.680.731.153.264.160.730.911.553.562.252.520.990.230.950.880.040.111.181.961.380.791.001.44
1.081.710.321.641.560.932.961.451.211.21
1.02
EmploymentMultipliersper Unit of
Output
1.111.041.061.061.061.131.021.177.515.251.433.612.383.813.651.691.121.161.372.431.752.251.222.541.331.642.021.35
1.181.681.351.652.251.042.961.281.131.11
1.02
IndirectEmployment
per Unit ofOutput
(persons/Rs 1,000)
0.010.000.010.010.010.010.000.020.050.050.030.060.050.020.020.020.010.010.020.010.020.030.010.010.010.020.020.01
0.010.020.010.030.010.000.030.010.010.00
0.01
Source: Based on author's calculations from Punjab input-output table for 1979/80 (Table 44, Appendix 1).
and edible oils, in that order. The value of wage income multipliers was also the highestfor dairy products, followed by grain mill products, cotton ginning, sugar, and edibleoils (Table 40).
In 1979/80 the highest direct wage income per unit of output was found in thetertiary sector. This was followed by construction, a few manufacturing sectors, andmost of the agricultural sectors. With a few exceptions, compared with the agriculturalsectors, most of the manufacturing sectors had a lower direct wage income per unitof output. On the other hand, as in 1969/70, it is the manufacturing sectors that
79
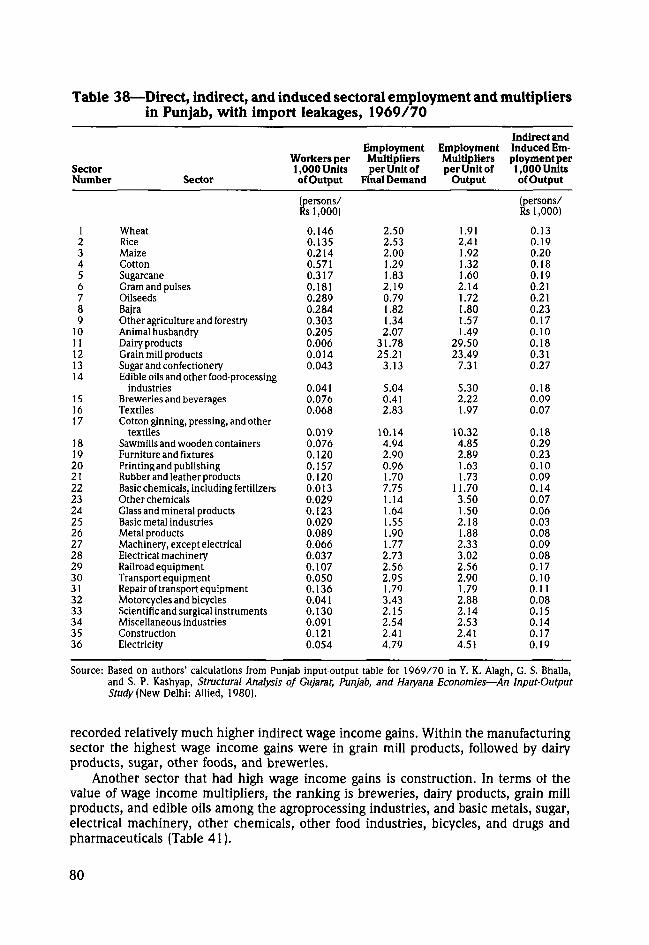
Table 38—Direct, indirect, and induced sectoral employment and multipliersin Punjab, with import leakages, 1969/70
SectorNumber
123456789
1011121314
151617
18192021222324252627282930313233343536
Sector
WheatRiceMaizeCottonSugarcaneGram and pulsesOilseedsBajraOther agriculture and forestryAnimal husbandryDairy productsGrain mill productsSugar and confectioneryEdible oils and other food-processing
industriesBreweries and beveragesTextilesCotton ginning, pressing, and other
textilesSawmills and wooden containersFurniture and fixturesPrinting and publishingRubber and leather productsBasic chemicals, including fertilizersOther chemicalsGlass and mineral productsBasic metal industriesMetal productsMachinery, except electricalElectrical machineryRailroad equipmentTransport equipmentRepair of transport equipmentMotorcycles and bicyclesScientific and surgical instrumentsMiscellaneous industriesConstructionElectricity
Workers per1,000 UnitsofOutput
(persons/Rs l,000|
0.1460.1350.2140.5710.3170.1810.2890.2840.3030.2050.0060.0140.043
0.0410.0760.068
0.0190.0760.1200.1570.1200.0130.0290.1230.0290.0890.0660.0370.1070.0500.1360.0410.1300.0910.1210.054
EmploymentMultipliersper Unit of
Final Demand
2.502.532.001.291.832.190.791.821.342.07
31.7825.21
3.13
5.040.412.83
10.144.942.900.961.707.751.141.641.551.901.772.732.562.951.793.432.152.542.414.79
EmploymentMultipliersper Unit of
Output
1.912.411.921.321.602.141.721.801.571.49
29.5023.49
7.31
5.302.221.97
10.324.852.891.631.73
11.703.501.502.181.882.333.022.562.901.792.882.142.532.414.51
Indirect andInduced Em-ployment per1,000 UnitsofOutput
(persons/Rs 1,000)
0.130.190.200.180.190.210.210.230.170.100.180.310.27
0.180.090.07
0.180.290.230.100.090.140.070.060.030.080.090.080.170.100.110.080.150.140.170.19
Source: Based on authors' calculations from Punjab input-output table for 1969/70 in Y. K. Alagh, G. S. Bhalla,and S. P. Kashyap, Structural Analysis of Gujarat, Punjab, and Haryana Economies—An Input-OutputStudy (New Delhi: Allied, 1980).
recorded relatively much higher indirect wage income gains. Within the manufacturingsector the highest wage income gains were in grain mill products, followed by dairyproducts, sugar, other foods, and breweries.
Another sector that had high wage income gains is construction. In terms of thevalue of wage income multipliers, the ranking is breweries, dairy products, grain millproducts, and edible oils among the agroprocessing industries, and basic metals, sugar,electrical machinery, other chemicals, other food industries, bicycles, and drugs andPharmaceuticals (Table 41).
80
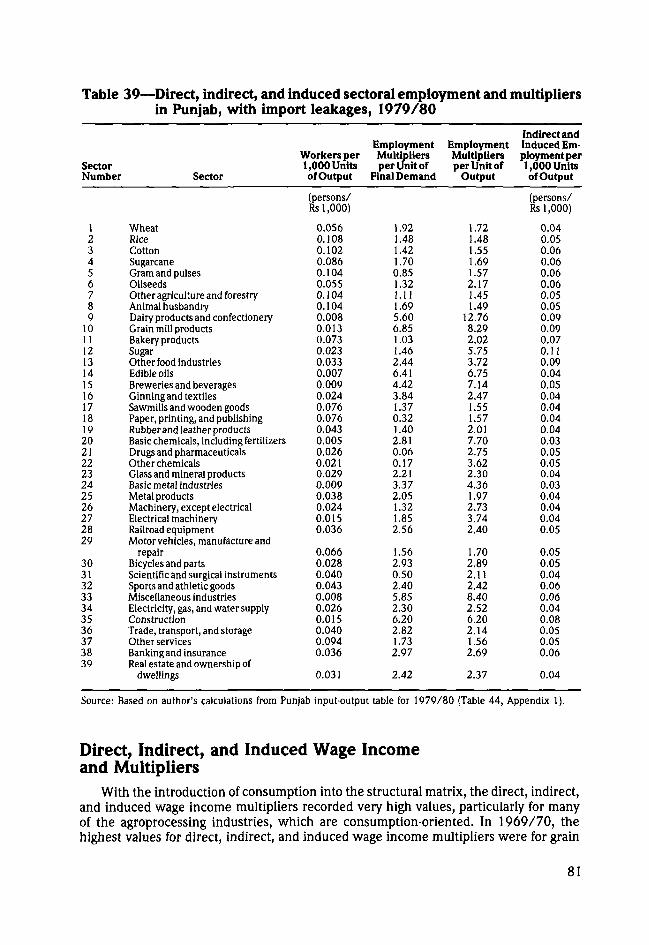
Table 39—Direct, indirect, and induced sectoral employment and multipliersin Punjab, with import leakages, 1979/80
SectorNumber
123456789
1011121314151617181920212223242526272829
30313233343536373839
Sector
WheatRiceCottonSugarcaneGram and pulsesOilseedsOther agriculture and forestryAnimal husbandryDairy products and confectioneryGrain mill productsBakery productsSugarOther food industriesEdible oilsBreweries and beveragesGinning and textilesSawmills and wooden goodsPaper, printing, and publishingRubber and leather productsBasic chemicals, including fertilizersDrugs and PharmaceuticalsOther chemicalsGlass and mineral productsBasic metal industriesMetal productsMachinery, except electricalElectrical machineryRailroad equipmentMotor vehicles, manufacture and
repairBicycles and partsScientific and surgical instrumentsSports and athletic goodsMiscellaneous industriesElectricity, gas, and water supplyConstructionTrade, transport, and storageOther servicesBanking and insuranceReal estate and ownership of
dwellings
Workers per1,000 Unitsof Output
(persons/Rs 1,000)
0.0560.1080.1020.0860.1040.0550.1040.1040.0080.0130.0730.0230.0330.0070.0090.0240.0760.0760.0430.0050.0260.0210.0290.0090.0380.0240.0150.036
0.0660.0280.0400.0430.0080.0260.0150.0400.0940.036
0.031
EmploymentMultipliersper Unit of
Final Demand
1.921.481.421.700.851.321.111.695.606.851.031.462.446.414.423.841.370.321.402.810.060.172.213.372.051.321.852.56
1.562.930.502.405.852.306.202.821.732.97
2.42
EmploymentMultipliersper Unit of
Output
1.721.481.551.691.572.171.451.49
12.768.292.025.753.726.757.142.471.551.572.017.702.753.622.304.361.972.733.742.40
1.702.892.112.428.402.526.202.141.562.69
2.37
Indirect andInduced Em-ployment per1,000 Unitsof Output
(persons/Rs 1,000)
0.040.050.060.060.060.060.050.050.090.090.070.110.090.040.050.040.040.040.040.030.050.050.040.030.040.040.040.05
0.050.050.040.060.060.040.080.050.050.06
0.04
Source: Based on author's calculations from Punjab input-output table for 1979/80 (Table 44, Appendix 1).
Direct, Indirect, and Induced Wage Incomeand Multipliers
With the introduction of consumption into the structural matrix, the direct, indirect,and induced wage income multipliers recorded very high values, particularly for manyof the agroprocessing industries, which are consumption-oriented. In 1969/70, thehighest values for direct, indirect, and induced wage income multipliers were for grain
81
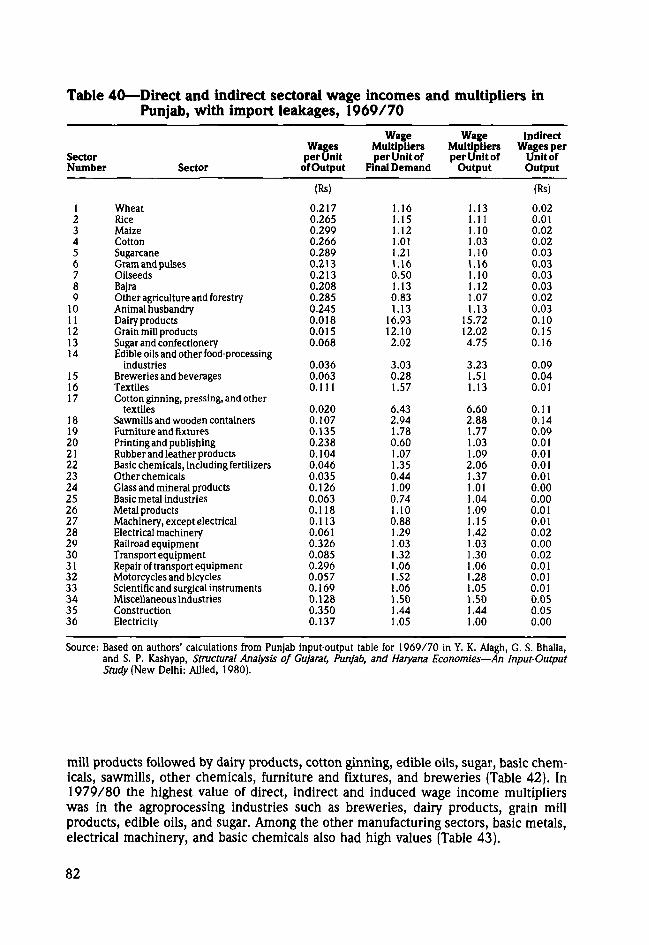
Table 40—Direct and indirect sectoral wage incomes and multipliers inPunjab, with import leakages, 1969/70
SectorNumber
123456789
1011121314
151617
18192021222324252627282930313233343536
Sector
WheatRiceMaizeCottonSugarcaneGram and pulsesOilseedsBajraOther agriculture and forestryAnimal husbandryDairy productsGrain mill productsSugar and confectioneryEdible oils and other food-processing
industriesBreweries and beveragesTextilesCotton ginning, pressing, and other
textilesSawmills and wooden containersFurniture and fixturesPrinting and publishingRubber and leather productsBasic chemicals, including fertilizersOther chemicalsGlass and mineral productsBasic metal industriesMetal productsMachinery, except electricalElectrical machineryRailroad equipmentTransport equipmentRepair of transport equipmentMotorcycles and bicyclesScientific and surgical instrumentsMiscellaneous industriesConstructionElectricity
Wagesper Unit
of Output
(Rs)
0.2170.2650.2990.2660.2890.2130.2130.2080.2850.2450.0180.0150.068
0.0360.0630.111
0.0200.1070.1350.2380.1040.0460.0350.1260.0630.1180.1130.0610.3260.0850.2960.0570.1690.1280.3500.137
WageMultipliersper Unit of
Final Demand
1.161.151.121.011.211.160.501.130.831.13
16.9312.102.02
3.030.281.57
6.432.941.780.601.071.350.441.090.741.100.88
.291.031.321.061.521.061.501.441.05
WageMultipliersper Unit of
Output
1.131.111.101.031.101.161.101.121.071.13
15.7212.024.75
3.23.51
1.13
6.602.881.771.031.092.061.37.01
1.04.09
1.15.42
1.03.30
1.061.281.051.501.44.00
IndirectWages per
Unit ofOutput
(Rs)
0.020.010.020.020.030.030.030.030.020.030.100.150.16
0.090.040.01
0.110.140.090.010.010.010.010.000.000.010.010.020.000.020.010.010.010.050.050.00
Source: Based on authors' calculations from Punjab input-output table for 1969/70 in Y. K. Alagh, G. S. Bhalla,and S. P. Kashyap, Structural Analysis of Gujarat, Punjab, and Haryana Economies—An Input-OutputStudy (New Delhi: Allied, 1980).
mill products followed by dairy products, cotton ginning, edible oils, sugar, basic chem-icals, sawmills, other chemicals, furniture and fixtures, and breweries (Table 42). In1979/80 the highest value of direct, indirect and induced wage income multiplierswas in the agroprocessing industries such as breweries, dairy products, grain millproducts, edible oils, and sugar. Among the other manufacturing sectors, basic metals,electrical machinery, and basic chemicals also had high values (Table 43).
82
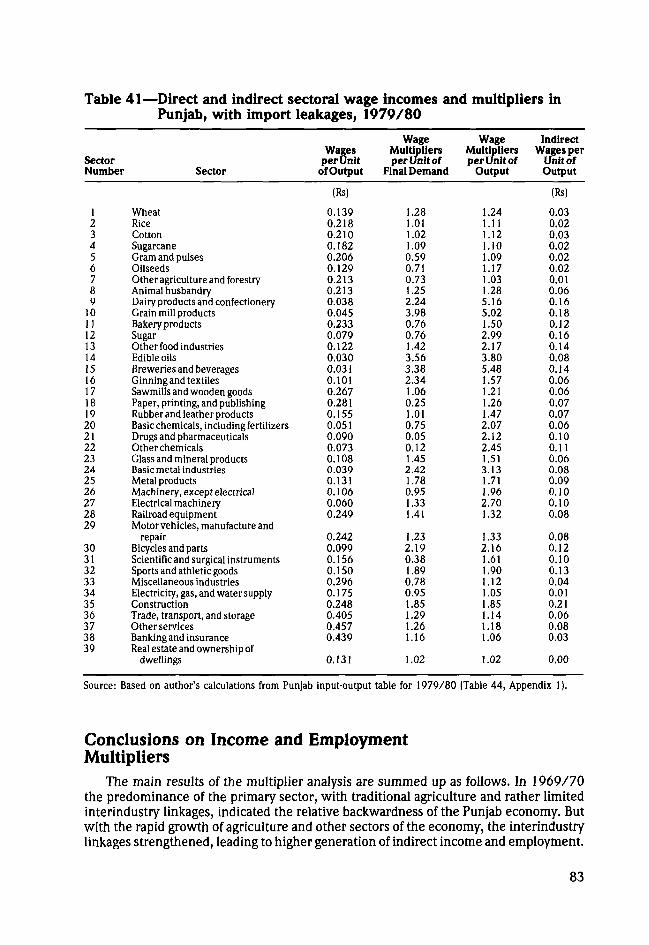
Table 41—Direct and indirect sectoral wage incomes and multipliers inPunjab, with import leakages, 1979/80
SectorNumber
123456789
1011121314151617181920212223242526272829
30313233343536373839
Sector
WheatRiceCottonSugarcaneGram and pulsesOilseedsOther agriculture and forestryAnimal husbandryDairy products and confectioneryGrain mill productsBakeryproductsSugarOther food industriesEdible oilsBreweries and beveragesGinning and textilesSawmills and wooden goodsPaper, printing, and publishingRubber and leather productsBasic chemicals, including fertilizersDrugs and PharmaceuticalsOther chemicalsGlass and mineral productsBasic metal industriesMetal productsMachinery, except electricalElectrical machineryRailroad equipmentMotor vehicles, manufacture and
repairBicycles and partsScientific and surgical instrumentsSports and athletic goodsMiscellaneous industriesElectricity, gas, and water supplyConstructionTrade, transport, and storageOther servicesBanking and insuranceReal estate and ownership of
dwellings
Wagesper Unit
of Output
(Rs)
0.1390.2180.2100.1820.2060.1290.2130.2130.0380.0450.2330.0790.1220.0300.0310.1010.2670.2810.1550.0510.0900.0730.1080.0390.1310.1060.0600.249
0.2420.0990.1560.1500.2960.1750.2480.4050.4570.439
0.131
WageMultipliersper Unit of
Final Demand
1.281.011.021.090.590.710.731.252.243.980.760.761.423.563.382.341.060.251.010.750.050.121.452.421.780.951.331.41
1.232.190.381.890.780.951.851.291.261.16
1.02
WageMultipliersper Unit of
Output
1.241.111.121.101.091.171.031.285.165.021.502.992.173.805.481.571.211.261.472.072.122.451.513.131.711.962.701.32
1.332.161.611.901.121.051.851.141.181.06
1.02
IndirectWages per
Unit ofOutput
(Rs)
0.030.020.030.020.020.020.010.060.160.180.120.160.140.080.140.060.060.070.070.060.100.110.060.080.090.100.100.08
0.080.120.100.130.040.010.210.060.080.03
0.00
Source: Based on author's calculations from Punjab input-output table for 1979/80 (Table 44, Appendix 1).
Conclusions on Income and EmploymentMultipliers
The main results of the multiplier analysis are summed up as follows. In 1969/70the predominance of the primary sector, with traditional agriculture and rather limitedinterindustry linkages, indicated the relative backwardness of the Punjab economy. Butwith the rapid growth of agriculture and other sectors of the economy, the interindustrylinkages strengthened, leading to higher generation of indirect income and employment.
83
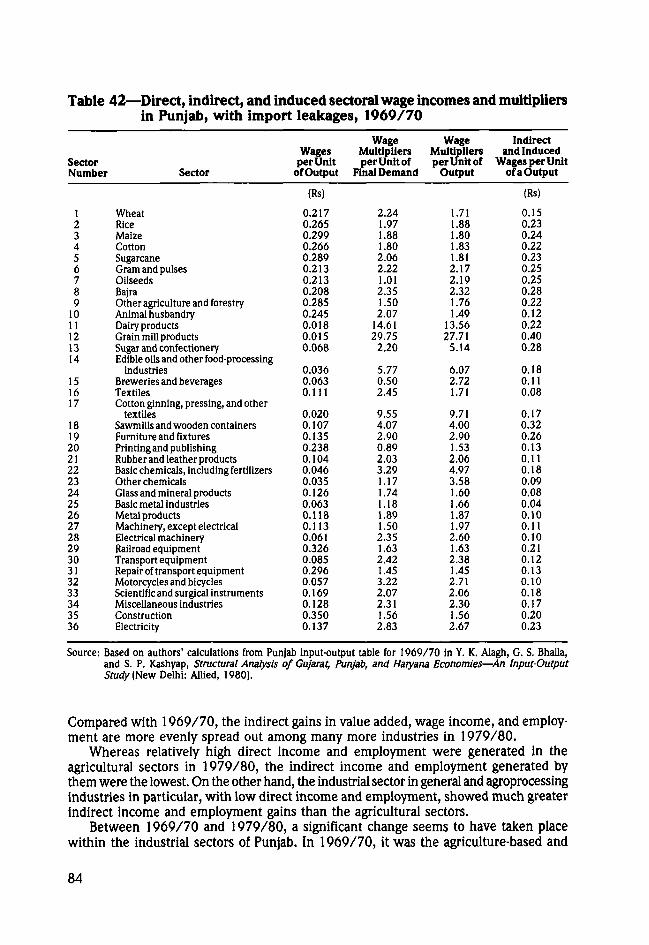
Table 42—Direct, indirect, and induced sectoral wage incomes and multipliersin Punjab, with import leakages, 1969/70
SectorNumber
123456789
1011121314
151617
18192021222324252627282930313233343536
Sector
WheatRiceMaizeCottonSugarcaneGram and pulsesOilseedsBajraOther agriculture and forestryAnimal husbandryDairy productsGrain mill productsSugar and confectioneryEdible oils and other food-processing
industriesBreweries and beveragesTextilesCotton ginning, pressing, and other
textilesSawmills and wooden containersFurniture and fixturesPrinting and publishingRubber and leather productsBasic chemicals, including fertilizersOther chemicalsGlass and mineral productsBasic metal industriesMetal productsMachinery, except electricalElectrical machineryRailroad equipmentTransport equipmentRepair of transport equipmentMotorcycles and bicyclesScientific and surgical instrumentsMiscellaneous industriesConstructionElectricity
Wagesper Unit
of Output
(Rs)
0.2170.2650.2990.2660.2890.2130.2130.2080.2850.2450.0180.0150.068
0.0360.0630.111
0.0200.1070.1350.2380.1040.0460.0350.1260.0630.1180.1130.0610.3260.0850.2960.0570.1690.1280.3500.137
WageMultipliersper Unit of
Final Demand
2.241.971.881.802.062.221.012.351.502.07
14.6129.75
2.20
5.770.502.45
9.554.072.900.892.033.291.171.741.181.891.502.351.632.421.453.222.072.311.562.83
WageMultipliersper Unit of
Output
1.711.881.801.831.812.172.192.321.761.49
13.5627.71
5.14
6.072.721.71
9.714.002.901.532.064.973.581.601.661.871.972.601.632.381.452.712.062.301.562.67
Indirectand Induced
Wages per Unitof a Output
(Rs)
0.150.230.240.220.230.250.250.280.220.120.220.400.28
0.180.110.08
0.170.320.260.130.110.180.090.080.040.100.110.100.210.120.130.100.180.170.200.23
Source: Based on authors' calculations from Punjab input-output table for 1969/70 in Y. K. Alagh, G. S. Bhalla,and S. P. Kashyap, Structural Analysis of Gujarat, Punjab, and Haryana Economies—An Input-OutputStudy [New Delhi: Allied, 1980).
Compared with 1969/70, the indirect gains in value added, wage income, and employ-ment are more evenly spread out among many more industries in 1979/80.
Whereas relatively high direct income and employment were generated in theagricultural sectors in 1979/80, the indirect income and employment generated bythem were the lowest. On the other hand, the industrial sector in general and agroprocessingindustries in particular, with low direct income and employment, showed much greaterindirect income and employment gains than the agricultural sectors.
Between 1969/70 and 1979/80, a significant change seems to have taken placewithin the industrial sectors of Punjab. In 1969/70, it was the agriculture-based and
84
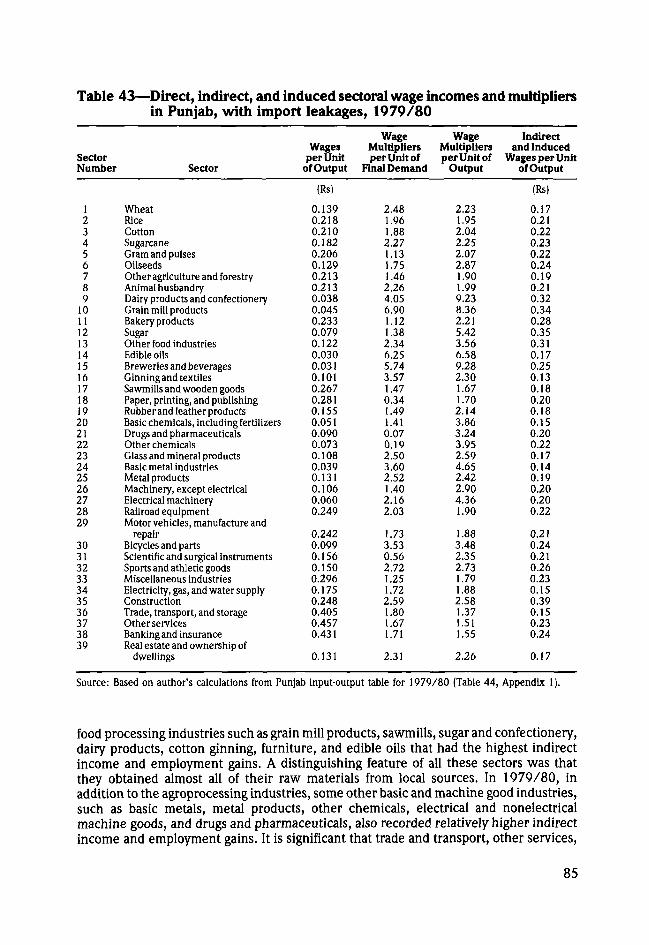
Table 43—Direct, indirect, and induced sectoral wage incomes and multipliersin Punjab, with import leakages, 1979/80
SectorNumber
123456789
1011121314151617181920212223242526272829
30313233343536373839
Sector
WheatRiceCottonSugarcaneGram and pulsesOilseedsOther agriculture and forestryAnimal husbandryDairy products and confectioneryGrain mill productsBakery productsSugarOther food industriesEdible oilsBreweries and beveragesGinning and textilesSawmills and wooden goodsPaper, printing, and publishingRubber and leather productsBasic chemicals, including fertilizersDrugs and PharmaceuticalsOther chemicalsGlass and mineral productsBasic metal industriesMetal productsMachinery, except electricalElectrical machineryRailroad equipmentMotor vehicles, manufacture and
repairBicycles and partsScientific and surgical instrumentsSports and athletic goodsMiscellaneous industriesElectricity, gas, and water supplyConstructionTrade, transport, and storageOther servicesBanking and insuranceReal estate and ownership of
dwellings
Wagesper Unit
of Output
(Rs)
0.1390.2180.2100.1820.2060.1290.2130.2130.0380.0450.2330.0790.1220.0300.0310.1010.2670.2810.1550.0510.0900.0730.1080.0390.1310.1060.0600.249
0.2420.0990.1560.1500.2960.1750.2480.4050.4570.431
0.131
WageMultipliersper Unit of
Final Demand
2.481.961.882.271.131.751.462.264.056.901.121.382.346.255.743.571.470.341.491.410.070.192.503.602.521.402.162.03
1.733.530.562.721.251.722.591.801.671.71
2.31
WageMultipliersper Unit of
Output
2.231.952.042.252.072.871.901.999.238.362.215.423.566.589.282.301.671.702.143.863.243.952.594.652.422.904.361.90
1.883.482.352.731.791.882.581.371.511.55
2.26
Indirectand Induced
Wages per Unitof Output
(Rs)
0.170.210.220.230.220.240.190.210.320.340.280.350.310.170.250.130.180.200.180.150.200.220.170.140.190.200.200.22
0.210.240.210.260.230.150.390.150.230.24
0.17
Source: Based on author's calculations from Punjab input-output table for 1979/80 (Table 44, Appendix 1).
food processing industries such as grain mill products, sawmills, sugar and confectionery,dairy products, cotton ginning, furniture, and edible oils that had the highest indirectincome and employment gains. A distinguishing feature of all these sectors was thatthey obtained almost all of their raw materials from local sources. In 1979/80, inaddition to the agroprocessing industries, some other basic and machine good industries,such as basic metals, metal products, other chemicals, electrical and nonelectricalmachine goods, and drugs and Pharmaceuticals, also recorded relatively higher indirectincome and employment gains. It is significant that trade and transport, other services,
85
banking, and real estate in the tertiary sector also generated fairly high levels of indirectincomes. This suggests a gradual expansion and deepening of the industrial structurein the state.
The value of consumption multipliers in 1969/70 was 1.86, suggesting that con-sumption-oriented activity in the state had a substantial impact despite large importsof industrial and consumer goods. In 1979/80, the consumption multipliers had avalue of 1.62, indicating that consumption-based activity continued to be highly impor-tant for the economy. The highest induced-income and employment gains were recordedby the sectors that occupy an important place in the consumption basket—primarilyagriculture-based industries. However, because of direct and indirect effects, someother industries in heavy and basic areas also became important. In addition to themanufacturing sectors, construction emerged as significant in the generation of indirectas well as induced income and employment.
86
CONCLUSIONS AND POLICY IMPLICATIONS
The main conclusion of this study is that rapid agricultural transformation is apotent instrument for bringing about significant acceleration in the overall growth andtransformation of a labor-surplus economy dominated by the agricultural sector. In thecase of Punjab, after adoption of the new seed-fertilizer technology there was a markedincrease in the growth rate of agriculture, which in turn accelerated growth in othersectors of the state economy through input, output, and consumption linkages.
The technology improvement and upgrading in agriculture and other sectors of theeconomy resulted in more roundabout methods of production and a higher use ofintermediate inputs, thereby strengthening interindustry linkages. Further, significantincreases in per capita income led to much higher demand for consumption goods,and since meeting the consumption needs of the people constitutes a major economicactivity in the state, the inducement effects of consumption were also quite substantial.
In short, rapid agricultural growth, by raising the incomes of an overwhelminglylarge proportion of the labor force, not only made a deep dent in rural poverty but alsoled to development of other sectors through forward and backward linkage effects. Itshould, however, be noted that the direct and indirect effects of increased economicactivity in both agriculture and manufacturing in Punjab have been considerably re-duced, since the state is a large importer of modern agricultural inputs such as fertilizers,insecticides, and diesel fuel; raw materials for manufacturing such as coal, pig iron,and metals; and numerous finished goods for consumption. On the other hand, Punjabhas benefited immensely from the existence of an assured market for exports of agricul-tural surpluses and industrial products and from the easy availability of inputs such asfertilizers and diesel fuel at nationally subsidized rates.
With the rapid development of the economy, the nature and quantum of forwardand backward linkages being generated in the economy has grown significantly, indi-cating a deepening of intersectoral relationships. A comparative analysis of the 1969/70and 1979/80 input-output tables for Punjab shows that by 1979/80, besides theagriculture and agroprocessing sectors, many machine-based and metal-based industriesas well as trade, transport, banking, real estate, and other services were generatinghigh forward and backward linkages despite large import leakages. The multiplieranalysis confirms that between 1969/70 and 1979/80, not only the farm sectors andagroprocessing industries, but sectors such as basic metals, metal products, machinegoods, electrical and nonelectrical machinery, and construction as well as most tertiaryservices began to record high indirect and induced income and employment.
Some useful lessons in development strategy can be learned from the Punjab modelof growth. The Punjab experience demonstrates that it is possible for a region withina large country to enjoy the fruits of specialization and comparative advantage throughtrade and integration with the rest of the country. The state was able to export largeagricultural surpluses and some industrial products to the rest of India at favorableprices and also obtained various inputs for modernized agriculture and industry fromthe rest of the country. This enabled Punjab to exploit fully its comparative advantagein rice, wheat, and cotton production and in agroprocessing and other industries.
Although substantial resources were transferred to Punjab for both rehabilitationand infrastructural investment for many years after independence, there is evidence
87
to suggest that a large outflow of funds from the state has been invested in the rest ofIndia since Punjab became highly surplus in agricultural production. Simultaneously,a large number of agricultural laborers migrated to Punjab from Bihar and other relativelyless-developed states of India. Thus, in the context of an "open" regional economy,the gains of development are being shared with the rest of the economy.
Finally, Punjab was able to pioneer the green revolution and thereby transform itsagriculture. Its rapid overall growth was due primarily to the state's large investmentsin irrigation, power, roads, communications, and other rural and urban infrastructure.These investments were financed both through large central plan transfers and throughresources internally mobilized by the state. The availability of this infrastructure wasmainly responsible for the adaptation of the Mexican seed-fertilizer technology to localconditions and for its rapid spread and successful exploitation by Punjab farmers. Thepolicymakers were also able to create an appropriate institutional framework thatassured the farmers of remunerative prices for all produce brought by them to themarket. The ensured profitability of the new technology gave surplus farmers theenthusiasm and confidence needed to undertake fairly large private investments inirrigation, land improvements, and other farm assets, thereby further supplementingpublic investment in rural infrastructure. The policy lesson to be learned from thePunjab experience is that large investment in rural and urban infrastructure is a precon-dition for agricultural development and for rapid growth of both agriculture and othersectors of the economy.
88
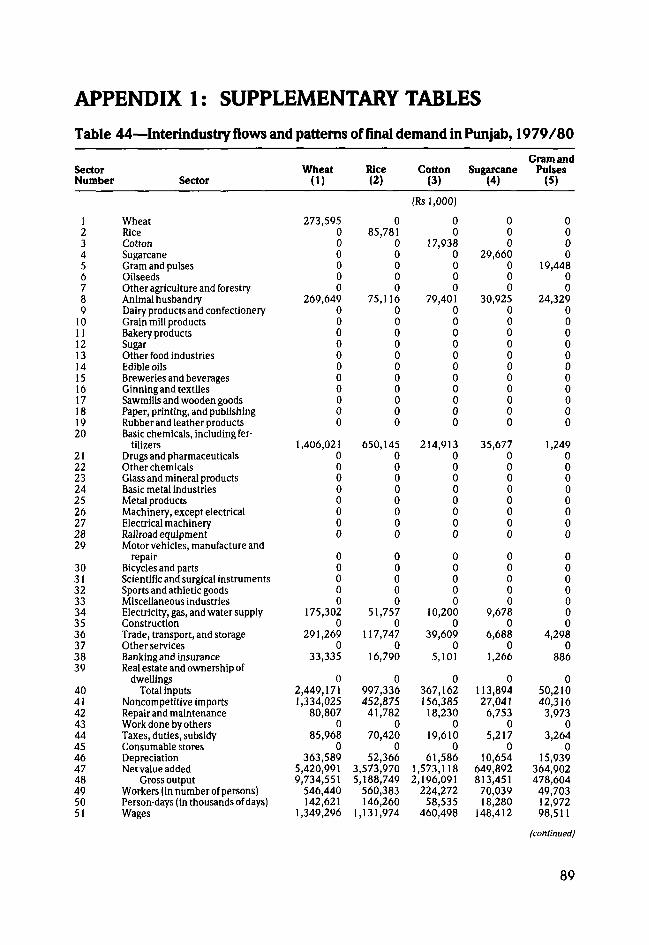
APPENDIX 1: SUPPLEMENTARY TABLES
Table 44—Interindustry flows and patterns of final demand in Punjab, 1979/80
SectorNumber
123456789
1011121314151617161920
212223242526272829
30313233343536373839
404142434445464748495051
Sector
WheatRiceCottonSugarcaneGram and pulsesOilseedsOther agriculture and forestryAnimal husbandryDairy products and confectioneryGrain mill productsBakery productsSugarOther food industriesEdible oilsBreweries and beveragesGinning and textilesSawmills and wooden goodsPaper, printing, and publishingRubber and leather productsBasic chemicals, including fer-
tilizersDrugs and PharmaceuticalsOther chemicalsGlass and mineral productsBasic metal industriesMetal productsMachinery, except electricalElectrical machineryRailroad equipmentMotor vehicles, manufacture and
repairBicycles and partsScientific and surgical instrumentsSports and athletic goodsMiscellaneous industriesElectricity, gas, and water supplyConstructionTrade, transport, and storageOther servicesBanking and insuranceReal estate and ownership of
dwellingsTotal inputs
Noncompetitive importsRepair and maintenanceWork done by othersTaxes, duties, subsidyConsumable storesDepreciationNet value added
Gross outputWorkers (in number of persons)Person-days (in thousands of days)Wages
Wheat(1)
273,595000000
269,64900000000000
1,406,02100000000
00000
175,3020
291,2690
33,335
02,449,1711,334,025
80,8070
85,9680
363,5895,420,9919,734,551
546,440142,621
1,349,296
Rice(2)
085,781
00000
75,11600000000000
650,14500000000
00000
51,7570
117,7470
16,790
0997,336452,875
41,7820
70,4200
52,3663,573,9705,188,749
560,383146,260
1,131,974
Cotton(3)
(Rs 1,000)
00
17,9380000
79,40100000000000
214,91300000000
00000
10,2000
39,6090
5,101
0367,162156,38518,230
019,610
061,586
1,573,1182,196,091
224,27258,535
460,498
Sugarcane(4)
000
29,660000
30,92500000000000
35,67700000000
00000
9,6780
6,6880
1,266
0113,89427,0416,753
05,217
010,654
649,892813,45170,03918,280
148,412
Gram andPulses
(S)
0000
19,44800
24,32900000000000
1,24900000000
0000000
4,2980
886
050,21040,3163,973
03,264
015,939
364,902478,60449,70312,97298,511
(continued)
89
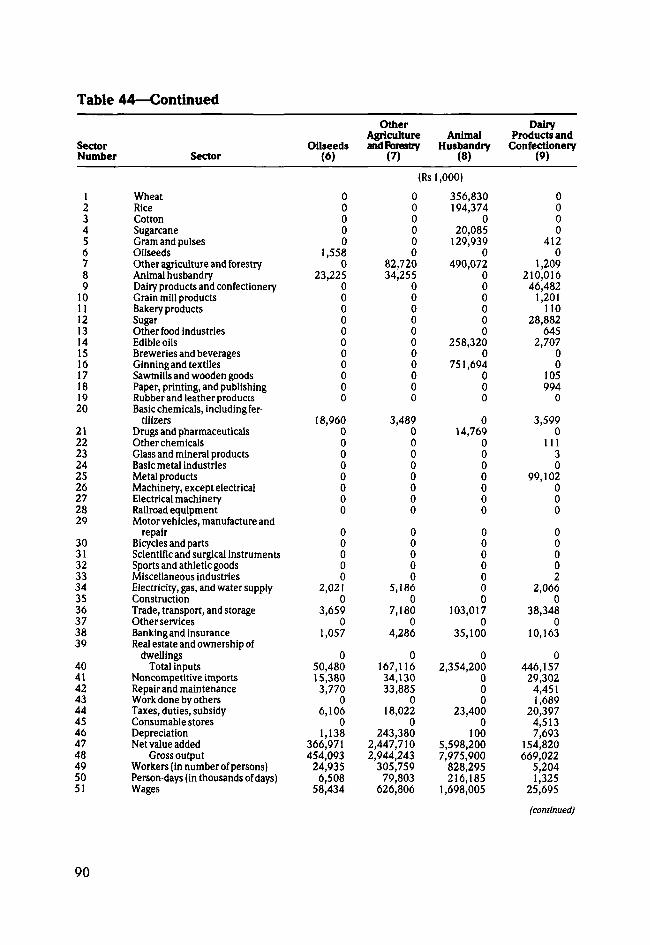
Table 44—Continued
SectorNumber
123456789
1011121314151617181920
212223242526272829
30313233343536373839
404142434445464748495051
Sector
WheatRiceCottonSugarcaneGram and pulsesOilseedsOther agriculture and forestryAnimal husbandryDairy products and confectioneryGrain mill productsBakery productsSugarOther food industriesEdible oilsBreweries and beveragesGinning and textilesSawmills and wooden goodsPaper, printing, and publishingRubber and leather productsBasic chemicals, including fer-
tilizersDrugs and PharmaceuticalsOther chemicalsGlass and mineral productsBasic metal industriesMetal productsMachinery, except electricalElectrical machineryRailroad equipmentMotor vehicles, manufacture and
repairBicycles and partsScientific and surgical instrumentsSports and athletic goodsMiscellaneous industriesElectricity, gas, and water supplyConstructionTrade, transport, and storageOther servicesBanking and insuranceReal estate and ownership of
dwellingsTotal inputs
Noncompetltive importsRepair and maintenanceWork done by othersTaxes, duties, subsidyConsumable storesDepreciationNet value added
Gross outputWorkers (in number of persons)Person-days (in thousands of days)Wages
Oilseeds(6)
00000
1,5580
23,22500000000000
18,96000000000
00000
2,0210
3,6590
1,057
050,48015,3803,770
06,106
01,138
366,971454,093
24,9356,508
58,434
OtherAgricultureand Forestry
(7)
(Rsl
000000
82,72034,255
00000000000
3,48900000000
00000
5,1860
7,1800
4,286
0167,11634,13033,885
018,022
0243,380
2,447,7102,944,243
305,75979,803
626,806
AnimalHusbandry
(8)
,000)
356,830194,374
020,085
129,9390
490,072000000
258,3200
751,694000
014,769
0000000
0000000
103,0170
35,100
02,354,200
000
23,4000
1005,598,2007,975,900
828,295216,185
1,698,005
DairyProducts and
Confectionery(9)
0000
4120
1,209210,01646,482
1,201110
28,882645
2,70700
105994
0
3,5990
11130
99,102000
00002
2,0660
38,3480
10,163
0446,157
29,3024,4511,689
20,3974,5137,693
154,820669,022
5,2041,325
25,695
(continued)
90
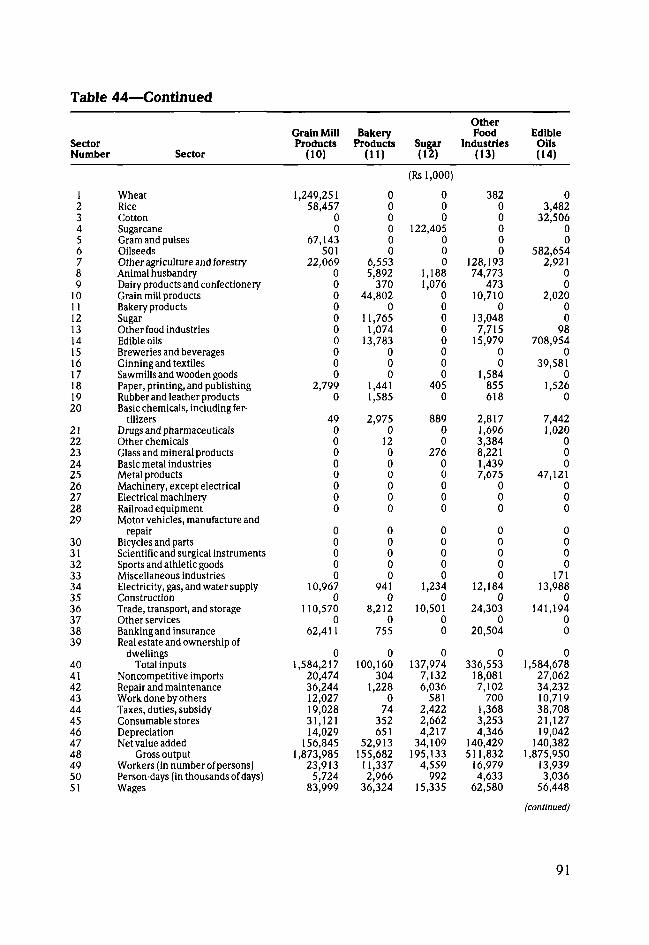
Table 44—Continued
SectorNumber Sector
Grain MillProducts
(10)
BakeryProducts
(11)Sugar(12)
OtherFood
Industries(13)
EdibleOils(14)
(Rs 1,000)
123456789
1011121314151617181920
212223242526272829
30313233343536373839
404142434445464748495051
WheatRiceCottonSugarcaneGram and pulsesOilseedsOther agriculture and forestryAnimal husbandryDairy products and confectioneryGrain mill productsBakery productsSugarOther food industriesEdible oilsBreweries and beveragesGinning and textilesSawmills and wooden goodsPaper, printing, and publishingRubber and leather productsBasic chemicals, including fer-
tilizersDrugs and PharmaceuticalsOther chemicalsGlass and mineral productsBasic metal industriesMetal productsMachinery, except electricalElectrical machineryRailroad equipmentMotor vehicles, manufacture and
repairBicycles and partsScientific and surgical instrumentsSports and athletic goodsMiscellaneous industriesElectricity, gas, and water supplyConstructionTrade, transport, and storageOther servicesBanking and insuranceReal estate and ownership of
dwellingsTotal inputs
Noncompetitive importsRepair and maintenanceWork done by othersTaxes, duties, subsidyConsumable storesDepreciationNet value added
Gross outputWorkers (in number of persons)Person-days (in thousands of days)Wages
1,249,25158,457
00
67,143501
22,0690000000000
2,7990
4900000000
00000
10,9670
110,5700
62,411
01,584,217
20,47436,24412,02719,02831,12114,029
156,8451,873,985
23,9135,724
83,999
000000
6,5535,892
37044,802
011,765
1,07413,783
000
1,4411,585
2,9750
12000000
00000
9410
8,2120
755
0100,160
3041,228
074
352651
52,913155,682
11,3372,966
36,324
000
122,405000
1,1881,076
00000000
4050
88900
27600000
00000
1,2340
10,50100
0137,974
7,1326,036
5812,4222,6624,217
34,109195,133
4,559992
15,335
38200000
128,19374,773
47310,710
013,0487,715
15,97900
1,584855618
2,8171,6963,3848,2211,4397,675
000
00000
12,1840
24,3030
20,504
0336,553
18,0817,102
7001,3683,2534,346
140,429511,832
16,9794,633
62,580
03,482
32,50600
582,6542,921
00
2,02000
98708,954
039,581
01,526
0
7,4421,020
000
47,121000
0000
17113,988
0141,194
00
01,584,678
27,06234,23210,71938,70821,12719,042
140,3821,875,950
13,9393,036
56,448
(continued)
91
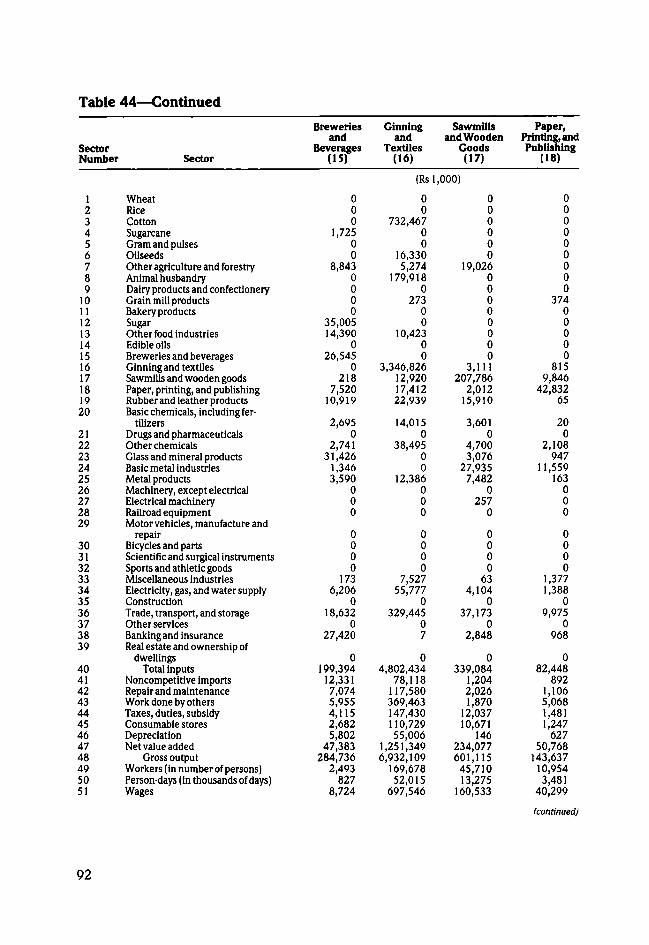
Table 44—Continued
SectorNumber Sector
Breweriesand
Beverages(15)
Ginningand
Textiles(16)
Sawmillsand Wooden
Goods(17)
Paper,Printing, andPublishing
(18)
(Rs 1,000)
123456789
1011121314151617181920
212223242526272829
30313233343536373839
404142434445464748495051
WheatRiceCottonSugarcaneGram and pulsesOilseedsOther agriculture and forestryAnimal husbandryDairy products and confectioneryGrain mill productsBakery productsSugarOther food industriesEdible oilsBreweries and beveragesGinning and textilesSawmills and wooden goodsPaper, printing, and publishingRubber and leather productsBasic chemicals, including fer-
tilizersDrugs and PharmaceuticalsOther chemicalsGlass and mineral productsBasic metal industriesMetal productsMachinery, except electricalElectrical machineryRailroad equipmentMotor vehicles, manufacture and
repairBicycles and partsScientific and surgical instrumentsSports and athletic goodsMiscellaneous industriesElectricity, gas, and water supplyConstructionTrade, transport, and storageOther servicesBanking and insuranceReal estate and ownership of
dwellingsTotal inputs
Noncompetitive importsRepair and maintenanceWork done by othersTaxes, duties, subsidyConsumable storesDepreciationNet value added
Gross outputWorkers (in number of persons)Person-days (in thousands of days)Wages
000
1,72500
8,8430000
35,00514,390
026,545
0218
7,52010,919
2,6950
2,74131,426
1,3463,590
000
0000
1736,206
018,632
027,420
0199,39412,3317,0745,9554,1152,6825,802
47,383284,736
2,493827
8,724
00
732,46700
16,3305,274
179,9180
27300
10,42300
3,346,82612,92017,41222,939
14,0150
38,49500
12,386000
0000
7,52755,777
0329,445
07
04,802,434
78,118117,580369,463147,430110,72955,006
1,251,3496,932,109
169,67852,015
697,546
000000
19,02600000000
3,111207,786
2,01215,910
3,6010
4,7003,076
27,9357,482
0257
0
0000
634,104
037,173
02,848
0339,084
1,2042,0261,870
12,03710,671
146234,077601,11545,71013,275
160,533
000000000
37400000
8159,846
42,83265
200
2,108947
11,559163
000
0000
1,3771,388
09,975
0968
082,448
8921,1065,0681,4811,247
62750,768
143,63710,9543,481
40,299
(continued)
92
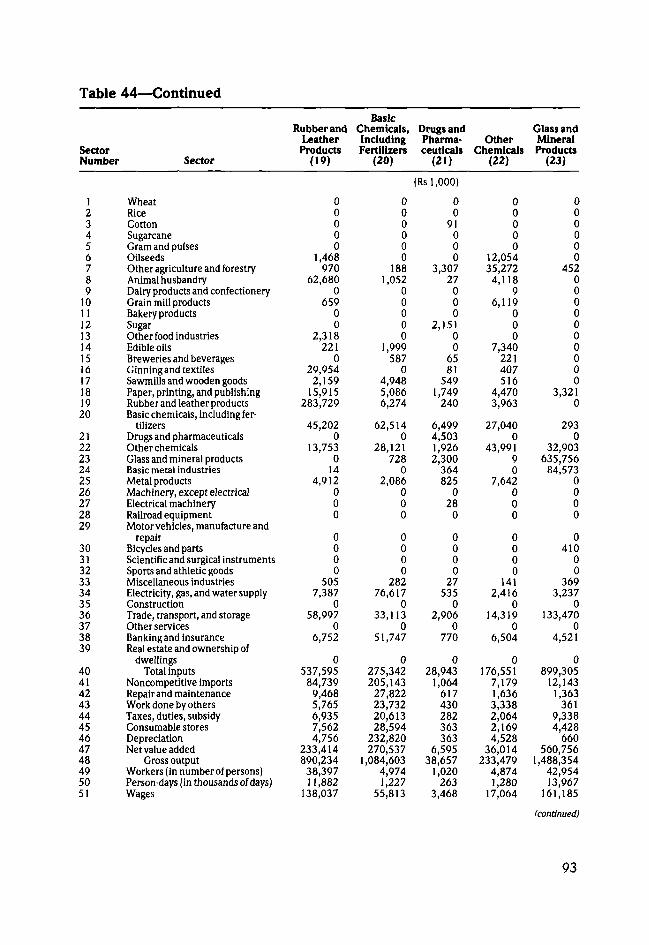
Table 44—Continued
SectorNumber
123456789
1011121314151617181920
212223242526272829
30313233343536373839
404142434445464748495051
Sector
WheatRiceCottonSugarcaneGram and pulsesOilseedsOther agriculture and forestryAnimal husbandryDairy products and confectioneryGrain mill productsBakery productsSugarOther food industriesEdible oilsBreweries and beveragesGinning and textilesSawmills and wooden goodsPaper, printing, and publishingRubber and leather productsBasic chemicals, including fer-
tilizersDrugs and PharmaceuticalsOther chemicalsGlass and mineral productsBasic metal industriesMetal productsMachinery, except electricalElectrical machineryRailroad equipmentMotor vehicles, manufacture and
repairBicycles and partsScientific and surgical instrumentsSports and athletic goodsMiscellaneous industriesElectricity, gas, and water supplyConstructionTrade, transport, and storageOther servicesBanking and insuranceReal estate and ownership of
dwellingsTotal inputs
Noncompetitive importsRepair and maintenanceWork done by othersTaxes, duties, subsidyConsumable storesDepreciationNet value added
Gross outputWorkers (in number of persons)Person-days (in thousands of days)Wages
RubberandLeather
Products(19)
00000
1,468970
62,6800
65900
2,318221
029,9542,159
15,915283,729
45,2020
13,7530
144,912
000
0000
5057,387
058,997
06,752
0537,595
84,7399,4685,7656,9357,5624,756
233,414890,23438,39711,882
138,037
BasicChemicals,IncludingFertilizers
(20)
000000
1881,052
00000
1,999587
04,9485,0866,274
62,5140
28,121728
02,086
000
0000
28276,617
033,113
051,747
0275,342205,143
27,82223,73220,61328,594
232,820270,537
1,084,6034,9741,227
55,813
Drugs andPharma-ceuticals
(21)
(Rs 1,000)
00
91000
3,30727
000
2,15100
6581
5491,749
240
6,4994,5031,9262,300
364825
028
0
0000
27535
02,906
0770
028,943
1,064617430282363363
6,59538,657
1,020263
3,468
OtherChemicals
(22)
00000
12,05435,272
4,1189
6,119000
7,340221407516
4,4703,963
27,0400
43,99190
7,642000
0000
1412,416
014,319
06,504
0176,551
7,1791,6363,3382,0642,1694,528
36,014233,479
4,8741,280
17,064
Glass andMineralProducts
(23)
000000
4520000000000
3,3210
2930
32,903635,756
84,5730000
0410
00
3693,237
0133,470
04,521
0899,305
12,1431,363
3619,3384,428
660560,756
1,488,35442,95413,967
161,185
(continued)
93
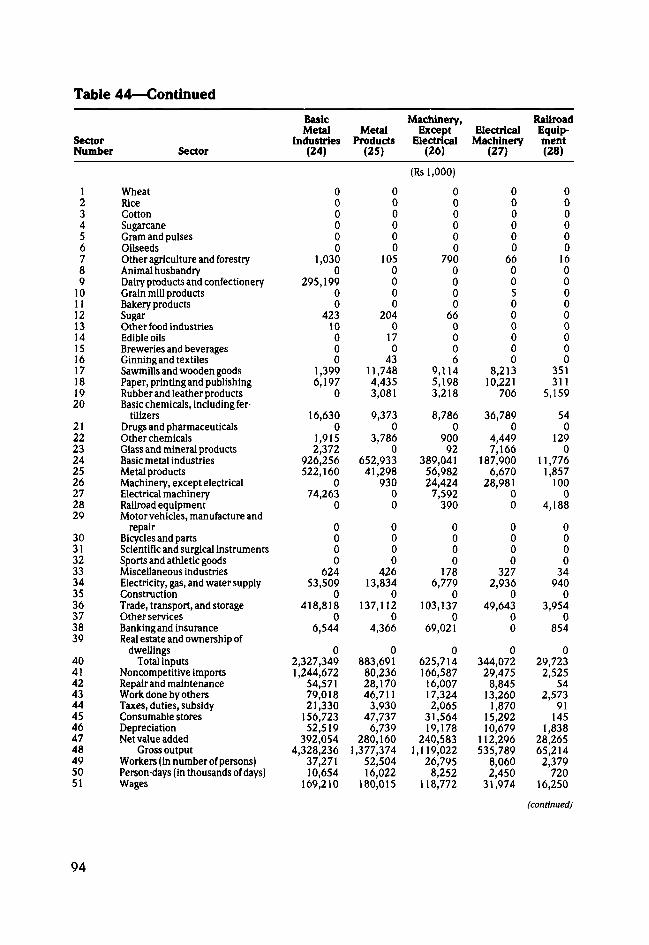
Table 44—Continued
SectorNumber
123456789
1011121314151617181920
212223242526272829
30313233343536373839
404142434445464748495051
Sector
WheatRiceCottonSugarcaneGram and pulsesOilseedsOther agriculture and forestryAnimal husbandryDairy products and confectioneryGrain mill productsBakery productsSugarOther food industriesEdible oilsBreweries and beveragesGinning and textilesSawmills and wooden goodsPaper, printing and publishingRubber and leather productsBasic chemicals, including fer-
tilizersDrugs and PharmaceuticalsOther chemicalsGlass and mineral productsBasic metal industriesMetal productsMachinery, except electricalElectrical machineryRailroad equipmentMotor vehicles, manufacture and
repairBicycles and partsScientific and surgical instrumentsSports and athletic goodsMiscellaneous industriesElectricity, gas, and water supplyConstructionTrade, transport, and storageOther servicesBanking and insuranceReal estate and ownership of
dwellingsTotal inputs
Noncompetitive importsRepair and maintenanceWork done by othersTaxes, duties, subsidyConsumable storesDepreciationNet value added
Gross outputWorkers (in number of persons)Person-days (in thousands of days)Wages
BasicMetal
Industries(24)
000000
1,0300
295,19900
42310000
1,3996,197
0
16,6300
1,9152,372
926,256522,160
074,263
0
0000
62453,509
0418,818
06,544
02,327,3491,244,672
54,57179,01821,330
156,72352,519
392,0544,328,236
37,27110,654
169,210
MetalProducts
(25)
000000
1050000
2040
170
4311,7484,4353,081
9,3730
3,7860
652,93341,298
93000
0000
42613,834
0137,112
04,366
0883,69180,23628,17046,7113,930
47,7376,739
280,1601,377,374
52,50416,022
180,015
Machinery,Except
Electrical(26)
(Rs 1,000)
000000
7900000
660006
9,1145,1983,218
8,7860
90092
389,04156,98224,424
7,592390
0000
1786,779
0103,137
069,021
0625,714166,58716,00717,3242,065
31,56419,178
240,5831,119,022
26,7958,252
118,772
ElectricalMachinery
(27)
000000
66005000000
8,21310,221
706
36,7890
4,4497,166
187,9006,670
28,98100
0000
3272,936
049,643
00
0344,07229,4758,845
13,2601,870
15,29210,679
112,296535,789
8,0602,450
31,974
RailroadEquip-ment(28)
000000
16000000000
351311
5,159
540
1290
11,7761,857
1000
4,188
0000
34940
03,954
0854
029,7232,525
542,573
91145
1,83828,26565,2142,379
72016,250
(continued)
94
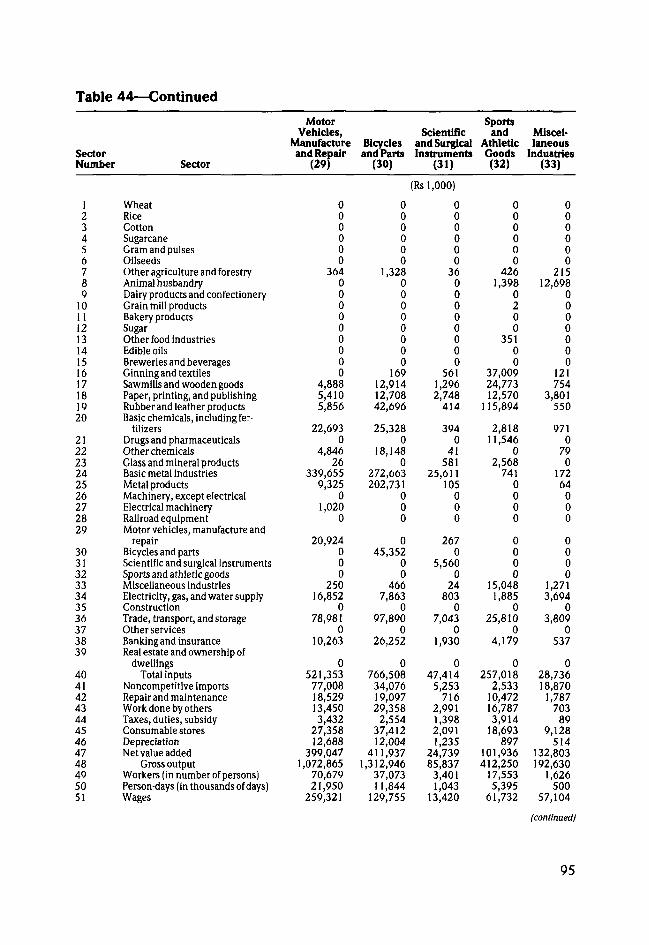
Table 44—Continued
SectorNumber
123456789
1011121314151617181920
212223242526272829
30313233343536373839
404142434445464748495051
Sector
WheatRiceCottonSugarcaneGram and pulsesOilseedsOther agriculture and forestryAnimal husbandryDairy products and confectioneryGrain mill productsBakery productsSugarOther food industriesEdible oilsBreweries and beveragesGinning and textilesSawmills and wooden goodsPaper, printing, and publishingRubber and leather productsBasic chemicals, including fer-
tilizersDrugs and PharmaceuticalsOther chemicalsGlass and mineral productsBasic metal industriesMetal productsMachinery, except electricalElectrical machineryRailroad equipmentMotor vehicles, manufacture and
repairBicycles and partsScientific and surgical instrumentsSports and athletic goodsMiscellaneous industriesElectricity, gas, and water supplyConstructionTrade, transport, and storageOther servicesBanking and insuranceReal estate and ownership of
dwellingsTotal inputs
Noncompetitive importsRepair and maintenanceWork done by othersTaxes, duties, subsidyConsumable storesDepreciationNet value added
Gross outputWorkers (in number of persons)Person-days (in thousands of days)Wages
MotorVehicles,
Manufactureand Repair
(29)
000000
364000000000
4,8885,4105,856
22,6930
4,84626
339,6559,325
01,020
0
20,924000
25016,852
078,981
010,263
0521,353
77,00818,52913,4503,432
27,35812,688
399,0471,072,865
70,67921,950
259,321
Bicyclesand Parts
(30)
000000
1,32800000000
16912,91412,70842,696
25,3280
18,1480
272,663202,731
000
045,352
00
4667,863
097,890
026,252
0766,508
34,07619,09729,358
2,55437,41212,004
411,9371,312,946
37,07311,844
129,755
Scientificand SurgicalInstruments
(31)
(Rs 1,000)
000000
3600000000
5611,2962,748
414
3940
41581
25,611105
000
2670
5,5600
24803
07,043
01,930
047,414
5,253716
2,9911,3982,0911,235
24,73985,837
3,4011,043
13,420
Sportsand
AthleticGoods(32)
000000
4261,398
0200
35100
37,00924,77312,570
115,894
2,81811,546
02,568
7410000
0000
15,0481,885
025,810
04,179
0257,018
2,53310,47216,7873,914
18,693897
101,936412,250
17,5535,395
61,732
Miscel-laneous
Industries(33)
000000
21512,698
0000000
121754
3,801550
9710
790
17264
000
0000
1,2713,694
03,809
0537
028,73618,870
1,787703
899,128
514132,803192,630
1,626500
57,104
(continued)
95
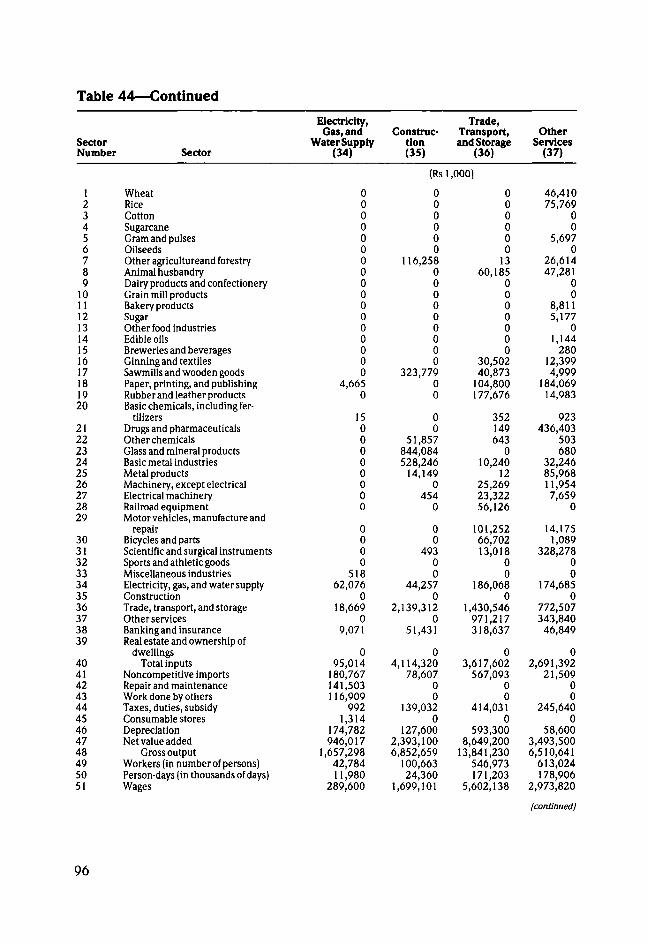
Table 44—Continued
SectorNumber
123456789
1011121314151617181920
212223242526272829
30313233343536373839
404142434445464748495051
Sector
WheatRiceCottonSugarcaneGram and pulsesOilseedsOther agricultureand forestryAnimal husbandryDairy products and confectioneryGrain mill productsBakery productsSugarOther food industriesEdible oilsBreweries and beveragesGinning and textilesSawmills and wooden goodsPaper, printing, and publishingRubber and leather productsBasic chemicals, including fer-
tilizersDrugs and PharmaceuticalsOther chemicalsGlass and mineral productsBasic metal industriesMetal productsMachinery, except electricalElectrical machineryRailroad equipmentMotor vehicles, manufacture and
repairBicycles and partsScientific and surgical instrumentsSports and athletic goodsMiscellaneous industriesElectricity, gas, and water supplyConstructionTrade, transport, and storageOther servicesBanking and insuranceReal estate and ownership of
dwellingsTotal inputs
Noncompetitive importsRepair and maintenanceWork done by othersTaxes, duties, subsidyConsumable storesDepreciationNet value added
Gross outputWorkers (in number of persons)Person-days (in thousands of days)Wages
Electricity,Gas, and
Water Supply(34)
00000000000000000
4,6650
1500000000
0000
51862,076
018,669
09,071
095,014
180,767141,503116,909
9921,314
174,782946,017
1,657,29842,78411,980
289,600
Construc-tion(35)
(Rs
000000
116,258000000000
323,77900
00
51,857844,084528,246
14,1490
4540
00
49300
44,2570
2,139,3120
51,431
04,114,320
78,60700
139,0320
127,6002,393,1006,852,659
100,66324,360
1,699,101
Trade,Transport,and Storage
(36)
1,000)
000000
1360,185
0000000
30,50240,873
104,800177,676
352149643
010,240
1225,26923,32256,126
101,25266,70213,018
00
186,0680
1,430,546971,217318,637
03,617,602
567,09300
414,0310
593,3008,649,200
13,841,230546,973171,203
5,602,138
OtherServices
(37)
46,41075,769
00
5,6970
26,61447,281
00
8,8115,177
01,144
28012,3994,999
184,06914,983
923436,403
503680
32,24685,96811,9547,659
0
14,1751,089
328,27800
174,6850
772,507343,84046,849
02,691,392
21,50900
245,6400
58,6003,493,5006,510,641
613,024178,906
2,973,820
(continued!
96
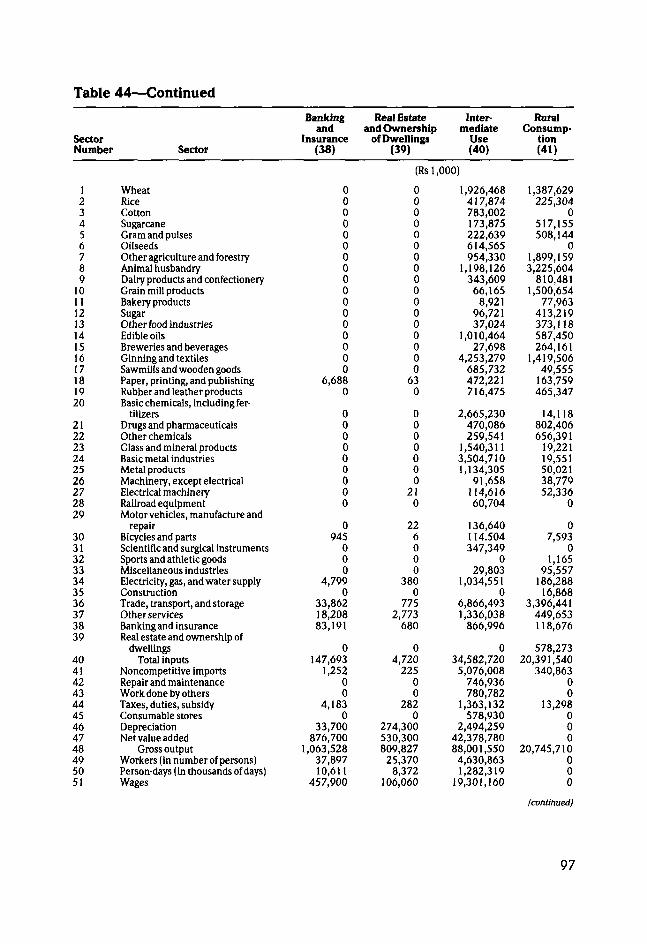
Table 44—Continued
SectorNumber Sector
Bankingand
Insurance(38)
Real Estateand Ownership
of Dwellings(39)
Inter-mediate
Use(40)
RuralConsump-
tion(41)
(Rs 1,000)
123456789
1011121314151617181920
212223242526272829
30313233343536373839
404142434445464748495051
WheatRiceCottonSugarcaneGram and pulsesOilseedsOther agriculture and forestryAnimal husbandryDairy products and confectioneryGrain mill productsBakery productsSugarOther food industriesEdible oilsBreweries and beveragesGinning and textilesSawmills and wooden goodsPaper, printing, and publishingRubber and leather productsBasic chemicals, including fer-
tilizersDrugs and PharmaceuticalsOther chemicalsGlass and mineral productsBasic metal industriesMetal productsMachinery, except electricalElectrical machineryRailroad equipmentMotor vehicles, manufacture and
repairBicycles and partsScientific and surgical instrumentsSports and athletic goodsMiscellaneous industriesElectricity, gas, and water supplyConstructionTrade, transport, and storageOther servicesBanking and insuranceReal estate and ownership of
dwellingsTotal inputs
Noncompetitive importsRepair and maintenanceWork done by othersTaxes, duties, subsidyConsumable storesDepreciationNet value added
Gross outputWorkers (in number of persons)Person-days (in thousands of days)Wages
00000000000000000
6,6880
000000000
0945
000
4,7990
33,86218,20883,191
0147,693
1,25200
4,1830
33,700876,700
1,063,52837,89710,611
457,900
00000000000000000
630
0000000
210
226000
3800
7752,773
680
04,720
22500
2820
274,300530,300809,827
25,3708,372
106,060
1,926,468417,874783,002173,875222,639614,565954,330
1,198,126343,609
66,1658,921
96,72137,024
1,010,46427,698
4,253,279685,732472,221716,475
2,665,230470,086259,541
1,540,3113,504,7101,134,305
91,658114,61660,704
136,640114.504347,349
029,803
1,034,5510
6,866,4931,336,038
866,996
034,582,720
5,076,008746,936780,782
1,363,132578,930
2,494,25942,378,78088,001,550
4,630,8631,282,319
19,301,160
1,387,629225,304
0517,155508,144
01,899,1593,225,604
810,4811,500,654
77,963413,219373,118587,450264,161
1,419,50649,555
163,759465,347
14,118802,406656,391
19,22119,55150,02138,77952,336
0
07,593
01,165
95,557186,288
16,8683,396,441
449,653118,676
578,27320,391,540
340,86300
13,298000
20,745,710000
(continued)
97
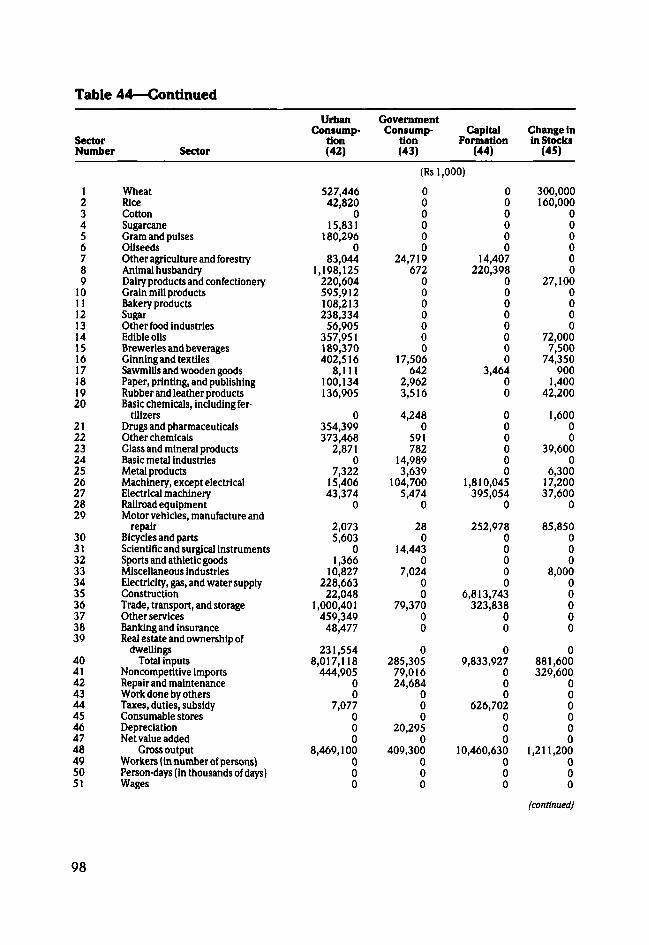
Table 44—Continued
SectorNumber
123456789
1011121314151617181920
212223242526272829
30313233343536373839
404142434445464748495051
Sector
WheatRiceCottonSugarcaneGram and pulsesOilseedsOther agriculture and forestryAnimal husbandryDairy products and confectioneryGrain mill productsBakery productsSugarOther food industriesEdible oilsBreweries and beveragesGinning and textilesSawmills and wooden goodsPaper, printing, and publishingRubber and leather productsBasic chemicals, including fer-
tilizersDrugs and PharmaceuticalsOther chemicalsGlass and mineral productsBasic metal industriesMetal productsMachinery, except electricalElectrical machineryRailroad equipmentMotor vehicles, manufacture and
repairBicycles and partsScientific and surgical instrumentsSports and athletic goodsMiscellaneous industriesElectricity, gas, and water supplyConstructionTrade, transport, and storageOther servicesBanking and insuranceReal estate and ownership of
dwellingsTotal inputs
Noncompetitive importsRepair and maintenanceWork done by othersTaxes, duties, subsidyConsumable storesDepreciationNet value added
Gross outputWorkers (in number of persons)Person-days (in thousands of days)Wages
UrbanConsump-
tion(42)
527,44642,820
015,831
180,2960
83,0441,198,125
220,604595,912108,213238,334
56,905357,951189,370402,516
8,111100,134136,905
0354,399373,468
2,8710
7,32215,40643,374
0
2,0735,603
01,366
10,827228,66322,048
1,000,401459,349
48,477
231,5548,017,118
444,90500
7,077000
8,469,100000
GovernmentConsump-
tion(43)
(Rsl,
000000
24,719672
0000000
17,506642
2,9623,516
4,2480
591782
14,9893,639
104,7005,474
0
280
14,4430
7,02400
79,37000
0285,305
79,01624,684
000
20,2950
409,300000
CapitalFormation
(44)
000)
000000
14,407220,398
00000000
3,46400
000000
1,810,045395,054
0
252,97800000
6,813,743323,838
00
09,833,927
000
626,702000
10,460,630000
Change inin Stocks
(45)
300,000160,000
000000
27,1000000
72,0007,500
74,350900
1,40042,200
1,60000
39,6000
6,30017,20037,600
0
85,850000
8,00000000
0881,600329,600
000000
1,211,200000
(continued)
98
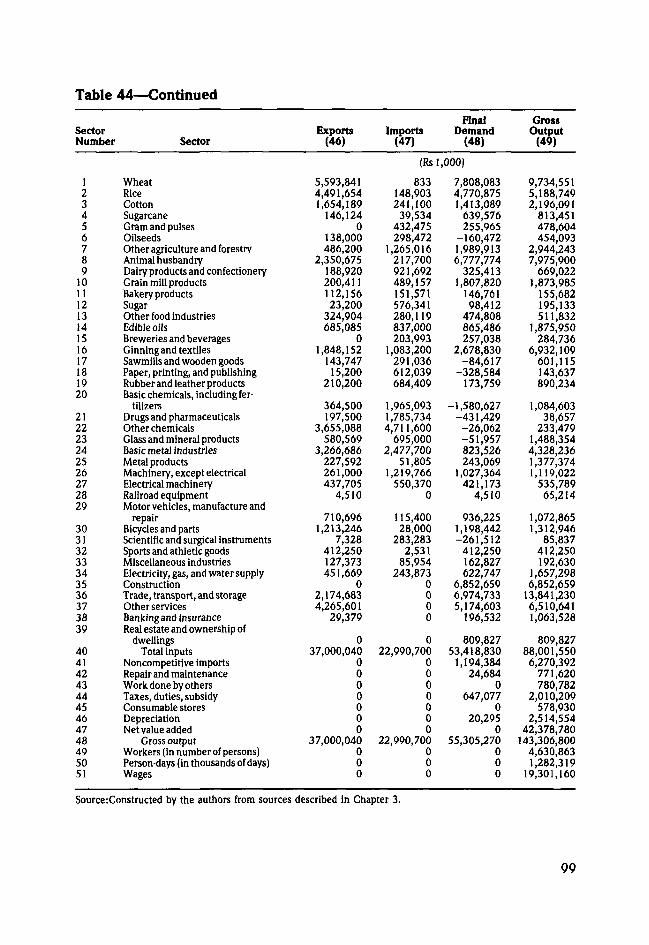
Table 44—Continued
SectorNumber
123456789
1011121314151617181920
212223242526272829
30313233343536373839
404142434445464748495051
Sector
WheatRiceCottonSugarcaneGram and pulsesOilseedsOther agriculture and forestryAnimal husbandryDairy products and confectioneryGrain mill productsBakery productsSugarOther food industriesEdible oilsBreweries and beveragesGinning and textilesSawmills and wooden goodsPaper, printing, and publishingRubber and leather productsBasic chemicals, including fer-
tilizersDrugs and PharmaceuticalsOther chemicalsGlass and mineral productsBasic metal industriesMetal productsMachinery, except electricalElectrical machineryRailroad equipmentMotor vehicles, manufacture and
repairBicycles and partsScientific and surgical instrumentsSports and athletic goodsMiscellaneous industriesElectricity, gas, and water supplyConstructionTrade, transport, and storageOther servicesBanking and insuranceReal estate and ownership of
dwellingsTotal inputs
Noncompetitive importsRepair and maintenanceWork done by othersTaxes, duties, subsidyConsumable storesDepreciationNet value added
Gross outputWorkers (in number of persons)Person-days (in thousands of days)Wages
Exports(46)
5,593,8414,491,6541,654,189
146,1240
138,000486,200
2,350,675188,920200,411112,15623,200
324,904685,085
01,848,152
143,74715,200
210,200
364,500197,500
3,655,088580,569
3,266,686227,592261,000437,705
4,510
710,6961,213,246
7,328412,250127,373451,669
02,174,6834,265,601
29,379
037,000,040
0000000
37,000,040000
Imports(47)
(Rs
833148,903241,100
39,534432,475298,472
1,265,016217,700921,692489,157151,571576,341280,119837,000203,993
1,083,200291,036612,039684,409
1,965,0931,785,7344,711,600
695,0002,477,700
51,8051,219,766
550,3700
115,40028,000
283,2832,531
85,954243,873
0000
022,990,700
0000000
22,990,700000
FinalDemand
(48)
1,000)
7,808,0834,770,8751,413,089
639,576255,965
-160,4721,989,9136,777,774
325,4131,807,820
146,76198,412
474,808865,486257,038
2,678,830-84,617
-328,584173,759
-1,580,627-431,429-26,062-51,957823,526243,069
1,027,364421,173
4,510
936,2251,198,442-261,512
412,250162,827622,747
6,852,6596,974,7335,174,603
196,532
809,82753,418,830
1,194,38424,684
0647,077
020,295
055,305,270
000
GrossOutput
(49)
9,734,5515,188,7492,196,091
813,451478,604454,093
2,944,2437,975,900
669,0221,873,985
155,682195,133511,832
1,875,950284,736
6,932,109601,115143,637890,234
1,084,60338,657
233,4791,488,3544,328,2361,377,3741,119,022
535,78965,214
1,072,8651,312,946
85,837412,250192,630
1,657,2986,852,659
13,841,2306,510,6411,063,528
809,82788,001,5506,270,392
771,620780,782
2,010,209578,930
2,514,55442,378,780
143,306,8004,630,8631,282,319
19,301,160
Source:Constructed by the authors from sources described in Chapter 3.
99
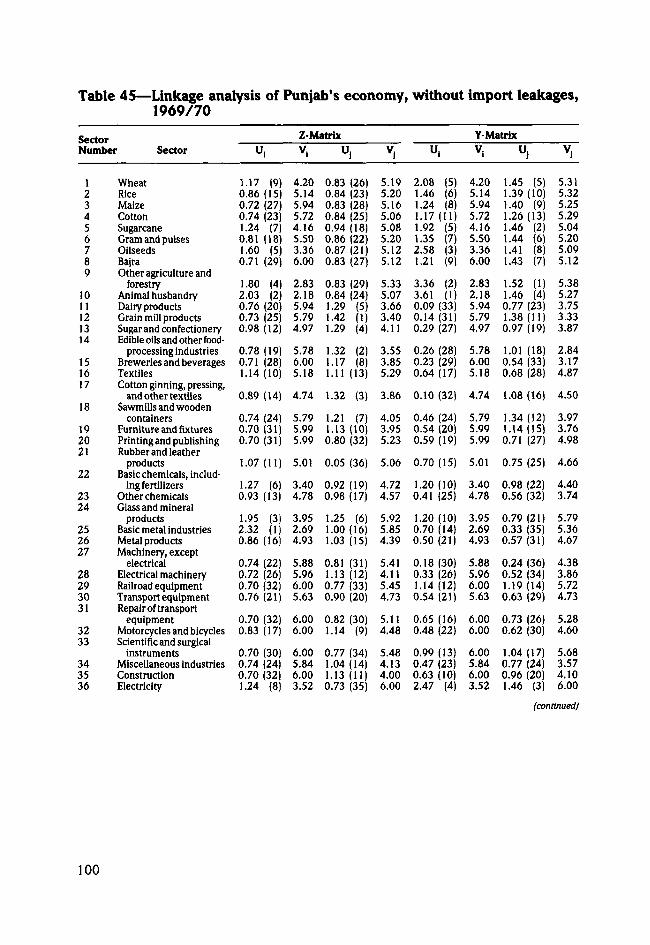
Table 45—Linkage analysis of Punjab's economy, without import leakages,1969/70
SectorNumber Sector
123456789
1011121314
151617
18
192021
22
2324
252627
282930• 5 1
J 1
3233
343536
WheatRiceMaizeCottonSugarcaneGram and pulsesOilseedsBajraOther agriculture and
forestryAnimal husbandryDairy productsGrain mill productsSugar and confectioneryEdible oils and other food-
processing industriesBreweries and beveragesTextilesCotton ginning, pressing,
and other textilesSawmills and wooden
containersFurniture and fixturesPrinting and publishingRubber and leather
productsBasic chemicals, includ-
ing fertilizersOther chemicalsGlass and mineral
productsBasic metal industriesMetal productsMachinery, except
electricalElectrical machineryRailroad equipmentTransport equipmentRepair of transport
equipmentMotorcycles and bicyclesScientific and surgical
instrumentsMiscellaneous industriesConstructionElectricity
U
1.170.860.720.741.240.811.600.71
1.802.030.760.730.98
0.780.711.14
0.89
0.740.700.70
1.07
1.270.93
1.952.320.86
0.740.720.700.76
0.700.83
0.700.740.701.24
'i
(9)(15)(27)(23)(7)
(18)(5)
(29)
(4)(2)
(20)(25)(12)
(19)(28)(10)
(14)
(24)(31)(31)
(11)
(6)(13)
(3)(1)
(16)
(22)(26)(32)(21)
(32)(17)
(30)(24)(32)
(8)
Z-Matrixv i
4.205.145.945.724.165.503.366.00
2.832.185.945.794.97
5.786.005.18
4.74
5.795.995.99
5.01
3.404.78
3.952.694.93
5.885.966.005.63
6.006.00
6.005.846.003.52
U i
0.83 (26)0.84 (23)0.83 (28)0.84 (25)0.94 (18)0.86 (22)0.87 (21)0.83 (27)
0.83 (29)0.84 (24)1.29 (5)1.42 (1)1.29 (4)
1.32 (2)1.17 (8)1.11 (13)
1.32 (3)
1.21 (7)1.13 (10)0.80 (32)
0.05 (36)
0.92 (19)0.98 (17)
1.25 (6)1.00 (16)1.03 (15)
0.81 (31)1.13 (12)0.77 (33)0.90 (20)
0.82 (30)1.14 (9)
0.77 (34)1.04 (14)1.13 (11)0.73 (35)
Vi
5.195.205.165.065.085.205.125.12
5.335.073.663.404.11
3.553.855.29
3.86
4.053.955.23
5.06
4.724.57
5.925.854.39
5.414.115.454.73
5.114.48
5.484.134.006.00
U
2.081.461.241.171.921.352.581.21
3.363.610.090.140.29
0.260.230.64
0.10
0.460.540.59
0.70
1.200.41
1.200.700.50
0.180.331.140.54
0.650.48
0.990.470.632.47
'i
(5)(6)(8)
(11)(5)(7)(3)(9)
(2)(1)
(33)(31)(27)
(28)(29)(17)
(32)
(24)(20)(19)
(15)
(10)(25)
(10)(14)(21)
(30)(26)(12)(21)
(16)(22)
(13)(23)(10)
(4)
Y-Matrix
V i
4.205.145.945.724.165.503.366.00
2.832.185.945.794.97
5.786.005.18
4.74
5.795.995.99
5.01
3.404.78
3.952.694.93
5.885.966.005.63
6.006.00
6.005.846.003.52
U i
1.45 (5)1.39 (10)1.40 (9)1.26(13)1.46 (2)1.44 (6)1.41 (8)1.43 (7)
1.52 (1)1.46 (4)0.77 (23)1.38 (11)0.97 (19)
1.01 (18)0.54 (33)0.68 (28)
1.08 (16)
1.34 (12)1.14(15)0.71 (27)
0.75 (25)
0.98 (22)0.56 (32)
0.79 (21)0.33 (35)0.57 (31)
0.24 (36)0.52 (34)1.19(14)0.63 (29)
0.73 (26)0.62 (30)
1.04(17)0.77 (24)0.96 (20)1.46 (3)
Vi
5.315.325.255.295.045.205.095.12
5.385.273.753.333.87
2.843.174.87
4.50
3.973.764.98
4.66
4.403.74
5.795.364.67
4.383.865.724.73
5.284.60
5.683.574.106.00
(continued)
100
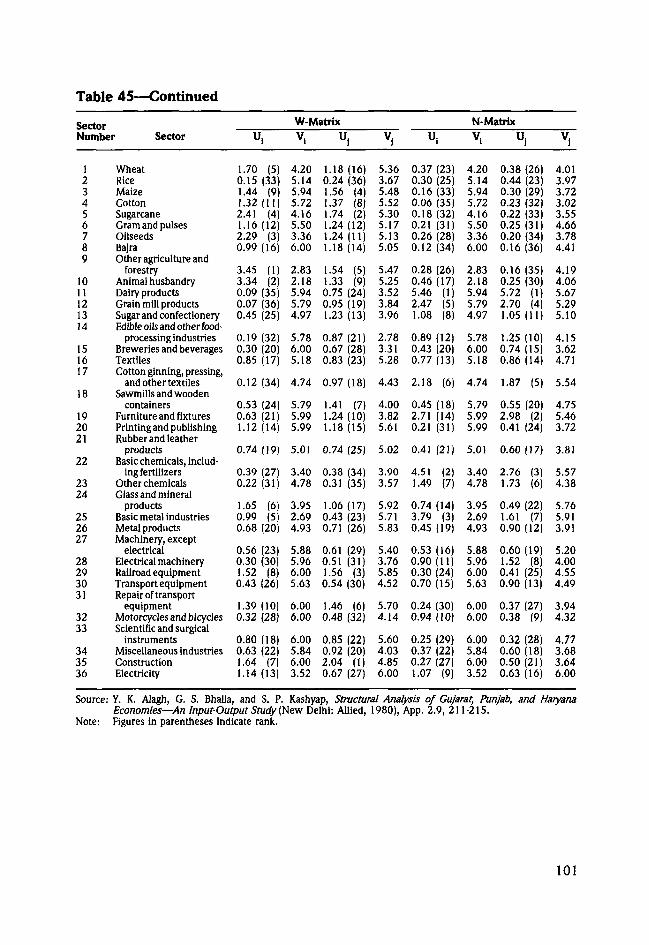
Table 45—Continued
SectorNumber Sector
123456789
1011121314
151617
18
192021
22
2324
252627
2829301 1O I
3233
343536
WheatRiceMaizeCottonSugarcaneGram and pulsesOilseedsBajraOther agriculture and
forestryAnimal husbandryDairy productsGrain mill productsSugar and confectioneryEdible oils and other food-
processing industriesBreweries and beveragesTextilesCotton ginning, pressing,
and other textilesSawmills and wooden
containersFurniture and fixturesPrinting and publishingRubber and leather
productsBasic chemicals, includ-
ing fertilizersOther chemicalsGlass and mineral
productsBasic metal industriesMetal productsMachinery, except
electricalElectrical machineryRailroad equipmentTransport equipmentRepair ui irdnapuri
equipmentMotorcycles and bicyclesScientific and surgical
instrumentsMiscellaneous industriesConstructionElectricity
U
1.700.151.441.322.411.162.290.99
3.453.340.090.070.45
0.190.300.85
0.12
0.530.631.12
0.74
0.390.22
1.650.990.68
0.560.301.520.43
1.390.32
0.800.631.641.14
(5)(33)
(9)(11)
(4)(12)
(3)(16)
(1)(2)
(35)(36)(25)
(32)(20)(17)
(34)
(24)(21)(14)
(19)
(27)(31)
(6)(5)
(20)
(23)(30)
(8)(26)
(10)(28)
(18)(22)(7)
(13)
W-MatrixV i
4.205.145.945.724.165.503.366.00
2.832.185.945.794.97
5.786.005.18
4.74
5.795.995.99
5.01
3.404.78
3.952.694.93
5.885.966.005.63
6.006.00
6.005.846.003.52
U
1.180.241.561.371.741.241.241.18
1.541.330.750.951.23
0.870.670.83
0.97
1.411.241.18
0.74
0.380.31
1.060.430.71
0.610.511.560.54
1.460.48
0.850.922.040.67
1
(16)(36)
(4)(8)(2)
(12)(11)(14)
(5)(9)
(24)(19)(13)
(21)(28)(23)
(18)
(7)(10)(15)
(25)
(34)(35)
(17)(23)(26)
(29)(31)
(3)(30)
(6)(32)
(22)(20)(1)
(27)
Vi
5.363.675.485.525.305.175.135.05
5.475.253.523.843.96
2.783.315.28
4.43
4.003.825.61
5.02
3.903.57
5.925.715.83
5.403.765.854.52
5.704.14
5.604.034.856.00
U
0.370.300.160.060.180.210.260.12
0.280.465.462.471.08
0.890.430.77
2.18
0.452.710.21
0.41
4.511.49
0.743.790.45
0.530.900.300.70
0.240.94
0.250.370.271.07
i
(23)(25)(33)(35)(32)(31)(28)(34)
(26)(17)
(1)(5)(8)
(12)(20)(13)
(6)
(18)(14)(31)
(21)
(2)(7)
(14)(3)
(19)
(16)(ID(24)(15)
(30)(10)
(29)(22)(27)
(9)
N-MatrlxV i
4.205.145.945.724.165.503.366.00
2.832.185.945.794.97
5.786.005.18
4.74
5.795.995.99
5.01
3.404.78
3.952.694.93
5.885.966.005.63
6.006.00
6.005.846.003.52
U i
0.38 (26)0.44 (23)0.30 (29)0.23 (32)0.22 (33)0.25 (31)0.20 (34)0.16 (36)
0.16 (35)0.25 (30)5.72 (1)2.70 (4)1.05 (11)
1.25 (10)0.74 (15)0.86 (14)
1.87 (5)
0.55 (20)2.98 (2)0.41 (24)
0.60(17)
2.76 (3)1.73 (6)
0.49 (22)1.61 (7)0.90 (12)
0.60 (19)1.52 (8)0.41 (25)0.90 (13)
0.37 (27)0.38 (9)
0.32 (28)0.60 (18)0.50(21)0.63 (16)
Vi
4.013.973.723.023.554.663.784.41
4.194.065.675.295.10
4.153.624.71
5.54
4.755.463.72
3.81
5.574.38
5.765.913.91
5.204.004.554.49
3.944.32
4.773.683.646.00
Source: Y. K. Alagh, G. S. Bhalla, and S. P. Kashyap, Structural Analysis of Gujarat, Punjab, and HaryanaEconomies—An Input-Output Study (New Delhi: Allied, 1980), App. 2.9, 211-215.
Note: Figures in parentheses indicate rank.
101
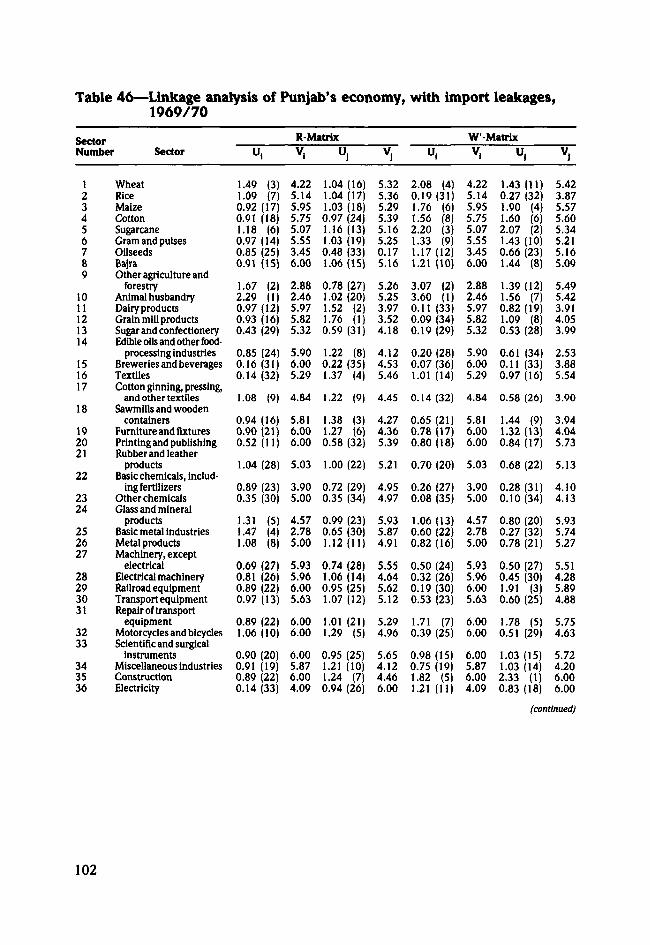
Table 46—Linkage analysis of Punjab's economy, with import leakages,1969/70
SectorNumber
123456789
1011121314
151617
18
192021
22
2324
252627
282930•J1•J 1
3233
343536
Sector
WheatRiceMaizeCottonSugarcaneGram and pulsesOilseedsBajraOther agriculture and
forestryAnimal husbandryDairy productsGrain mill productsSugar and confectioneryEdible oils and other food-
processing industriesBreweries and beveragesTextilesCotton ginning, pressing,
and other textilesSawmills and wooden
containersFurniture and fixturesPrinting and publishingRubber and leather
productsBasic chemicals, includ-
ing fertilizersOther chemicalsGlass and mineral
productsBasic metal industriesMetal productsMachinery, except
electricalElectrical machineryRailroad equipmentTransport equipment
Repair oi iransporiequipment
Motorcycles and bicyclesScientific and surgical
instrumentsMiscellaneous industriesConstructionElectricity
U
1.491.090.920.911.180.970.850.91
1.672.290.970.930.43
0.850.160.14
1.08
0.940.900.52
1.04
0.890.35
1.311.471.08
0.690.810.890.97
0.891.06
0.900.910.890.14
ri
(3)(7)
(17)(18)
(6)(14)(25)(15)
(2)(1)
(12)(16)(29)
(24)(31)(32)
(9)
(16)(21)(11)
(28)
(23)(30)
(5)(4)(8)
(27)(26)(22)(13)
(22)(10)
(20)(19)(22)(33)
R-Matrixv i
4.225.145.955.755.075.553.456.00
2.882.465.975.825.32
5.906.005.29
4.84
5.816.006.00
5.03
3.905.00
4.572.785.00
5.935.966.005.63
6.006.00
6.005.876.004.09
U i
1.04 (16)1.04 (17)1.03 (18)0.97 (24)1.16 (13)1.03 (19)0.48 (33)1.06(15)
0.78 (27)1.02 (20)1.52 (2)1.76 (1)0.59 (31)
1.22 (8)0.22 (35)1.37 (4)
1.22 (9)
1.38 (3)1.27 (6)0.58 (32)
1.00 (22)
0.72 (29)0.35 (34)
0.99 (23)0.65 (30)1.12 (11)
0.74 (28)1.06 (14)0.95 (25)1.07 (12)
1.01 (21)1.29 (5)
0.95 (25)1.21 (10)1.24 (7)0.94 (26)
Vi
5.325.365.295.395.165.250.175.16
5.265.253.973.524.18
4.124.535.46
4.45
4.274.365.39
5.21
4.954.97
5.935.874.91
5.554.645.625.12
5.294.96
5.654.124.466.00
U
2.080.191.761.562.201.331.171.21
3.073.600.110.090.19
0.200.071.01
0.14
0.650.780.80
0.70
0.260.08
1.060.600.82
0.500.320.190.53
1.710.39
0.980.751.821.21
i
(4)(31)
(6)(8)(3)(9)
(12)(10)
(2)(1)
(33)(34)(29)
(28)(36)(14)
(32)
(21)(17)(18)
(20)
(27)(35)
(13)(22)(16)
(24)(26)(30)(23)
(7)(25)
(15)(19)(5)
(ID
W-MatrixV i
4.225.145.955.755.075.553.456.00
2.882.465.975.825.32
5.906.005.29
4.84
5.816.006.00
5.03
3.905.00
4.572.785.00
5.935.966.005.63
6.006.00
6.005.876.004.09
Ui
1.43 (11)0.27 (32)1.90 (4)1.60 (6)2.07 (2)1.43 (10)0.66 (23)1.44 (8)
1.39 (12)1.56 (7)0.82 (19)1.09 (8)0.53 (28)
0.61 (34)0.11 (33)0.97 (16)
0.58 (26)
1.44 (9)1.32 (13)0.84 (17)
0.68 (22)
0.28 (31)0.10 (34)
0.80 (20)0.27 (32)0.78 (21)
0.50 (27)0.45 (30)1.91 (3)0.60 (25)
1.78 (5)0.51 (29)
1.03 (15)1.03 (14)2.33 (1)0.83 (18)
Vi
5.423.875.575.605.345.215.165.09
5.495.423.914.053.99
2.533.885.54
3.90
3.944.045.73
5.13
4.104.13
5.935.745.27
5.514.285.894.88
5.754.63
5.724.206.006.00
(continued)
102
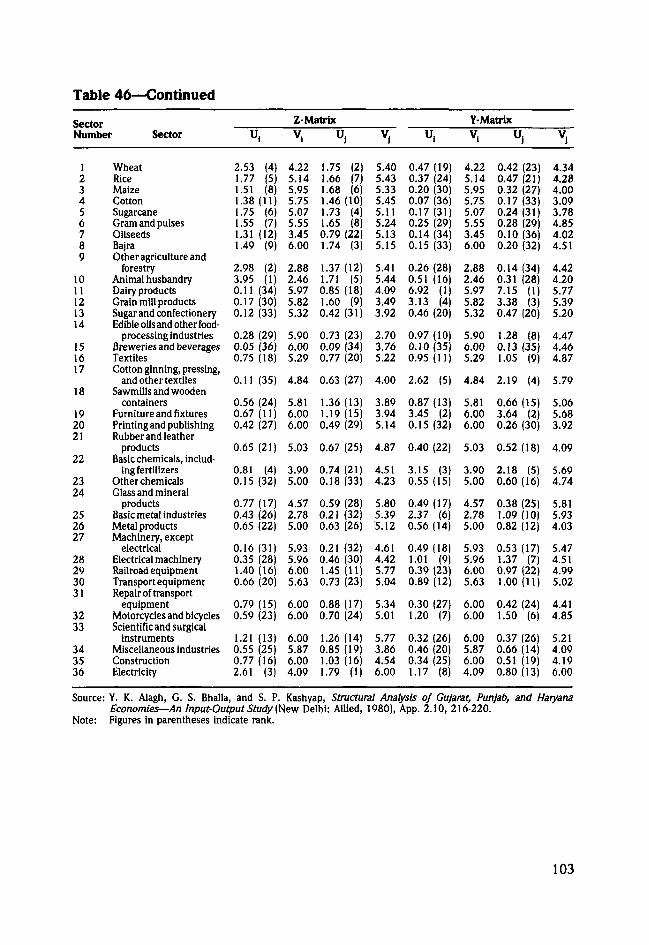
Table 46—Continued
SectorNumber Sector
123456789
1011121314
151617
18
192021
22
2324
252627
28293031
3233
343536
WheatRiceMaizeCottonSugarcaneGram and pulsesOilseedsBajraOther agriculture and
forestryAnimal husbandryDairy productsGrain mill productsSugar and confectioneryEdible oils and other food-
processing industriesBreweries and beveragesTextilesCotton ginning, pressing,
and other textilesSawmills and wooden
containersFurniture and fixturesPrinting and publishingRubber and leather
productsBasic chemicals, includ-
ing fertilizersOther chemicalsGlass and mineral
productsBasic metal industriesMetal productsMachinery, except
electricalElectrical machineryRailroad equipmentTransport equipmentRepair of transport
equipmentMotorcycles and bicyclesScientific and surgical
instrumentsMiscellaneous industriesConstructionElectricity
U
2.531.771.511.381.751.551.311.49
2.983.950.110.170.12
0.280.050.75
0.11
0.560.670.42
0.65
0.810.15
0.770.430.65
0.160.351.400.66
0.790.59
1.210.550.772.61
i
(4)(5)(8)
(11)(6)(7)
(12)(9)
(2)(1)
(34)(30)(33)
(29)(36)(18)
(35)
(24)(11)(27)
(21)
(4)(32)
(17)(26)(22)
(31)(28)(16)(20)
(15)(23)
(13)(25)(16)
(3)
Z-Matrix
v,
4.225.145.955.755.075.553.456.00
2.882.465.975.825.32
5.906.005.29
4.84
5.816.006.00
5.03
3.905.00
4.572.785.00
5.935.966.005.63
6.006.00
6.005.876.004.09
U i
1.75 (2)1.66 (7)1.68 (6)1.46 (10)1.73 (4)1.65 (8)0.79 (22)1.74 (3)
1.37 (12)1.71 (5)0.85 (18)1.60 (9)0.42 (31)
0.73 (23)0.09 (34)0.77 (20)
0.63 (27)
1.36 (13)1.19 (15)0.49 (29)
0.67 (25)
0.74 (21)0.18 (33)
0.59 (28)0.21 (32)0.63 (26)
0.21 (32)0.46 (30)1.45 (11)0.73 (23)
0.88 (17)0.70 (24)
1.26 (14)0.85 (19)1.03 (16)1.79 (1)
Vi
5.405.435.335.455.115.245.135.15
5.415.444.093.493.92
2.703.765.22
4.00
3.893.945.14
4.87
4.514.23
5.805.395.12
4.614.425.775.04
5.345.01
5.773.864.546.00
U
0.470.370.200.070.170.250.140.15
0.260.516.923.130.46
0.970.100.95
2.62
0.873.450.15
0.40
3.150.55
0.492.370.56
0.491.010.390.89
0.301.20
0.320.460.341.17
[i
(19)(24)(30)(36)(31)(29)(34)(33)
(28)(16)
(1)(4)
(20)
(10)(35)(11)
(5)
(13)(2)
(32)
(22)
(3)(15)
(17)(6)
(14)
(18)(9)
(23)(12)
(27)(7)
(26)(20)(25)
(8)
Y-Matrixv i
4.225.145.955.755.075.553.456.00
2.882.465.975.825.32
5.906.005.29
4.84
5.816.006.00
5.03
3.905.00
4.572.785.00
5.935.966.005.63
6.006.00
6.005.876.004.09
U i
0.42 (23)0.47 (21)0.32 (27)0.17 (33)0.24 (31)0.28 (29)0.10 (36)0.20 (32)
0.14 (34)0.31 (28)7.15 (1)3.38 (3)0.47 (20)
1.28 (8)0.13 (35)1.05 (9)
2.19 (4)
0.66 (15)3.64 (2)0.26 (30)
0.52 (18)
2.18 (5)0.60 (16)
0.38 (25)1.09(10)0.82 (12)
0.53 (17)1.37 (7)0.97 (22)1.00 (11)
0.42 (24)1.50 (6)
0.37 (26)0.66 (14)0.51 (19)0.80 (13)
Vi
4.344.284.003.093.784.854.024.51
4.424.205.775.395.20
4.474.464.87
5.79
5.065.683.92
4.09
5.694.74
5.815.934.03
5.474.514.995.02
4.414.85
5.214.094.196.00
Source: Y. K. Alagh, G. S. Bhalla, and S. P. Kashyap, Structural Analysis of Gujarat, Punjab, and HaryanaEconomies—An Input-Output Study (New Delhi: Allied, 1980), App. 2.10, 216-220.
Note: Figures in parentheses indicate rank.
103
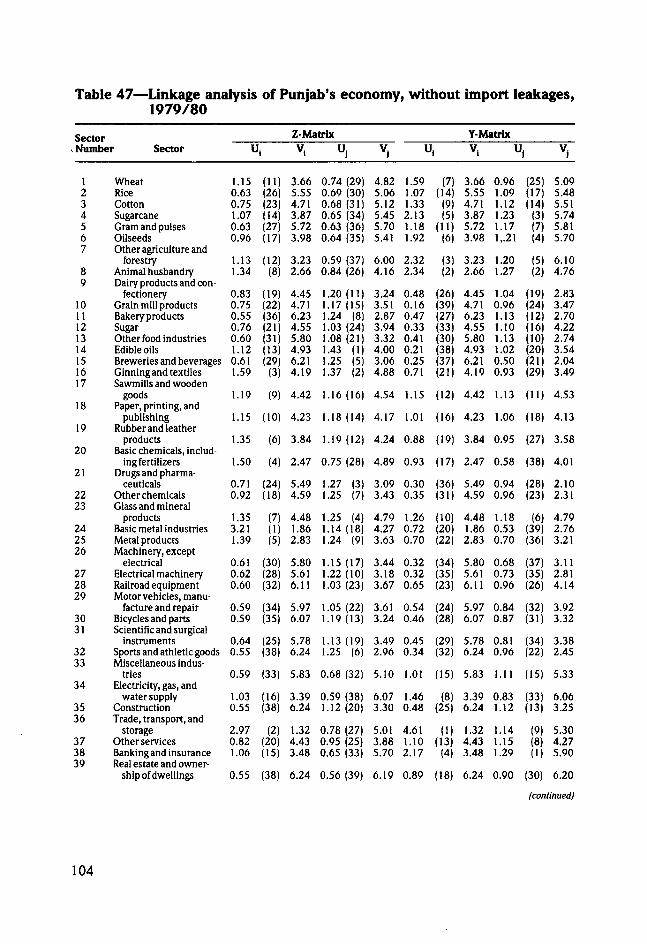
Table 47—Linkage analysis of Punjab's economy, without import leakages,1979/80
SectorNumber Sector
1234567
89
1011121314151617
18
19
20
21
2223
242526
272829
3031
3233
34
3536
373839
WheatRiceCottonSugarcaneGram and pulsesOilseedsOther agriculture and
forestryAnimal husbandryDairy products and con-
fectioneryGrain mill productsBakery productsSugarOther food industriesEdible oilsBreweries and beveragesGinning and textilesSawmills and wooden
goodsPaper, printing, and
publishingRubber and leather
productsBasic chemicals, includ-
ing fertilizersDrugs and pharma-
ceuticalsOther chemicalsGlass and mineral
productsBasic metal industriesMetal productsMachinery, except
electricalElectrical machineryRailroad equipmentMotor vehicles, manu-
facture and repairBicycles and partsScientific and surgical
instrumentsSports and athletic goodsMiscellaneous indus-
triesElectricity, gas, and
water supplyConstructionTrade, transport, and
storageOther servicesBanking and insuranceReal estate and owner-
ship of dwellings
U
1.150.630.751.070.630.96
1.131.34
0.830.750.550.760.601.120.611.59
1.19
1.15
1.35
1.50
0.710.92
1.353.211.39
0.610.620.60
0.590.59
0.640.55
0.59
1.030.55
2.970.821.06
0.55
i
(11)(26)(23)(14)(27)(17)
(12)(8)
(19)(22)(36)(21)(31)(13)(29)
(3)
(9)
(10)
(6)
(4)
(24)(18)
(7)(1)(5)
(30)(28)(32)
(34)(35)
(25)(38)
(33)
(16)(38)
(2)(20)(15)
(38)
Z-Matrix
3.66 (5.55 (4.71 (3.87 (5.72 (3.98 (
3.23 (2.66 (
4.454.716.234.555.804.936.214.19
4.42
4.23
3.84
2.47 (
5.494.59
4.481.862.83
5.805.616.11
5.976.07
5.786.24
U i
D.74 (29)).69 (30)).68 (31)).65 (34)).63 (36)).64 (35)
).59 (37)).84 (26)
.20 (11)
.17(15)•24 (8)
1.03 (24)1.08 (21)•43 (1).25 (5).37 (2)
.16 (16)
.18 (14)
.19 (12)
).75 (28)
.27 (3)
.25 (7)
.25 (4)
.14(18)
.24 (9)
.15(17)
.22 (10)
.03 (23)
.05 (22)
.19 (13)
.13 (19)
.25 (6)
5.83 0.68 (32)
3.39 C6.24 1
1.32 (4.43 C3.48 C
6.24 C
).59 (38).12 (20)
).78 (27)).95 (25)).65 (33)
1.56 (39)
Vi
4.825.065.125.455.705.41
6.004.16
3.243.512.873.943.324.003.064.88
4.54
4.17
4.24
4.89
3.093.43
4.794.273.63
3.443.183.67
3.613.24
3.492.96
5.10
6.073.30
5.013.885.70
6.19
I
1.591.071.332.131.181.92
2.322.34
0.480.160.470.330.410.210.250.71
1.15
1.01
0.88
0.93
0.300.35
1.260.720.70
0.320.320.65
0.540.46
0.450.34
1.01
1.460.48
4.611.102.17
0.89
'l
(7)(14)
(5)(11)
(6)
(3)(2)
(26)(39)(27)(33)(30)(38)(37)(21)
(12)
(16)
(19)
(17)
(36)(31)
(10)(20)(22)
(34)(35)(23)
(24)(28)
(29)(32)
(15)
(8)(25)
(1)(13)
(4)
(18)
Y-Matrix
v i
3.665.554.713.875.723.98
3.232.66
4.454.716.234.555.804.936.214.19
4.42
4.23
3.84
2.47
5.494.59
4.481.862.83
5.805.616.11
5.976.07
5.786.24
5.83
3.396.24
1.324.433.48
6.24
U i
0.961.091.121.231.171,-21
1.201.27
1.040.961.131.101.131.020.500.93
1.13
1.06
0.95
0.58
0.940.96
1.180.530.70
0.680.730.96
0.840.87
0.810.96
1.11
0.831.12
1.141.151.29
0.90
(25)(17)(14)(3)(7)(4)
(5)(2)
(19)(24)(12)(16)(10)(20)(21)(29)
(11)
(18)
(27)
(38)
(28)(23)
(6)(39)(36)
(37)(35)(26)
(32)(31)
(34)(22)
(15)
(33)(13)
(9)(8)(1)
(30)
Vi
5.095.485.515.745.815.70
6.104.76
2.833.472.704.222.743.542.043.49
4.53
4.13
3.58
4.01
2.102.31
4.792.763.21
3.112.814.14
3.923.32
3.382.45
5.33
6.063.25
5.304.275.90
6.20
(continued)
104

Table 47—Continued
SectorNumber Sector
1234567
89
1011121314151617
18
19
20
21
2223
242526
272829
3031
3233
34
3536
373839
WheatRiceCottonSugarcaneGram and pulsesOilseedsOther agriculture and
forestryAnimal husbandryDairy products and con-
fectioneryGrain mill productsBakery productsSugarOther food industriesEdible oilsBreweries and beveragesGinning and textilesSawmills and wooden
goodsPaper, printing, and
publishingRubber and leather
productsBasic chemicals, includ-
ing fertilizersDrugs and pharma-
ceuticalsOther chemicalsGlass and mineral
productsBasic metal industriesMetal productsMachinery, except
electricalElectrical machineryRailroad equipmentMotor vehicles, manu-
facture and repairBicycles and partsScientific and surgical
instrumentsSports and athletic goodsMiscellaneous indus-
triesElectricity, gas, and
water supplyConstructionTrade, transport, and
storageOther servicesBanking and insuranceReal estate and owner-
ship of dwellings
u i
0.93 (14)0.80 (20)0.91 (15)1.14 (9)0.75 (21)0.71 (24)
1.39 (7)1.66 (6)
0.19 (38)0.20 (36)0.75 (22)0.35 (33)0.43 (28)0.20 (37)0.11 (39)0.93 (13)
1.84 (5)
1.88 (4)
1.22 (8)
0.45 (27)
0.37 (32)0.39. (30)
0.85 (17)0.73 (23)1.05 (10)
0.37 (31)0.21 (35)0.87 (16)
0.83 (18)0.34 (34)
0.58 (25)0.48 (26)
1.02 (12)
1.05 (11)0.80 (19)
6.99 (1)2.18 (3)2.66 (2)
0.42 (29)
W-V i
3.665.554.713.875.723.98
3.232.66
4.454.716.234.555.804.936.214.19
4.42
4.23
3.84
2.47
5.494.59
4.481.862.83
5.805.616.11
5.976.07
5.786.24
5.83
3.396.24
1.324.433.48
6.24
MatrixU
0.610.830.790.690.760.50
0.720.94
0.790.781.310.801.000.730.871.04
1.67
1.76
1.19
0.41
1.000.79
0.990.620.95
0.830.741.27
1.190.88
1.051.27
1.12
0.621.63
1.722.021.61
0.43
'i
(36)(24)(26)(33)(29)(37)
(32)(19)
(27)(28)
(7)(25)(15)(31)(22)(14)
(4)
(2)
(ID
(39)
(16)(20)
(17)(34)(18)
(23)(30)
(9)
(10)(21)
(13)(8)
(12)
(35)(5)
(3)(1)(6)
(38)
Vi
4.655.355.345.505.665.17
6.044.56
2.432.843.593.562.802.721.973.88
4.90
4.57
3.90
3.02
2.382.42
4.103.023.53
3.152.674.24
4.222.81
3.412.65
5.32
5.893.60
5.344.835.81
6.10
U
1.521.591.792.171.531.23
2.753.27
0.150.230.940.420.470.200.130.92
2.12
2.06
1.37
0.16
0.440.45
0.910.651.24
0.340.220.51
0.910.39
0.590.55
0.12
0.630.19
2.761.820.89
0.40
i
(11)(9)(8)(4)
(10)(14)
(3)(1)
(37)(32)(15)(28)(25)(34)(38)(16)
(5)
(6)
(12)
(36)
(27)(26)
(17)(20)(13)
(31)(33)(24)
(18)(30)
(22)(23)
(39)
(21)(35)
(2)(7)
(19)
(29)
N-Matrixv i
3.665.554.713.875.723.98
3.232.66
4.454.716.234.555.804.936.214.19
4.42
4.23
3.84
2.47
5.494.59
4.481.862.83
5.805.616.11
5.976.07
5.786.24
5.83
3.396.24
1.324.433.48
6.24
UJ
0.861.491.431.241.500.82
1.411.68
0.940.921.581.151.240.790.771.11
1.79
1.77
1.24
0.20
1.001.00
0.870.480.86
0.650.580.81
1.130.79
0.901.27
0.30
0.360.71
0.791.640.57
0.41
(24)(7)(8)
(11)(6)
(25)
(9)(3)
(19)(20)
(5)(14)(13)(29)(30)(16)
(1)
(2)
(12)
(39)
(17)(18)
(22)(35)(23)
(32)(33)(26)
(15)(27)
(21)(10)
(38)
(37)(31)
(28)(4)
(34)
(36)
Vi
5.435.935.815.805.845.46
6.135.04
3.173.513.734.222.953.081.643.74
5.23
4.97
4.16
2.29
2.602.70
4.682.634.09
3.212.423.88
4.773.12
3.812.92
2.98
5.932.55
4.634.925.46
6.13
Source: Based on author's calculations from Punjab input-output table for 1979/80 (Table 44, Appendix 1).Note: Figures in parentheses indicate rank.
105
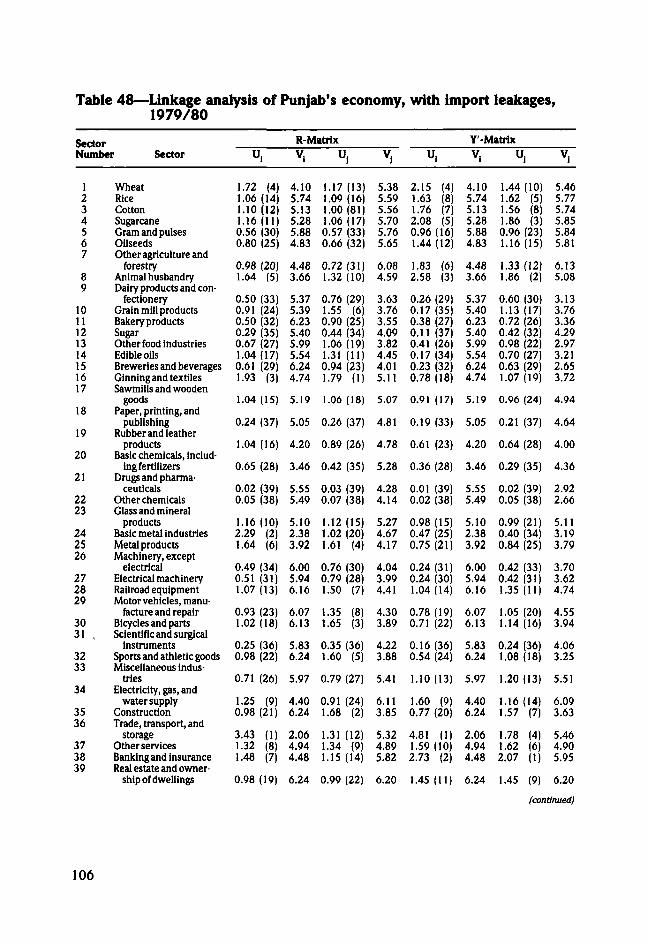
Table 48—Linkage analysis of Punjab's economy, with import leakages,1979/80
SectorNumber Sector
1234567
89
1011121314151617
18
19
20
21
2223
242526
272829
3031 ,
3233
34
3536
373839
WheatRiceCottonSugarcaneGram and pulsesOilseedsOther agriculture and
forestryAnimal husbandryDairy products and con-
fectioneryGrain mill productsBakery productsSugarOther food industriesEdible oilsBreweries and beveragesGinning and textilesSawmills and wooden
goodsPaper, printing, and
publishingRubber and leather
productsBasic chemicals, includ-
ing fertilizersDrugs and pharma-
ceuticalsOther chemicalsGlass and mineral
productsBasic metal industriesMetal productsMachinery, except
electricalElectrical machineryRailroad equipmentMotor vehicles, manu-
facture and repairBicycles and partsScientific and surgical
instrumentsSports and athletic goodsMiscellaneous indus-
triesElectricity, gas, and
water supplyConstructionTrade, transport, and
storageOther servicesBanking and insuranceReal estate and owner-
ship of dwellings
U,
1.72 (4)1.06 (14)1.10 (12)1.16(11)0.56 (30)0.80 (25)
0.98 (20)1.64 (5)
0.50 (33)0.91 (24)0.50 (32)0.29 (35)0.67 (27)1.04(17)0.61 (29)1.93 (3)
1.04 (15)
0.24 (37)
1.04 (16)
0.65 (28)
0.02 (39)0.05 (38)
1.16 (10)2.29 (2)1.64 (6)
0.49 (34)0.51 (31)1.07 (13)
0.93 (23)1.02 (18)
0.25 (36)0.98 (22)
0.71 (26)
1.25 (9)0.98 (21)
3.43 (1)1.32 (8)1.48 (7)
0.98 (19)
R-Matrix
v,
4.105.745.135.285.884.83
4.483.66
5.375.396.235.405.995.546.244.74
5.19
5.05
4.20
3.46
5.555.49
5.102.383.92
6.005.946.16
6.076.13
5.836.24
5.97
4.406.24
2.064.944.48
6.24
Ui
1.17(13)1.09 (16)1.00(81)1.06 (17)0.57 (33)0.66 (32)
0.72 (31)1.32 (10)
0.76 (29)1.55 (6)0.90 (25)0.44 (34)1.06 (19)1.31 (11)0.94 (23)1.79 (1)
1.06 (18)
0.26 (37)
0.89 (26)
0.42 (35)
0.03 (39)0.07 (38)
1.12 (15)1.02 (20)1.61 (4)
0.76 (30)0.79 (28)1.50 (7)
1.35 (8)1.65 (3)
0.35 (36)1.60 (5)
0.79 (27)
0.91 (24)1.68 (2)
1.31 (12)1.34 (9)1.15 (14)
0.99 (22)
Vi
5.385.595.565.705.765.65
6.084.59
3.633.763.554.093.824.454.015.11
5.07
4.81
4.78
5.28
4.284.14
5.274.674.17
4.043.994.41
4.303.89
4.223.88
5.41
6.113.85
5.324.895.82
6.20
I
2.151.631.762.080.961.44
1.832.58
0.260.170.380.110.410.170.230.78
0.91
0.19
0.61
0.36
0.010.02
0.980.470.75
0.240.241.04
0.780.71
0.160.54
1.10
1.600.77
4.811.592.73
1.45
'i
(4)(8)(7)(5)
(16)(12)
(6)(3)
(29)(35)(27)(37)(26)(34)(32)(18)
(17)
(33)
(23)
(28)
(39)(38)
(15)(25)(21)
(31)(30)(14)
(19)(22)
(36)(24)
(13)
(°)(20)
(1)(10)(2)
(11)
Y'-MatrixV .
4.105.745.135.285.884.83
4.483.66
5.375.406.235.405.995.546.244.74
5.19
5.05
4.20
3.46
5.555.49
5.102.383.92
6.005.946.16
6.076.13
5.836.24
5.97
4.406.24
2.064.944.48
6.24
UJ
1.44(10)1.62 (5)1.56 (8)1.86 (3)0.96 (23)1.16 (15)
1.33 (12)1.86 (2)
0.60 (30)1.13(17)0.72 (26)0.42 (32)0.98 (22)0.70 (27)0.63 (29)1.07 (19)
0.96 (24)
0.21 (37)
0.64 (28)
0.29 (35)
0.02 (39)0.05 (38)
0.99 (21)0.40 (34)0.84 (25)
0.42 (33)0.42 (31)1.35(11)
1.05 (20)1.14 (16)
0.24 (36)1.08 (18)
1.20 (13)
1.16 (14)1.57 (7)
1.78 (4)1.62 (6)2.07 (1)
1.45 (9)
Vi
5.465.775.745.855.845.81
6.135.08
3.133.763.364.292.973.212.653.72
4.94
4.64
4.00
4.36
2.922.66
5.113.193.79
3.703.624.74
4.553.94
4.063.25
5.51
6.093.63
5.464.905.95
6.20
(continued)
106
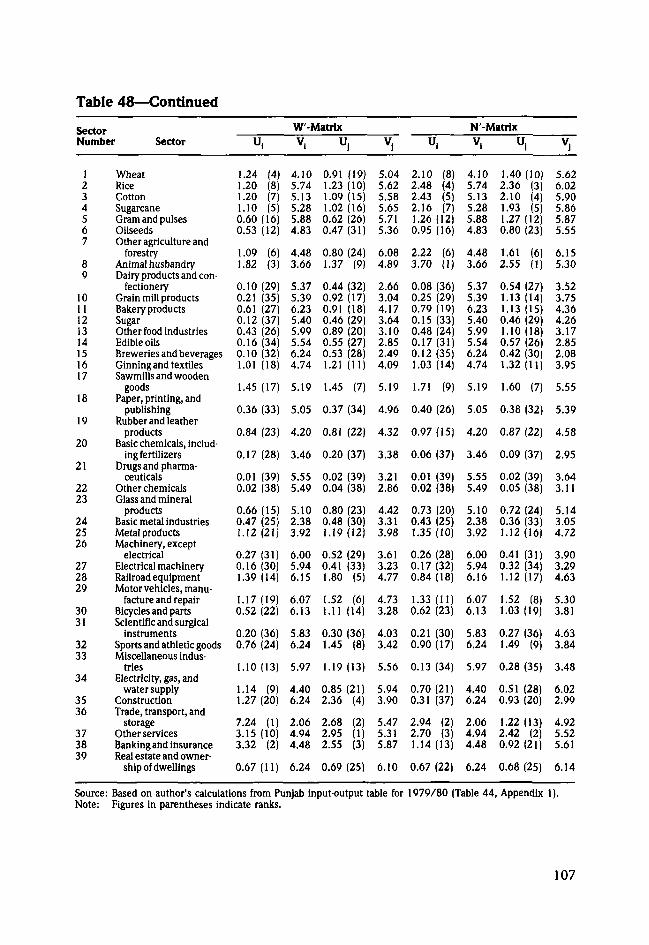
Table 48—Continued
SectorNumber Sector
1234567
89
1011121314151617
18
19
20
21
2223
242526
272829
3031
3233
34
3536
373839
WheatRiceCottonSugarcaneGram and pulsesOilseedsOther agriculture and
forestryAnimal husbandryDairy products and con-
fectioneryGrain mill productsBakery productsSugarOther food industriesEdible oilsBreweries and beveragesGinning and textilesSawmills and wooden
goodsPaper, printing, and
publishingRubber and leather
productsBasic chemicals, includ-
ing fertilizersDrugs and pharma-
ceuticalsOther chemicalsGlass and mineral
productsBasic metal industriesMetal productsMachinery, except
electricalElectrical machineryRailroad equipmentMotor vehicles, manu-
facture and repairBicycles and partsScientific and surgical
instrumentsSports and athletic goodsMiscellaneous indus-
triesElectricity, gas, and
water supplyConstructionTrade, transport, and
storageOther servicesBanking and insuranceReal estate and owner-
ship of dwellings
I
1.241.201.201.100.600.53
1.091.82
0.100.210.610.120.430.160.101.01
1.45
0.36
0.84
0.17
0.010.02
0.660.471.12
0.270.161.39
1.170.52
0.200.76
1.10
1.141.27
7.243.153.32
0.67
(4)(8)(7)(5)
(16)(12)
(6)(3)
(29)(35)(27)(37)(26)(34)(32)(18)
(17)
(33)
(23)
(28)
(39)(38)
(15)(25)(21)
(31)(30)(14)
(19)(22)
(36)(24)
(13)
(9)(20)
(1)(10)
(2)
(11)
W MatrixV,
4.105.745.135.285.884.83
4.483.66
5.375.396.235.405.995.546.244.74
5.19
5.05
4.20
3.46
5.555.49
5.102.383.92
6.005.946.15
6.076.13
5.836.24
5.97
4.406.24
2.064.944.48
6.24
U i
0.91 (19)1.23 (10)1.09 (15)1.02 (16)0.62 (26)0.47 (31)
0.80 (24)1.37 (9)
0.44 (32)0.92 (17)0.91 (18)0.46 (29)0.89 (20)0.55 (27)0.53 (28)1.21 (11)
1.45 (7)
0.37 (34)
0.81 (22)
0.20 (37)
0.02 (39)0.04 (38)
0.80 (23)0.48 (30)1.19 (12)
0.52 (29)0.41 (33)1.80 (5)
1.52 (6)1.11 (14)
0.30 (36)1.45 (8)
1.19 (13)
0.85 (21)2.36 (4)
2.68 (2)2.95 (1)2.55 (3)
0.69 (25)
Vi
5.045.625.585.655.715.36
6.084.89
2.663.044.173.643.102.852.494.09
5.19
4.96
4.32
3.38
3.212.86
4.423.313.98
3.613.234.77
4.733.28
4.033.42
5.56
5.943.90
5.475.315.87
6.10
I
2.102.482.432.161.260.95
2.223.70
0.080.250.790.150.480.170.121.03
1.71
0.40
0.97
0.06
0.010.02
0.730.431.35
0.260.170.84
1.330.62
0.210.90
0.13
0.700.31
2.942.701.14
0.67
Fi
(8)(4)(5)(7)
(12)(16)
(6)(1)
(36)(29)(19)(33)(24)(31)(35)(14)
(9)
(26)
(15)
(37)
(39)(38)
(20)(25)(10)
(28)(32)(18)
(11)(23)
(30)(17)
(34)
(21)(37)
(2)(3)
(13)
(22)
N-Matrixv i
4.105.745.135.285.884.83
4.483.66
5.375.396.235.405.995.546.244.74
5.19
5.05
4.20
3.46
5.555.49
5.102.383.92
6.005.946.16
6.076.13
5.836.24
5.97
4.406.24
2.064.944.48
6.24
U l
1.40(10)2.36 (3)2.10 (4)1.93 (5)1.27 (12)0.80 (23)
1.61 (6)2.55 (1)
0.54 (27)1.13 (14)1.13(15)0.46 (29)1.10 (18)0.57 (26)0.42 (30)1.32(11)
1.60 (7)
0.38 (32)
0.87 (22)
0.09 (37)
0.02 (39)0.05 (38)
0.72 (24)0.36 (33)1.12(16)
0.41 (31)0.32 (34)1.12 (17)
1.52 (8)1.03 (19)
0.27 (36)1.49 (9)
0.28 (35)
0.51 (28)0.93 (20)
1.22 (13)2.42 (2)0.92 (21)
0.68 (25)
Vi
5.626.025.905.865.875.55
6.155.30
3.523.754.364.263.172.852.083.95
5.55
5.39
4.58
2.95
3.643.11
5.143.054.72
3.903.294.63
5.303.81
4.633.84
3.48
6.022.99
4.925.525.61
6.14
Source: Based on author's calculations from Punjab input-output table for 1979/80 (Table 44, Appendix 1).Note: Figures in parentheses indicate ranks.
107
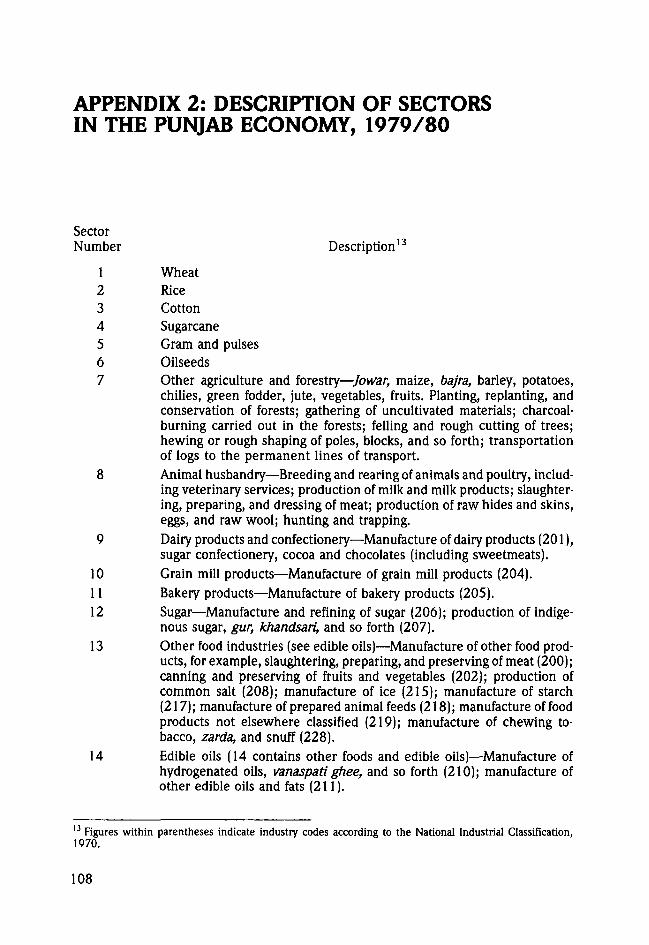
APPENDIX 2: DESCRIPTION OF SECTORSIN THE PUNJAB ECONOMY, 1979/80
SectorNumber Description13
1 Wheat2 Rice3 Cotton4 Sugarcane5 Gram and pulses6 Oilseeds7 Other agriculture and forestry—Jowar, maize, bajra, barley, potatoes,
chilies, green fodder, jute, vegetables, fruits. Planting, replanting, andconservation of forests; gathering of uncultivated materials; charcoal-burning carried out in the forests; felling and rough cutting of trees;hewing or rough shaping of poles, blocks, and so forth; transportationof logs to the permanent lines of transport.
8 Animal husbandry—Breeding and rearing of animals and poultry, includ-ing veterinary services; production of milk and milk products; slaughter-ing, preparing, and dressing of meat; production of raw hides and skins,eggs, and raw wool; hunting and trapping.
9 Dairy products and confectionery—Manufacture of dairy products (201),sugar confectionery, cocoa and chocolates (including sweetmeats).
10 Grain mill products—Manufacture of grain mill products (204).11 Bakery products—Manufacture of bakery products (205).12 Sugar—Manufacture and refining of sugar (206); production of indige-
nous sugar, gur, khandsari, and so forth (207).13 Other food industries (see edible oils)—Manufacture of other food prod-
ucts, for example, slaughtering, preparing, and preserving of meat (200);canning and preserving of fruits and vegetables (202); production ofcommon salt (208); manufacture of ice (215); manufacture of starch(217); manufacture of prepared animal feeds (218); manufacture of foodproducts not elsewhere classified (219); manufacture of chewing to-bacco, zarda, and snuff (228).
14 Edible oils (14 contains other foods and edible oils)—Manufacture ofhydrogenated oils, vanaspati ghee, and so forth (210); manufacture ofother edible oils and fats (211).
13 Figures within parentheses indicate industry codes according to the National Industrial Classification,1970.
108
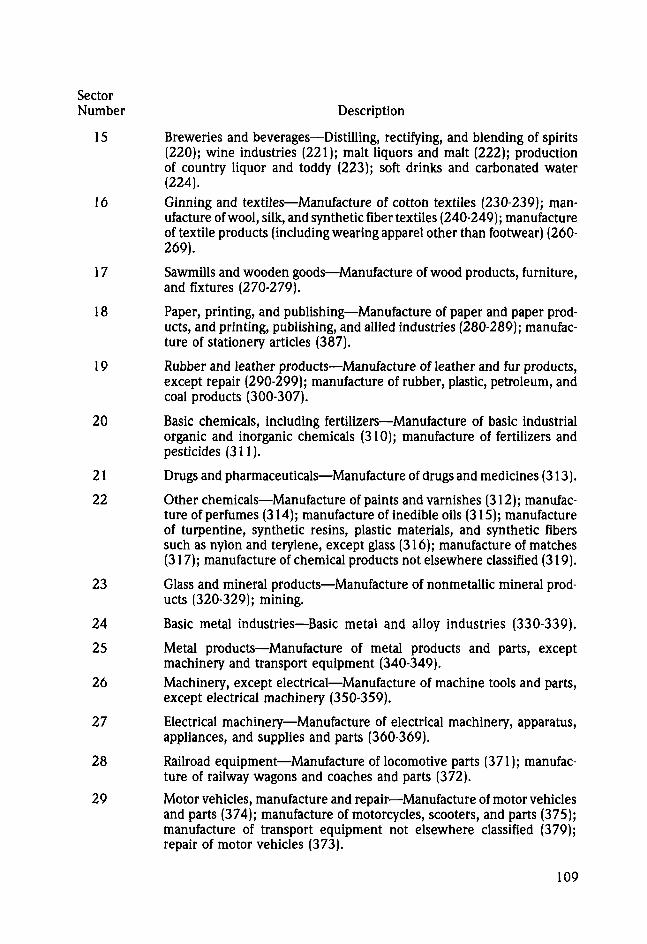
SectorNumber Description
15 Breweries and beverages—Distilling, rectifying, and blending of spirits(220); wine industries (221); malt liquors and malt (222); productionof country liquor and toddy (223); soft drinks and carbonated water(224).
16 Ginning and textiles—Manufacture of cotton textiles (230-239); man-ufacture of wool, silk, and synthetic fiber textiles (240-249); manufactureof textile products (including wearing apparel other than footwear) (260-269).
17 Sawmills and wooden goods—Manufacture of wood products, furniture,and fixtures (270-279).
18 Paper, printing, and publishing—Manufacture of paper and paper prod-ucts, and printing, publishing, and allied industries (280-289); manufac-ture of stationery articles (387).
19 Rubber and leather products—Manufacture of leather and fur products,except repair (290-299); manufacture of rubber, plastic, petroleum, andcoal products (300-307).
20 Basic chemicals, including fertilizers—Manufacture of basic industrialorganic and inorganic chemicals (310); manufacture of fertilizers andpesticides (311).
21 Drugs and Pharmaceuticals—Manufacture of drugs and medicines (313).
22 Other chemicals—Manufacture of paints and varnishes (312); manufac-ture of perfumes (314); manufacture of inedible oils (315); manufactureof turpentine, synthetic resins, plastic materials, and synthetic fiberssuch as nylon and terylene, except glass (316); manufacture of matches(317); manufacture of chemical products not elsewhere classified (319).
23 Glass and mineral products—Manufacture of nonmetallic mineral prod-ucts (320-329); mining.
24 Basic metal industries—Basic metal and alloy industries (330-339).
25 Metal products—Manufacture of metal products and parts, exceptmachinery and transport equipment (340-349).
26 Machinery, except electrical—Manufacture of machine tools and parts,except electrical machinery (350-359).
27 Electrical machinery—Manufacture of electrical machinery, apparatus,appliances, and supplies and parts (360-369).
28 Railroad equipment—Manufacture of locomotive parts (371); manufac-ture of railway wagons and coaches and parts (372).
29 Motor vehicles, manufacture and repair—Manufacture of motor vehiclesand parts (374); manufacture of motorcycles, scooters, and parts (375);manufacture of transport equipment not elsewhere classified (379);repair of motor vehicles (373).
109
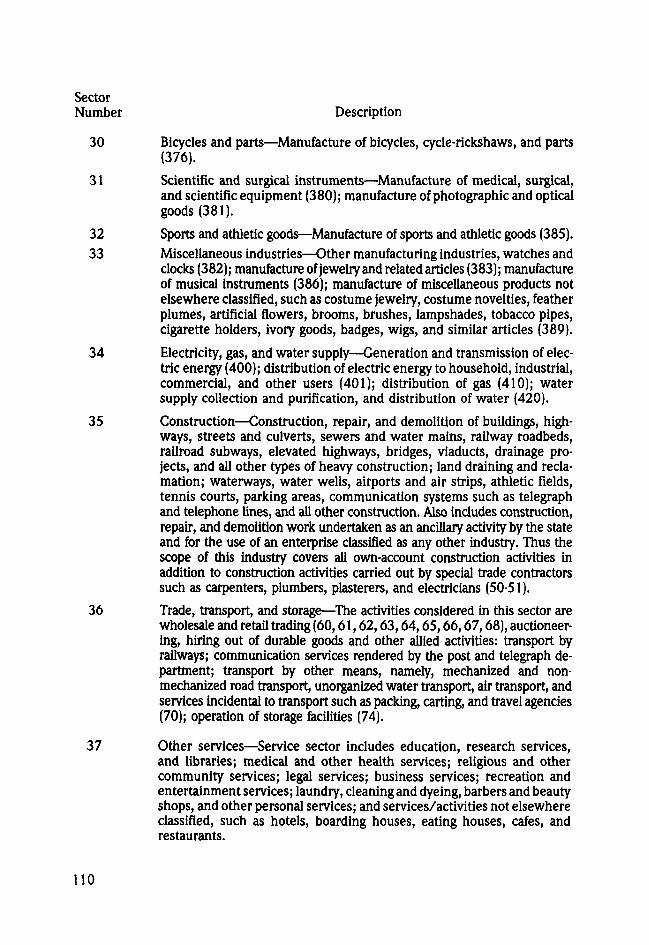
SectorNumber Description
30 Bicycles and parts—Manufacture of bicycles, cycle-rickshaws, and parts(376).
31 Scientific and surgical instruments—Manufacture of medical, surgical,and scientific equipment (380); manufacture of photographic and opticalgoods (381).
32 Sports and athletic goods—Manufacture of sports and athletic goods (385).33 Miscellaneous industries—Other manufacturing industries, watches and
clocks (382); manufacture of jewelry and related articles (383); manufactureof musical instruments (386); manufacture of miscellaneous products notelsewhere classified, such as costume jewelry, costume novelties, featherplumes, artificial flowers, brooms, brushes, lampshades, tobacco pipes,cigarette holders, ivory goods, badges, wigs, and similar articles (389).
34 Electricity, gas, and water supply—Generation and transmission of elec-tric energy (400); distribution of electric energy to household, industrial,commercial, and other users (401); distribution of gas (410); watersupply collection and purification, and distribution of water (420).
35 Construction—Construction, repair, and demolition of buildings, high-ways, streets and culverts, sewers and water mains, railway roadbeds,railroad subways, elevated highways, bridges, viaducts, drainage pro-jects, and all other types of heavy construction; land draining and recla-mation; waterways, water wells, airports and air strips, athletic fields,tennis courts, parking areas, communication systems such as telegraphand telephone lines, and all other construction. Also includes construction,repair, and demolition work undertaken as an ancillary activity by the stateand for the use of an enterprise classified as any other industry. Thus thescope of this industry covers all own-account construction activities inaddition to construction activities carried out by special trade contractorssuch as carpenters, plumbers, plasterers, and electricians (50-51).
36 Trade, transport, and storage—The activities considered in this sector arewholesale and retail trading (60,61,62,63,64,65,66,67,68), auctioneer-ing, hiring out of durable goods and other allied activities: transport byrailways; communication services rendered by the post and telegraph de-partment; transport by other means, namely, mechanized and non-mechanized road transport, unorganized water transport, air transport, andservices incidental to transport such as packing, carting, and travel agencies(70); operation of storage facilities (74).
37 Other services—Service sector includes education, research services,and libraries; medical and other health services; religious and othercommunity services; legal services; business services; recreation andentertainment services; laundry, cleaning and dyeing, barbers and beautyshops, and other personal services; and services/activities not elsewhereclassified, such as hotels, boarding houses, eating houses, cafes, andrestaurants.
110
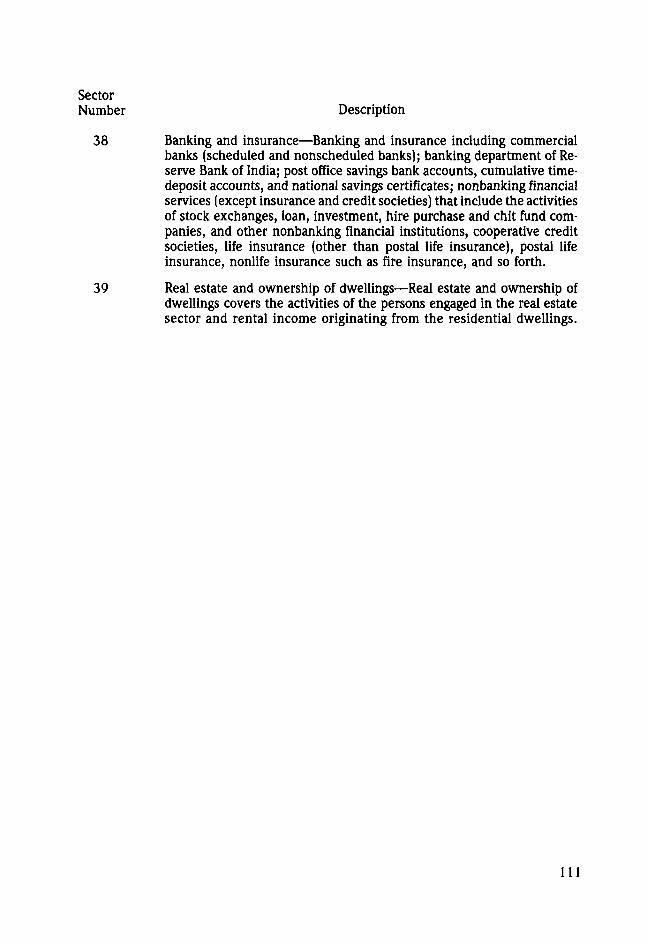
SectorNumber Description
38 Banking and insurance—Banking and insurance including commercialbanks (scheduled and nonscheduled banks); banking department of Re-serve Bank of India; post office savings bank accounts, cumulative time-deposit accounts, and national savings certificates; nonbanking financialservices (except insurance and credit societies) that include the activitiesof stock exchanges, loan, investment, hire purchase and chit fund com-panies, and other nonbanking financial institutions, cooperative creditsocieties, life insurance (other than postal life insurance), postal lifeinsurance, nonlife insurance such as fire insurance, and so forth.
39 Real estate and ownership of dwellings—Real estate and ownership ofdwellings covers the activities of the persons engaged in the real estatesector and rental income originating from the residential dwellings.
I l l
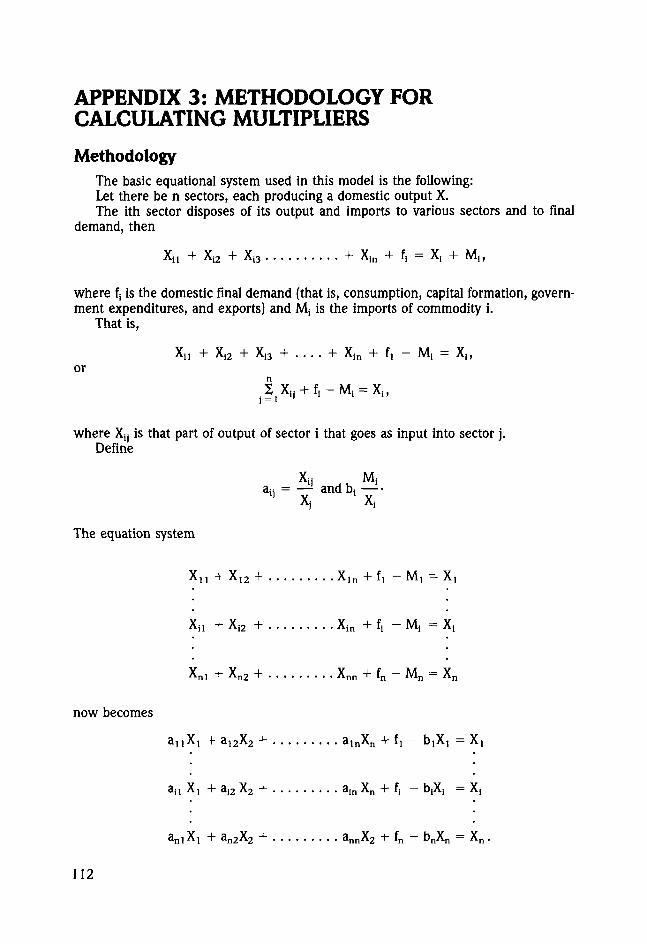
APPENDIX 3: METHODOLOGY FORCALCULATING MULTIPLIERS
MethodologyThe basic equational system used in this model is the following:Let there be n sectors, each producing a domestic output X.The ith sector disposes of its output and imports to various sectors and to final
demand, then
Xi2 + Xi3 Xin
where f, is the domestic final demand (that is, consumption, capital formation, govern-ment expenditures, and exports) and Mj is the imports of commodity i.
That is,
X,, + Xi2 + Xi3 + . . . . + Xin + f, - Mi =or
n
j = 1
where X is that part of output of sector i that goes as input into sector j .Define
Aij , , m iaSi = — ana b:
1 ^ X<
The equation system
Xn + X12
Xn + Xi2 +
Xn i + X n 2
Xin + f] - M , = X,
X i n + f, - Mi = X
f n - M n
now becomes
a n X, + a12 X2 + a in Xn
a n 2X 2
= X
a n nX 2 + fn - bnXn = X n .
112
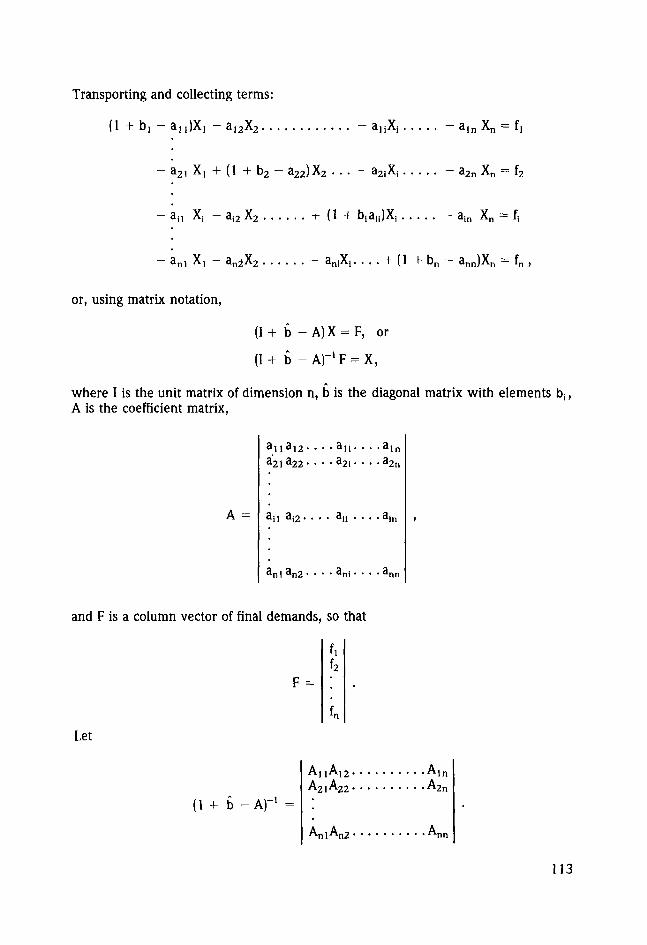
Transporting and collecting terms:
(1 + b , - a , , ) X , - a , 2 X 2 . . . ~ aln Xn -
- a21 X, b2 - a22)X2 . . . - - a2n Xn = f2
- a n X, - ai2 X2 b.auJX, - ain Xn = f,
- an l X, - an2X2 bn - ann)Xn = fn ,
or, using matrix notation,
(1+ b - A)X = F, or
(1+ b - A r ' F = X,
where I is the unit matrix of dimension n, b is the diagonal matrix with elementsA is the coefficient matrix,
a l l a 1 2 - • • • a l i - • • - a i na 2 1 a 2 2 - • • • a 2 i - • • - a 2 n
A = il ai2 • • • • aii • • • • ain
a nl a n2- • • • ani- • • • an
and F is a column vector of final demands, so that
Let
F =
(1 + b - A)"1 =
AuA 1 2 .A2iA2 2 .
AniAn 2 .
•Am•A2n
113
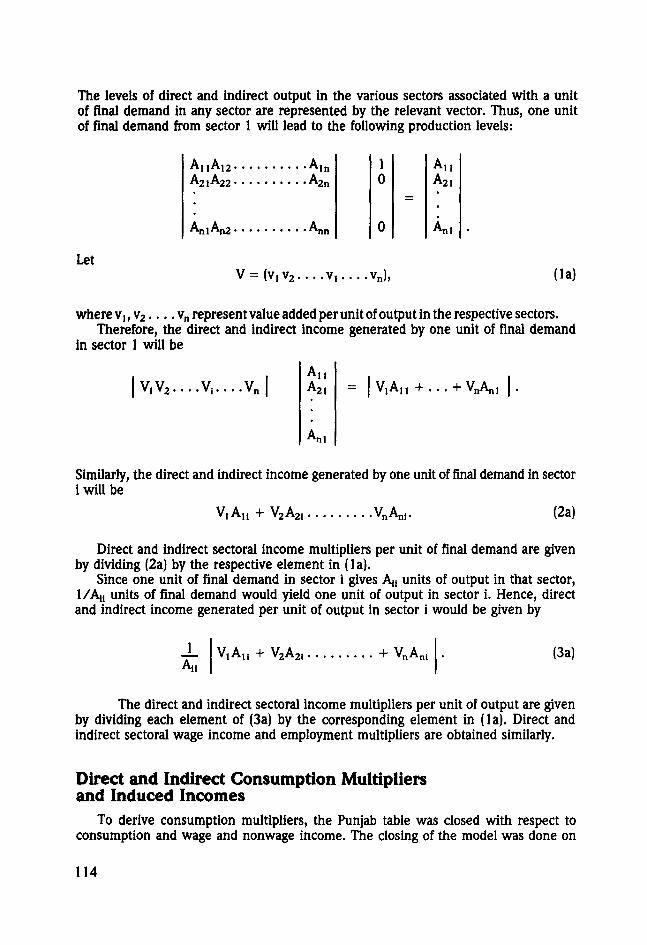
The levels of direct and indirect output in the various sectors associated with a unitof final demand in any sector are represented by the relevant vector. Thus, one unitof final demand from sector 1 will lead to the following production levels:
Let
A,n 1A2n 0
Ann
V = ( v , v 2 . . . . v , . . . . v n ) ,
A uA2,
Ani
(la)
where v,, v2 vn represent value added per unit of output in the respective sectors.Therefore, the direct and indirect income generated by one unit of final demand
in sector 1 will be
V , V 2 . . . . V 1 . . . . V nMl
Similarly, the direct and indirect income generated by one unit of final demand in sectori will be
V,A11 + V2A21 VnAni. (2a)
Direct and indirect sectoral income multipliers per unit of final demand are givenby dividing (2a) by the respective element in (la).
Since one unit of final demand in sector i gives AH units of output in that sector,1/Au units of final demand would yield one unit of output in sector i. Hence, directand indirect income generated per unit of output in sector i would be given by
A,,V,A2^21 VnAn (3a)
The direct and indirect sectoral income multipliers per unit of output are givenby dividing each element of (3a) by the corresponding element in (la). Direct andindirect sectoral wage income and employment multipliers are obtained similarly.
Direct and Indirect Consumption Multipliersand Induced Incomes
To derive consumption multipliers, the Punjab table was closed with respect toconsumption and wage and nonwage income. The closing of the model was done on
114

the assumption that a certain proportion of net value added in each sector is devotedto consumption. This proportion is derived from the average propensity to consume,which worked out at 0.7171 in 1969/70 and 0.6894 in 1979/80. The augmentedcolumn was the coefficient vector for total consumption and the augmented row wasobtained by multiplying the net value added by the average propensity to consume.
The (n + 1, n + 1) term of the inverted (I + b -A) matrix gives the consumptionmultiplier.
The respective elements in the last row in the inverted matrix give direct, indirect,and induced income generated per unit of final demand in that sector. Let these bedenoted by
ViV^ VA. (4a)
The direct, indirect, and induced sectoral income multipliers per unit of finaldemand are obtained by dividing the elements of (4a) by their respective direct incomegiven in (la). Further dividing these elements by the diagonal output levels yieldsdirect, indirect, and induced sectoral incomes per unit of output. These are
> (5aA ; , A^2 A;n
where An , A22 • •. • A | , . . . . A^n are diagonal elements in the inverted augmentedmatrix. Direct, indirect, and induced sectoral income multipliers per unit of output areobtained by dividing each element of (5a) by the direct sectoral income given in thecorresponding element in (la).
The direct, indirect, and induced sectoral wage income and employment multipliersare obtained similarly.
115

BIBLIOGRAPHY
Ahluwalia, Montek S. 1978. Rural poverty and agricultural performance in India. Journalof Development Studies 14 (3): 298-323.
Alagh, Y. K., G. S. Bhalla, and S. K. Kashyap. 1980. Structural analysis of Gujarat,Punjab, and Haryana economies—An input-output study. New Delhi: Allied.
Bhalla, G. S., and G. K. Chadha. 1983. Green revolution and the small peasant: Astudy of income distribution among Punjab cultivators. New Delhi: Concept.
Bhalla, G. S., G. K. Chadha, G. V. S. N. Murthi, S. S. Ahluwalia, and R. K. Sharma.1981. Structural and institutional set-up of rural Punjab in the year 2000: Theimplication of population growth and distribution. Rome: Food and AgricultureOrganization. Mimeo.
Blumer-Thomas, V. 1976. The structure of protection in Costa Rica: A new approachto calculating the rate of effective protection. Journal of Economic Studies 3(1): 13-28.
.. 1978. Trade, structure and linkages in Costa Rica: An input-output approach.Journal of Development Economics 5 (1): 73-86.
Chadha, G. K. 1985. Off-farm economic structure of an agriculturally growing region:A study of Indian Punjab. In Off-farm employment in the development of ruralAsia, ed. R. T. Shand, chap. 20. Canberra: Australian National University.
. 1986. The state and rural economic transformation: The case of Punjab,1950-85. New Delhi: Sage.
Chenery, H., and T. Watanabe. 1958. International comparisons of the structure ofproduction. Econometrica 26: 487-521.
Hegde, G. I. 1985. Regional imbalance in India with particular reference to banking.Paper read at the seminar on Regional Planning in India, 22-24 October, Univer-sity of Jodhpur, Jodhpur, Rajasthan.
Hirashima, Shigemochi. 1978. The structure of disparity in developing agriculture: Acase study of the Pakistan Punjab. Tokyo: Institute of Developing Economies.
Hirschman, A. 1985. The strategy of economic development. New Haven: Yale Univer-sity Press.
India, Agricultural Prices Commission. Various years. Report on price policy for Kharifand Rabi crops. Delhi.
India, Food Corporation of India. Various years. Annual report. Delhi.
India, Ministry of Agriculture and Cooperation. Various years. Comprehensive schemefor studying cost of cultivation of principal crops in India. Directorate of Economicsand Statistics, Delhi. Mimeo.
India, Ministry of Finance. 1984. Economic survey, 1983-84. Delhi.
117
India, Ministry of Food and Agriculture. Directorate of Economics and Statistics. 1963.Studies in economic of farm management in Punjab: Combined reports for1954-55 to 56-57. Delhi.
. 1968. Growth rates in agriculture, 1949-50 to 1964-65. Delhi.
India, Ministry of Home Affairs. Registrar General of India. 1982. Census of India,1981. Paper no. 3. Delhi.
India, Ministry of Planning. Central Statistical Organization. 1989. Annual survey ofindustries, factory sector, vol. 10. Delhi.
Various years(a). Annual survey of industries. Delhi.
. Various years(b). National accounts statistics. Delhi.
Various years(c). Statistical Abstract.Delhi.
India, Ministry of Planning. National Sample Survey Organization. 1975. Tables onland holdings at state level: Punjab, vol. 1. New Delhi.
. 1978. National Sample Survey, 29th round. Sarvekshana 1 (4): 167-185,S399-S584 and 2 (1): S12-S149.
1979. National Sample Survey, 27th round. Sarvekshana 2 (3): 129-133,S287-S436.
. 1986a. National Sample Survey, 32nd round. Sarvekshana 9 (3): 17-23, S51-S184.
. 1986b. National Sample Survey, 38th round. Sarvekshana 9 (4): S1-S102.
India, Ministry of Railways. Railway Board. Various years. Annual report. New Delhi.
India, Planning Commission. 1981. A Technical note on the Sixth Plan of India:1980-85. Delhi.
Panchmukhi, V. R. 1975. Linkages in industrialization: A study of selected developingcountries in Asia. Journal of Development Planning 8: 121-165.
Punjab, Department of Agriculture. 1985. Report of agricultural census, 1980-81.Chandigarh.
Punjab, Development Department. 1974. Third decennial agricultural census reportfor Punjab, 1970-71. Chandigarh.
Punjab, Economic and Statistical Adviser. 1982. Survey of unregistered industries,1975-77. In The statistical abstract of Punjab. Chandigarh.
Various years. The statistical abstract of Punjab. Chandigarh.
Punjab, Economic and Statistical Organization. 1971. Census of unorganized industries,1970-71. Chandigarh.
1980a. Economic and functional classification of the Punjab governmentbudget, 1979/80. Chandigarh.
118
_. 1980b. Estimates of fixed capital formation by state government and localauthorities, 1978/79. Chandigarh.
_. 1980c. Estimates of fixed capital formation in the rural household sector ofPunjab, 1979/80. Chandigarh.
_. 1980d. Estimates of fixed capital formation in the urban household sector ofPunjab, 1979/80. Chandigarh.
_. 1981. Economic and functional classification of the municipal budget inPunjab, 1980/81. Chandigarh.
_. N.d. Educational statistics of Punjab (Publication no. 333). Chandigarh.
Punjab, Electricity Board. 1980. Administration report, 1979/80. Chandigarh.
Raj, K. N. 1975. Linkage in industrialization and development strategy: Some basicissues. Journal of Development Planning 8: 106-119.
Rangarajan, C. 1982. Agricultural growth and industrial performance in India. ResearchReport 33. Washington, D.C.: International Food Policy Research Institute.
Reserve Bank of India. 1975. Review of the cooperative movement in India, 1970-72.Bombay: Economic Department, RBI.
Simpson, D., and J. Tsukui. 1965. The fundamental structure of production. Reviewof Economics and Statistics 47 (1): 434-446.
Singh, Harbans. 1986. Employment, income, and consumption of rural labor householdsin a green revolution region: A case study of Punjab and Haryana. Ph.D. thesis,Jawarharlal Nehru University, New Delhi.
Weisskoff, T. E. 1971. Alternative patterns of import substitution in India. In Studiesin development planning, ed. H. Chenery et al. Cambridge, Mass., U.S.A.:Harvard University Press.
Westley, J. R. 1986. Agriculture and equitable growth—The case of Punjab-Haryana.Boulder, Colo., U.S.A. Westview Press.
119

RECENT IFPRI RESEARCH REPORTS (continued)
64 COOPERATIVE DAIRY DEVELOPMENT IN KARNATAKA, INDIA: AN ASSESSMENT, December1987, by Harold Alderman
61 INCOME AND NUTRITIONAL EFFECTS Of- THE COMMERCIALIZATION OF AGRICULTUREIN SOUTHWESTERN KENYA, November 1987, by Eileen T Kennedy and Bruce Cogill
62 AGRfCUU URAL RESEARCH IN NEPAL: RESOURCE AH OCA LION, STRUCTURE, AND 1NCENTIVES, September 1987, by Ram P. Yadav
61 lilt PILOT FOOD PRICI SUBS1DYSCHEME IN IHE PHILIPPINES: ITS IMPACT ON INCOME,EOOD CONSUMPTION, AND NUTR/TIONA! STATUS, August 1987, by Mamo Garcia and PerPinstrup Andersen
00 POPULATION POLICY AND INDIVIDUA! CHOICE: A IHEORETICAL INVFSIIGAIION, June1987, by Man Neilove, Assaf Kaziu, and l.traiin Sadka
59 PRODUCTION INCENTIVE* IN PHILIPPINE AGRICULTURE: EFFECTS OF IRADF AND EXCHANGE RATE POUCH'S, May 1987, by Romeo M. Bautisla
58 THE FO( )D SI AMP SCHFMI IN SRI LANKA: (X )STS, HENtHTS, AND OPTIONS FOR MODIFI-CATION, March 1987, by Novillt F.diri.singhe
57 CEREAL FEED USl IN HIE IHIRD WORLD: PAST TRf NDS AND PRO/ECTIONS TO 2000,iVrernbei 1986, t>y I S. VIIITU
56 IHL IEFECIS OE TRAD! AND EXCHANGE RATE POLICIES ON ACRICULIURE. IN ZAIRE,November 1986, by Tshik.ila V>. Ibhibaka
55 THE F.I EEC IS OF TRADi AND I KCHANGI IMIF POLICIES ON AGRICULTURE IN NIGERIA,October 1986, by 1 Adt-mfil.: I fyejide
54 WEATHER AND GRAIN YIELDS IN I HE SOVII T UNION, September ]>>Hf., by 1'adma Dessi
5 ! RFGIONAI COOPIRAIION TO IMPROVi I OOD SFCUR/IY IN SOU! HERN AND EASTERNA F R I C A N C O U N T R I I S , J u l y l - W o , l..v l l l i i L b K o e a t e r
52 FOOD IN THE THIRD V/ORID: PASI TRENDS AND PRl i/ECTIONS TO 2000, June 1980, byI torir'.rdo A Paulino
SI DF.lERMINANlSOl AGRICUl IURALPOI ICIfS IN THE UNI I EL) VIATES AND I HE EUROPEANCOMMUNITY, Novernbe i 1 9 8 5 , by Miche l Peiii
SO GOVERNMENT! XPENDI HIRES ON AGRICUl TURF AND AGRICUL I URAi GROWTH IN LATINAMERICA, Ocfolwr IVK5, ty Victor I. HlidS
49 liVFSTOCK PRODI/CIS IN Till THIRD Wi. )Rl I): PAST TRENDS AND PROJECTIONS TO I WOAND ?0()0, April l<)«5, by 1 S. Sartua ma Patrick Yeuuf,
48 RURAL HOUSEHOLD US' (.'/ SERVICES: A S! UDY OE MIRYAl.GUDA TAIUKA, INDIA, MarchI98S, by Sudlm W,mm..h
4/ I VOl VING /•' HID (;AK-. IN Till M/DDt I EAST/NORTH AFRICA PROSPECTS AND POLICYIMP! /CATIONS, l)e<embei I >,-84, by Nabi! Khal.li
('.. S. Bhalle. is A professor oi economics atjawaharlai Nehru University,New Oeliii lie was chairman of the Agricultural Prices Commission,Government of India, irom ! 983 to 1986. G. K. Chadha is a professorof economics at jawaharlal Nehru University, New Delhi. S. PKashyap h a professor of economics at the Sardar Pat el Institute ofiiconomic dnd Social Research, Ahmeciabad. R. K. Sharma IJ. an asso-ciate professor ot economics at jawaharlal Nehru University, New Delhi.
RECENT IFPRI RESEARCH REPORTS
81 PRODUCTION AND CONSUMPTION OF FOODGRA1NS IN INDIA: IMPLICATIONS OF ACCEL-ERATED ECONOMIC GROWTH AND POVERTY ALLEVIATION, July 1990, by J. S. Sarma andVasant P. Gandhi
80 HORTICULTURAL EXPORTS OF DEVELOPING COUNTRIES: PAST PERFORMANCES, FUTUREPROSPECTS, AND POLICY ISSUES, April 1990, by Nurul Islam
79 EFFECTS OF AGRICULTURAL COMMERCIALIZATION ON LAND TENURE, HOUSEHOLD RE-SOURCE ALLOCATION, AND NUTRITION IN THE PHILIPPINES, January 1990, by HowarthE. Bouis and Lawrence J. Haddad
78 THE EFFECTS OF SUGARCANE PRODUCTION ON FOOD SECURITY, HEALTH, AND NUTRI-TION IN KENYA: A LONGITUDINAL ANALYSIS, December 1989, by Eileen Kennedy
77 THE DEMAND FOR PUBLIC STORAGE OF WHEAT IN PAKISTAN, December 1989, by Thomas C.Pinckney
76 AGRICULTURE AND ECONOMIC GROWTH IN ARGENTINA, 1913-84, November 1989, byYair Mundlak, Domingo Cavallo, and Roberto Domenech
75 IRRIGATION TECHNOLOGY AND COMMERCIALIZATION OF RICE IN THE GAMBIA: EFFECTSON INCOME AND NUTRITION, August 1989, by Joachim von Braun, Detlev Puetz, and PatrickWebb
74 FOOD PRODUCTION IN A LAND-SURPLUS, LABOR-SCARCE ECONOMY: THE ZA1RIAN BASIN,June 1989, by Tshikala B. Tshibaka
73 NONTRADITIONAL EXPORT CROPS IN GUATEMALA: EFFECTS ON PRODUCTION, INCOME,AND NUTRITION, May 1989, by Joachim von Braun, David Hotchkiss, and Maarten Immink
72 RICE PRICE FLUCTUATION AND AN APPROACH TO PRICE STABILIZATION IN BANGLADESH,February 1989, by Raisuddin Ahmed and Andrew Bernard
71 STORAGE, TRADE, AND PRICE POLICY UNDER PRODUCTION INSTABILITY: MAIZE INKENYA, December 1988, by Thomas C. Pinckney
70 AGRICULTURE IN THE GATT: AN ANALYSIS OF ALTERNATIVE APPROACHES TO REFORM,November 1988, by Joachim Zietz and Alberto Valdes
69 CONSEQUENCES OF DEFORESTATION FOR WOMEN'S TIME ALLOCATION, AGRICULTURALPRODUCTION, AND NUTRITION IN HILL AREAS OF NEPAL, October 1988, by Shubh K.Kumar and David Hotchkiss
68 COFFEE BOOM, GOVERNMENT EXPENDITURE, AND AGRICULTURAL PRICES: THECOLOM-BIAN EXPERIENCE, August 1988, by Jorge Garcia Garcia and Gabriel Montes Llamas
67 NATURE AND IMPACT OF THE GREEN REVOLUTION IN BANGLADESH, July 1988, by MahabubHossain
66 THE BRAZILIAN WHEAT POLICY: ITS COSTS, BENEFITS, AND EFFECTS ON FOOD CONSUMP-TION, May 1988, by Geraldo M. Calegar and G. Edward Schuh
65 CREDIT FOR ALLEVIATION OF RURAL POVERTY: THE GRAMEEN BANK IN BANGLADESH,February 1988, by Mahabub Hossain
(continued on inside back cover)
International Food Policy Research Institute1776 Massachusetts Avenue, N.WWashington, DC. 20036 USA