agricultural development and food security in sub-saharan africa building a case for for more...
TRANSCRIPT

Agricultural Development and Agricultural Development and Food Security in Sub-Saharan Food Security in Sub-Saharan
AfricaAfrica
Building a CaseBuilding a Case
for for
More SupportMore Support(WELDEGHABER KIDANE)(WELDEGHABER KIDANE)
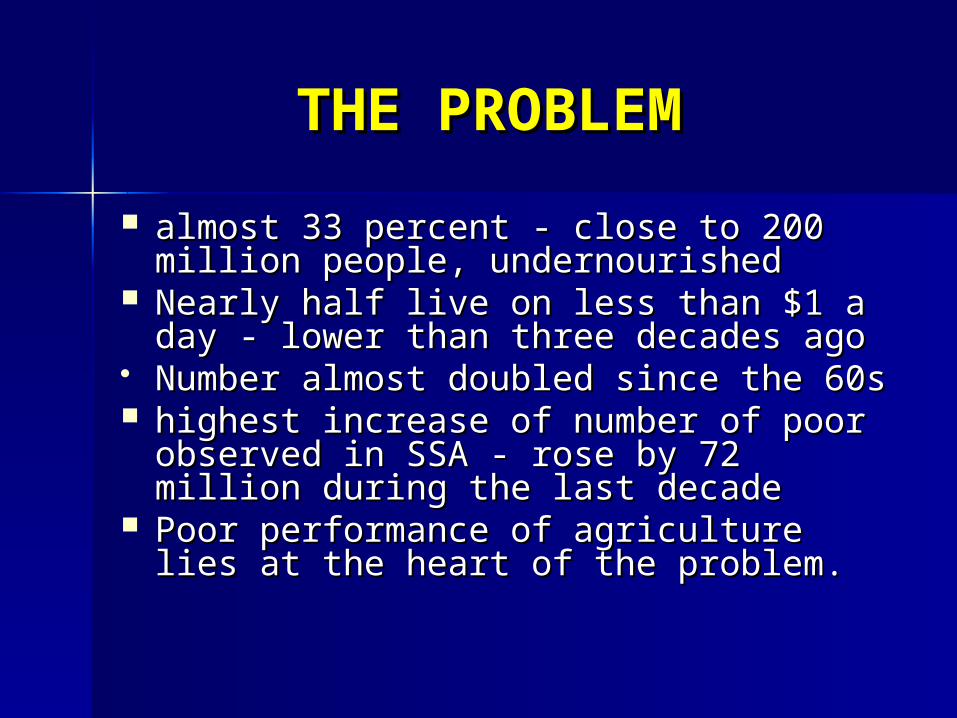
THE PROBLEMTHE PROBLEM
almost 33 percent - close to 200 almost 33 percent - close to 200 million people, undernourished million people, undernourished
Nearly half live on less than $1 a day - Nearly half live on less than $1 a day - lower than three decades agolower than three decades ago
Number almost doubled since the 60sNumber almost doubled since the 60s highest increase of number of poor highest increase of number of poor
observed in SSA - rose by 72 million observed in SSA - rose by 72 million during the last decade during the last decade
Poor performance of agriculture lies at Poor performance of agriculture lies at the heart of the problem.the heart of the problem.

PROBLEM Cont...PROBLEM Cont...
food crises and famines, easily triggered food crises and famines, easily triggered by lightest of droughts, floods, pests, by lightest of droughts, floods, pests, economic downturns or conflicts. economic downturns or conflicts.
only continent where hunger is projected only continent where hunger is projected to worsen unless drastic measures are to worsen unless drastic measures are taken agricultural exports have fallen taken agricultural exports have fallen while imports of food have surged while imports of food have surged
food aid interventions common feature food aid interventions common feature of African news headlines of African news headlines

Structural AdjustmentsStructural Adjustments
implemented 1980s - 1990s to redress policies that implemented 1980s - 1990s to redress policies that taxed agriculture heavilytaxed agriculture heavily
ImpactImpact Mixed Mixed – Liberalization removed deliberate price discriminationsLiberalization removed deliberate price discriminations– provided (in theory) incentives efficient resource provided (in theory) incentives efficient resource
allocation allocation Terms of trade for agriculture deteriorated - input Terms of trade for agriculture deteriorated - input
prices grew faster than output pricesprices grew faster than output prices Privatization accompanied by stringent budget Privatization accompanied by stringent budget
regimes regimes led to collapse of agriculture services led to collapse of agriculture services decreasing public support + weak private sector decreasing public support + weak private sector
undue dependence on food imports and food aidundue dependence on food imports and food aid

Context & Objective of Context & Objective of StudyStudy
In July 2003, AU resolved, to In July 2003, AU resolved, to allocate 10% of budgetallocate 10% of budget
translating commitment into translating commitment into political action not easy due to political action not easy due to
ObjectiveObjective of study: to provide of study: to provide sound arguments for ministers sound arguments for ministers Maputo Declaration is justMaputo Declaration is just

Components of the Components of the studystudy
Background DocumentBackground Document Country case studiesCountry case studies 10 countries: 10 countries:
Chad, DR Congo, Ethiopia, Ghana, Kenya, Chad, DR Congo, Ethiopia, Ghana, Kenya, Malawi, Mali, Nigeria, Tanzania and Malawi, Mali, Nigeria, Tanzania and Zambia;Zambia;
Main ReportgMain Reportg: Outlining Boarder policy : Outlining Boarder policy and strategy options for Africaand strategy options for Africa
Two regional workshopsTwo regional workshops in partnership in partnership with AU/NEPAD Sec and RECSwith AU/NEPAD Sec and RECS

KEY ISSUESKEY ISSUES
Can agriculture in SSA be an Can agriculture in SSA be an engine for broad-based economic engine for broad-based economic growth?growth?
What should be the role of the What should be the role of the public and private sectors?public and private sectors?
What would be the optimum What would be the optimum level of government engagementlevel of government engagement

Structure of the Main Structure of the Main ReportReport IntroductionIntroduction Food security and nutrition in SSAFood security and nutrition in SSA Strategic options for poverty and food Strategic options for poverty and food
insecurity reductioninsecurity reduction Agr performance in SSAAgr performance in SSA Constraints and OpportunitesConstraints and Opportunites Success stories in and outside SSA – Success stories in and outside SSA –
lessons learnedlessons learned Where do we go from hereWhere do we go from here

CONSTRAINTS TO CONSTRAINTS TO SUSTAINABLE SUSTAINABLE
AGR. AGR. DEVELOPMENT IN DEVELOPMENT IN
SSASSA

CONSTRAINTS TO SUSTAINABLE AGR. CONSTRAINTS TO SUSTAINABLE AGR. DEVELOPMENT IN SSADEVELOPMENT IN SSA
Political unrest and armed conflictsPolitical unrest and armed conflicts Non-conducive policy environment and Non-conducive policy environment and
poor institutional frameworkpoor institutional framework Policies failedPolicies failed Limitation to expanding cultivated area Limitation to expanding cultivated area Limitations to improved productivityLimitations to improved productivity

Political unrest and armed Political unrest and armed conflictsconflicts
Worst performers in terms of daily per capita calorie Worst performers in terms of daily per capita calorie intake during the period 1990 to 2002 were intake during the period 1990 to 2002 were Burundi, Democratic Republic of the Congo, Guinea-Burundi, Democratic Republic of the Congo, Guinea-Bissau, Eritrea and Liberia. Bissau, Eritrea and Liberia.
Conflicts impact through:Conflicts impact through:–Diversion of budgets and human resources to defence Diversion of budgets and human resources to defence and internal-securityand internal-security–Associated risk undermines private investment both Associated risk undermines private investment both domestic and foreigndomestic and foreign–markets and other services are disruptedmarkets and other services are disrupted–infrastructure and private property are destroyed, and infrastructure and private property are destroyed, and so onso on–Agr. most affected. Agr. most affected.

political unrest and armed political unrest and armed conflictsconflictsCont...Cont...
Agriculture is often one of the Agriculture is often one of the most affected sectors most affected sectors Farmers Farmers most affectedmost affected
Rural populations are displaced - Rural populations are displaced - fields unattended, with drastic fields unattended, with drastic consequencesconsequences
Social ties and capital are Social ties and capital are dislocateddislocated

Non-conducive policy environment Non-conducive policy environment
and poor institutional frameworkand poor institutional framework
Inadequate political commitment and action Inadequate political commitment and action Weak institutional capacity and structure for Weak institutional capacity and structure for
policy programme/project development and policy programme/project development and implementationimplementation
Policies not favouring agriculture and rural Policies not favouring agriculture and rural development development
Unstable macroeconomic environment Unstable macroeconomic environment Legislative framework either weak, missing Legislative framework either weak, missing
or not properly enforcedor not properly enforced undermines private sector involvement and undermines private sector involvement and
investment. investment.

Why past policies including Why past policies including SAPs did not workSAPs did not work
For some reforms under SAP not been fully For some reforms under SAP not been fully appliedapplied
Others attribute failures to poor governanceOthers attribute failures to poor governance– Strong executive, largely inefficient and often Strong executive, largely inefficient and often
corrupt and weak civil society organizationscorrupt and weak civil society organizations– Macroeconomic stabilization policies broadly Macroeconomic stabilization policies broadly
enforced but expenditures on defence, internal enforced but expenditures on defence, internal security, diplomacy etc. are protectedsecurity, diplomacy etc. are protected
– public contracts awarded or managed in a non-public contracts awarded or managed in a non-competitive waycompetitive way
– At times markets destabilized by deliberate At times markets destabilized by deliberate misinformation and unconvincing promises misinformation and unconvincing promises
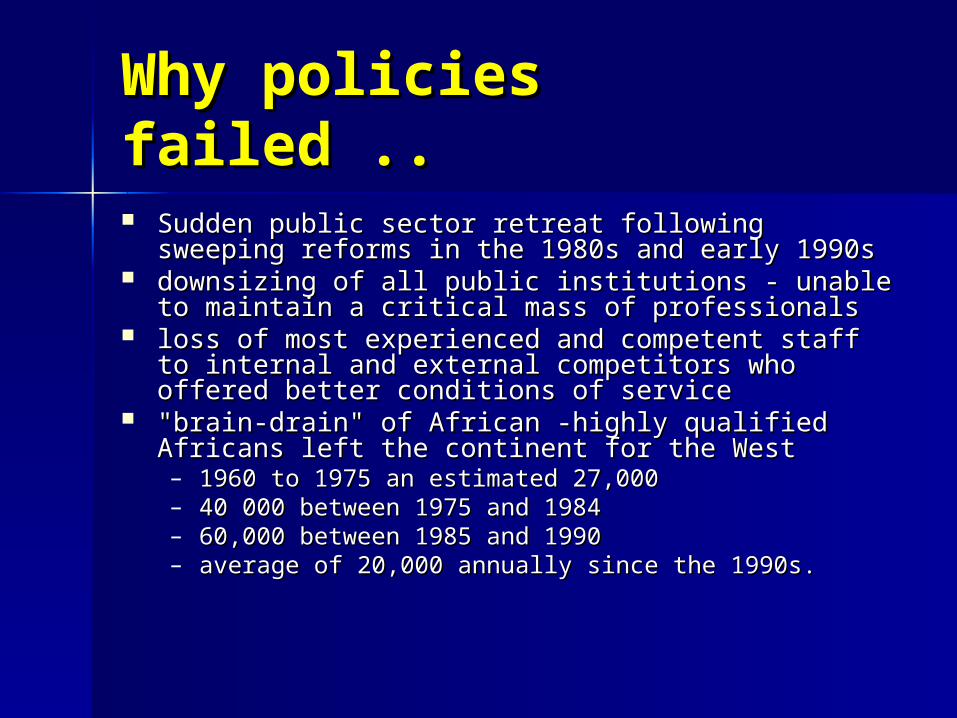
Why policies failed .. Why policies failed ..
Sudden public sector retreat following sweeping Sudden public sector retreat following sweeping reforms in the 1980s and early 1990s reforms in the 1980s and early 1990s
downsizing of all public institutions - unable to downsizing of all public institutions - unable to maintain a critical mass of professionalsmaintain a critical mass of professionals
loss of most experienced and competent staff to loss of most experienced and competent staff to internal and external competitors who offered better internal and external competitors who offered better conditions of serviceconditions of service
"brain-drain" of African -highly qualified Africans left "brain-drain" of African -highly qualified Africans left the continent for the Westthe continent for the West– 1960 to 1975 an estimated 27,000 1960 to 1975 an estimated 27,000 – 40 000 between 1975 and 198440 000 between 1975 and 1984– 60,000 between 1985 and 199060,000 between 1985 and 1990– average of 20,000 annually since the 1990s.average of 20,000 annually since the 1990s.

Weak Research Weak Research CapacityCapacity Some basic figures on agricultural Some basic figures on agricultural
research inresearch in Mozambique and BrazilMozambique and Brazil– Total number of staff in recently established Total number of staff in recently established
Mozambican Institute for Agricultural Research Mozambican Institute for Agricultural Research (IIAM) 902 people - Only 2 percent of those are (IIAM) 902 people - Only 2 percent of those are researchers hold MSc and PhD degrees.researchers hold MSc and PhD degrees.
– Brazilian Agricultural Research Corporation Brazilian Agricultural Research Corporation (EMBRAPA); a public corporation (EMBRAPA); a public corporation
has 37 research centres and 3 service centres,has 37 research centres and 3 service centres, present in almost all 24 Brazilian statespresent in almost all 24 Brazilian states 8,169 employees - 2 221 are researchers with 8,169 employees - 2 221 are researchers with
master’s degrees and 53% with doctoral degreesmaster’s degrees and 53% with doctoral degrees Average salary US$1 700 per month Average salary US$1 700 per month
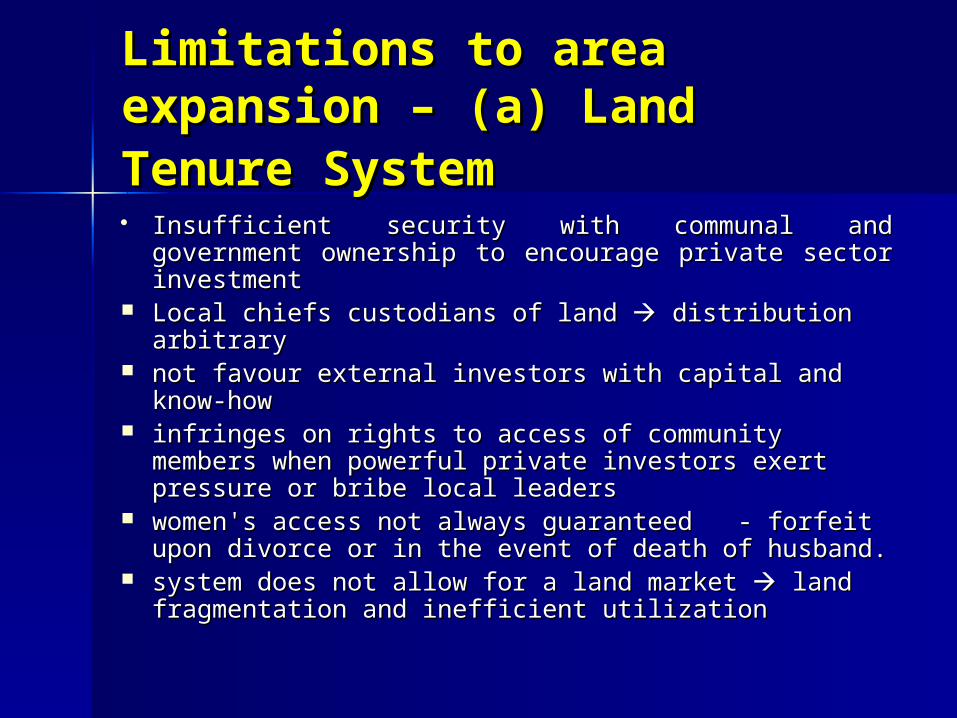
Limitations to area Limitations to area expansion – (a) expansion – (a) Land Tenure Land Tenure SystemSystem Insufficient security with communal and government Insufficient security with communal and government
ownership to encourage private sector investment ownership to encourage private sector investment Local chiefs custodians of land Local chiefs custodians of land distribution distribution
arbitraryarbitrary not favour external investors with capital and know-not favour external investors with capital and know-
howhow infringes on rights to access of community members infringes on rights to access of community members
when powerful private investors exert pressure or when powerful private investors exert pressure or bribe local leadersbribe local leaders
women's access not always guaranteed - forfeit women's access not always guaranteed - forfeit upon divorce or in the event of death of husband.upon divorce or in the event of death of husband.
system does not allow for a land market system does not allow for a land market land land fragmentation and inefficient utilizationfragmentation and inefficient utilization

Limit to area expansion – Limit to area expansion – (b) Physical Availability(b) Physical Availability Per capita land availability dwindling Per capita land availability dwindling
– Population pressure and lack of alternative employment Population pressure and lack of alternative employment opportunities,opportunities,
– land degradation and desertificationland degradation and desertification Most countries are land-constrained - Burundi, Most countries are land-constrained - Burundi,
Ethiopia, Kenya and Rwanda - yet recent production Ethiopia, Kenya and Rwanda - yet recent production increases in some of these countries attributed to area increases in some of these countries attributed to area expansionexpansion
marginal, grazing and forest lands being switched to marginal, grazing and forest lands being switched to crop production, with adverse effect on sustainable crop production, with adverse effect on sustainable livelihoods and the environment. livelihoods and the environment.
opportunities exist for area expansion in some SSA, opportunities exist for area expansion in some SSA, provided:provided:– infrastructure is established to facilitate access infrastructure is established to facilitate access – measures put in place to protect land from erosion and measures put in place to protect land from erosion and
degradation degradation

Other Limitation to Area Other Limitation to Area Expansion – (d) Mech. Expansion – (d) Mech. PowerPower Low traction power Low traction power . agriculture . agriculture
dominated by a hoe culturedominated by a hoe culture modest increase in trend in tractor modest increase in trend in tractor
use remains still very low use remains still very low more than 5 percent per annum more than 5 percent per annum
between 1961 and 1973between 1961 and 1973 Only 2 percent and 1 percent Only 2 percent and 1 percent
1973-1994 and 1995-2002, 1973-1994 and 1995-2002, respectively respectively

Limitation to area Limitation to area Expansion – (e) LabourExpansion – (e) Labour
Farmers engaged in off-farm Farmers engaged in off-farm income-generating activitiesincome-generating activities
The HIV/AIDS pandemic, The HIV/AIDS pandemic, especially in Southern and East especially in Southern and East Africa, Africa,

(a) Limitation to (a) Limitation to Increased Productivity - Increased Productivity - WaterWater
Recurrent droughts and increasing (7 countries in Recurrent droughts and increasing (7 countries in 19980/90 to 13 1991/03)19980/90 to 13 1991/03)
Investment in water harvesting and Irrigation still Investment in water harvesting and Irrigation still inadequateinadequate
Irrigated agriculture not increasing 2.1% excluding Irrigated agriculture not increasing 2.1% excluding Sudan and South Africa, and 2.8 if SA included;Sudan and South Africa, and 2.8 if SA included;
FAO estimates availability of sufficient water to FAO estimates availability of sufficient water to develop ca 42.5 million ha under full irrigationdevelop ca 42.5 million ha under full irrigation
Only significant (>10%) in five countries; 25 Only significant (>10%) in five countries; 25 countries <2%countries <2%
Potential high e.g. Eth 3.7 million Ha (2%)Potential high e.g. Eth 3.7 million Ha (2%)

Irrigation Africa Vs Irrigation Africa Vs Other Regions of the Other Regions of the WorldWorld
0.0
5.0
10.0
15.0
20.0
25.0
30.0
35.0
40.0
Avg 60s Avg. 70s Avg 80s Avg 90s-MRPeriod
Perc
en
tag
e
Latin Amer &Caribbean
Near East InAfrica
South Asia
Percentageof Total ExclSA
Total Inc SA
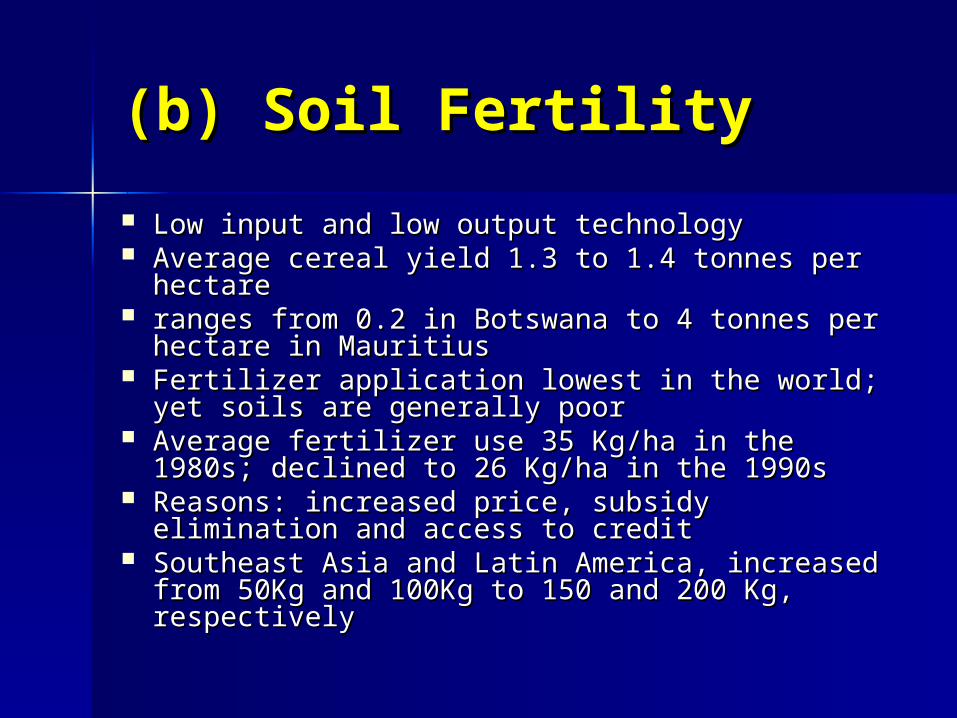
(b) Soil Fertility(b) Soil Fertility
Low input and low output technologyLow input and low output technology Average cereal yield 1.3 to 1.4 tonnes per Average cereal yield 1.3 to 1.4 tonnes per
hectarehectare ranges from 0.2 in Botswana to 4 tonnes per ranges from 0.2 in Botswana to 4 tonnes per
hectare in Mauritiushectare in Mauritius Fertilizer application lowest in the world; yet soils Fertilizer application lowest in the world; yet soils
are generally poorare generally poor Average fertilizer use 35 Kg/ha in the 1980s; Average fertilizer use 35 Kg/ha in the 1980s;
declined to 26 Kg/ha in the 1990s declined to 26 Kg/ha in the 1990s Reasons: increased price, subsidy elimination and Reasons: increased price, subsidy elimination and
access to credit access to credit Southeast Asia and Latin America, increased from Southeast Asia and Latin America, increased from
50Kg and 100Kg to 150 and 200 Kg, respectively 50Kg and 100Kg to 150 and 200 Kg, respectively

Soil Fertility Mgmt.Soil Fertility Mgmt.
0.0
100.0
200.0
300.0
400.0
500.0
600.0
700.0
Kg
/ha Index Wtd
AverageSSA
Index WtdAverageSEA
Index WtdAverageLA/CAR

© Weak Research, © Weak Research, Credit and Extension Credit and Extension ServicesServices Understaffed and under equipped Understaffed and under equipped
research and extension services;research and extension services; Poor research/extension/farmer Poor research/extension/farmer
linkageslinkages improved varieties account for 70% to improved varieties account for 70% to
90% yield increase in Asia and the 90% yield increase in Asia and the Near East: only for 28% in Africa Near East: only for 28% in Africa
Credit services have failedCredit services have failed regional cooperation in research not regional cooperation in research not
promoted (economies of scale)promoted (economies of scale)

Yield ComparisonYield Comparison
0.0
0.5
1.0
1.5
2.0
2.5
3.0
3.5
1961-69 1970-79 1980-89 1990-99 2000-MR
Year
Mt/H
a
AsiaDeveloping
CentralAfrica
EasternAfrica
Latin Amer &Caribbean
SouthernAfrica
WesternAfrica

(d) Marketing & (d) Marketing & Market AccessMarket Access Transaction cost very high : a ton of maize Transaction cost very high : a ton of maize
USA (11,000Km) to Mombassa US$45 to USA (11,000Km) to Mombassa US$45 to US$48; Mombassa/Mbrara in Uganda US$48; Mombassa/Mbrara in Uganda (1,500Km) ranges from US$ 125 to (1,500Km) ranges from US$ 125 to US$140. US$140.
rural transport costs e.g. Ghana and rural transport costs e.g. Ghana and Zimbabwe 2-3 higher than in Asia – Pak, Zimbabwe 2-3 higher than in Asia – Pak, Indonesia and SrilankaIndonesia and Srilanka
Road connectivity less than 2.4Km/1000 Road connectivity less than 2.4Km/1000 population; less than 40% are pavedpopulation; less than 40% are paved
Market failures the norms Market failures the norms – weak and colluding private traders weak and colluding private traders monopsony monopsony – lack of informationlack of information

(e) Deteriorating Terms (e) Deteriorating Terms of Trade – Barter Terms of Trade – Barter Terms of of Farmers face low farm gate output and high Farmers face low farm gate output and high
input prices (input prices (barter terms of tradebarter terms of trade)) Believed input prices escalated quicker than Believed input prices escalated quicker than
output prices after SAP - currency realignments, output prices after SAP - currency realignments, subsidy removal, tax reform and other changessubsidy removal, tax reform and other changes
Deterioration of relative prices between inputs Deterioration of relative prices between inputs and consumer goods e.g. Ethiopia, price of food and consumer goods e.g. Ethiopia, price of food increased by 12% - 1995 to 2000, price of increased by 12% - 1995 to 2000, price of fertilizer (DAP) increased by 76% and 8X for fertilizer (DAP) increased by 76% and 8X for maize.maize.
Deteriorating terms of trade more pronounced Deteriorating terms of trade more pronounced in the 1980sin the 1980s

Deteriorating International Deteriorating International Terms of Trade for SSA main Terms of Trade for SSA main exportsexports Slump of price of Arabica in 1986-1987, Slump of price of Arabica in 1986-1987,
resulted in a 40 percent fall in Ethiopia's terms resulted in a 40 percent fall in Ethiopia's terms of trade led to 6 percent drop in Ethiopia's of trade led to 6 percent drop in Ethiopia's real incomereal income
Imports about 15 percent of Ethiopia's national Imports about 15 percent of Ethiopia's national expenditure, expenditure,
Better for. food prices Better for. food prices reduction only ca 4 reduction only ca 4 percent in US-dollar terms 1995 to 2004percent in US-dollar terms 1995 to 2004
same period, price of beverages - main same period, price of beverages - main exports - by 35 percentexports - by 35 percent
price index for all commodities increased by price index for all commodities increased by nearly 50%nearly 50%
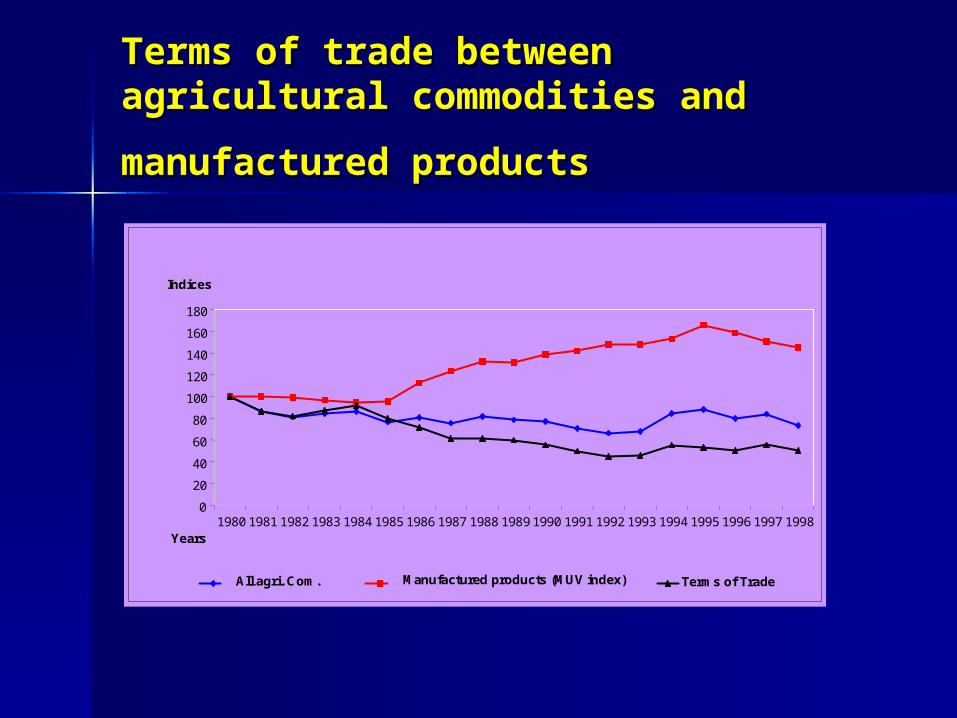
Terms of trade between agricultural Terms of trade between agricultural commodities and manufactured commodities and manufactured
productsproducts
0 20 40 60 80
100 120 140 160 180
1980 1981 1982 1983 1984 1985 1986 1987 1988 1989 1990 1991 1992 1993 1994 1995 1996 1997 1998 Years
Indices
All agri. Com. Manufactured products (MUV index) Terms of Trade

(f) Unstable and uncertain (f) Unstable and uncertain input and output pricesinput and output prices
Year-to-year and price variations high, with adverse effects Year-to-year and price variations high, with adverse effects on farmer incomes. on farmer incomes.
variation largely explained by lack of storage facilities and variation largely explained by lack of storage facilities and absence of public sector price-stabilization measures such, absence of public sector price-stabilization measures such, e.g. consumption credits and price support.e.g. consumption credits and price support.
No mechanism put in place to ensure minimum farm gate No mechanism put in place to ensure minimum farm gate prices after SAPprices after SAP
agricultural demand rigid; prices are unstable agricultural demand rigid; prices are unstable small change small change in the supplied quantity results in large differences in price. in the supplied quantity results in large differences in price.
“ “Smallholders ... much more vulnerable to global price Smallholders ... much more vulnerable to global price volatility volatility
poor targeting and programme or project aid food aid poor targeting and programme or project aid food aid increases supply faster than demand increases supply faster than demand downward pressure downward pressure on priceson prices
vicious circle of vicious circle of low incomelow income--low purchasing low purchasing power of inputs power of inputs andand low input applicationlow input application--low output-low incomelow output-low income needs to be needs to be broken. broken.

(g) Declining trend in (g) Declining trend in public support to public support to agricultureagriculture agriculture given a relatively low agriculture given a relatively low
importance on the political agenda of importance on the political agenda of most SSA countriesmost SSA countries
Evidence from case studies, 1990- Evidence from case studies, 1990- 2001 2001 budgetary allocation low and budgetary allocation low and declined from ca 5 percent in 1990/91 declined from ca 5 percent in 1990/91 to 3.5 percent in 2001/02to 3.5 percent in 2001/02
Highest proportional decline in Malawi Highest proportional decline in Malawi from around 7% to only 4.2% from around 7% to only 4.2%
((h) Decline in official foreign h) Decline in official foreign aid for agricultural aid for agricultural developmentdevelopment Decline in domestic public expenditure coupled by Decline in domestic public expenditure coupled by
decrease in foreign development assistance and decrease in foreign development assistance and private sector investment in agr.private sector investment in agr.
Globally OECD development aid in agriculture, Globally OECD development aid in agriculture, rural development first increased from US$1 rural development first increased from US$1 billion in 1960 to more than US$30 billion in 1991, billion in 1960 to more than US$30 billion in 1991, but decreased to less than US$20 billion in 2000.but decreased to less than US$20 billion in 2000.
Aid to agr US$4.8 billion in 1989; slightly above Aid to agr US$4.8 billion in 1989; slightly above US$2.5 billion after 1997 US$2.5 billion after 1997 insignificant vis-a-vis. insignificant vis-a-vis. US$240 billion budget for CAADPUS$240 billion budget for CAADP
Asian tsunami showed public opinion in developed Asian tsunami showed public opinion in developed countries much more easily mobilized for countries much more easily mobilized for emergency aid through spectacular media reportsemergency aid through spectacular media reports

SUCCESS STORIES SUCCESS STORIES WITHIN AND OUTSIDE WITHIN AND OUTSIDE
AFRICAAFRICA AfricaAfrica::
– Tea in Kenya;Tea in Kenya;produces about 16 percent of the world's black teaproduces about 16 percent of the world's black tea
ranks second after Sri Lanka in tea exports, and third ranks second after Sri Lanka in tea exports, and third after India and Sri Lanka in production.after India and Sri Lanka in production.
smallholder sector accounted 62% in 2000 smallholder sector accounted 62% in 2000 – Rice in Mali and GuineaRice in Mali and Guinea– Cassava in Central and West AfricaCassava in Central and West Africa
Common Factors to Success:Common Factors to Success:Direct Public Sector SupportDirect Public Sector SupportConducive macroeconomic environmentConducive macroeconomic environmentPeace and stabilityPeace and stability

Success outside AfricaSuccess outside Africa
VietnamVietnam: : a significant exporter of coffee, rice, tea, cashew nuts and forestry a significant exporter of coffee, rice, tea, cashew nuts and forestry
products, generating US$2.8 billion of export earnings. products, generating US$2.8 billion of export earnings. Food production increased by 1.3 million tonnes annuallyFood production increased by 1.3 million tonnes annually Diversification from food into industrial productsDiversification from food into industrial products India: India: Food-grain production increased from 50.8 million tonnes in 1950 to Food-grain production increased from 50.8 million tonnes in 1950 to
176.3 million tonnes in 1990 and 206 million tonnes at the turn of 176.3 million tonnes in 1990 and 206 million tonnes at the turn of the Century.the Century.
Self-sufficient with substantial reserve and exporting appreciable Self-sufficient with substantial reserve and exporting appreciable quantities of wheat and rice. quantities of wheat and rice.
Reasons for SuccessReasons for Success Improving the functioning of agricultural markets, through the Improving the functioning of agricultural markets, through the
stabilization of agricultural prices;stabilization of agricultural prices; Public investment on research, infrastructure, water control and Public investment on research, infrastructure, water control and
extension servicesextension services Economic incentives to facilitate increase in agricultural labour Economic incentives to facilitate increase in agricultural labour
productivityproductivity

Is support to Is support to agriculture a profitable agriculture a profitable investment?investment? Answer is yes; Answer is yes; E.g. Malawi 2002-2003 - total cost of E.g. Malawi 2002-2003 - total cost of importing cereals (aid and commercial importing cereals (aid and commercial imports), amounted to 788 539 tonnes imports), amounted to 788 539 tonnes at MK 15.6 billionat MK 15.6 billion If the money was invested in domestic If the money was invested in domestic production, then the net production gain production, then the net production gain would have ranged between would have ranged between 2,489,2762,489,276 and and 4,200,9924,200,992

ConclusionConclusion
““food insecurity in Africa can be food insecurity in Africa can be explained by the fact that some explained by the fact that some decision-makers believe that decision-makers believe that there will always be ‘cold’ money there will always be ‘cold’ money available in case of food available in case of food emergency, and that it is better emergency, and that it is better to invest their ‘hot’ money into to invest their ‘hot’ money into other activities”. other activities”. Prime Minister Prime Minister of Ugandaof Uganda