agilent technologies fish species identification system · agilent technologies fish species...
TRANSCRIPT
Agilent Technologies
Fish Species
Identification System
AOAC Annual Meeting
Exhibitor Presentation
Scott Happe, Ph.D.
Senior Research Scientist
Stratagene Products Division
September 15, 20091
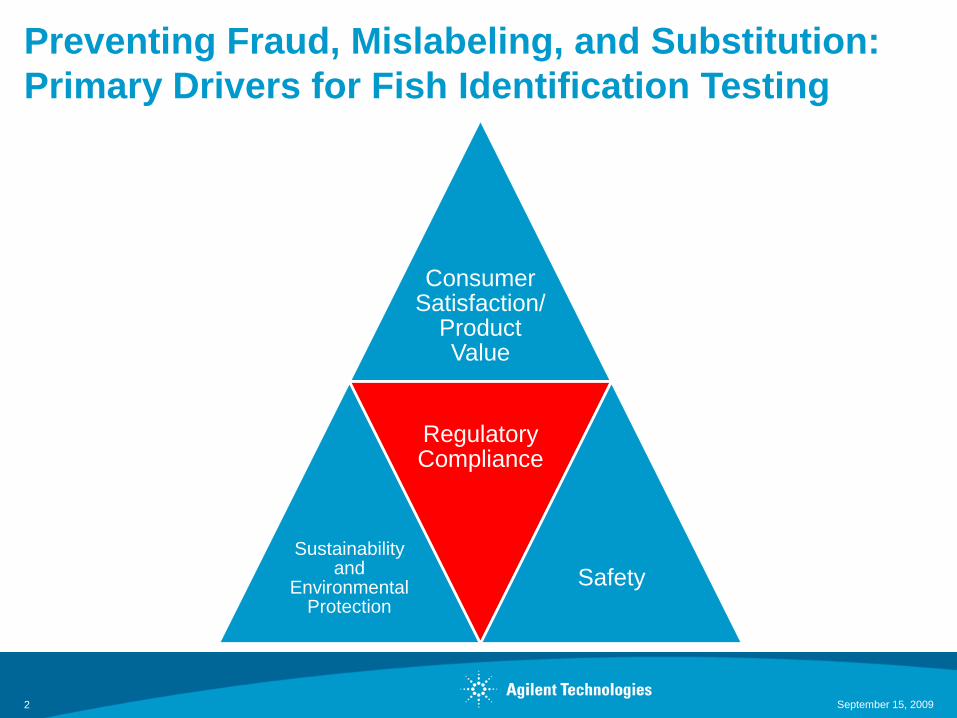
Preventing Fraud, Mislabeling, and Substitution:
Primary Drivers for Fish Identification Testing
September 15, 20092
Consumer Satisfaction/
Product Value
Sustainability and
Environmental Protection
Regulatory Compliance
Safety
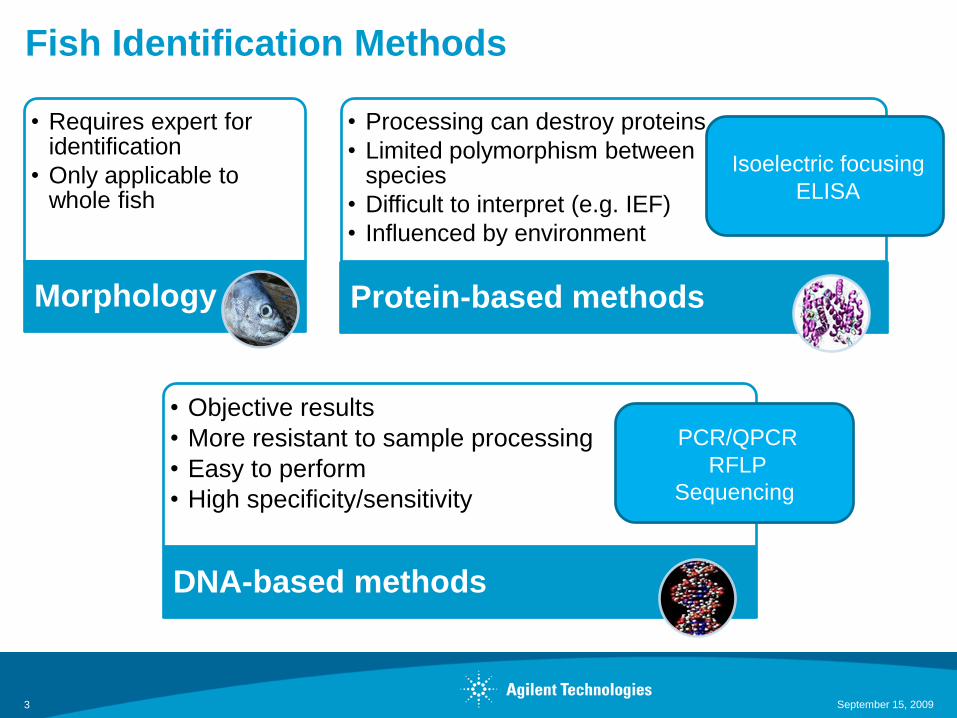
Fish Identification Methods
• Requires expert for identification
• Only applicable to whole fish
Morphology
• Processing can destroy proteins
• Limited polymorphism betweenspecies
• Difficult to interpret (e.g. IEF)
• Influenced by environment
Protein-based methods
• Objective results
• More resistant to sample processing
• Easy to perform
• High specificity/sensitivity
DNA-based methods
Isoelectric focusing
ELISA
PCR/QPCR
RFLP
Sequencing
September 15, 20093
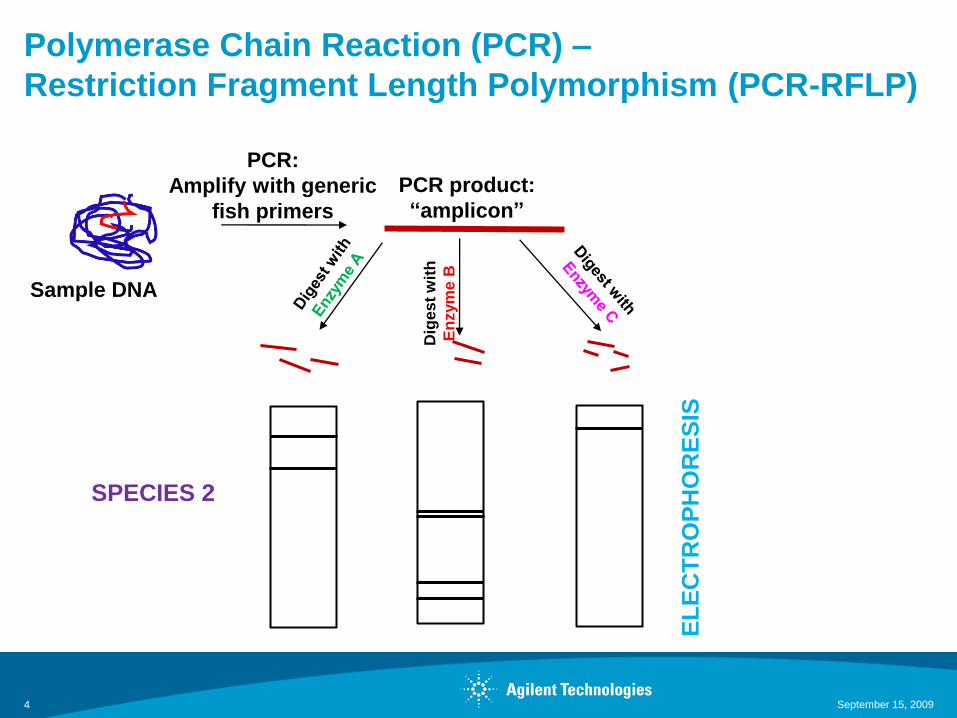
SPECIES 1
Polymerase Chain Reaction (PCR) –
Restriction Fragment Length Polymorphism (PCR-RFLP)
Dig
es
t w
ith
En
zym
e B
SPECIES 2
EL
EC
TR
OP
HO
RE
SIS
PCR:
Amplify with generic
fish primers
Sample DNA
PCR product:
“amplicon”
September 15, 20094
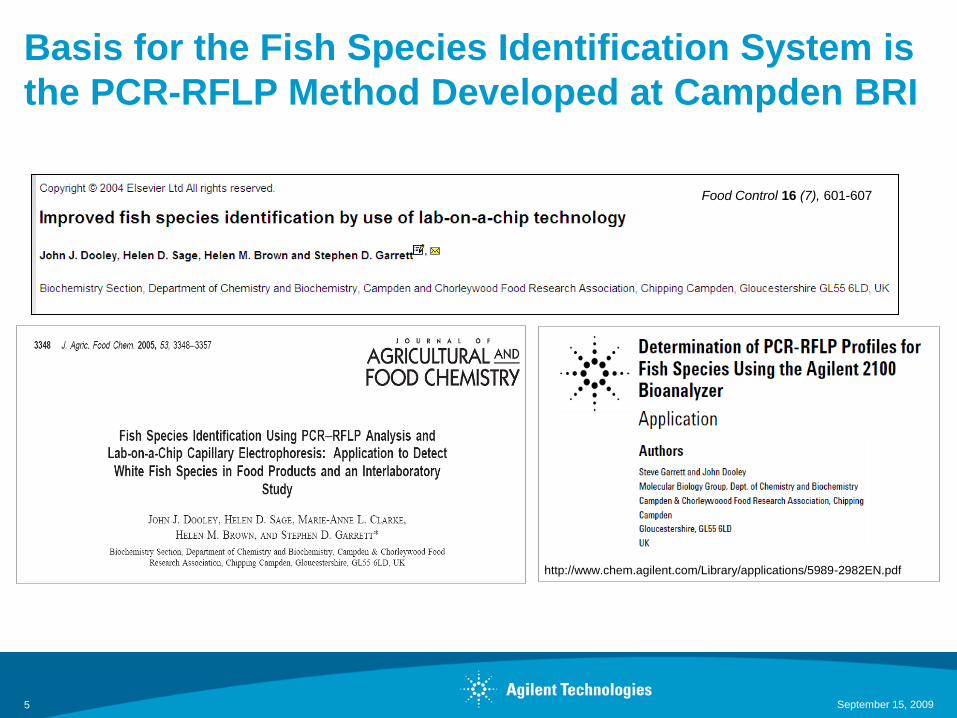
Basis for the Fish Species Identification System is
the PCR-RFLP Method Developed at Campden BRI
September 15, 20095
Food Control 16 (7), 601-607
http://www.chem.agilent.com/Library/applications/5989-2982EN.pdf
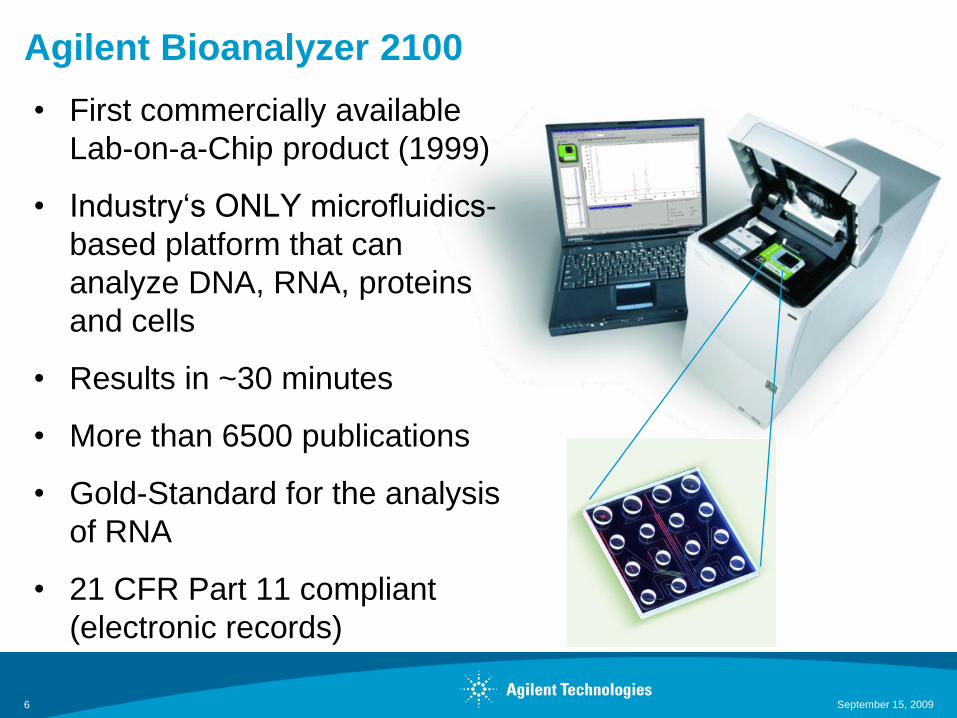
Agilent Bioanalyzer 2100
September 15, 20096
• First commercially available
Lab-on-a-Chip product (1999)
• Industry‘s ONLY microfluidics-
based platform that can
analyze DNA, RNA, proteins
and cells
• Results in ~30 minutes
• More than 6500 publications
• Gold-Standard for the analysis
of RNA
• 21 CFR Part 11 compliant
(electronic records)
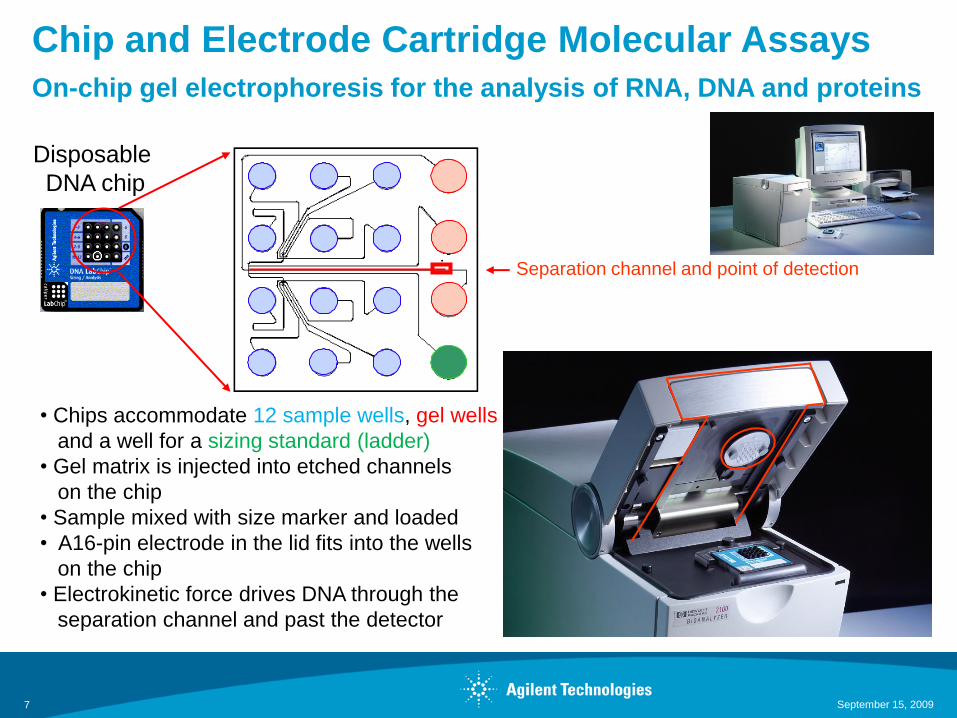
Chip and Electrode Cartridge Molecular Assays
On-chip gel electrophoresis for the analysis of RNA, DNA and proteins
• Chips accommodate 12 sample wells, gel wells
and a well for a sizing standard (ladder)
• Gel matrix is injected into etched channels
on the chip
• Sample mixed with size marker and loaded
• A16-pin electrode in the lid fits into the wells
on the chip
• Electrokinetic force drives DNA through the
separation channel and past the detector
Gel wells
Ladder wellSeparation channel and point of detection
7 September 15, 2009
Disposable
DNA chip
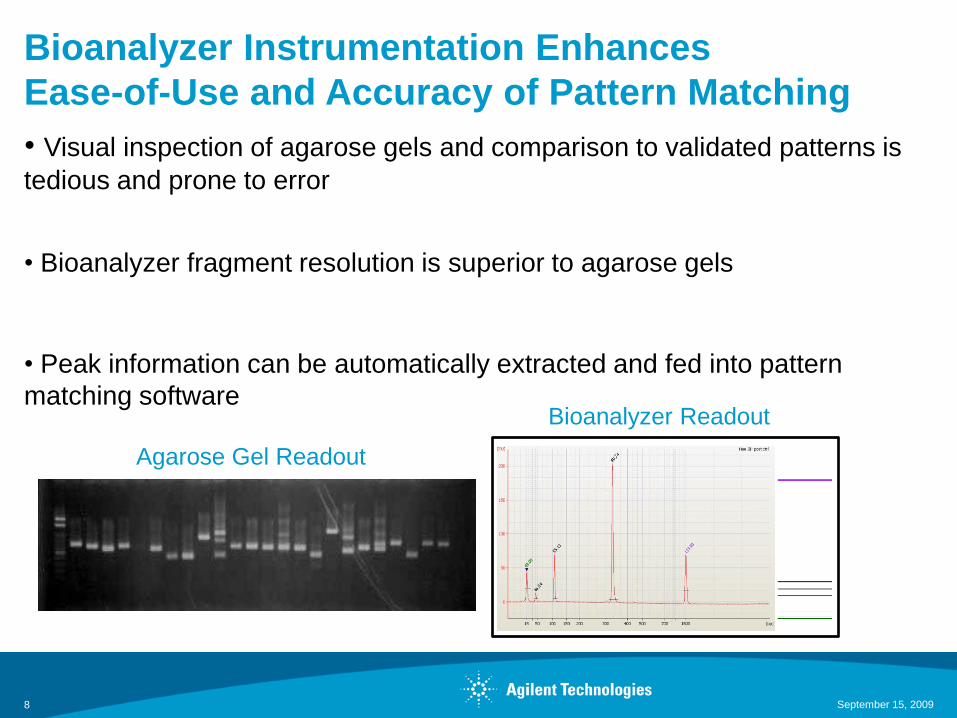
Bioanalyzer Instrumentation Enhances
Ease-of-Use and Accuracy of Pattern Matching
• Visual inspection of agarose gels and comparison to validated patterns is
tedious and prone to error
• Bioanalyzer fragment resolution is superior to agarose gels
• Peak information can be automatically extracted and fed into pattern
matching software
September 15, 20098
Agarose Gel Readout
Bioanalyzer Readout
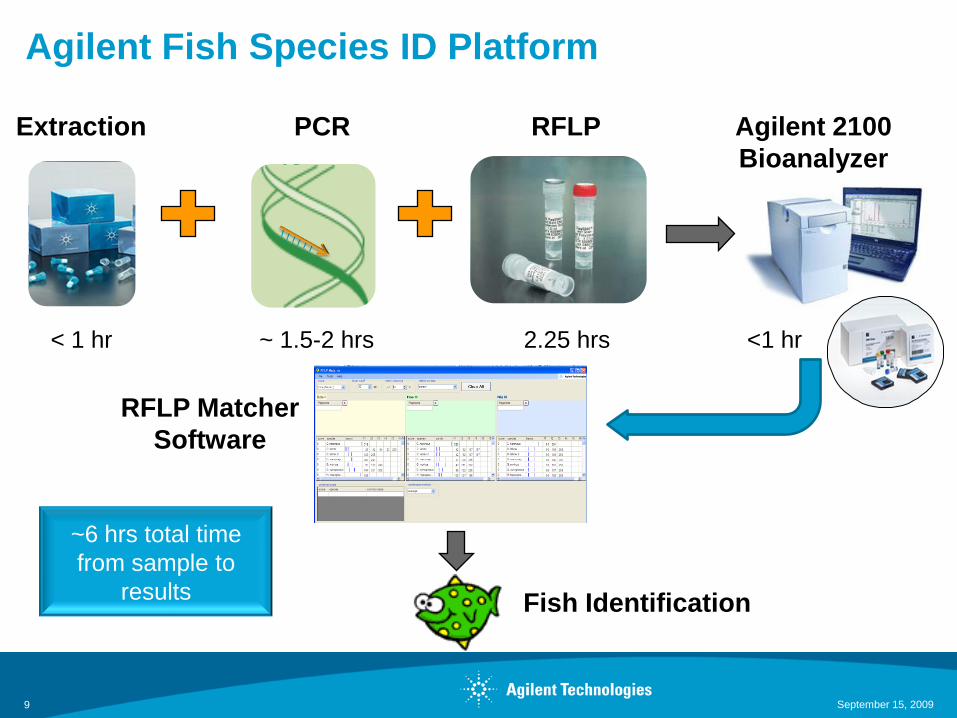
Extraction PCR RFLP
Fish Identification
Agilent Fish Species ID Platform
Agilent 2100
Bioanalyzer
RFLP Matcher
Software
September 15, 20099
~6 hrs total time
from sample to
results
< 1 hr ~ 1.5-2 hrs 2.25 hrs <1 hr
1. Measure 40 mg – 1 g tissue
(fresh, frozen, or processed)
Homogenization optional
2. Digest with Proteinase K Digestion Buffer
Incubate at 65oC for 10 min
3. Capture DNA onto glass-fiber spin column
4. Wash with High Salt Buffer (1X)
Wash with 80% Ethanol (3X)
5. Elute DNA
100 µl of Elution Buffer
Step 1: Extraction of DNA from Fish Tissue Using the
Fish Species Identification System
< 1 hr from
tissue to DNA
Page 10
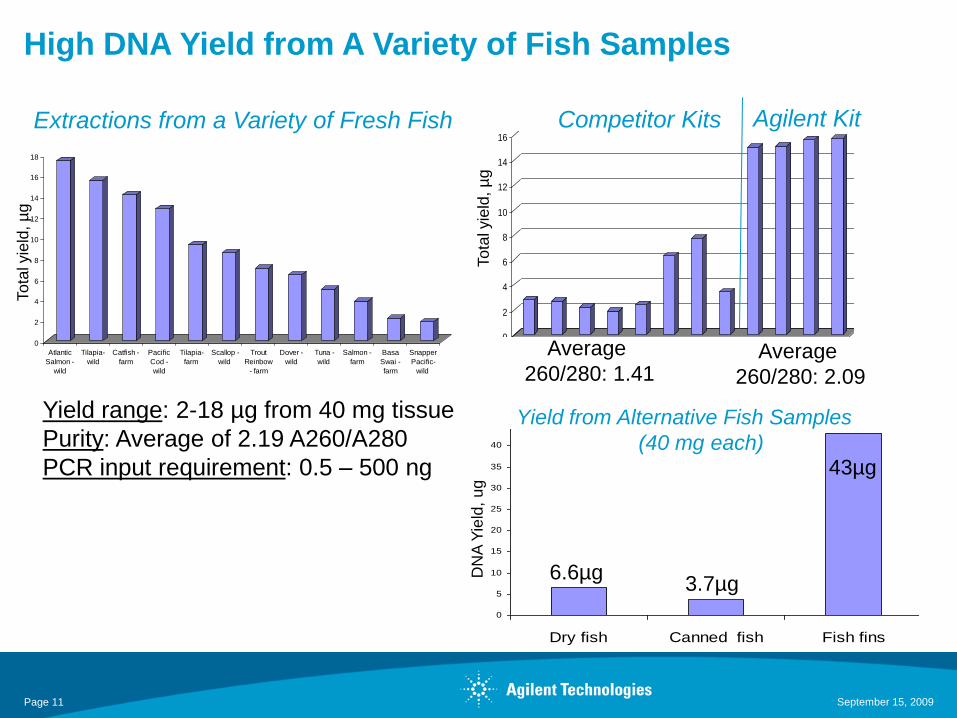
High DNA Yield from A Variety of Fish Samples
Page 11
0
2
4
6
8
10
12
14
16
18
Atlantic
Salmon -
wild
Tilapia-
wild
Catfish -
farm
Pacific
Cod -
wild
Tilapia-
farm
Scallop -
wild
Trout
Reinbow
- farm
Dover -
wild
Tuna -
wild
Salmon -
farm
Basa
Swai -
farm
Snapper
Pacific-
wild
Yield range: 2-18 µg from 40 mg tissue
Purity: Average of 2.19 A260/A280
PCR input requirement: 0.5 – 500 ngTo
tal yie
ld, µ
g
To
tal yie
ld, µ
g
0
2
4
6
8
10
12
14
16
1 2 3 4 5 6 7 8 9 10 11 12
Competitor Kits Agilent Kit
Average
260/280: 1.41Average
260/280: 2.09
September 15, 2009
Extractions from a Variety of Fresh Fish
0
5
10
15
20
25
30
35
40
45
50
Dry fish Canned fish Fish fins
Yield from Alternative Fish Samples
(40 mg each)
DN
A Y
ield
, u
g
6.6µg3.7µg
43µg
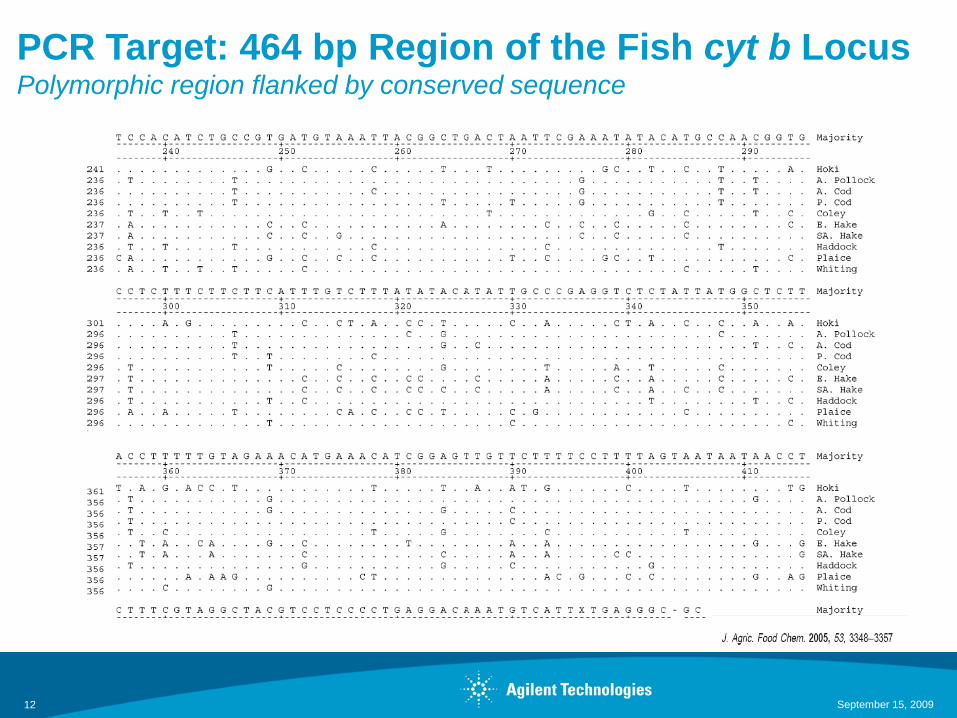
PCR Target: 464 bp Region of the Fish cyt b LocusPolymorphic region flanked by conserved sequence
September 15, 200912
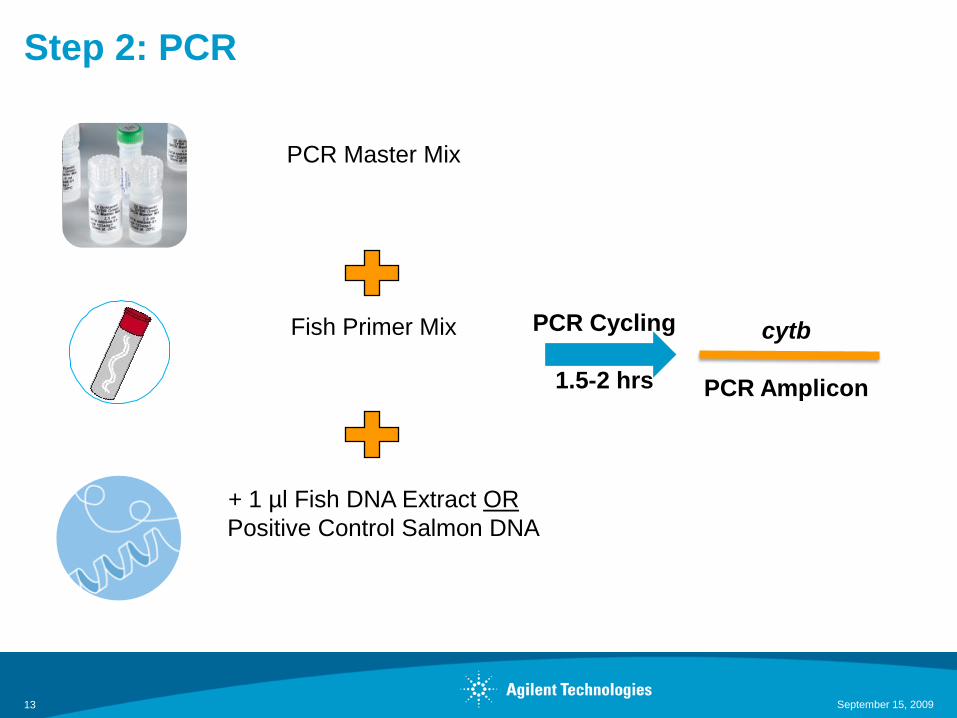
Step 2: PCR
cytb
PCR Amplicon
PCR Master Mix
Fish Primer Mix
+ 1 µl Fish DNA Extract OR
Positive Control Salmon DNA
PCR Cycling
1.5-2 hrs
September 15, 200913
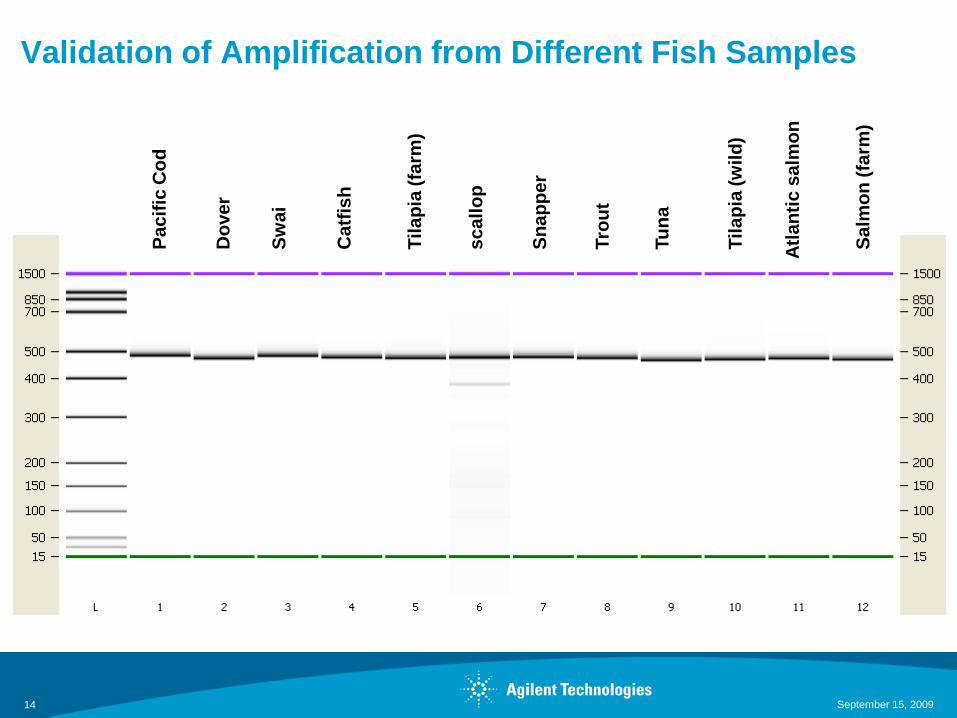
Pa
cif
ic C
od
Do
ve
r
Til
ap
ia (
farm
)
sc
all
op
Sn
ap
pe
r
Tro
ut
Tu
na
Atl
an
tic
sa
lmo
n
Sw
ai
Ca
tfis
h
Sa
lmo
n (
farm
)
Til
ap
ia (
wild
)
Validation of Amplification from Different Fish Samples
September 15, 200914
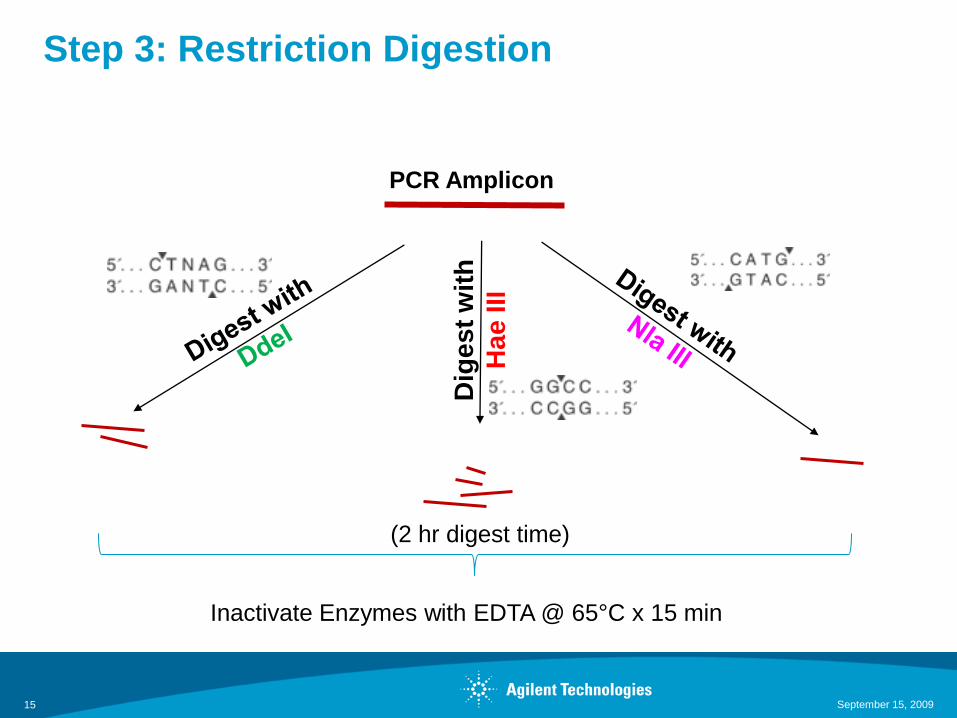
Step 3: Restriction Digestion
Dig
es
t w
ith
Ha
eIII
PCR Amplicon
September 15, 200915
Inactivate Enzymes with EDTA @ 65°C x 15 min
(2 hr digest time)
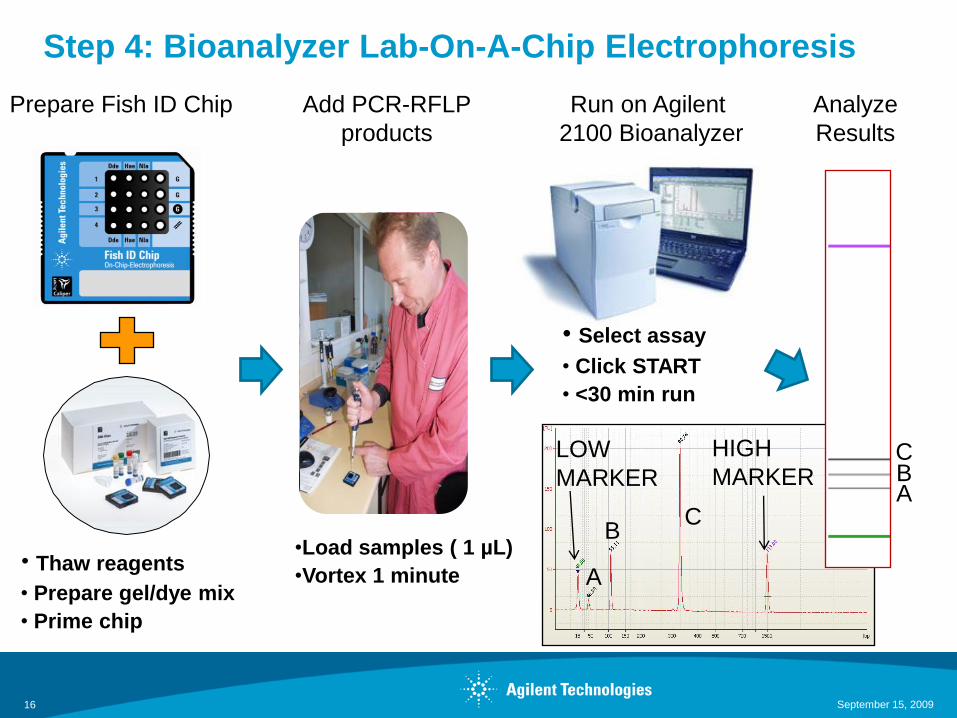
Step 4: Bioanalyzer Lab-On-A-Chip Electrophoresis
LOW
MARKER
HIGH
MARKERABC
A
BC
September 15, 200916
Prepare Fish ID Chip Add PCR-RFLP
products
Run on Agilent
2100 Bioanalyzer
Analyze
Results
• Thaw reagents
• Prepare gel/dye mix
• Prime chip
• Select assay
• Click START
• <30 min run
•Load samples ( 1 µL)
•Vortex 1 minute
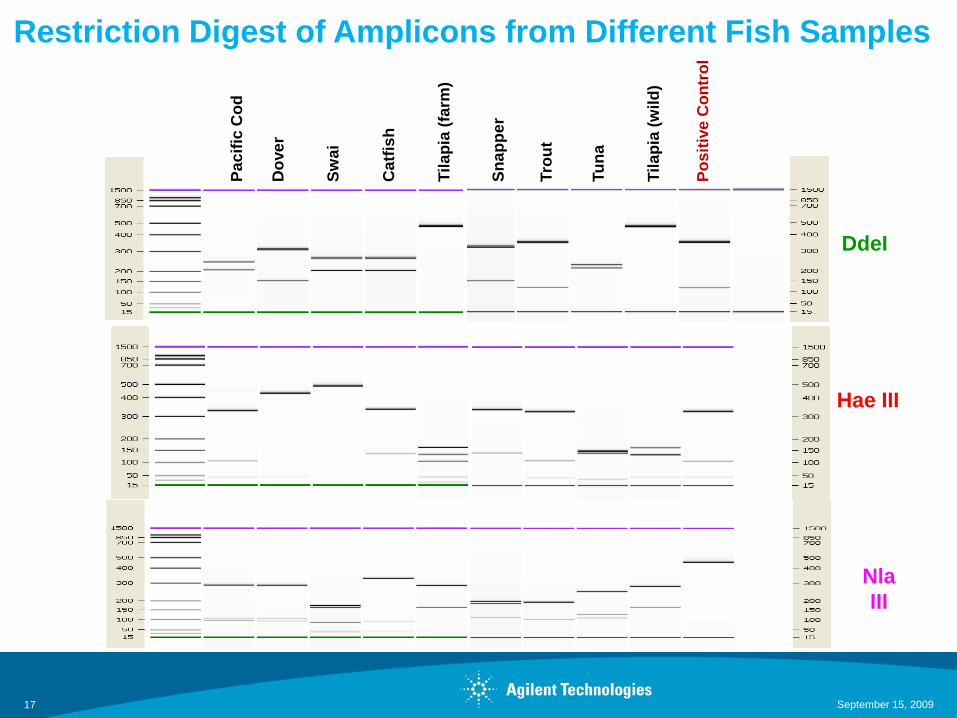
Restriction Digest of Amplicons from Different Fish Samples
Pa
cif
ic C
od
Do
ve
r
Til
ap
ia (
farm
)
Sn
ap
pe
r
Tro
ut
Tu
na
Po
sit
ive
Co
ntr
ol
Sw
ai
Catf
ish
Til
ap
ia (
wil
d)
DdeI
Hae III
Nla
III
September 15, 200917
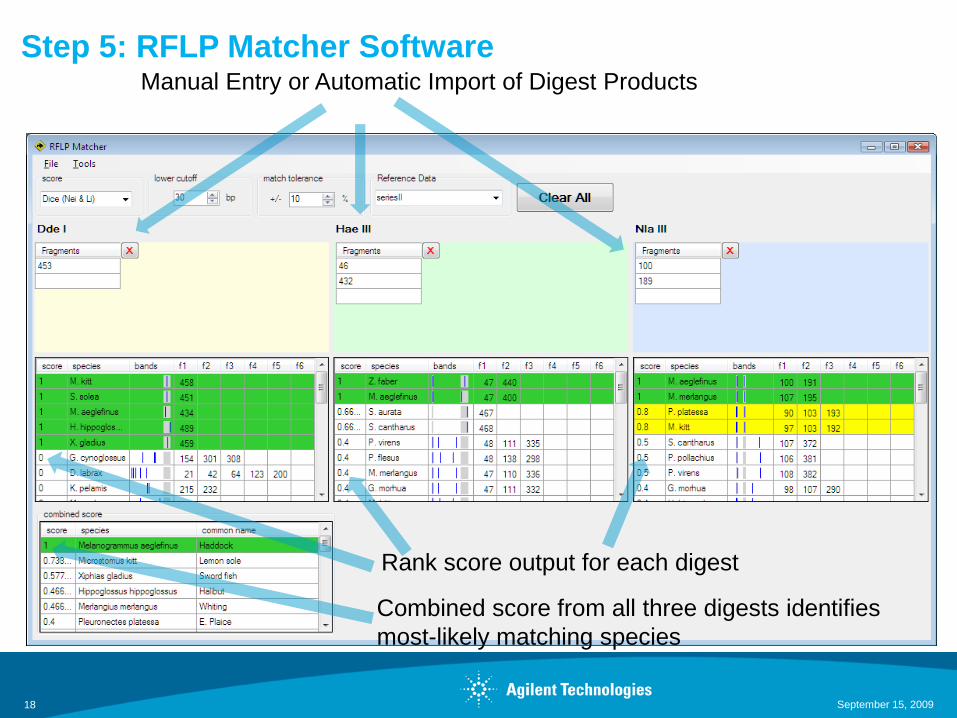
September 15, 200918
Manual Entry or Automatic Import of Digest Products
Step 5: RFLP Matcher Software
Rank score output for each digest
Combined score from all three digests identifies
most-likely matching species
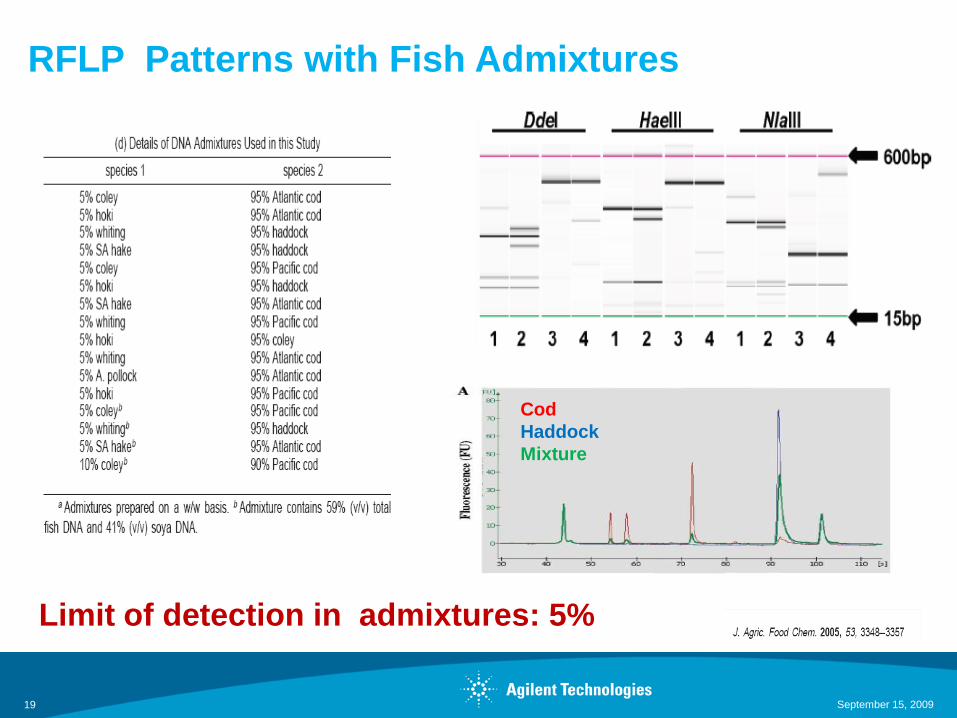
RFLP Patterns with Fish Admixtures
Limit of detection in admixtures: 5%
19 September 15, 2009
Cod
Haddock
Mixture
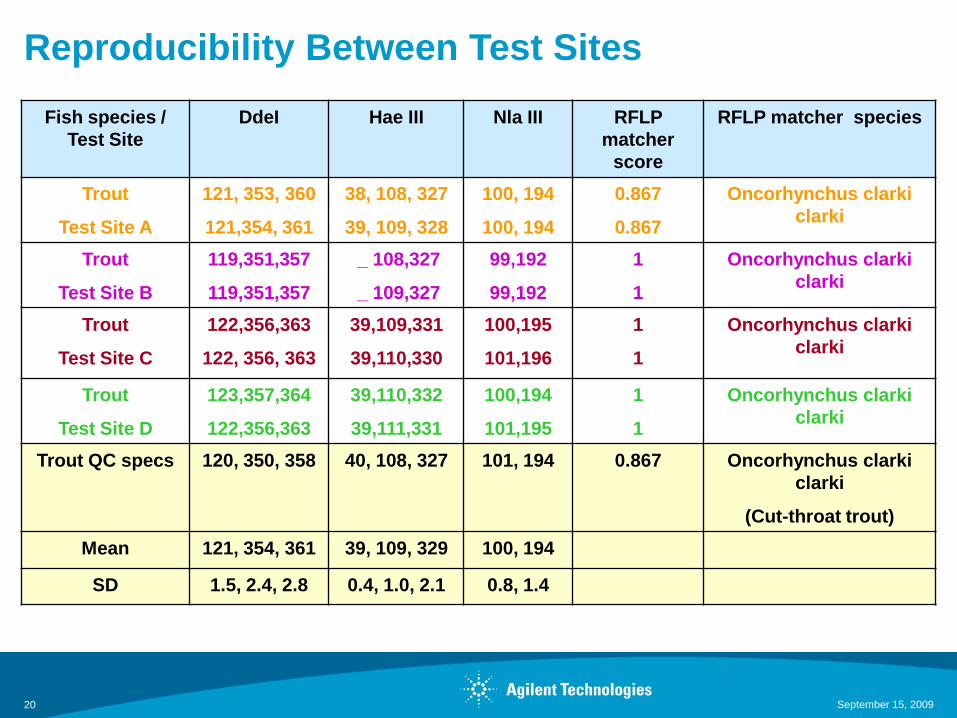
Reproducibility Between Test Sites
September 15, 200920
Fish species /
Test Site
DdeI Hae III Nla III RFLP
matcher
score
RFLP matcher species
Trout
Test Site A
121, 353, 360
121,354, 361
38, 108, 327
39, 109, 328
100, 194
100, 194
0.867
0.867
Oncorhynchus clarki
clarki
Trout
Test Site B
119,351,357
119,351,357
_ 108,327
_ 109,327
99,192
99,192
1
1
Oncorhynchus clarki
clarki
Trout
Test Site C
122,356,363
122, 356, 363
39,109,331
39,110,330
100,195
101,196
1
1
Oncorhynchus clarki
clarki
Trout
Test Site D
123,357,364
122,356,363
39,110,332
39,111,331
100,194
101,195
1
1
Oncorhynchus clarki
clarki
Trout QC specs 120, 350, 358 40, 108, 327 101, 194 0.867 Oncorhynchus clarki
clarki
(Cut-throat trout)
Mean 121, 354, 361 39, 109, 329 100, 194
SD 1.5, 2.4, 2.8 0.4, 1.0, 2.1 0.8, 1.4
• Expanding authenticated profiles database (in conjunction with Steve
Garrett’s lab at Campden BRI): ~50 authenticated (gadoids, salmonids, flatfish) +
100s of theoretical
• Beta-testing of the Agilent Fish Species Identification System is underway
with a major European seafood products manufacturer
• Quick adoption by staff new to DNA testing
• Expected commercial availability of the Agilent Fish Species Identification
Kit is early 2010, shortly following the adoption of stricter import certification
requirements in the EU
September 15, 200921
Agilent’s Fish Species Identification System:Current Activities and Future Outlook
September 15, 200922
Acknowledgements
Agilent Stratagene Products Division
Harini Ravi
Natalia Novorodovskaya
Scott Basehore
Jeff Braman
Rachel Formosa
Ronda Allen
Rajesh Bagga
Derek Hall
Sarah Jandle
Agilent Genomics Division
Robert Kincaid
Mary McBride
Agilent Europe
Nigel Skinner
Juergen Schneider
Stephen Mueller
Martin Kratzmeier
Campden BRI
Steve Garrett
For more information contact:
Rachel Formosa ([email protected])
Scott Happe ([email protected])
September 15, 200923
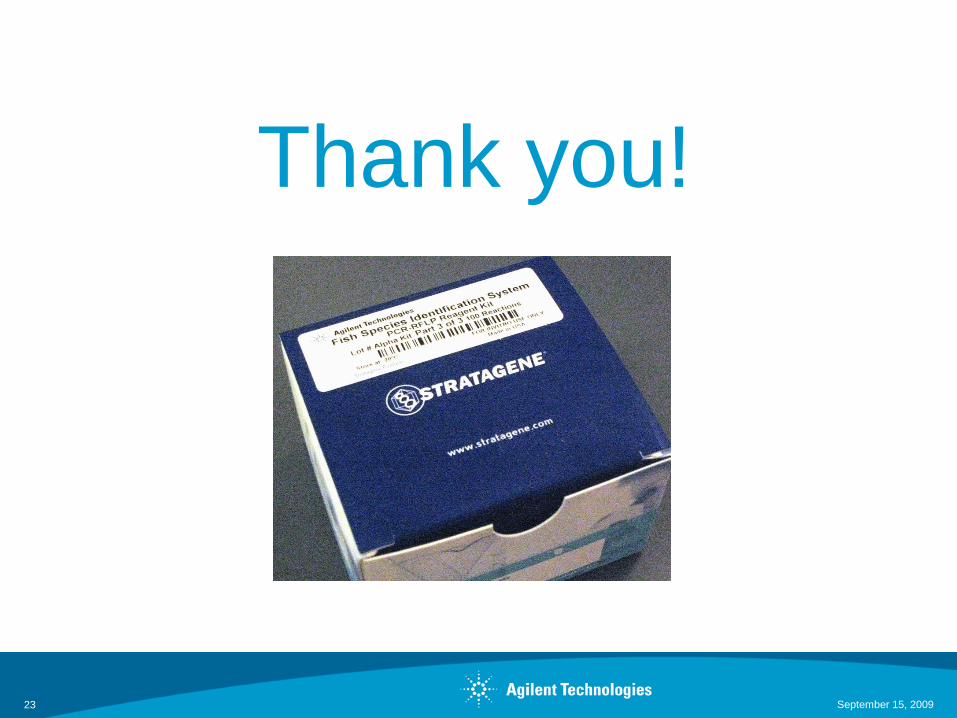
Thank you!