agenda - teska associates, inc. | building community ... · agenda • introductions ... •...
TRANSCRIPT
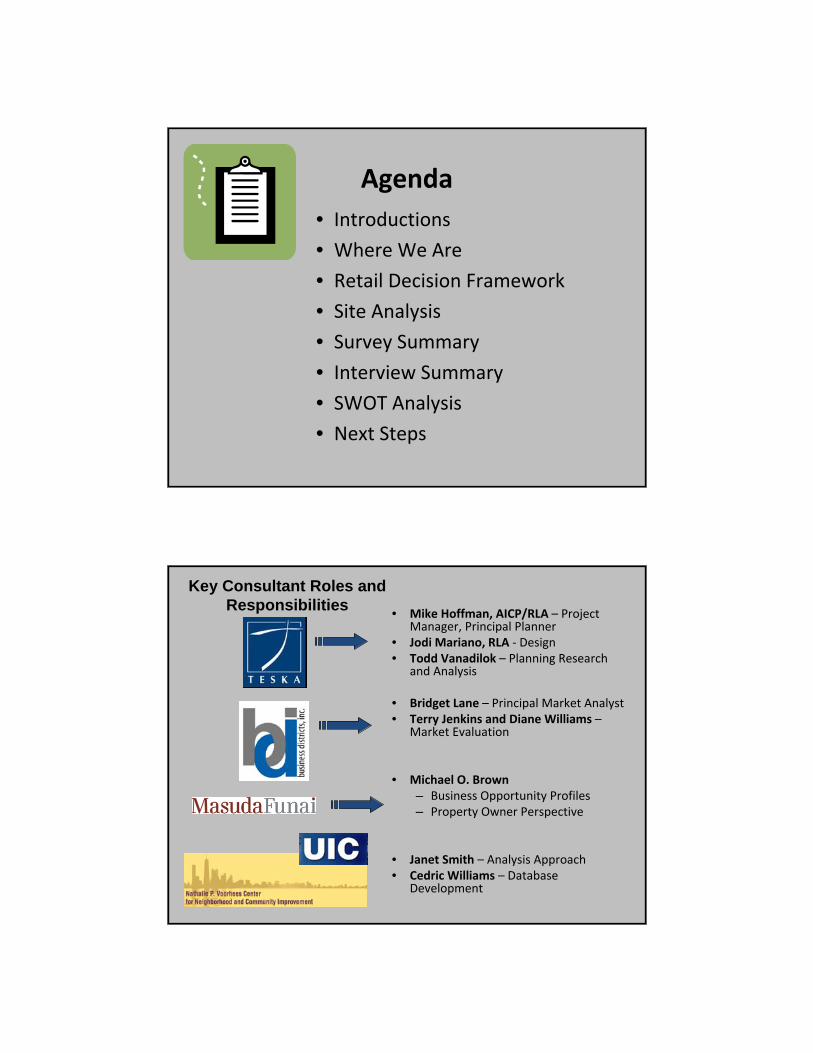
Agenda• Introductions
• Where We Are
• Retail Decision Framework
• Site Analysis
• Survey Summary
• Interview Summary
• SWOT Analysis
• Next Steps
Key Consultant Roles and Responsibilities • Mike Hoffman, AICP/RLA – Project
Manager, Principal Planner• Jodi Mariano, RLA ‐ Design• Todd Vanadilok – Planning Research
and Analysis
• Bridget Lane – Principal Market Analyst• Terry Jenkins and Diane Williams –
Market Evaluation
• Michael O. Brown– Business Opportunity Profiles– Property Owner Perspective
• Janet Smith – Analysis Approach• Cedric Williams – Database
Development
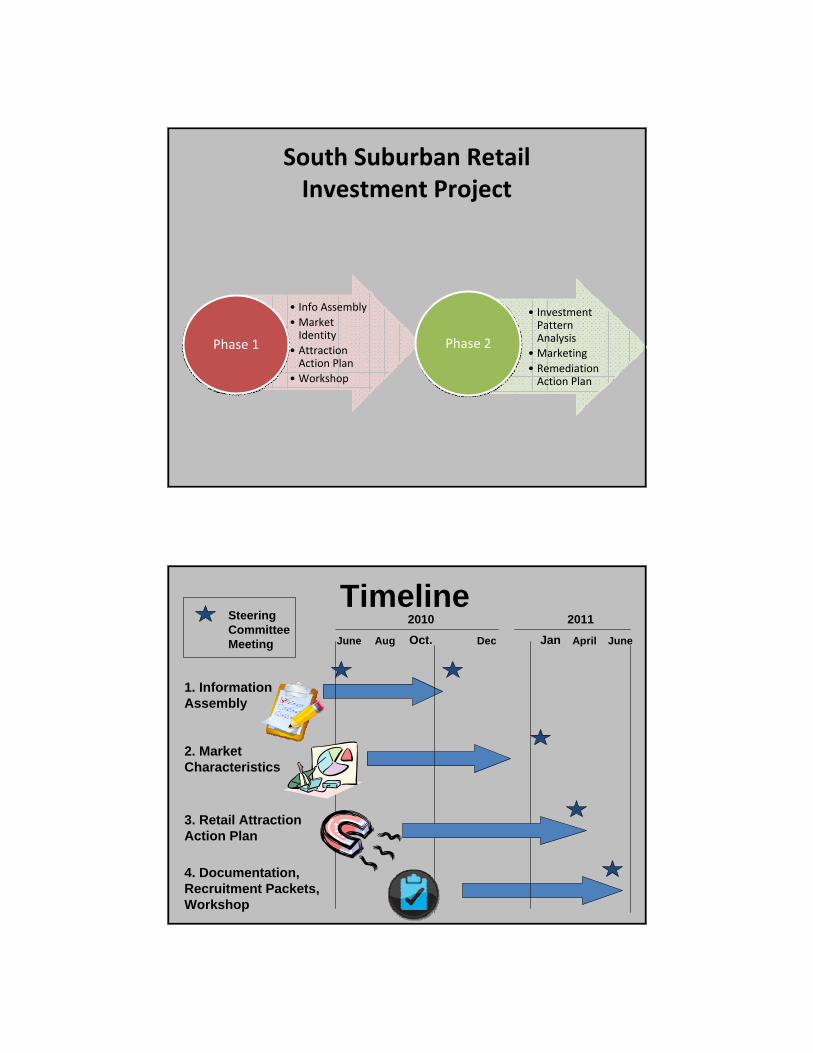
South Suburban RetailInvestment Project
• Info Assembly• Market Identity
• Attraction Action Plan
• Workshop
Phase 1Phase 1
• Investment Pattern Analysis
• Marketing• Remediation Action Plan
Phase 2Phase 2
June Aug Oct. Dec Jan April June
1. Information Assembly
2. Market Characteristics
3. Retail Attraction Action Plan
4. Documentation, Recruitment Packets, Workshop
Timeline2010 2011Steering
Committee Meeting
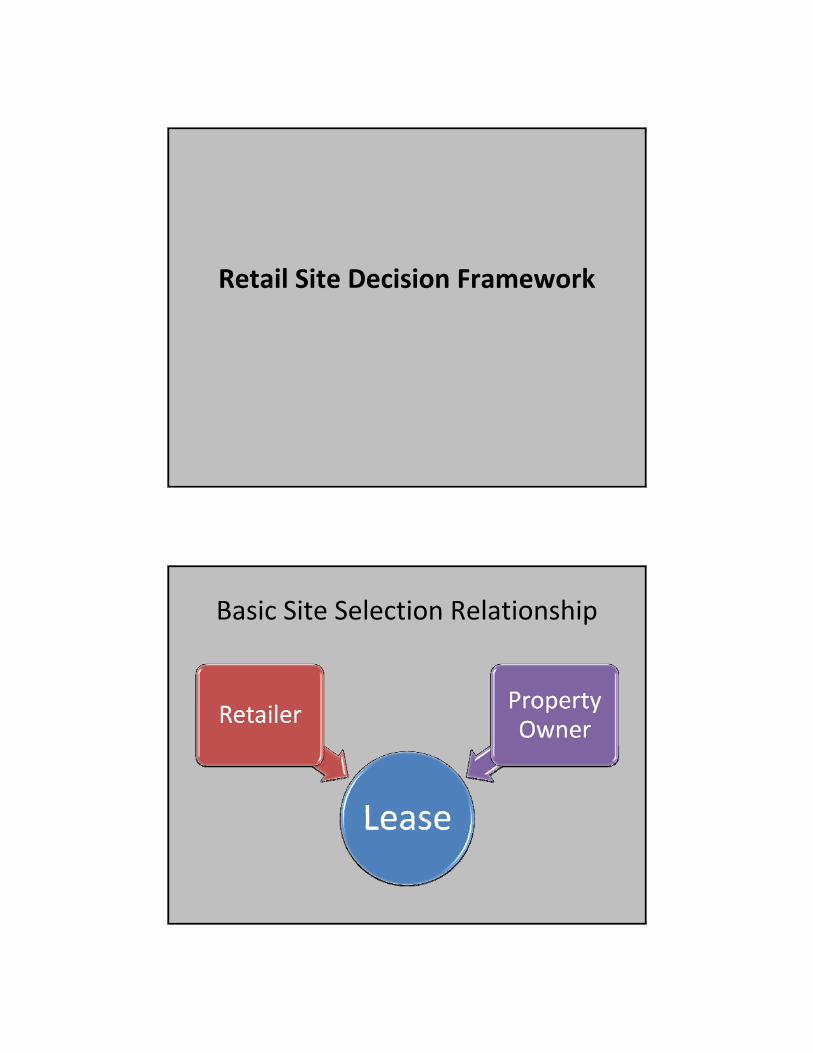
Retail Site Decision Framework
Basic Site Selection Relationship
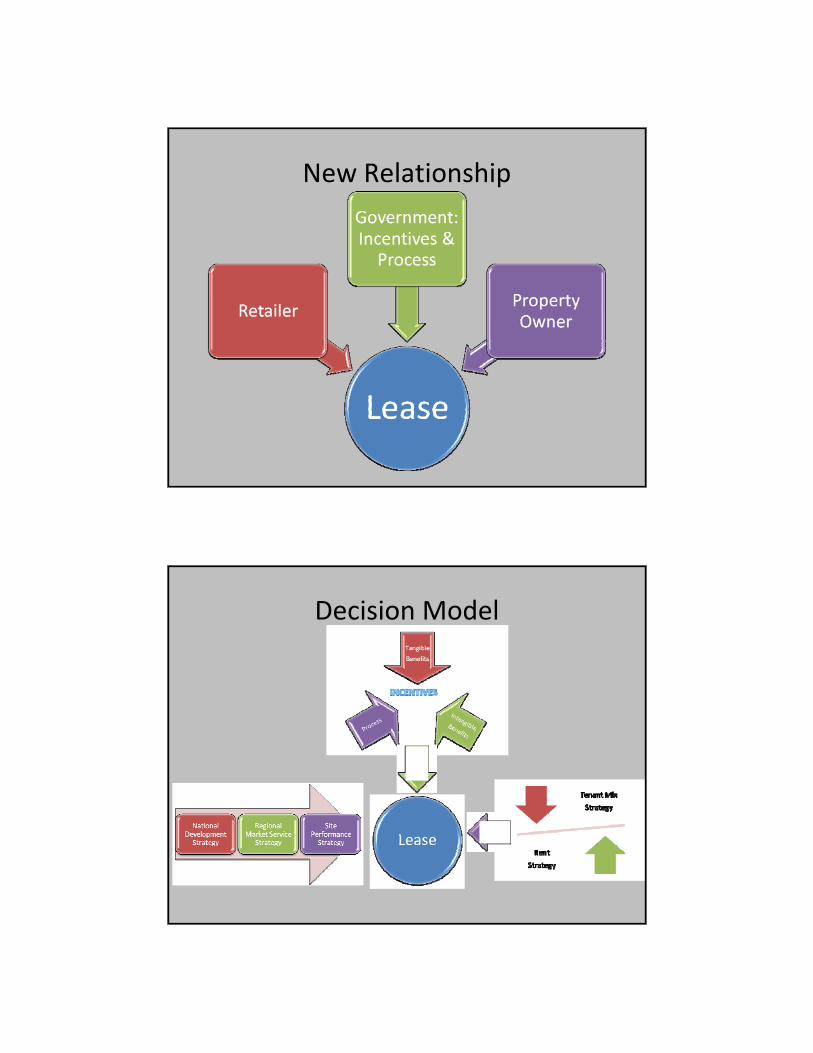
New Relationship
Decision Model

Motivation
• Retailer– Sales – Expenses = Profit– Intangibles: image + gut feel
• Property Owner– Rents – Expenses‐ debt service = Profit– Intangible: image
• Government– Tangible Benefits = Taxes & Jobs– Intangible Benefits = satisfied residents + image– Process completion
Interviews• 12 of 24 property owners completed
• Summary– Difficult economy
– Taxes, taxes, taxes
– Vacancies are causing “hyper”competition
– Retailer interest exists
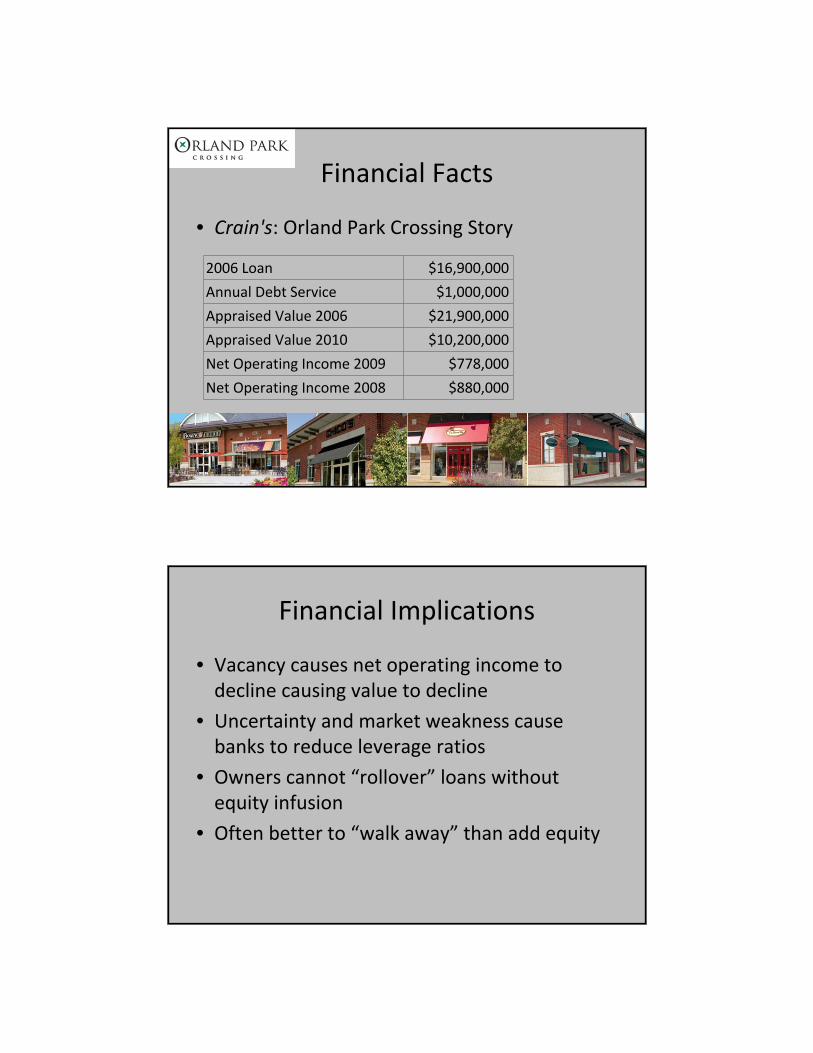
Financial Facts
• Crain's: Orland Park Crossing Story
2006 Loan $16,900,000
Annual Debt Service $1,000,000
Appraised Value 2006 $21,900,000
Appraised Value 2010 $10,200,000
Net Operating Income 2009 $778,000
Net Operating Income 2008 $880,000
Financial Implications
• Vacancy causes net operating income to decline causing value to decline
• Uncertainty and market weakness cause banks to reduce leverage ratios
• Owners cannot “rollover” loans without equity infusion
• Often better to “walk away” than add equity

Property Tax Facts – McDonald’s Tax Comparison
Address Community2009 Taxes
Land SQFT
Taxes/ Land SQFT
2707 Sauk Trail Sauk Village $36,276 38,263 $0.95
1032 N Northwest Hwy Park Ridge $60,913 48,542 $1.25
100 Sauk Trail Rd South Chicago Heights $45,609 30,000 $1.52
9110 W. 159th St Orland Park $67,647 43,244 $1.56
4830 Dempster Skokie $68,921 35,643 $1.93
100 West Rand Road Mount Prospect $65,702 33,850 $1.94
5441 West 159th Street Oak Forest $75,956 38,401 $1.98
2400 W Lincoln Hwy Olympia Fields $78,872 35,915 $2.20
3132 West 183rd Street Homewood $101,669 44,640 $2.28
4855 W Sauk Trail Richton Park $87,744 35,972 $2.44
15920 S. Harlem Tinley Park $119,745 44,113 $2.71
4010 W. 211th St Matteson $132,677 46,625 $2.85
Source: Cookcountytreasurer.com ; Cookcountyassessor.com
Property Tax Impacts
• Assumptions:– Mc Donald's cost the same to build & operate anywhere – Owners seek the same return everywhere
• Matteson Property Tax Example– Average annual property taxes per land square foot of 20 unit sample: $1.99
– Matteson annual per square foot property taxes: $2.85– Annual property tax due to variance from average: $38,835
• Profit Equalization Strategy– 109 more transactions per day that contribute $1– Pay $500,000 less for property

Property Tax Impacts
• What if the landlord absorbs the tax differential?– Gross rent capped at $20– Taxes “float” around $10– CAM and insurance are $5– Triple net is $5– At 8% cap rate the value is $62.50– It cost about $218 to build new brick, concrete block back‐up, steel frame store
– Significant remodeling might cost $50 – Interest if 75% financed at 8% is $3.75
• This model undermines reinvestment
Vacancy
Subarea Gross SFVacancy Rate Vacant SF
N.W. Suburbs 15,874,756 13.6% 2,158,967
North Suburbs 9,908,367 8.9% 881,845
West Suburbs 7,945,280 8.9% 707,130
City North 8,131,681 6.5% 528,559
City South 6,157,829 10.8% 665,046
S.W. Suburbs 9,490,094 9.4% 892,069
South Suburbs 7,011,322 21.5% 1,507,434
TOTAL 128,578,383 11.9% 15,300,828
Source: CBRE, Chicago Retail Market View 3rd Quarter 2010
Preliminary data estimates study area vacancy rate at 20.2%.

Vacancy
15‐Minute Drive Time Population
Non‐Mall Shopping Center
SF
Non‐Mall Shopping Center
SF/Capita
Total Shopping Center
SF/capita
Woodfield 337,677 3,252,454 9.6 16.2
Oakbrook 424,613 5,805,794 13.7 18.6
Chicago Ridge 317,009 5,164,923 16.3 18.9
Orland Park 224,633 2,732,090 12.2 17.6
River Oaks 295,850 2,039,569 6.9 10.9
Spring Hill 216,642 1,937,000 8.9 15.3
Stratford Square 236,079 948,543 4.0 9.6
Randhurst 324,612 2,900,405 8.9 13.0
Lincoln Mall 271,200 3,047,248 11.2 14.9Source: 2010 Directory of Major Malls, Inc. (Malls over 200,000 square feet)
Site Analysis
• Goals– Modern configuration
– Excellent access
– Attractive appearance
– Strong co‐tenancies
– “A” quality stores

• Best
• Standards
Example 1
Example 2 - Naperville
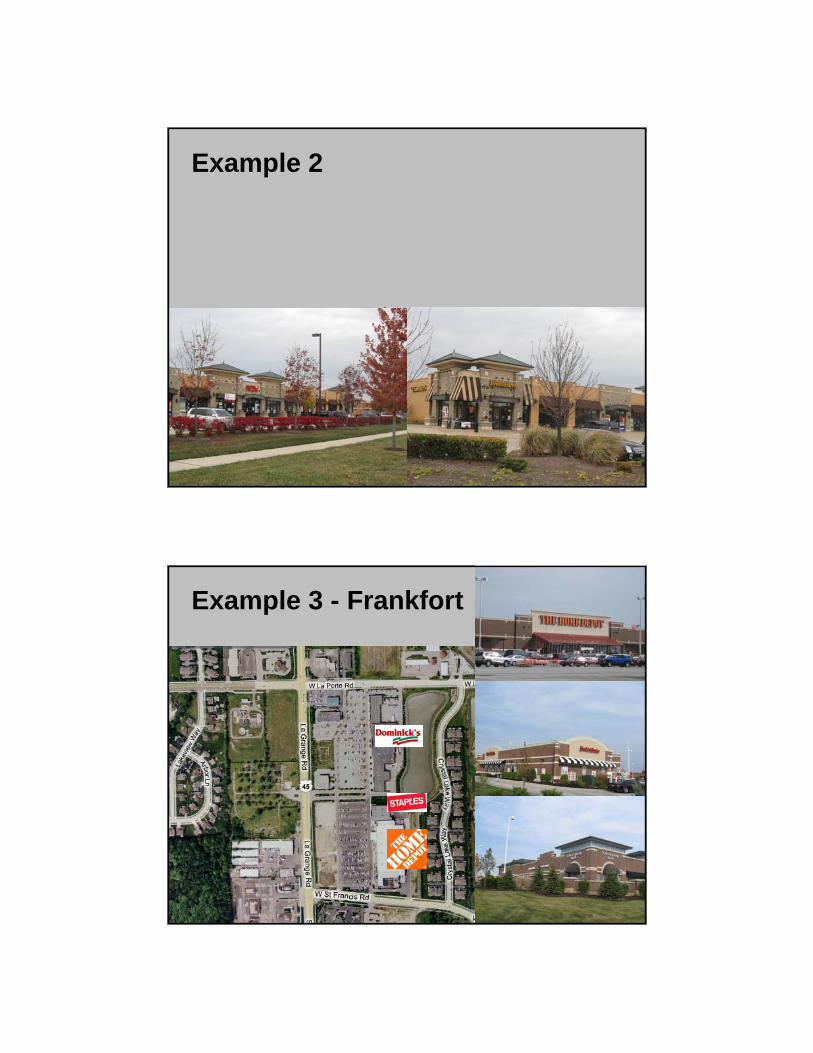
Example 2
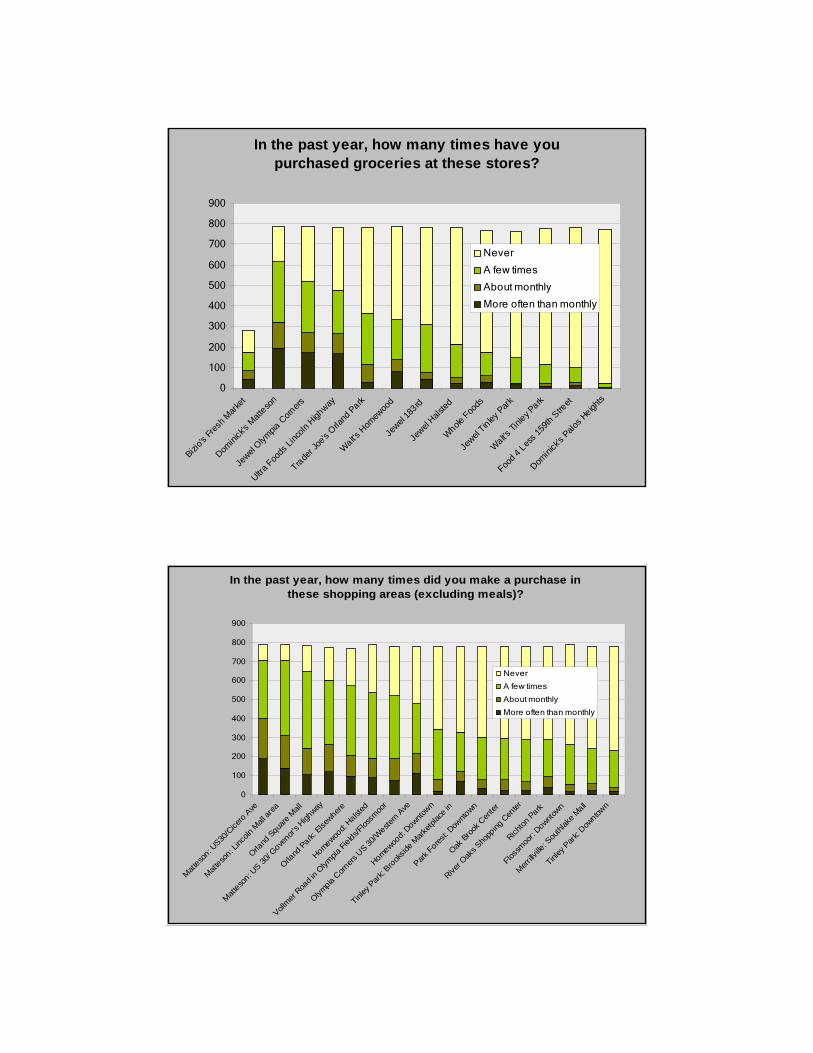
Example 3 - Frankfort

Database Design
Goal:Produce data that is of use to the communities ANDthat can assess likelihood of retail redlining
Approach:1. Develop baseline conditions database containing two
necessary types of data: primary (survey, focus groups, interviews) and secondary (e.g., Experian, sales data, IDOT traffic counts, etc)
2. Triangulate data to get rich analysis of each community3. Eliminate potential explanations for investment patterns
that are NOT evidence of redlining
Hypotheses to test for Redlining
• H1: Retail patterns in the study area are attributed to supply and demand mismatch (leakages, gaps, surplus).
• H2: Retail patterns in the study area are attributed to investment barriers/challenges (local, regional, national).
For both, we will:• stratify the analysis across the retail categories targeted in the consumer survey.
• assume that similar patterns will be found in comparison communities.
If not, then we can assume there are other factors contributing to the patterns found in the study area.

Analyzing Local Retail Patterns
Property Owners Retailers
Consumers
BASIC patterns
How does your community look in general? How does it compare to…?
e.g., consumer leakage: sit-down family restaurants
Property Owners Retailers
ConsumersSecondary dataSecondary data
SPECIFIC patterns
What do consumers want? Why aren’t retailers here?
e.g., consumer leakage: 23% of families surveyed drive 5 miles to Panera Bread; there are 3 locations where PB could locate in our community; all three have lease restrictions that PB will not sign.
Primary dataPrimary data
Assessing Patterns
Use similar approach as with housing redlining:
Eliminate possible “non-redlining” behavior as explanation
Supply/demand gaps
Investment barriers/challenges
Likely redlining behavior ??
Comm 1 Comm 2

Profile of respondentsMatteson Olympia
FieldsParkForest
Richton Park
Combined
Households 5,479 1,772 8,665 4,728 20,644
15% response goal 822 266 1,300 709 3,097
Final 11‐1‐10 281 195 208 85 769
% of households 5.1% 11.0% 2.4% 1.8% 3.7%
• 165 responses from outside the four target communities.
• Total responses = 939 (includes 5 from unspecified location).
• Heard from long-term residents (61%), and both young families (26%) and older empty nesters (27%).
• Respondents are higher income (54% above $75,000) and own their homes (96%).
• Race/ethnicity of respondents suggests slight over-representation of African Americans and under-representation of Hispanics.
Key Supply and Demand “Big Picture”Findings
• Most travel longer distances to shop (74% drive more than 5 minutes).
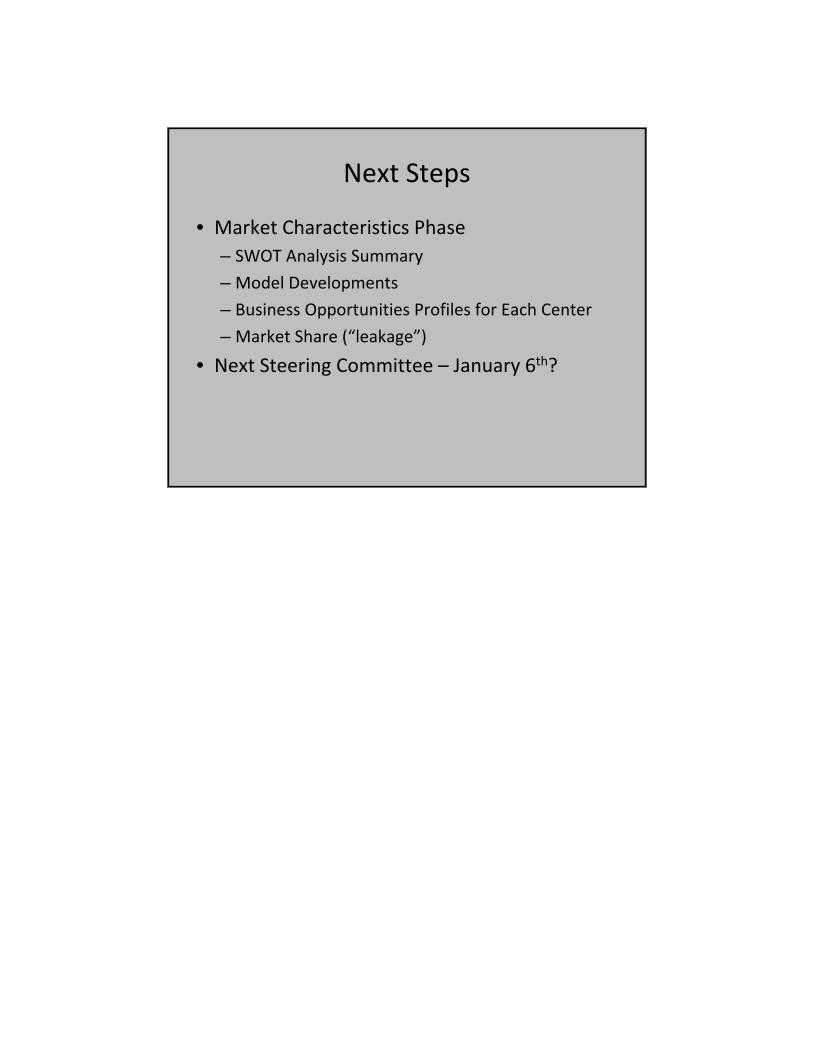
• Most buy groceries at Dominick’s (Matteson) and Jewel (Olympia Corners)
• Comparing features (cleanliness, parking, safety, signage, customer service) of Lincoln Mall to Orland Park: OP is better than LM across all conditions asked about. Comments provide additional insights.
• Still, people shop in Lincoln Mall, and more often than at Orland Park, particularly at JC Penney’s and Carson Pirie Scott.
• Unmet demand: People want things not in their community now, particularly higher end & family dining options, shoes, health food stores and home furnishings.
In the past year, how many times have you purchased groceries at these stores?
0
100
200
300
400
500
600
700
800
900
Bizio's
Fres
h Mark
et
Domini
ck's
Matteso
n
Jewel
Olympia
Corn
ers
Ultra Foo
ds Li
ncoln
High
way
Trader J
oe's
Orland
Park
Walt's H
omew
ood
Jewel
183rd
Jewel
Halsted
Whole Foo
ds
Jewel
Tinley Park
Walt's Ti
nley P
ark
Food 4
Less 1
59th
Street
Domini
ck's
Palos H
eights
Never
A few times
About monthly
More often than monthly
In the past year, how many times did you make a purchase in these shopping areas (excluding meals)?
0
100
200
300
400
500
600
700
800
900
Matteso
n: US30
/Cice
ro A
ve
Matteso
n: Linc
oln M
all ar
ea
Orland
Squa
re M
all
Matteso
n: US 30
/ Gove
nor's H
ighway
Orland
Park: Else
where
Homewood:
Halsted
Vollmer
Road i
n Olym
pia Fi
elds/Flos
smoo
r
Olympia C
orners
US 30
/Weste
rn Ave
Homewood:
Downtown
Tinley
Park:
Brook
side M
arketp
lace in
Park Fores
t: Dow
ntown
Oak B
rook
Cen
ter
River O
aks S
hopp
ing C
enter
Richton
Park
Flossm
oor:
Downtown
Merrillv
ille: S
outhl
ake M
all
Tinley
Par
k: Dow
ntown
Never
A few times
About monthly
More often than monthly

In the past year, how many times have you purchased merchandise at these department stores?
0
100
200
300
400
500
600
700
800
900
Carson
Pirie Sco
tt Linco
ln Ma
JC Penney's L
incoln M
a
Macy's
Orla
nd Pa rk
Carson Pirie
Scott O
rland
Squa
Kohl's Tinley P
a rk
Kohl's
Homew
ood
JC Penney
's Orla
nd Squar
Nordstro
m
Macy's
River Oaks
Koh l's in Frankfo
rtSaks
Kohl's
in Crete
Von M
aur
JC Penney
's Moke
na
Never
A few times
About monthly
More often than monthly
Group Exercise
• Strengths and weaknesses
Next Steps
• Market Characteristics Phase– SWOT Analysis Summary
– Model Developments
– Business Opportunities Profiles for Each Center
– Market Share (“leakage”)
• Next Steering Committee – January 6th?