agenda education oversight committee monday ... minutes/2017/full committee packet...agenda...
TRANSCRIPT

AGENDA
Education Oversight Committee Monday, September 11, 2017
1:00 PM Room 433, Blatt Building
Note: At 10:30 a.m. EOC members who would like to learn more about the accountability recommendations are invited to attend a briefing in
Room 433 of the Blatt Building. This briefing is open to the public; however, there will not be time allotted for public testimony.
I. Welcome and Introductions .................................................... Mr. Neil Robinson
II. Approval of Minutes of July 30-31, 2017 ................................ Mr. Neil Robinson
III. Public Input on School Performance Indicators ...................... Mr. Neil Robinson
IV. Subcommittee Reports: Academic Standards and Assessment ..................................... Dr. Danny Merck Public Awareness............................................................. Mrs. Barbara Hairfield
Action Item: Approval of Indicators and Overall Points per Act 94 of 2017
V. Action Item: Approval of Overall School Ratings .................... Mr. Neil Robinson VI. Adjournment Speakers are limited to 7 minutes speaking time and 3 minutes for Q&A. All speakers
must sign up at the meeting to speak and if printed copies of remarks are provided, please provide 25 copies.
Neil C. Robinson, Jr.
CHAIR
Daniel B. Merck
VICE CHAIR
April Allen
Cynthia M. Bennett
Anne H. Bull
Bob Couch
Raye Felder
Barbara B. Hairfield
Greg Hembree
Kevin L. Johnson
Dwight A. Loftis
John W. Matthews, Jr.
Henry McMaster
Molly Spearman
John C. Stockwell
Patti J. Tate
Ellen Weaver
Melanie D. Barton EXECUTIVE DIRECTOR

SOUTH CAROLINA EDUCATION OVERSIGHT COMMITTEE
Minutes Summer Retreat
July 30 and 31, 2017 Madren Conference Center
Clemson University
Sunday, July 30, 2017 at 3:00 p.m.
Members Present: Neil Robinson, Chair; Dr. Danny Merck, Vice-Chair; Anne Bull; Dr. Bob Couch, Rep. Raye Felder; Barbara Hairfield; Sen. Kevin Johnson; Rep. Dwight Loftis; Sen. John Matthews; Dr. John Stockwell; Patti Tate; and Ellen Weaver. Attending for State Superintendent of Education: Emily Heatwole Other Legislators Present: Rep. Gary Clary EOC Staff Present: Melanie Barton; Kevin Andrews; Rainey Knight; and Dana Yow. Mr. Robinson welcomed the members and guests to Clemson University. He asked the members and guests in attendance to introduce themselves. Rep. Clary, who represents the Clemson community at the General Assembly, extended a special welcome to the EOC members, noting the important education issues impacting the state.
The minutes of the June 12, 2017 meeting were approved as distributed. Mr. Robinson called upon Ms. Barton to discuss the afternoon’s strategic planning meeting. Ms. Barton noted that the General Assembly is considering what role or functions the EOC should have in education policy. She noted that at least one legislator asked this past session “why the EOC does not stay in its lane,” a comment that led to the EOC enlisting the services of Dr. Peggy Torrey to engage the members, staff, and guests in attendance in strategic planning. Dr. Torrey explained that strategic planning is designing a road map that answers four key questions for the EOC:
Where are we now? Where do we want to go? How will we get there? How will we know if we got there?

The goal of the strategic planning system is to assist the EOC in establishing a vision, mission, focus area or primary goals, strategies, and objectives. For the next ninety minutes, members engaged in discussing and answering various questions that focused on the: (1) strengths of the agency; (2) the challenges or barriers; (3) opportunities; (4) the degree to which the agency collaborates with various stakeholders; and (5) increasing statutory responsibilities of the agency. Members discussed the increasing responsibilities that the legislature has given the EOC and the continuing challenges related to collaboration and communication among the legislature, the public, the business community and K-12 education. Members discussed the possibility of amending the statutory responsibilities of the EOC to clarify the agency’s mission. There being no further business, the meeting adjourned at 5:30 p.m. It was announced that the members would be attending a dinner at the home of Dr. Lee D’Andrea. Transportation would be provided from the Madren Conference Center, and anyone in attendance could attend the dinner.
Monday, July 31, 2017 at 8:30 a.m.
Members Present: Neil Robinson, Chair; Dr. Danny Merck, Vice-Chair; Anne Bull; Dr. Bob Couch, Rep. Raye Felder; Barbara Hairfield; Sen. Kevin Johnson; Rep. Dwight Loftis; Sen. John Matthews; Dr. John Stockwell; Patti Tate; and Ellen Weaver. Attending for State Superintendent of Education: Dr. Sheila Quinn Other Legislators Present: Rep. Rita Allison and Rep. Neal Collins EOC Staff Present: Melanie Barton; Kevin Andrews; Rainey Knight; and Dana Yow. Mr. Robinson opened the meeting by introducing special guests in attendance: Rita Allison, Chair of the House Education and Public Works Committee; Rep. Neal Collins, Chair of the Competency-Based Task Force and a member of the House Education and Public Works Committee; Cindy Crick, Chief of Staff for Congressman Trey Gowdy; Dr. Michelle Cook, Interim Associate Dean for Undergraduate Studies at Clemson University; and Jennifer Hein, Director of Assessment and Accreditation at the College of Education at Clemson University.
The meeting began with a presentation by Dr. Peggy Torrey and Dana Yow concerning the report card focus groups meetings that were held on July 17, 18 and 19, 2017 in Beaufort, Columbia and Greenwood. Approximately thirty-three parents participated. The objective of the focus groups was to give parents information and two electronic samples of possible report card formats and ask them to find items or information that they valued and to garner feedback on the report card formats.

The results showed:
• Parents are interested in knowing information about their child’s classroom (teacher/student ratios, teacher qualifications and teacher retention rates).
• Parents also want to know about extracurricular activities and the safety within their child’s school.
• Parents also want information to be able to compare the performance of students at their child’s school to the performance of other schools in South Carolina and in other states.
• Parents also are interested in principal retention rates and in test scores. Consistent themes among the three meetings emerged. Parents are most concerned with: graduation rates and readiness; discipline and safety; teacher qualifications and retention; and test scores including comparisons with other schools and the nation. Parents also gave feedback on the report card templates. They do not want acronyms or education jargon. Parents want graphs to be simple and easy to understand as well as icons across the landing page As far as additional support, parents want to know:
• School goals and progress toward those goals; • Information on facilities; • Trend data to determine if their child’s school is improving; • A link to a “real person” who can answer questions about the report card;
and • A Frequently Asked Questions (FAQ) page.
The members discussed the results, and then took a ten-minute break at 9:50 a.m. The meeting reconvened at 10:00 a.m. The final discussion centered on the Every Student Succeeds Act (ESSA). Mr. Robinson introduced Dr. Monique Chism, Deputy Assistant Secretary for the Office of Elementary & Secondary Education at the United States Department of Education. Dr. Chism discussed the objectives of the ESSA law and summarized the contents of the 17 state plans that were submitted in the spring of 2017. Regarding the law, Dr. Chism noted that the goal of the law is for all students to be taught and master college and career readiness standards. The law ensures that states establish accountability systems that focus and redirect sources to under-achieving schools. The law includes opportunities for states to be innovative. Dr. Chism highlighted three opportunities for innovation:

1. States may include indicators in the accountability system that ensure students receive a well-rounded education. States may include student performance on social studies and science assessments, student access to arts instruction, the safety and health of students, and student access to technology.
2. School districts may apply for grants to merge Title I, II and III funds into weighted student funding formulas.
3. States may use innovative measures to measure Student Success such as school quality, integration of the arts, etc.
In reflecting on the 17 ESSA state plans that have been submitted to the United States Department of Education, Dr. Chism made the following observations:
• The academic and graduation goals must be ambitious. • The law requires that states measure progress toward English language
proficiency. • Academic achievement may only include student assessment results in
English language arts and mathematics. • The key indicators (academic achievement, academic progress, and
graduation rate) must have greater weight than the non-academic indicators. • States must identify what actions will be taken if at least 95 percent of
students do not take summative assessments. • The law requires that any indicator used must be valid, reliable, comparable
and have statewide differentiation. For example, states that count Advanced Placement (AP) courses must demonstrate that all students have access to AP courses.
Ms. Weaver asked for additional information on the innovative grants program for which districts may apply. Dr. Stockwell asked about the status of the 17 state applications. Mrs. Hairfield asked if states were addressing civic competencies. There being no further business, the meeting adjourned at 11:30 a.m.

EDUCATION OVERSIGHT COMMITTEE Subcommittee: Academic Standards and Assessment and Public Awareness
Date: September 11, 2017 ACTION: Academic Performance Indicators - Implementation of Act 94 of 2017 The Subcommittee recommendations are: (1) to establish the indicators and overall points for the Academic Achievement, Academic Progress, Graduation Rate, School Quality and Student Success indicators in the accountability system for schools; and (2) to establish the target percentages of schools that would receive ratings of Excellent, Good, Average, Below Average and Unsatisfactory for each indicator. PURPOSE/AUTHORITY Sections 59-18-120 and 59-18-900(B) of the Education Accountability Act (EAA) as amended by Act 94 of 2017 require the Education Oversight Committee to determine the overall performance rating of schools and the criteria or indicators that determine the rating. The law stipulates that the total number of points assigned across all indicators is 100 points. The law further denotes that each indicator will be assigned a rating of Excellent, Good, Average, Below Average or Unsatisfactory. CRITICAL FACTS The recommendations are based on federal guidance and on Act 94 of 2017. TIMELINE/REVIEW PROCESS The recommendations are based on the January 17, 2017 report of the EOC that recommended to the General Assembly how the state and federal accountability systems could be merged and on work conducted by the staffs of the EOC and SC Department of Education since passage of Act 94 of 2017. ECONOMIC IMPACT FOR EOC Cost: No fiscal impact beyond current appropriations Fund/Source:
ACTION REQUEST
For approval For information
ACTION TAKEN Approved Amended
Not Approved Action deferred (explain)

1
Action Item:
The Academic Standards and Assessment Subcommittee and the Public Awareness Subcommittee met on August 16, 2017 and approved the following indicators and weightings or points to use in establishing the overall performance rating for schools. These indicators are consistent with the requirements of the Every Student Succeeds Act (ESSA) of 2015 and South Carolina law, Act 94 of 2017. Simulations used to determine the ratings, percentage of schools that would receive an Excellent, Good, Average, Below Average or Unsatisfactory rating for each indicator were based on data provided to the Education Oversight Committee (EOC) by the SC Department of Education (SCDE) for the 2015-16 school year.
The Subcommittees further recommends that the attached target percentages for each indicator. A target percentage is defined as the percentage of schools who will receive a rating of Excellent, Good, Average, Below Average, and Unsatisfactory for each indicator. The specific cut points that must be earned to receive a rating of Excellent, Good, Average, Below Average or Unsatisfactory for each indicator will not be set until the EOC receives and analyzes data from the 2016-17 school year. The cut points will, however, reflect the final target percentages by indicator.
The indicator of English Language Proficiency is Amendment 1 as proposed by EOC staff working with the SCDE staff. The target percentage for the indicator College/Career Readiness (formerly Prepared for Success), at the high school level, is Amendment 2, as proposed by EOC staff. And, Amendment 3 is an amendment from Mr. Robinson based on Governor McMaster’s recommendations.

2
Subcommittee Proposed Indicators and Ratings for Indicators
Elementary & Middle Schools (Without ELP Population)
Indicator Total Points Ratings
Academic Achievement 40
Excellent – 10% Good – 15% Average – 40% Below Average – 25% Unsatisfactory – 10%
Academic Progress
Growth all students
Growth of lowest 20% of students
20
20
Excellent – 20% Good – 20% Average – 20% Below Average – 20% Unsatisfactory – 20%
Preparing for Success (Science & Social Studies)
10
Excellent – 10% Good – 15% Average – 40% Below Average – 25% Unsatisfactory – 10%
School Quality – Student Survey 10
Based on percentile ranks: Excellent – 90th and up Good – 70 to 89th Average – 50th to 69th Below Average – 20th to 49th Unsatisfactory – 19th and below
TOTAL: 100

3
Elementary & Middle Schools (with ELP Population)
Indicator Total Points Ratings
Academic Achievement 35
Excellent – 10% Good – 15% Average – 40% Below Average – 25% Unsatisfactory – 10%
Academic Progress Growth all students Growth of lowest 20% of students
17.5 17.5
Excellent – 20% Good – 20% Average – 20% Below Average – 20% Unsatisfactory – 20%
English Language Proficiency 10 Amendment 1
Preparing for Success (Science & Social Studies)
10
Excellent – 10% Good – 15% Average – 40% Below Average – 25% Unsatisfactory – 10%
School Quality – Student Survey 10
Based on percentile ranks: Excellent – 90th and up Good – 70 to 89th Average – 50th to 69th Below Average – 20th to 49th Unsatisfactory – 19th and below
TOTAL: 100

4
High Schools (Without ELP Population)
Indicator Total Points Ratings
Academic Achievement 35
Excellent – 10% Good – 15% Average – 40% Below Average – 25% Unsatisfactory – 10%
Graduation Rate 30
Excellent – 25% Good – 30% Average – 25% Below Average – 15% Unsatisfactory – 5%
College/Career Readiness 20 Amendment 2
School Quality – Student Survey 7.5
Based on percentile ranks: Excellent – 90th and up Good – 70 to 89th Average – 50th to 69th Below Average – 20th to 49th Unsatisfactory – 19th and below
Preparing for Success (Science/Social Studies)
7.5
Excellent – 10% Good – 15% Average – 40% Below Average – 25% Unsatisfactory – 10%
TOTAL: 100

5
High Schools (with ELP Population)
Indicator Total Points Ratings
Academic Achievement 30
Excellent – 10% Good – 15% Average – 40% Below Average – 25% Unsatisfactory – 10%
Graduation Rate 25
Excellent – 25% Good – 30% Average – 25% Below Average – 15% Unsatisfactory – 5%
English Language Proficiency 10 Amendment 1 College/Career Readiness 20 Amendment 2
School Quality – Student Survey 7.5
Based on percentile ranks: Excellent – 90th and up Good – 70 to 89th Average – 50th to 69th Below Average – 20th to 49th Unsatisfactory – 19th and below
Preparing for Success (Science/Social Studies) 7.5
Excellent – 10% Good – 15% Average – 40% Below Average – 25% Unsatisfactory – 10%
TOTAL: 100

6
Pursuant to the Every Student Succeeds Act (ESSA) of 2015, states must measure student performance annually using at least five indicators:
(1) Academic Achievement; (2) Academic Progress for elementary and middle schools; (3) Graduation Rate for high schools; (4) Progress in Achieving English Language Proficiency; and (5) School Quality or Student Success. A state may include multiple indicators of
School Quality or Student Success.
Of the above indicators, Academic Achievement, Academic Progress, Graduation Rate, and English Language Proficiency must, in the aggregate, receive much greater weight than School Quality or Student Success indicators.
Per South Carolina law, Act 94 of 2017, South Carolina must establish a “performance-based accountability system for public education that ensures that graduates have the “knowledge, skills, and opportunity to be college ready, career ready, and life ready for success in the global, digital, and knowledge-based world of the twenty-first century” as described in the Profile of the South Carolina Graduate.” Furthermore, all graduates should “have the opportunity to qualify for and be prepared to succeed in entry-level, credit-bearing college courses, without the need for remedial coursework, postsecondary job training, or significant on-the-job training.” (Section 59-18-100)
To satisfy ESSA requirements and to achieve the education goals of South Carolina law, the state must measure the progress of academic progress of students using both federal guidelines and the following requirements:
a. Percentage of students meeting standard on the state’s standards-based assessment;
b. Student growth or student progress; c. Graduation rates; and d. Other indicators (Section 59-18-120)
State law further establishes that “to increase transparency and accountability, the overall points achieved by a school to determine its ‘performance rating’ must be based on a numerical scale from zero to one hundred, with one hundred being the maximum total achievable points for a school.” (Section 59-18-120)
Therefore, based upon ESSA and Act 94 of 2017, the Subcommittees propose the following indicators by grade level and the following points systems to evaluate the performance of schools:

7
Table 1 School Accountability
Maximum Points by Indicator by School Type ESSA
Requirement Proposed Indicator Elementary Middle High
Academic Achievement
Academic Achievement
35/40 35/40 30/35
Academic Progress Student Progress 35/40 35/40 --
English Language Proficiency
English Language Proficiency
10/0 10/0 10/0
Graduation Rate Graduation Rate -- -- 25/30
School Quality Positive & Effective Learning Environment (Student Survey)
10 10 7.5
Student Success Preparing for Success (Science & Social Studies)
Prepared for Success (College/Career Readiness)
10 10 7.5
20
Total Maximum Points
100 100 100
Note: Schools with less than 20 students who are English language learners do not receive a rating for English language proficiency; therefore, such schools are evaluated on 40-point scales for Academic Achievement and Academic Progress as noted in red.
Amendment 2 changes the nomenclature from “Prepared for Success” to “College/Career Readiness.”

8
Table 2 summarizes the weighting system by ESSA requirement:
Table 2
Maximum Points by Indicator by School Type ESSA Requirement Elementary Middle High
Academic Achievement Academic Progress English Language Proficiency Graduation Rate
80% 80% 65%
School Quality Student Success
20% 20% 35%
TOTAL: 100% 100% 100%
Following is a description of each of the indicators along with Subcommittees’ recommendations for also establishing the target percentage for each indicator.

9
Academic Achievement Only assessments that measure student performance in English language arts (ELA) and mathematics may be included pursuant to feedback provided by the United States Department of Education (USDE) this summer to eight states that submitted ESSA state plans earlier this year and to advice provided by USDE officials at the EOC retreat on July 31, 2017.
Elementary and Middle Schools
At the elementary and middle school level, points are earned by converting student assessment results on SC READY and SC-Alt. SC-Alt is the alternate assessment for students with significant cognitive disabilities who are unable to participate in the general assessment program even with appropriate modifications. In the prior state accountability system, students’ assessments on SC-Alt were included in the district rating, not the school rating. Students who are included in the metric are students who were continuously enrolled. Students who are enrolled on the 45th day of the school year and on the 160th day of the school year without being withdrawn from enrollment for more than five days during this time. Students who should have taken a subject area test, but did not, are assigned 0 points for that test and included in the denominator.
At the high school level, points would be earned based on converting end-of-course assessments in Algebra 1 and English 1. For each student, the highest EOCEP score in each subject area is the score for that student. Students who should have taken a subject area test, but did not, are assigned 0 points for that test and included in the denominator. Students who take an end-of-course assessment in middle school will not be included in the academic achievement rating in 2017-18. This is another change from the prior state accountability system.
Table 3 Test Score to Points Conversion –SC READY, and SC-ALT
Points SC READY Level SC-ALT Level End-of-Course
0 Does Not Meet Emerging F
1 Approaches Foundational D
2 Meets Increasing C
3 Exceeds Applied B
4 A
10
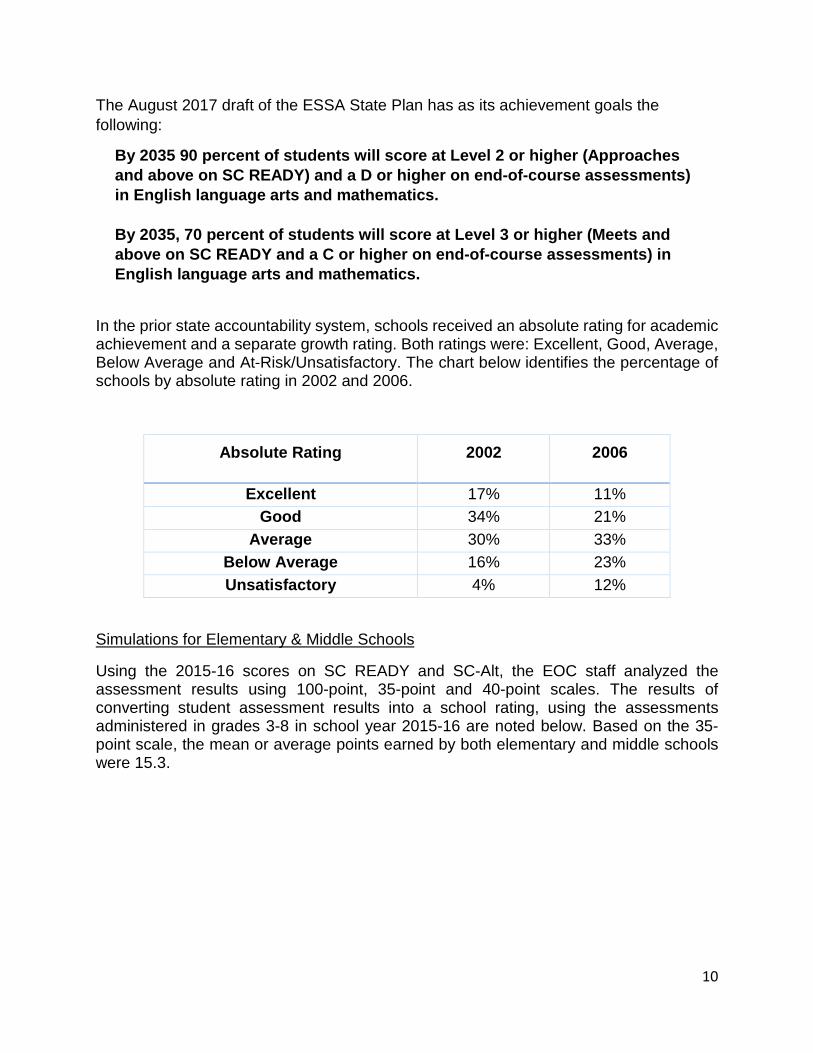
The August 2017 draft of the ESSA State Plan has as its achievement goals the following:
By 2035 90 percent of students will score at Level 2 or higher (Approaches and above on SC READY) and a D or higher on end-of-course assessments) in English language arts and mathematics. By 2035, 70 percent of students will score at Level 3 or higher (Meets and above on SC READY and a C or higher on end-of-course assessments) in English language arts and mathematics.
In the prior state accountability system, schools received an absolute rating for academic achievement and a separate growth rating. Both ratings were: Excellent, Good, Average, Below Average and At-Risk/Unsatisfactory. The chart below identifies the percentage of schools by absolute rating in 2002 and 2006.
Absolute Rating 2002 2006
Excellent 17% 11% Good 34% 21%
Average 30% 33% Below Average 16% 23% Unsatisfactory 4% 12%
Simulations for Elementary & Middle Schools
Using the 2015-16 scores on SC READY and SC-Alt, the EOC staff analyzed the assessment results using 100-point, 35-point and 40-point scales. The results of converting student assessment results into a school rating, using the assessments administered in grades 3-8 in school year 2015-16 are noted below. Based on the 35-point scale, the mean or average points earned by both elementary and middle schools were 15.3.

11
Result Mean Standard
Deviation Minimum Maximum All Schools (N=975) – includes duplicate
Elementary and Middle Step 5: Percent of possible points on 100-point scale
43.6 13.2 0.0 94.5
Step 6: Points on the 35-point scale 15.3 4.6 3.3 33.1 Step 7: Points on the 40-point scale 17.5 5.2 3.8 37.8
Elementary Schools (N=661) Step 5: Percent of possible points on 100-point scale
44.9 12.9 5.6 83.2
Step 6: Points on the 35-point scale 15.8 4.5 4.0 29.1 Step 7: Points on the 40-point scale 18.0 5.1 4.6 33.3
Middle Schools (N=314) Step 5: Percent of possible points on 100-point scale
40.9 13.5 0.0 94.5
Step 6: Points on the 35-point scale 14.4 4.6 3.3 33.1 Step 7: Points on the 40-point scale 16.4 5.3 3.8 37.8
Result Mean Standard
Deviation Minimum Maximum All Schools (N=975) – includes duplicate
Elementary and Middle Percent of possible points 43.8 13.1 9.4 94.5 Points on the 35-point scale 15.3 4.6 3.3 33.1 Points on the 40-point scale 17.5 5.2 3.8 37.8
Elementary Schools (N=661) Percent of possible points 45.1 12.8 11.5 83.2 Points on the 35-point scale 15.8 4.5 4.0 29.1 Points on the 40-point scale 18.0 5.1 4.6 33.3
Middle Schools (N=314) Percent of possible points 41.1 13.3 9.4 94.5 Points on the 35-point scale 14.4 4.6 3.3 33.1 Points on the 40-point scale 16.4 5.3 3.8 37.8

12
The distribution of achievement scores on the 35-point and the 40-point scales are presented below. The distributions on these scales have the same shape, only the horizontal (x) axis values will change.
Achievement Scores on the 35-point scale.
Achievement Scores on the 40-point scale.
Perc
ent o
f Sch
ools
0
2
4
6
8
10
Achievement Score
0 5 10 15 20 25 30 35
School Type: Elementary Middle
Perc
ent o
f Sch
ools
0
2
4
6
8
10
Achievement Score
0 5 10 15 20 25 30 35 40
School Type: Elementary Middle

13
Because both the school scores on the 35-point scale and the cut-points that separate each rating category on the 35-point scale can be obtained from the corresponding values on the 40-point scale by multiplying using the same ratio (35/40), schools will have the same rating regardless of whether their score is expressed on the 35-point or the 40-point scale.
Ratings for elementary schools
Rating Target % Range of Scores* Percent of Schools 35-point 40-point
Excellent 10 21.65 – 35.00 24.74 – 40.00 10.1 Good 15 18.70 – 21.64 21.37 – 24.73 15.1
Average 40 13.88 – 18.69 15.86 – 21.36 39.8 Below Average 25 10.18 – 13.87 11.63 – 15.85 25.0 Unsatisfactory 10 0.00 – 10.17 0.00 – 11.62 10.0
Ratings for middle schools
Rating Target % Range of Scores* Percent of Schools 35-point 40-point
Excellent 10 20.20 – 35.00 23.09 - 40.00 10.2 Good 15 16.84 – 20.19 19.25 – 23.08 14.6
Average 40 12.36 – 16.83 14.12 – 19.24 40.5 Below Average 25 8.57 – 12.35 9.79 - 14.11 24.8 Unsatisfactory 10 0.00 – 8.56 0.00 - 9.78 9.9
Summary of Ratings for Elementary and Middle Schools with ranges of scores unique to school type.
Rating Target % School Type* All Schools Elementary Middle
Excellent 10 10.1 10.2 10.2 Good 15 15.1 14.6 15.0
Average 40 39.8 40.5 40.0 Below Average 25 25.0 24.8 24.9 Unsatisfactory 10 10.0 9.9 9.9

14
The recommended target percentages reflect the 2015-16 SC READY assessment results and the state goals of having at least 70 percent of students scoring Meets or above and 90 percent Approaches or above on SC READY.
At its July retreat the EOC reviewed the following assessment data from 2015-16 on SC Ready:
• 5% of schools had at least 70% of students scoring Meets or above on SC READY in ELA;
• 6% of schools had at least 70% of students scoring Meets or above on SC READY in mathematics; and
• 2% of schools had at least 70% of students scoring Meets or above on SC READY in ELA and mathematics.
English and Language Arts
Percent of Students in School Scoring Meets or Exceeds
In All Grade Levels
Number of Schools
School Type
Elementary Middle Total
90.1-100% 1 2 3
80.1-90% 5 7 12
70.1-80% 29 7 36
60.1-70% 51 16 67
50.1-60% 91 40 131
40.1-50% 143 80 223
30.1-40% 147 66 213
20.1-30% 131 53 184
10.1-20% 61 38 99
0-10% 7 9 16
Total 666 318 984

15
Mathematics
Percent of Students in School Scoring Meets or Exceeds
In All Grade Levels
Number of Schools School Type
Elementary Middle Total
90.1-100% 1 2 3
80.1-90% 12 3 15
70.1-80% 43 5 48
60.1-70% 87 12 99
50.1-60% 124 24 148
40.1-50% 143 45 188
30.1-40% 125 66 191
20.1-30% 82 67 149
10.1-20% 42 67 109
0-10% 7 27 34
Total 666 318 984
English and Language Arts AND Mathematics
Percent of Students in School Scoring Meets or Exceeds
In All Grade Levels
Number of Schools School Type
Elementary Middle Total
90.1-100% 1 2 3
80.1-90% 0 1 1
70.1-80% 13 5 18
60.1-70% 29 5 34
50.1-60% 60 13 73
40.1-50% 105 30 135
30.1-40% 160 55 215
20.1-30% 136 76 212
10.1-20% 129 85 214
0-10% 33 46 79
Total 666 318 984

16
The Subcommittees also considered the following information in determining the target percentages for simulations:
Academic Achievement Meets or Exceeds Expectations in ELA and Math
Elementary Schools
Meets or Exceeds Achievement
Rating
Approaches, Meets, or Exceeds Average Percent Minimum Maximum
Average Percent Minimum Maximum
64.3 54 90 Excellent 10% 89.7 83 99
49.0 40 58 Good 15% 81.6 71 91
34.0 20 46 Average 40% 70.7 55 85
20.0 8 30 Below Average 25% 56.3 46 68
10.2 0.0 22 Unsatisfactory 10% 39.8 15 56
Middle Schools Meets or Exceeds Achieveme
nt Rating
Approaches, Meets, or Exceeds Average Percent Minimum
Maximum
Average Percent Minimum Maximum
61.0 41 97 Excellent 10% 89.6 79 100
40.9 32 48 Good 15% 77.9 68 86
26.0 12 36 Average 40% 67.3 55 78
13.6 6 22 Below
Average 25%
51.6 34 64
5.2 0 10 Unsatisfactory 10% 37.9 18 47

17
High Schools
For high schools, again, only student assessment results on English language arts and mathematics may be included, which currently are English 1 and Algebra 1 end-of-course assessments. The Subcommittees recommend the same target percentages to determine the rating for Academic Achievement for high schools.
Rating Target % Excellent 10 Good 15 Average 40 Below Average 25 Unsatisfactory 10
The EOC staff compiled the following data to better understand the achievement level of students in high schools using the above target percentages for simulations. The analysis focused on percentage of students in schools who scored a D or higher and a C or higher on end-of-course assessments in English 1 and Algebra 1.
High Schools Average Percent of Students Scoring C or better on both
end-of-course tests
Ratings and
Target %
Average Percent of Students Scoring D or better on both end-of-
course tests
80.3% Excellent 10%
93.5%
67.1% Good 15%
83.4%
47.2% Average 40%
73.7%
30.0% Below Average 25%
59.3%
14.9% Unsatisfactory 10%
39.4%

18
Academic Progress (Student Progress) Per Act 94 of 2017 student progress or academic growth must be measured using value-added. In addition, the law requires the accountability system address historically underachieving students as recommended by the EOC in its January 2017 report. Therefore, the Subcommittees recommend that student progress or growth measure be weighed accordingly:
• Half of the points earned reflect growth for all students in the school on English language arts and mathematics; and
• Half of the points earned must reflect growth of the bottom quintile, again in English language arts and mathematics.
Annually from EVAAS®, schools receive a Growth Measure, a measure of student progress during the reported year. The Growth Measure describes the amount of progress made by a group of students from one point in time to the next. The Growth Measure is reported in scale scores, depending on the test. At the school level it is a measure of progress relative to the growth of students in the average school in the state, called the growth standard. A positive growth measure indicates that students grew more than the average school statewide. A negative growth measures indicates that students did not grow as much as the average school statewide. The growth measure is reported with its standard error, which describes the uncertainty aground the growth measure and can be used as a measure of the evidence that the growth measure is significantly different from the growth standard.
Recommendation: The Subcommittees recommend using the Multivariate Response Model (MRM) to measure overall school growth and growth of the lowest 20% of students in a school. MRM is an analysis for tests that are given in consecutive years. MRM measures growth between two points in time for a group of students. MRM answers the question: did a group of students maintain the same relative position with respect to statewide student achievement from one year to the next for a specific subject and grade?
The only assessments administered in consecutive years are the SC READY assessments in English language arts and mathematics. Student progress at the school level and for the lowest performing 20% of students will measure only student growth in English language arts and mathematics.
All students are included in the analyses if they have scores that can be used. There must be at least 6 students who are associated with the school in subject/grade/year. The association could mean they were tested at the school or at the district level.
Recommendation: The Subcommittees recommend that for school year 2017-18 schools also receive predicted growth measures for subject areas that are not assessed in consecutive years, i.e. science and social studies, using Univariate Response Model (URM). URM is an analysis for tests that are not given for consecutive requires. It is a modeling approach that is a regression-based model that measures the difference

19
between students’ predicted scores for a particular subject/year with their observed scores. The growth expectation is met when students in a school made the same amount of progress as students in the average school for that same year/subject/grade. For 2017-18 the predicted growth measures will be provided to schools but not reported on the school report card.
Recommendation: The Subcommittees reviewed school growth ratings from 2002 until 2014. The following table documents the percentage of schools identified by rankings across the years. The distribution is not consistent across years or even spans of time. Because South Carolina law requires five ratings for each indicator and based upon the previous history, the Subcommittees recommend using percentile rankings of growth measure as defined below, which categorize schools into quintiles:
Rating % of Schools by rating (2002-2014)
Using Quintiles
Excellent 10.93% 20% Good 18.15% 20% Average 27.24% 20% Below Average 20.76% 20% Unsatisfactory/At-Risk 22.92% 20%
Excellent: Growth measures that ranked in the highest fifth (81 to 100%) of the distribution Good: Growth measures that ranked in the second highest fifth (61 to 80%) of the distribution Average: Growth measures that ranked in the middle fifth (41 to 60%) of the distribution Below Average: Growth measures that ranked in the second-lowest fifth (21 to 40%) of the distribution Unsatisfactory: Growth measures that ranked in the lowest fifth (1 to 20%) of the distribution.

20
English Language Proficiency
Amendment 1 proposed by EOC staff will address this indicator.

21
Graduation Rate Consistent with the EOC’s January 2017 recommendations, the Subcommittees recommend that points be earned based on converting the graduation rate from the cohort for the current year onto either a 25 or a 30- point scale. The graduation rate is the on-time graduation rate. To obtain a graduation rate that uses as much of a 25-point scale as possible, the Subcommittees recommend using the following formula:
(On-Time Graduation Rate – 50) / 2
Then, to assign ratings for the indicator, the following criteria were used:
1. Any high school with a graduation rate of 70 percent or less is deemed Unsatisfactory.
2. Any high school with a graduation rate of 90 percent or greater, which is the state goal, is deemed Excellent.
Approximately 25 percent of the high schools in the state have a graduation rate of 90 percent or higher in 2015-16. Similarly, the target percentage is 5% for the Unsatisfactory rating because 5% of schools have a graduation rate of less than 70%.
Ranges of Scores and Percent of Schools receiving each rating.
Rating Target % % of Schools Simulations
2015-16 Excellent
Graduation Rate>90 25 25.2
Good 30 30.2 Average 25 24.8
Below Average 15 14.4 Unsatisfactory (Grad Rate<70)
5 5.4

22
And here is the distribution of the graduation rate indicator on the 25-point scale.
Perc
ent o
f Sch
ools
0
2
4
6
8
10
Graduation Rate Score
0 5 10 15 20 25
Graduation Rate - Full-Scale 25 Points

23
Student Success (Preparing for Success) Elementary and Middle Schools
Progress towards achieving the Profile of the South Carolina Graduate requires the state to improve college- and career-readiness of all students along the continuum. The Profile expressly includes in World-Class knowledge:
• Science, Technology, Engineering and Mathematics (STEM); and • Social sciences
In addition, the Profile requires students to develop world-class skills and characteristics that are directly related to and supported by these two disciplines:
• Creativity and innovation • Critical thinking and problem solving • Global perspective
Recommendation: The Subcommittees recommend that student assessment results on state assessments in grades 5 and 7 in social studies and in grades 4, 6 and 8 in science be reflected in a Student Success or Preparing for Success indicator for elementary and middle schools. During the summer of 2017 the South Carolina Department of Education, working with educators, have established new cut points and student performance descriptors for science that are the same as used for SC READY. Therefore, the point-system would be as follows and consistent with the assignment of points under Academic Achievement:
Test Score to Points Conversion – SC PASS, SC READY and SC-ALT Science and Social Studies
Points SC PASS Level SC READY Level SC-ALT Level
0 Not Met 1 Does Not Meet Emerging
1 Not Met 2 Approaches Foundational
2 Met Meets Increasing
3 Exemplary 4 Exceeds Applied
4 Exemplary 5
Students who are included in the metric are students who were continuously enrolled. Students who are enrolled on the 45th day of the school year and on the 160th day of the school year without being withdrawn from enrollment for more than five days during this time. Students who should have taken a subject area test, but did not, are assigned 0

24
points for that test and included in the denominator. The results of converting student assessment results into a school rating, using the assessments administered in grades 3-8 in school year 2015-16 are noted below.
Result Mean Standard
Deviation Minimum Maximum All Schools (N=975) – includes duplicate
Elementary and Middle Step 5: Percent of possible points on a 100-point scale
48.8 12.4 11.4 91.5
Step 6: Points on the 10-point scale 4.9 1.2 1.3 9.1 Elementary Schools (N=661)
Step 5: Percent of possible points on a 100-point scale
48.3 12.1 12.9 80.0
Step 6: Points on the 10-point scale 4.8 1.2 1.3 8 Middle Schools (N=314)
Step 5: Percent of possible points on a 100-point scale
49.8 13.0 11.4 91.5
Step 6: Points on the 10-point scale 5.0 1.3 1.9 9.1
Student Success Scores on the 10-point scale.
Perc
ent o
f Sch
ools
0
2
4
6
8
10
12
14
16
18
20
Student Success Score
0 2 4 6 8 10
School Type: Elementary Middle

25
Recommendation: The Subcommittees also recommend that for the 2018-19 school year that the EOC and SCDE determine how to expand the definition of student success to include counting opportunities and participation in the arts in elementary and middle schools and foreign language in the middle school. Again, referring to the Profile of the SC Graduate, graduates are expected to have developed multiple languages and the characteristics of creativity and innovation. Other measures could come from the competency-based education work that SCDE is doing.
High School
At the high school level, the Subcommittees recommend the following: (1) a separate indicator to capture the end-of-course assessments in Biology 1 and US History and the Constitution; and (2) an indicator of Prepared for Success, the percentage of 12th graders who earn a high school diploma and who are career-ready, college-ready, college or career-ready, or both college- and career-ready.
Preparing for Success (Science and Social Studies at High School Level) The Subcommittees recommend that at the high school level student assessment results for the end-of-course assessments in Biology 1 and US History and The Constitution count towards the school’s overall ranking. The Profile of the South Carolina Graduate expressly notes that students should graduate with world-class knowledge of science and social studies. Furthermore, students should exhibit skills and characteristics of creativity, collaboration, thinking, etc., which should be embedded in instruction in science and social studies. Prepared for Success (College/Career Readiness) For school year 2017-18, the Subcommittee recommends determining for each student who receives a high school diploma the following:
1. What percentage of students in the 2018 graduating class was college-ready? This information would be reported only and used in the calculation of college or career-ready.
a. Scores a composite score of 20 or higher on the ACT composite; b. Scores a composite score of 1020 or higher on the SAT composite; c. Scores a 3 or higher on an Advanced Placement (AP) exam in English,
mathematics, science or social studies or an AP capstone. Specific courses will be determined using the Activity Coding System;
d. Scores a 4 or higher on an International Baccalaureate (IB) assessment in English, mathematics, science, or social studies. Only higher learning (HL) exams in English, mathematics, science and social studies may count. Specific courses will be determined using the Activity Coding System; or
26
e. Completes at least six (6) credit hours in dual enrollment courses in an English or mathematics course or STEM course with a grade of C or higher. STEM is defined as a natural/lab science or computer science course.
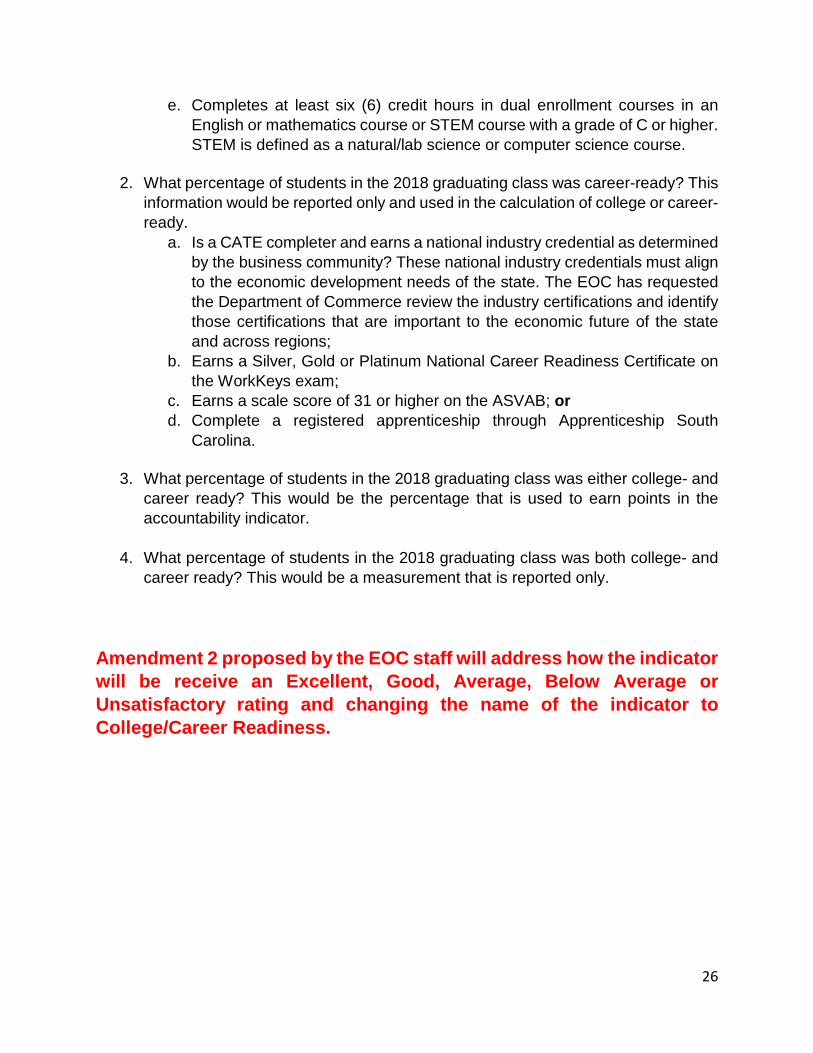
2. What percentage of students in the 2018 graduating class was career-ready? This information would be reported only and used in the calculation of college or career-ready.
a. Is a CATE completer and earns a national industry credential as determined by the business community? These national industry credentials must align to the economic development needs of the state. The EOC has requested the Department of Commerce review the industry certifications and identify those certifications that are important to the economic future of the state and across regions;
b. Earns a Silver, Gold or Platinum National Career Readiness Certificate on the WorkKeys exam;
c. Earns a scale score of 31 or higher on the ASVAB; or d. Complete a registered apprenticeship through Apprenticeship South
Carolina.
3. What percentage of students in the 2018 graduating class was either college- and career ready? This would be the percentage that is used to earn points in the accountability indicator.
4. What percentage of students in the 2018 graduating class was both college- and career ready? This would be a measurement that is reported only.
Amendment 2 proposed by the EOC staff will address how the indicator will be receive an Excellent, Good, Average, Below Average or Unsatisfactory rating and changing the name of the indicator to College/Career Readiness.

27
School Quality (Positive & Effective Learning Environment) Points are earned based on the results of a student engagement survey that is procured by the South Carolina Department of Education and administered to students during the 2017-18 school year.
The EOC staff reviewed two student engagement surveys that were administered by at least two school districts in South Carolina in 2017-18. The EOC staff also reviewed student engagement surveys that were administered statewide in other states in 2017-18. One state converted the results of student surveys conducted in grades 3 through 12 to create a Student Engagement Scale for the state and for individual districts and schools.
Without knowing which survey will be procured and administered in South Carolina in 2017-18 and without having any statewide results to analyze, the Subcommittee recommends that South Carolina consider two approaches to simulate the results:
First, if a survey instrument is selected that will include national benchmark data, the student engagement survey results from schools in South Carolina could be compared to the national level. Schools at or above the national level would earn disproportionately more points. A second option is to divide the state results into quintiles or deciles and award points accordingly. The table below describes how points would be earned.
Rating Percentile Points Earned
Out of 10 Elementary & Middle
Schools
Points Earned Out of 7.5
High Schools Excellent Above 95th 10 7.5
90th to 95th 9 6.75
Good 80th 8 6.0
70th 7 5.25
Average 60th 6 4.5
50th 5 7.5
Below Average 40th 4 3.0
30th 3 2.25
Unsatisfactory 20th 2 1.5
10th 1 0.75

1
Amendment #1
Background
The Subcommittee deferred action on the methodology for English language proficiency (ELP) until staffs of the EOC and South Carolina Department of Education (SCDE) could collaborate on a proposal.
EOC Staff Recommendation
Under the Every Study Succeeds Act (ESSA), accountability for English language learners is now a component of Title I. States are required to adopt English language proficiency (ELP) standards derived from the four recognized domains of speaking, listening, reading and reading and that are aligned to the state’s academic standards. In addition, states must annually assess the progress of English language learners toward proficiency.
In reviewing the ESSA state plans of Tennessee and Louisiana, states with comparable numbers of English language learners, the EOC staff recommends that schools with at least 20 English language learners be held accountable for progress towards English proficiency of these students and that 10 percent or 10 points of the school’s overall rating reflect the achievement these students towards English proficiency. Schools will be held accountable for the progress of these students to proficiency using the ACCESS assessment, which is already adopted by the SCDE for measuring English language learners’ student’s progress toward proficiency. Proficiency is defined as achieving an ACCESS score of 4.4. It is further assumed that within five years of a student’s initial assessment as an English language learner that the student will achieve proficiency.
For accountability, the state will create annual expected proficiency targets based on each student’s initial English as a Second Language (ESL) score. If the student meets his or her expected proficiency target, then the student is determined to have progressed toward proficiency. At the school level, the state will find the percentage of all English language learners who have a current year ACCESS score that is at or higher than their target or expected ESL score.
Percent of Schools with ELP Rating
School Type Percent with ELP Rating
Elementary 41.6 Middle 45.5 High 44.4

2
Then based on the following criteria, the school will receive a rating for its English language proficiency indicator accordingly:
% Schools
Rating % Students Meeting
ELP Proficiency Target
Elementary Middle High
Excellent 80 to 100% 66.4 4.0 8.8 Good 70 to 79% 24.2 18.4 29.7
Average 60 to 69% 7.4 29.6 35.2 Below Average 50 to 59% 1.6 23.2 15.4 Unsatisfactory Less than 50% 0.4 24.8 11.0

1
Amendment #2
Background
The Subcommittees on August 16, 2017 did not address the target rating for this indicator. EOC Staff Recommendation
First, the EOC staff recommends that the high school indicator Prepared for Success be changed to College/Career Readiness to strengthen communication of the indicator. Then, to determine the percentage of high schools that receive an Excellent, Good, Average, Below Average, or Unsatisfactory rating on the College/Career Readiness indicator, the EOC staff proposes that high schools be evaluated against Goal One in the August 2017 draft ESSA plan:
By 2035, 90 percent of students will graduate “college, career, and citizenship ready” as outlined in the Profile of the South Carolina Graduate.
To date, only indicators of college-ready and career-ready have been established. Defining “citizenship ready” and the evidence to substantiate that students are “citizenship ready” will require additional analysis. Therefore, the EOC staff recommends that for each student graduating from public schools in 2018 and thereafter, that districts determine if the student was college ready or career ready based on multiple metrics. As the statewide longitudinal data system is built, the state will be able to determine if the multiple metrics are indicators that ultimately meet the requirements of Section 59-18-100 of the South Carolina Code of Laws:
All graduates should have the opportunity to qualify for and be prepared to succeed in entry-level, credit-bearing college courses, without the need for remedial coursework, postsecondary job training, or significant on-the-job
training.
The ratings would be based on objective criteria of meeting the state goal: Are 90% or greater of the students who graduate with a high school diploma college, career and citizenship ready? Because the goal is to be achieved by 2035, the EOC staff recommends that a school with an Excellent indicator for College/Career Readiness would be a high school where at least 80 percent of the high school graduates are college/career ready. A high school with an Unsatisfactory indicator for College/Career Readiness would be a high school where less than 50 percent of the high school graduates are college/career ready. Actual points earned will be determined at a later time when 2016-17 data are available for all indicators.

2
Rating % of High School
Graduates who are college or career
ready
Number of High Schools (Based on simulations using ONLY ACT and
WorkKeys for 2016 Graduating Cohort)
% High Schools
Excellent 80.0% or greater 27 12% Good 70.0% to 79.9% 49 23% Average 60.0% to 69.9% 60 28% Below Average 50.0% to 59.9% 35 16% Unsatisfactory Less than 50.0% 46 21%
Not included are: SAT scores, Advanced Placement scores, International Baccalaureate, industry credentials, dual enrollment/dual credit, nationally-recognized apprenticeships and ASVAB.
The EOC staff further recommends that the South Carolina Department of Education and the South Carolina Technical College System collaborate on an initiative to fund ACCUPLACER® scores for 12th grade students who want to pursue a postsecondary industry credential at a two-year technical college. The objective is to “count” as career ready in the future students who are academically prepared to succeed in and obtain an industry credential and who actually enroll in a course at a two-year college leading to the industry credential. The goal is to incentivize through accountability the academic preparation of students to obtain a postsecondary credential.


Amendment #3 Pursuant to Governor McMaster’s recommendations to the State Superintendent of Education on the state’s August draft ESSA state plan, Mr. Robinson offers the following amendment: Amend the points to be used in assessing the overall rating of high schools accordingly. The amendment would:
o Increase by 5 points the indicator College/Career Readiness; o Reduce by 5 points the indicator Academic Achievement, which are the end-of-
course assessments in English 1 and Algebra 1; and o Reduce by 2.5 points from the student survey and increase by 2.5 points the
Preparing for Success indicator.
Indicator Subcommittee Recommendation
Governor’s Recommendation
Academic Achievement 30/35 25/30 English Language Proficiency 10/0 10/0 Graduation Rate 25/30 25/30 Preparing for Success (Science & Social Studies)
7.5 10
College/Career Readiness 20 25 Positive and Effective Learning Environment (Student Survey)
7.5 5
TOTAL: 100 100
The net result is as follows: • 60% of the overall rating of a high school will be determined by academic achievement
on the end-of-course assessments in English 1 and Algebra 1; on-time graduation rate; and English language proficiency, if the school has at least twenty English language learners; and
• 40% of the overall rating of a high school will be determined by the percentage of high school graduates who are college/career ready; end-of-course assessments results in Biology 1 and US History and The Constitution; and results of the student survey.

Action Item: Approval of Overall School Ratings

1
Staff Recommendation for Overall Ratings for Schools
Sections 59-18-120 and 59-18-900(B) of the Education Accountability Act (EAA) as amended by Act 94 of 2017 require the Education Oversight Committee to determine the overall performance rating of schools on a 100-point scale. By law, schools must receive an overall rating of Excellent, Good, Average, Below Average or Unsatisfactory as defined below. Section 59-18-900(B) establishes the performance ratings by which schools will be rated:
Excellent – School performance substantially exceeds the criteria to ensure all students meet the Profile of the South Carolina Graduate; Good – School performance exceeds the criteria to ensure all students meet the Profile of the South Carolina Graduate;
Average – School performance meets the criteria to ensure all students meet the Profile of the South Carolina Graduate; Below Average – School performance is in jeopardy of not meeting the criteria to ensure all students meet the Profile of the South Carolina Graduate; and Unsatisfactory – School performance fails to meet the criteria to ensure all students meet the Profile of the South Carolina Graduate.
The proposed system of accountability will provide ratings for schools in various indicators of effectiveness (i.e., academic achievement, academic growth, graduation rate, college/career readiness, etc.) Each school will also receive an overall rating of Excellent, Good, Average, Below Average, or Unsatisfactory. The ultimate question is: how many points out of a possible 100 points should a school receive to meet the statutory definition of Excellent, Good, Average, Below Average or Unsatisfactory? The EOC staff consulted the state ESSA plans of other states and conducted officials in other states. For example, the state of Maryland is also considering a one-hundred-point system to

2
evaluate the performance of schools. Out of the 100-points, Maryland will report the following information:
Reporting Mechanism Example Total Score 75 out of 100
Percentile Rank 80th Final Category
(Number of Stars Earned out of Maximum of 5) ***
Currently, the state of Georgia uses an A to F grading and is working to adhere the overall ratings to the standard grading scale:
Grade Points Needed for Grade A 90-100 B 80-89 C 70-79 D 60-69 F Below 60
Others offered the following advice:
• The ratings need to make political and pragmatic sense. • South Carolina could consider the normal grading scale. However, if a disproportionate
number of schools are identified as underperforming, will the state have the political will or resources to intervene?
• A normal distribution curve could be easily defended; however, discussions of a normal distribution in January of 2017 were not adopted by the EOC.
• South Carolina could consider a statistical model to determine the mean and then how many schools fall within one or two standard deviations of the mean. This model is statistically sound but may not be transparent to the public.
Complicating the process for the EOC is the fact that no data from the 2016-17 school year is available to analyze by the EOC staff. And, the EOC is under a deadline. The ESSA state plan is due to the United States Department of Education on September 18, 2017.
Therefore, the EOC staff recommends that the EOC consider using NAEP results to identify overall performance levels of schools accordingly:

3
2015 NAEP Results for South Carolina
4th Grade % SC Students at each Achievement Level on NAEP
Reading Math Advanced 8 6 Proficient 25 31 Basic 31 43 Below Basic 35 21
8th Grade
% SC Students at each Achievement Level on NAEP Reading Math Advanced 2 5 Proficient 26 20 Basic 44 40 Below Basic 29 35
According to NAEP, students performing at or above the Proficient level on NAEP assessments demonstrate solid academic performance and competency over challenging subject matter. 1
Achievement Level Policy Definitions
Advanced Superior performance
Proficient Solid academic performance for each grade assessed. Students reaching this level have demonstrated competency over challenging subject matter, including subject-matter knowledge, application of such knowledge to real-world situations, and analytical skills appropriate to the subject matter.
Basic Partial mastery of prerequisite knowledge and skills that are fundamental for proficient work at each grade.
1 https://www.nationsreportcard.gov/reading_math_2015/#?grade=4 and https://nces.ed.gov/nationsreportcard/achievement.aspx

4
Staff Recommendation: Looking at student performance in South Carolina on NAEP in 2015 (NAEP 2017 scores will be released in October of 2017), the overall school ratings would follow the NAEP percentages as noted below. The cut points that will be established using 2016-17 assessment data will reflect these percentages and will be not be increased in rigor for at least five school years or unless amendments to ESSA or the EAA are enacted. Furthermore, of the 10 percent of schools identified as Unsatisfactory, the EOC staff would recommend that the bottom 5% be identified for comprehensive support and the next 5% for targeted support. The EOC staff recommends that the South Carolina Department of Education be given flexibility to determine the intervention strategies to implement in these Unsatisfactory districts schools considering the leadership capacity of the district office, the local school board of trustees, and the ability of the districts in which these schools are located to allocate local resources to the underperforming schools. A one-size-fits-all approach to intervention in schools is not recommended.
Recommendation for Overall School Ratings
2015 NAEP Performance in SC % SC Schools and Ratings for 2017-18
25 to 37% Proficient and Advanced
Excellent – 15% Good – 20%
31 to 44% Basic Average – 35%
21 to 35% Below Basic Below Average – 20% Unsatisfactory – 10%

10 145 14
21 295 14
35 490 14
20 280 14
14 190 14
Q1 Based upon your professional judgment, what percentage of allelementary, middle and high schools in South Carolina currently meet the
statutory definition of an Excellent, Good, Average, Below Average orUnsatisfactory rating? Please enter only whole numbers without the
percentage sign. Numbers must add to 100.Answered: 14 Skipped: 15
Total Respondents: 14
Excellent
Good
Average
Below Average
Unsatisfactory
0 10 20 30 40 50
ANSWER CHOICES AVERAGE NUMBER TOTAL NUMBER RESPONSES
Excellent
Good
Average
Below Average
Unsatisfactory
1 / 4
Survey of SC District Superintendents on School Accountability

14 202 14
23 323 14
36 500 14
15 215 14
11 160 14
Q2 Thinking ahead to five years, what percentage of all elementary,middle and high schools in South Carolina will meet the statutory
definition of an Excellent, Good, Average, Below Average orUnsatisfactory rating by 2022? Please enter only whole numbers without
the percentage sign. Numbers must add to 100.Answered: 14 Skipped: 15
Total Respondents: 14
Excellent
Good
Average
Below Average
Unsatisfactory
0 10 20 30 40 50
ANSWER CHOICES AVERAGE NUMBER TOTAL NUMBER RESPONSES
Excellent
Good
Average
Below Average
Unsatisfactory
2 / 4
Survey of SC District Superintendents on School Accountability

Q1 Based upon your professional judgment, whatpercentage of all elementary, middle and high schools inSouth Carolina currently meet the statutory definition ofan Excellent, Good, Average, Below Average orUnsatisfactory rating? Please enter only whole numberswithout the percentage sign. Numbers must add to 100.
Excellent 20Good 30Average 20Below Average 15Unsatisfactory 15
Q2 Thinking ahead to five years, what percentage of allelementary, middle and high schools in South Carolina willmeet the statutory definition of an Excellent, Good,Average, Below Average or Unsatisfactory rating by2022? Please enter only whole numbers without thepercentage sign. Numbers must add to 100.
Excellent 30Good 30Average 25Below Average 15Unsatisfactory 0
Q3 What other information, data, etc. should the EOC consult to make these determinations? Please be specific.
all state and nationally normed tests that aree given
Q4 Do you have comments on the accountability framework or any of the indicators?
none
#1#1COMPLETECOMPLETE
Collector:Collector: Web Link 1 Web Link 1 (Web Link)(Web Link)Started:Started: Friday, August 25, 2017 12:06:57 PMFriday, August 25, 2017 12:06:57 PMLast Modified:Last Modified: Friday, August 25, 2017 12:09:23 PMFriday, August 25, 2017 12:09:23 PMTime Spent:Time Spent: 00:02:2500:02:25IP Address:IP Address: 204.116.212.124204.116.212.124
Page 1: August 2017 Survey of School Districts - please respond by Friday, Sept. 1
1 / 30
Survey of SC District Superintendents on School Accountability

Q1 Based upon your professional judgment, whatpercentage of all elementary, middle and high schools inSouth Carolina currently meet the statutory definition ofan Excellent, Good, Average, Below Average orUnsatisfactory rating? Please enter only whole numberswithout the percentage sign. Numbers must add to 100.
Excellent 10Good 25Average 50Below Average 10Unsatisfactory 5
Q2 Thinking ahead to five years, what percentage of allelementary, middle and high schools in South Carolina willmeet the statutory definition of an Excellent, Good,Average, Below Average or Unsatisfactory rating by2022? Please enter only whole numbers without thepercentage sign. Numbers must add to 100.
Excellent 25Good 35Average 30Below Average 5Unsatisfactory 5
Q3 What other information, data, etc. should the EOC consult to make these determinations? Please be specific.
Student growth. A measure to compare how individuals have grown individually.
Q4 Do you have comments on the accountabilityframework or any of the indicators?
Respondent skipped this question
#2#2COMPLETECOMPLETE
Collector:Collector: Web Link 1 Web Link 1 (Web Link)(Web Link)Started:Started: Friday, August 25, 2017 12:26:54 PMFriday, August 25, 2017 12:26:54 PMLast Modified:Last Modified: Friday, August 25, 2017 12:33:42 PMFriday, August 25, 2017 12:33:42 PMTime Spent:Time Spent: 00:06:4700:06:47IP Address:IP Address: 165.166.57.90165.166.57.90
Page 1: August 2017 Survey of School Districts - please respond by Friday, Sept. 1
2 / 30
Survey of SC District Superintendents on School Accountability

Q1 Based upon your professional judgment, whatpercentage of all elementary, middle and high schools inSouth Carolina currently meet the statutory definition ofan Excellent, Good, Average, Below Average orUnsatisfactory rating? Please enter only whole numberswithout the percentage sign. Numbers must add to 100.
Excellent 5Good 15Average 50Below Average 25Unsatisfactory 5
Q2 Thinking ahead to five years, what percentage of allelementary, middle and high schools in South Carolina willmeet the statutory definition of an Excellent, Good,Average, Below Average or Unsatisfactory rating by2022? Please enter only whole numbers without thepercentage sign. Numbers must add to 100.
Excellent 12Good 18Average 45Below Average 20Unsatisfactory 5
Q3 What other information, data, etc. should the EOC consult to make these determinations? Please be specific.
Socioeconomic factors, Staff credentials and experience, curriculum
Q4 Do you have comments on the accountabilityframework or any of the indicators?
Respondent skipped this question
#3#3COMPLETECOMPLETE
Collector:Collector: Web Link 1 Web Link 1 (Web Link)(Web Link)Started:Started: Friday, August 25, 2017 12:52:34 PMFriday, August 25, 2017 12:52:34 PMLast Modified:Last Modified: Friday, August 25, 2017 1:02:53 PMFriday, August 25, 2017 1:02:53 PMTime Spent:Time Spent: 00:10:1800:10:18IP Address:IP Address: 204.116.213.193204.116.213.193
Page 1: August 2017 Survey of School Districts - please respond by Friday, Sept. 1
3 / 30
Survey of SC District Superintendents on School Accountability

Q1 Based upon your professional judgment, whatpercentage of all elementary, middle and high schools inSouth Carolina currently meet the statutory definition ofan Excellent, Good, Average, Below Average orUnsatisfactory rating? Please enter only whole numberswithout the percentage sign. Numbers must add to 100.
Excellent 25Good 25Average 25Below Average 20Unsatisfactory 5
Q2 Thinking ahead to five years, what percentage of allelementary, middle and high schools in South Carolina willmeet the statutory definition of an Excellent, Good,Average, Below Average or Unsatisfactory rating by2022? Please enter only whole numbers without thepercentage sign. Numbers must add to 100.
Excellent 25Good 25Average 30Below Average 15Unsatisfactory 5
Q3 What other information, data, etc. should the EOC consult to make these determinations? Please be specific.
Poverty Levels, CATE completers and Industry Certifications for Non-diploma track students (special needs), drop counting Non-diplomatrack students as non-graduates (0 in grad-rate), Include other assessment measures- not one single measure.
Q4 Do you have comments on the accountability framework or any of the indicators?
Currently, your percentages can be almost aligned to poverty levels. Focus on Growth Models using multiple measures.
#4#4COMPLETECOMPLETE
Collector:Collector: Web Link 1 Web Link 1 (Web Link)(Web Link)Started:Started: Friday, August 25, 2017 12:49:55 PMFriday, August 25, 2017 12:49:55 PMLast Modified:Last Modified: Friday, August 25, 2017 1:03:14 PMFriday, August 25, 2017 1:03:14 PMTime Spent:Time Spent: 00:13:1900:13:19IP Address:IP Address: 206.74.6.2206.74.6.2
Page 1: August 2017 Survey of School Districts - please respond by Friday, Sept. 1
4 / 30
Survey of SC District Superintendents on School Accountability

Q1 Based upon your professional judgment, whatpercentage of all elementary, middle and high schools inSouth Carolina currently meet the statutory definition ofan Excellent, Good, Average, Below Average orUnsatisfactory rating? Please enter only whole numberswithout the percentage sign. Numbers must add to 100.
Respondent skipped this question
Q2 Thinking ahead to five years, what percentage of allelementary, middle and high schools in South Carolina willmeet the statutory definition of an Excellent, Good,Average, Below Average or Unsatisfactory rating by2022? Please enter only whole numbers without thepercentage sign. Numbers must add to 100.
Respondent skipped this question
Q3 What other information, data, etc. should the EOCconsult to make these determinations? Please be specific.
Respondent skipped this question
Q4 Do you have comments on the accountability framework or any of the indicators?
We continue to develop accountability models that measures the populations that schools serve in lieu of the effectiveness of said institutions. Therefore, schools that serve the most affluent populations are judged to be the most effective, while schools that serve students with the most significant social and economic challenges are labels as the least effective. This is a flawed and invalid process. An effective system should measure the educational institution, not the communities in which they serve.
#5#5COMPLETECOMPLETE
Collector:Collector: Web Link 1 Web Link 1 (Web Link)(Web Link)Started:Started: Friday, August 25, 2017 1:02:20 PMFriday, August 25, 2017 1:02:20 PMLast Modified:Last Modified: Friday, August 25, 2017 1:08:47 PMFriday, August 25, 2017 1:08:47 PMTime Spent:Time Spent: 00:06:2600:06:26IP Address:IP Address: 165.166.13.98165.166.13.98
Page 1: August 2017 Survey of School Districts - please respond by Friday, Sept. 1
5 / 30
Survey of SC District Superintendents on School Accountability

Q1 Based upon your professional judgment, whatpercentage of all elementary, middle and high schools inSouth Carolina currently meet the statutory definition ofan Excellent, Good, Average, Below Average orUnsatisfactory rating? Please enter only whole numberswithout the percentage sign. Numbers must add to 100.
Excellent 15Good 20Average 30Below Average 20Unsatisfactory 15
Q2 Thinking ahead to five years, what percentage of allelementary, middle and high schools in South Carolina willmeet the statutory definition of an Excellent, Good,Average, Below Average or Unsatisfactory rating by2022? Please enter only whole numbers without thepercentage sign. Numbers must add to 100.
Excellent 20Good 25Average 35Below Average 15Unsatisfactory 5
Q3 What other information, data, etc. should the EOCconsult to make these determinations? Please be specific.
Respondent skipped this question
Q4 Do you have comments on the accountabilityframework or any of the indicators?
Respondent skipped this question
#6#6COMPLETECOMPLETE
Collector:Collector: Web Link 1 Web Link 1 (Web Link)(Web Link)Started:Started: Friday, August 25, 2017 1:24:37 PMFriday, August 25, 2017 1:24:37 PMLast Modified:Last Modified: Friday, August 25, 2017 1:30:34 PMFriday, August 25, 2017 1:30:34 PMTime Spent:Time Spent: 00:05:5700:05:57IP Address:IP Address: 52.206.255.17352.206.255.173
Page 1: August 2017 Survey of School Districts - please respond by Friday, Sept. 1
6 / 30
Survey of SC District Superintendents on School Accountability

Q1 Based upon your professional judgment, whatpercentage of all elementary, middle and high schools inSouth Carolina currently meet the statutory definition ofan Excellent, Good, Average, Below Average orUnsatisfactory rating? Please enter only whole numberswithout the percentage sign. Numbers must add to 100.
Excellent 10Good 20Average 50Below Average 10Unsatisfactory 10
Q2 Thinking ahead to five years, what percentage of allelementary, middle and high schools in South Carolina willmeet the statutory definition of an Excellent, Good,Average, Below Average or Unsatisfactory rating by2022? Please enter only whole numbers without thepercentage sign. Numbers must add to 100.
Excellent 10Good 30Average 40Below Average 10Unsatisfactory 10
Q3 What other information, data, etc. should the EOC consult to make these determinations? Please be specific.
MAP and all data that is gathered on each child.
Q4 Do you have comments on the accountability framework or any of the indicators?
We need to be realistic and fair to all students and schools, regardless of location and poverty.
#7#7COMPLETECOMPLETE
Collector:Collector: Web Link 1 Web Link 1 (Web Link)(Web Link)Started:Started: Friday, August 25, 2017 1:27:13 PMFriday, August 25, 2017 1:27:13 PMLast Modified:Last Modified: Friday, August 25, 2017 1:31:39 PMFriday, August 25, 2017 1:31:39 PMTime Spent:Time Spent: 00:04:2600:04:26IP Address:IP Address: 204.116.213.128204.116.213.128
Page 1: August 2017 Survey of School Districts - please respond by Friday, Sept. 1
7 / 30
Survey of SC District Superintendents on School Accountability

Q1 Based upon your professional judgment, whatpercentage of all elementary, middle and high schools inSouth Carolina currently meet the statutory definition ofan Excellent, Good, Average, Below Average orUnsatisfactory rating? Please enter only whole numberswithout the percentage sign. Numbers must add to 100.
Excellent 10Good 30Average 30Below Average 20Unsatisfactory 10
Q2 Thinking ahead to five years, what percentage of allelementary, middle and high schools in South Carolina willmeet the statutory definition of an Excellent, Good,Average, Below Average or Unsatisfactory rating by2022? Please enter only whole numbers without thepercentage sign. Numbers must add to 100.
Excellent 20Good 30Average 30Below Average 10Unsatisfactory 10
Q3 What other information, data, etc. should the EOC consult to make these determinations? Please be specific.
Overall achievement AND student growth must be taken in account. Also a realization that the higher a school achieves, the less room there is for higher growth, and vice versa. The formula must be sophisticated enough to take these variables into account.
Q4 Do you have comments on the accountability framework or any of the indicators?
no
#8#8COMPLETECOMPLETE
Collector:Collector: Web Link 1 Web Link 1 (Web Link)(Web Link)Started:Started: Friday, August 25, 2017 1:28:52 PMFriday, August 25, 2017 1:28:52 PMLast Modified:Last Modified: Friday, August 25, 2017 1:33:50 PMFriday, August 25, 2017 1:33:50 PMTime Spent:Time Spent: 00:04:5800:04:58IP Address:IP Address: 204.116.29.61204.116.29.61
Page 1: August 2017 Survey of School Districts - please respond by Friday, Sept. 1
8 / 30
Survey of SC District Superintendents on School Accountability

Q1 Based upon your professional judgment, whatpercentage of all elementary, middle and high schools inSouth Carolina currently meet the statutory definition ofan Excellent, Good, Average, Below Average orUnsatisfactory rating? Please enter only whole numberswithout the percentage sign. Numbers must add to 100.
Excellent 10Good 20Average 40Below Average 20Unsatisfactory 10
Q2 Thinking ahead to five years, what percentage of allelementary, middle and high schools in South Carolina willmeet the statutory definition of an Excellent, Good,Average, Below Average or Unsatisfactory rating by2022? Please enter only whole numbers without thepercentage sign. Numbers must add to 100.
Excellent 10Good 10Average 40Below Average 20Unsatisfactory 20
Q3 What other information, data, etc. should the EOC consult to make these determinations? Please be specific.
Anecdotal information about the school's initiatives tell a far richer story than test scores alone. There needs to be a "We are Proud of..." section to enumerate what programs and efforts are underway for improving or sustaining current performance.
Q4 Do you have comments on the accountability framework or any of the indicators?
Reports such as these hold great sway in affluent, growing, and prosperous communities. It often segregates effort into community economic ability more so than its academic ability. We must be careful to remember this...numbers hold great power and it is how we use that power for the overall good of the state and not further divide the state into the "Haves" and Have Nots."
#9#9COMPLETECOMPLETE
Collector:Collector: Web Link 1 Web Link 1 (Web Link)(Web Link)Started:Started: Friday, August 25, 2017 1:50:22 PMFriday, August 25, 2017 1:50:22 PMLast Modified:Last Modified: Friday, August 25, 2017 1:57:42 PMFriday, August 25, 2017 1:57:42 PMTime Spent:Time Spent: 00:07:1900:07:19IP Address:IP Address: 204.116.211.94204.116.211.94
Page 1: August 2017 Survey of School Districts - please respond by Friday, Sept. 1
9 / 30
Survey of SC District Superintendents on School Accountability

Q1 Based upon your professional judgment, whatpercentage of all elementary, middle and high schools inSouth Carolina currently meet the statutory definition ofan Excellent, Good, Average, Below Average orUnsatisfactory rating? Please enter only whole numberswithout the percentage sign. Numbers must add to 100.
Excellent 10Good 20Average 45Below Average 15Unsatisfactory 10
Q2 Thinking ahead to five years, what percentage of allelementary, middle and high schools in South Carolina willmeet the statutory definition of an Excellent, Good,Average, Below Average or Unsatisfactory rating by2022? Please enter only whole numbers without thepercentage sign. Numbers must add to 100.
Excellent 10Good 25Average 50Below Average 10Unsatisfactory 5
Q3 What other information, data, etc. should the EOCconsult to make these determinations? Please be specific.
Respondent skipped this question
Q4 Do you have comments on the accountabilityframework or any of the indicators?
Respondent skipped this question
#10#10COMPLETECOMPLETE
Collector:Collector: Web Link 1 Web Link 1 (Web Link)(Web Link)Started:Started: Friday, August 25, 2017 3:30:43 PMFriday, August 25, 2017 3:30:43 PMLast Modified:Last Modified: Friday, August 25, 2017 3:32:33 PMFriday, August 25, 2017 3:32:33 PMTime Spent:Time Spent: 00:01:4900:01:49IP Address:IP Address: 204.116.212.194204.116.212.194
Page 1: August 2017 Survey of School Districts - please respond by Friday, Sept. 1
10 / 30
Survey of SC District Superintendents on School Accountability

Q1 Based upon your professional judgment, whatpercentage of all elementary, middle and high schools inSouth Carolina currently meet the statutory definition ofan Excellent, Good, Average, Below Average orUnsatisfactory rating? Please enter only whole numberswithout the percentage sign. Numbers must add to 100.
Respondent skipped this question
Q2 Thinking ahead to five years, what percentage of allelementary, middle and high schools in South Carolina willmeet the statutory definition of an Excellent, Good,Average, Below Average or Unsatisfactory rating by2022? Please enter only whole numbers without thepercentage sign. Numbers must add to 100.
Respondent skipped this question
Q3 What other information, data, etc. should the EOCconsult to make these determinations? Please be specific.
Respondent skipped this question
Q4 Do you have comments on the accountability framework or any of the indicators?
The entire thing has been shoved down our throats...It will be used eventually to justify vouchers for non-accountable private schools. We have been sold out by the EOC, the State Superintendent, and the General Assembly.
#11#11COMPLETECOMPLETE
Collector:Collector: Web Link 1 Web Link 1 (Web Link)(Web Link)Started:Started: Friday, August 25, 2017 3:49:38 PMFriday, August 25, 2017 3:49:38 PMLast Modified:Last Modified: Friday, August 25, 2017 3:51:52 PMFriday, August 25, 2017 3:51:52 PMTime Spent:Time Spent: 00:02:1400:02:14IP Address:IP Address: 204.116.211.61204.116.211.61
Page 1: August 2017 Survey of School Districts - please respond by Friday, Sept. 1
11 / 30
Survey of SC District Superintendents on School Accountability

Q1 Based upon your professional judgment, whatpercentage of all elementary, middle and high schools inSouth Carolina currently meet the statutory definition ofan Excellent, Good, Average, Below Average orUnsatisfactory rating? Please enter only whole numberswithout the percentage sign. Numbers must add to 100.
Excellent 5Good 15Average 20Below Average 20Unsatisfactory 40
Q2 Thinking ahead to five years, what percentage of allelementary, middle and high schools in South Carolina willmeet the statutory definition of an Excellent, Good,Average, Below Average or Unsatisfactory rating by2022? Please enter only whole numbers without thepercentage sign. Numbers must add to 100.
Excellent 5Good 5Average 20Below Average 25Unsatisfactory 45
Q3 What other information, data, etc. should the EOC consult to make these determinations? Please be specific.
Number of highly qualified teachers, teachers and principals turnover.
Q4 Do you have comments on the accountability framework or any of the indicators?
No
#12#12COMPLETECOMPLETE
Collector:Collector: Web Link 1 Web Link 1 (Web Link)(Web Link)Started:Started: Friday, August 25, 2017 4:23:43 PMFriday, August 25, 2017 4:23:43 PMLast Modified:Last Modified: Friday, August 25, 2017 4:44:11 PMFriday, August 25, 2017 4:44:11 PMTime Spent:Time Spent: 00:20:2800:20:28IP Address:IP Address: 107.77.234.53107.77.234.53
Page 1: August 2017 Survey of School Districts - please respond by Friday, Sept. 1
12 / 30
Survey of SC District Superintendents on School Accountability

Q1 Based upon your professional judgment, whatpercentage of all elementary, middle and high schools inSouth Carolina currently meet the statutory definition ofan Excellent, Good, Average, Below Average orUnsatisfactory rating? Please enter only whole numberswithout the percentage sign. Numbers must add to 100.
Respondent skipped this question
Q2 Thinking ahead to five years, what percentage of allelementary, middle and high schools in South Carolina willmeet the statutory definition of an Excellent, Good,Average, Below Average or Unsatisfactory rating by2022? Please enter only whole numbers without thepercentage sign. Numbers must add to 100.
Respondent skipped this question
Q3 What other information, data, etc. should the EOC consult to make these determinations? Please be specific.
The EOC should not set arbitrary criteria in order to label schools. This is a forced Bell curve, which is something the EOC disavowed last spring and it should not be resurrected. If schools meet objective criteria they should all 100% be able to achieve the status of excellent
Q4 Do you have comments on the accountabilityframework or any of the indicators?
Respondent skipped this question
#13#13COMPLETECOMPLETE
Collector:Collector: Web Link 1 Web Link 1 (Web Link)(Web Link)Started:Started: Friday, August 25, 2017 4:47:40 PMFriday, August 25, 2017 4:47:40 PMLast Modified:Last Modified: Friday, August 25, 2017 4:49:49 PMFriday, August 25, 2017 4:49:49 PMTime Spent:Time Spent: 00:02:0800:02:08IP Address:IP Address: 165.166.60.130165.166.60.130
Page 1: August 2017 Survey of School Districts - please respond by Friday, Sept. 1
13 / 30
Survey of SC District Superintendents on School Accountability

Q1 Based upon your professional judgment, whatpercentage of all elementary, middle and high schools inSouth Carolina currently meet the statutory definition ofan Excellent, Good, Average, Below Average orUnsatisfactory rating? Please enter only whole numberswithout the percentage sign. Numbers must add to 100.
Respondent skipped this question
Q2 Thinking ahead to five years, what percentage of allelementary, middle and high schools in South Carolina willmeet the statutory definition of an Excellent, Good,Average, Below Average or Unsatisfactory rating by2022? Please enter only whole numbers without thepercentage sign. Numbers must add to 100.
Respondent skipped this question
Q3 What other information, data, etc. should the EOCconsult to make these determinations? Please be specific.
Respondent skipped this question
Q4 Do you have comments on the accountability framework or any of the indicators?
I strongly believe that if we indicate a certain percentage of schools that will/can be in a certain rating, we are making a mistake as a state. There should be a criteria set for schools/districts to be in a certain rating with no limit to the percentage of schools that can fall in a particular rating.
#14#14COMPLETECOMPLETE
Collector:Collector: Web Link 1 Web Link 1 (Web Link)(Web Link)Started:Started: Friday, August 25, 2017 11:03:08 PMFriday, August 25, 2017 11:03:08 PMLast Modified:Last Modified: Friday, August 25, 2017 11:08:37 PMFriday, August 25, 2017 11:08:37 PMTime Spent:Time Spent: 00:05:2900:05:29IP Address:IP Address: 208.104.48.15208.104.48.15
Page 1: August 2017 Survey of School Districts - please respond by Friday, Sept. 1
14 / 30
Survey of SC District Superintendents on School Accountability

Q1 Based upon your professional judgment, whatpercentage of all elementary, middle and high schools inSouth Carolina currently meet the statutory definition ofan Excellent, Good, Average, Below Average orUnsatisfactory rating? Please enter only whole numberswithout the percentage sign. Numbers must add to 100.
Excellent 5Good 15Average 30Below Average 30Unsatisfactory 20
Q2 Thinking ahead to five years, what percentage of allelementary, middle and high schools in South Carolina willmeet the statutory definition of an Excellent, Good,Average, Below Average or Unsatisfactory rating by2022? Please enter only whole numbers without thepercentage sign. Numbers must add to 100.
Excellent 5Good 15Average 30Below Average 30Unsatisfactory 20
Q3 What other information, data, etc. should the EOC consult to make these determinations? Please be specific.
EVAAS growth ratings
Q4 Do you have comments on the accountability framework or any of the indicators?
Go big and do not relent on high expectations, accountability and transparency
#15#15COMPLETECOMPLETE
Collector:Collector: Web Link 1 Web Link 1 (Web Link)(Web Link)Started:Started: Saturday, August 26, 2017 12:18:08 PMSaturday, August 26, 2017 12:18:08 PMLast Modified:Last Modified: Saturday, August 26, 2017 12:24:09 PMSaturday, August 26, 2017 12:24:09 PMTime Spent:Time Spent: 00:06:0100:06:01IP Address:IP Address: 162.205.148.106162.205.148.106
Page 1: August 2017 Survey of School Districts - please respond by Friday, Sept. 1
15 / 30
Survey of SC District Superintendents on School Accountability

Q1 Based upon your professional judgment, whatpercentage of all elementary, middle and high schools inSouth Carolina currently meet the statutory definition ofan Excellent, Good, Average, Below Average orUnsatisfactory rating? Please enter only whole numberswithout the percentage sign. Numbers must add to 100.
Respondent skipped this question
Q2 Thinking ahead to five years, what percentage of allelementary, middle and high schools in South Carolina willmeet the statutory definition of an Excellent, Good,Average, Below Average or Unsatisfactory rating by2022? Please enter only whole numbers without thepercentage sign. Numbers must add to 100.
Respondent skipped this question
Q3 What other information, data, etc. should the EOC consult to make these determinations? Please be specific.
I do not see how soliciting the speculative opinion as to the percentage of schools currently or five years into the future provides any useful information. If the EOC truly desires the professional opinion of superintendents then the EOC members and staff should engage in a discussion with the superintendent's association.
Q4 Do you have comments on the accountability framework or any of the indicators?
The EOC needs to work collaboratively with the SCASA membership to obtain input not via a four question survey that seems to providelittle or no meaningful information.
#16#16COMPLETECOMPLETE
Collector:Collector: Web Link 1 Web Link 1 (Web Link)(Web Link)Started:Started: Saturday, August 26, 2017 12:20:50 PMSaturday, August 26, 2017 12:20:50 PMLast Modified:Last Modified: Saturday, August 26, 2017 12:30:44 PMSaturday, August 26, 2017 12:30:44 PMTime Spent:Time Spent: 00:09:5300:09:53IP Address:IP Address: 108.206.54.159108.206.54.159
Page 1: August 2017 Survey of School Districts - please respond by Friday, Sept. 1
16 / 30
Survey of SC District Superintendents on School Accountability

Q1 Based upon your professional judgment, whatpercentage of all elementary, middle and high schools inSouth Carolina currently meet the statutory definition ofan Excellent, Good, Average, Below Average orUnsatisfactory rating? Please enter only whole numberswithout the percentage sign. Numbers must add to 100.
Respondent skipped this question
Q2 Thinking ahead to five years, what percentage of allelementary, middle and high schools in South Carolina willmeet the statutory definition of an Excellent, Good,Average, Below Average or Unsatisfactory rating by2022? Please enter only whole numbers without thepercentage sign. Numbers must add to 100.
Respondent skipped this question
Q3 What other information, data, etc. should the EOC consult to make these determinations? Please be specific.
I surely wish the majority of South Carolina's youth could score at average and above levels. I think this will be possible if we see student growth as a process along a developmental continuum. I don't know, either for my own children or for those of other parents, how to make certain that every 10-year-old can perform ELA and mathematics tasks at a certain level by a certain month in a given year and that, regrettably, is what the federal accountability system requires. If: a) educators are well-prepared to teach ALL children, including those from multi-generational poverty; b) there is a prevailing growth mindset and culture of achievement; c) evidence-based interventions and supports are provided for all children starting at an early age and continued through adolescence, THEN I believe the vast majority of children will demonstrate skill levels essential for career, college and citizenship readiness.
#17#17COMPLETECOMPLETE
Collector:Collector: Web Link 1 Web Link 1 (Web Link)(Web Link)Started:Started: Saturday, August 26, 2017 6:14:13 PMSaturday, August 26, 2017 6:14:13 PMLast Modified:Last Modified: Saturday, August 26, 2017 6:31:57 PMSaturday, August 26, 2017 6:31:57 PMTime Spent:Time Spent: 00:17:4400:17:44IP Address:IP Address: 173.93.224.251173.93.224.251
Page 1: August 2017 Survey of School Districts - please respond by Friday, Sept. 1
17 / 30
Survey of SC District Superintendents on School Accountability

Q4 Do you have comments on the accountability framework or any of the indicators?
1. I would like to be able to attend a session in which both EOD and SDE officials explain the federal requirements and options available.2. Developing more authentic measures of higher order thinking skills and student acquisition of essential workplace/societal skills would provide a more well-rounded view of the well being of South Carolina's youth. The indicators could then be expanded from such narrowly focused academic tests.3. I am in Charleston County Schools. It is likely that, when the accountability calculations are completed, we will have schools among the highest performing and the lowest performing in the state. Many schools are identifiable based on only race and poverty levels. The correlation between poverty and achievement is well documented. I worry that school assessment systems, if not very carefully constructed, exacerbate negative stereotyping based on race (and poverty, though at least in our district, race and poverty are often tragically intertwined). 4. We need a RESEARCH AND DEVELOPMENT effort connected with the accountability system. The most important work isn't pointing out where our students aren't faring well; it's using assessments to spot programs and approaches that are making an outsized difference for segments of student populations that are underperforming overall, and then helping to spread those practices across districts and states. There is too much emphasis on results, and not enough emphasis on cost-effective and interventions that can reasonably be replicated.5. We are all ANSWERABLE. In order to make a difference, we need LEADING indicators as well as lagging indicators. Our state is investing primarily in lagging indicators. These kinds of assessments are of very little use to teachers, students and parents.
18 / 30
Survey of SC District Superintendents on School Accountability

Q1 Based upon your professional judgment, whatpercentage of all elementary, middle and high schools inSouth Carolina currently meet the statutory definition ofan Excellent, Good, Average, Below Average orUnsatisfactory rating? Please enter only whole numberswithout the percentage sign. Numbers must add to 100.
Excellent 5Good 30Average 40Below Average 20Unsatisfactory 5
Q2 Thinking ahead to five years, what percentage of allelementary, middle and high schools in South Carolina willmeet the statutory definition of an Excellent, Good,Average, Below Average or Unsatisfactory rating by2022? Please enter only whole numbers without thepercentage sign. Numbers must add to 100.
Excellent 5Good 35Average 50Below Average 5Unsatisfactory 5
Q3 What other information, data, etc. should the EOCconsult to make these determinations? Please be specific.
Respondent skipped this question
Q4 Do you have comments on the accountabilityframework or any of the indicators?
Respondent skipped this question
#18#18COMPLETECOMPLETE
Collector:Collector: Web Link 1 Web Link 1 (Web Link)(Web Link)Started:Started: Sunday, August 27, 2017 11:22:22 AMSunday, August 27, 2017 11:22:22 AMLast Modified:Last Modified: Sunday, August 27, 2017 11:26:28 AMSunday, August 27, 2017 11:26:28 AMTime Spent:Time Spent: 00:04:0600:04:06IP Address:IP Address: 64.53.103.10564.53.103.105
Page 1: August 2017 Survey of School Districts - please respond by Friday, Sept. 1
19 / 30
Survey of SC District Superintendents on School Accountability

Q1 Based upon your professional judgment, whatpercentage of all elementary, middle and high schools inSouth Carolina currently meet the statutory definition ofan Excellent, Good, Average, Below Average orUnsatisfactory rating? Please enter only whole numberswithout the percentage sign. Numbers must add to 100.
Respondent skipped this question
Q2 Thinking ahead to five years, what percentage of allelementary, middle and high schools in South Carolina willmeet the statutory definition of an Excellent, Good,Average, Below Average or Unsatisfactory rating by2022? Please enter only whole numbers without thepercentage sign. Numbers must add to 100.
Respondent skipped this question
Q3 What other information, data, etc. should the EOC consult to make these determinations? Please be specific.
Why I appreciate being asked or surveyed on this issue, I am most unsure of the merit or value of providing this information to the EOC now, based on the decisions previous made..........the bell curve primarily
Q4 Do you have comments on the accountability framework or any of the indicators?
I feel a more thorough and thoughtful review on any recent changes would be necessary prior to me providing answers to this survey would be prudent. I would be hopeful that the percentage of excellent, good and average schools could be, slightly higher, and therefore, the below average and unsatisfactory could decrease slightly. Some further discussion with superintendents group would be a wise decision.
#19#19COMPLETECOMPLETE
Collector:Collector: Web Link 1 Web Link 1 (Web Link)(Web Link)Started:Started: Monday, August 28, 2017 2:32:35 PMMonday, August 28, 2017 2:32:35 PMLast Modified:Last Modified: Monday, August 28, 2017 2:53:50 PMMonday, August 28, 2017 2:53:50 PMTime Spent:Time Spent: 00:21:1400:21:14IP Address:IP Address: 165.166.61.3165.166.61.3
Page 1: August 2017 Survey of School Districts - please respond by Friday, Sept. 1
20 / 30
Survey of SC District Superintendents on School Accountability

Q1 Based upon your professional judgment, whatpercentage of all elementary, middle and high schools inSouth Carolina currently meet the statutory definition ofan Excellent, Good, Average, Below Average orUnsatisfactory rating? Please enter only whole numberswithout the percentage sign. Numbers must add to 100.
Respondent skipped this question
Q2 Thinking ahead to five years, what percentage of allelementary, middle and high schools in South Carolina willmeet the statutory definition of an Excellent, Good,Average, Below Average or Unsatisfactory rating by2022? Please enter only whole numbers without thepercentage sign. Numbers must add to 100.
Respondent skipped this question
Q3 What other information, data, etc. should the EOCconsult to make these determinations? Please be specific.
Respondent skipped this question
Q4 Do you have comments on the accountability framework or any of the indicators?
I did not complete the questions above as I do not understand the intent behind the request. I would like to recommend that the EOC engage directly in a meaningful manner with SCASA and the superintendent's group specifically to obtain our input. We all want a system that is valid, provides value, and is meaningful.
#20#20COMPLETECOMPLETE
Collector:Collector: Web Link 1 Web Link 1 (Web Link)(Web Link)Started:Started: Monday, August 28, 2017 2:56:51 PMMonday, August 28, 2017 2:56:51 PMLast Modified:Last Modified: Monday, August 28, 2017 3:03:33 PMMonday, August 28, 2017 3:03:33 PMTime Spent:Time Spent: 00:06:4100:06:41IP Address:IP Address: 204.116.208.67204.116.208.67
Page 1: August 2017 Survey of School Districts - please respond by Friday, Sept. 1
21 / 30
Survey of SC District Superintendents on School Accountability

Q1 Based upon your professional judgment, whatpercentage of all elementary, middle and high schools inSouth Carolina currently meet the statutory definition ofan Excellent, Good, Average, Below Average orUnsatisfactory rating? Please enter only whole numberswithout the percentage sign. Numbers must add to 100.
Respondent skipped this question
Q2 Thinking ahead to five years, what percentage of allelementary, middle and high schools in South Carolina willmeet the statutory definition of an Excellent, Good,Average, Below Average or Unsatisfactory rating by2022? Please enter only whole numbers without thepercentage sign. Numbers must add to 100.
Respondent skipped this question
Q3 What other information, data, etc. should the EOC consult to make these determinations? Please be specific.
I would really like to see the EOC engage in a discussion with district superintendents across our state about these topics. Thank you.
Q4 Do you have comments on the accountabilityframework or any of the indicators?
Respondent skipped this question
#21#21COMPLETECOMPLETE
Collector:Collector: Web Link 1 Web Link 1 (Web Link)(Web Link)Started:Started: Monday, August 28, 2017 3:27:54 PMMonday, August 28, 2017 3:27:54 PMLast Modified:Last Modified: Monday, August 28, 2017 3:28:46 PMMonday, August 28, 2017 3:28:46 PMTime Spent:Time Spent: 00:00:5200:00:52IP Address:IP Address: 165.166.21.126165.166.21.126
Page 1: August 2017 Survey of School Districts - please respond by Friday, Sept. 1
22 / 30
Survey of SC District Superintendents on School Accountability

Q1 Based upon your professional judgment, whatpercentage of all elementary, middle and high schools inSouth Carolina currently meet the statutory definition ofan Excellent, Good, Average, Below Average orUnsatisfactory rating? Please enter only whole numberswithout the percentage sign. Numbers must add to 100.
Respondent skipped this question
Q2 Thinking ahead to five years, what percentage of allelementary, middle and high schools in South Carolina willmeet the statutory definition of an Excellent, Good,Average, Below Average or Unsatisfactory rating by2022? Please enter only whole numbers without thepercentage sign. Numbers must add to 100.
Respondent skipped this question
Q3 What other information, data, etc. should the EOC consult to make these determinations? Please be specific.
It would appear that this survey is an attempt to boil down a very complicated process into two short questions. I would suggest that the EOC engage with the SC superintendents in a meaningful dialogue that could bring valuable input to this process.
Q4 Do you have comments on the accountabilityframework or any of the indicators?
Respondent skipped this question
#22#22COMPLETECOMPLETE
Collector:Collector: Web Link 1 Web Link 1 (Web Link)(Web Link)Started:Started: Tuesday, August 29, 2017 8:22:13 AMTuesday, August 29, 2017 8:22:13 AMLast Modified:Last Modified: Tuesday, August 29, 2017 8:25:24 AMTuesday, August 29, 2017 8:25:24 AMTime Spent:Time Spent: 00:03:1100:03:11IP Address:IP Address: 207.144.117.35207.144.117.35
Page 1: August 2017 Survey of School Districts - please respond by Friday, Sept. 1
23 / 30
Survey of SC District Superintendents on School Accountability

Q1 Based upon your professional judgment, whatpercentage of all elementary, middle and high schools inSouth Carolina currently meet the statutory definition ofan Excellent, Good, Average, Below Average orUnsatisfactory rating? Please enter only whole numberswithout the percentage sign. Numbers must add to 100.
Excellent 5Good 20Average 40Below Average 15Unsatisfactory 20
Q2 Thinking ahead to five years, what percentage of allelementary, middle and high schools in South Carolina willmeet the statutory definition of an Excellent, Good,Average, Below Average or Unsatisfactory rating by2022? Please enter only whole numbers without thepercentage sign. Numbers must add to 100.
Excellent 10Good 20Average 40Below Average 20Unsatisfactory 10
Q3 What other information, data, etc. should the EOC consult to make these determinations? Please be specific.
Consider how students data falls on other test such as SC PASS, NAEP, NWEA MAP
Q4 Do you have comments on the accountability framework or any of the indicators?
I do not agree with five levels--. Four levels would be best,
#23#23COMPLETECOMPLETE
Collector:Collector: Web Link 1 Web Link 1 (Web Link)(Web Link)Started:Started: Tuesday, August 29, 2017 12:39:40 PMTuesday, August 29, 2017 12:39:40 PMLast Modified:Last Modified: Tuesday, August 29, 2017 12:42:46 PMTuesday, August 29, 2017 12:42:46 PMTime Spent:Time Spent: 00:03:0500:03:05IP Address:IP Address: 207.144.29.250207.144.29.250
Page 1: August 2017 Survey of School Districts - please respond by Friday, Sept. 1
24 / 30
Survey of SC District Superintendents on School Accountability

Q1 Based upon your professional judgment, whatpercentage of all elementary, middle and high schools inSouth Carolina currently meet the statutory definition ofan Excellent, Good, Average, Below Average orUnsatisfactory rating? Please enter only whole numberswithout the percentage sign. Numbers must add to 100.
Respondent skipped this question
Q2 Thinking ahead to five years, what percentage of allelementary, middle and high schools in South Carolina willmeet the statutory definition of an Excellent, Good,Average, Below Average or Unsatisfactory rating by2022? Please enter only whole numbers without thepercentage sign. Numbers must add to 100.
Respondent skipped this question
Q3 What other information, data, etc. should the EOCconsult to make these determinations? Please be specific.
Respondent skipped this question
Q4 Do you have comments on the accountability framework or any of the indicators?
I am concerned about the timing of this survey. Most superintendents have been consumed with the opening of school during the past few days. The timing reflects a lack of sensitivity OR a desire to minimize meaningful input as there simply has not been enough time for reflective thought and substantive responses. Thus, I have not responded to questions 1, 2, or 3. While the quest to "ensure that all students meet the Profile of the SC Graduate" is most laudable, this is an impossible feat if all means all. If every student has to pass for a district to pass--or if only one students fails--then the entire district fails. This sounds too reminiscent of "No Child Left Behind." Ata minimum, multiple measures must be used and considered. The EOC is encouraged to adopt a model similar to NWEA's Virtual Comparison Group data where demographics, growth and proficiency are all analyzed and reported. Comparing a small, single cluster district to a large, multi-cluster district is unfair; comparing a district with a high percentage of students in poverty to a district with a significantly lower percentage of students in generational poverty is unfair. Is the goal of the accountability system to encourage legislators to increase funding for charters or is the goal to help traditional public schools and districts to be their personal best? When will we ever have the conversation about the inequities which exist among the districts in our state? Is public education meant to create opportunities for all or is it meant to sort and classify students and schools based upon socio-economic status and/or zip code? I hope itis the former and the EOC will exhibit leadership in encouraging--not demoralizing--the our cadre of excellent educators in SC. It is difficult enough to recruit and retain highly qualified, skilled teachers today; do not create an accountability system which makes this taskeven harder.
#24#24COMPLETECOMPLETE
Collector:Collector: Web Link 1 Web Link 1 (Web Link)(Web Link)Started:Started: Tuesday, August 29, 2017 2:19:44 PMTuesday, August 29, 2017 2:19:44 PMLast Modified:Last Modified: Tuesday, August 29, 2017 2:37:43 PMTuesday, August 29, 2017 2:37:43 PMTime Spent:Time Spent: 00:17:5900:17:59IP Address:IP Address: 165.166.62.233165.166.62.233
Page 1: August 2017 Survey of School Districts - please respond by Friday, Sept. 1
25 / 30
Survey of SC District Superintendents on School Accountability

Q1 Based upon your professional judgment, whatpercentage of all elementary, middle and high schools inSouth Carolina currently meet the statutory definition ofan Excellent, Good, Average, Below Average orUnsatisfactory rating? Please enter only whole numberswithout the percentage sign. Numbers must add to 100.
Respondent skipped this question
Q2 Thinking ahead to five years, what percentage of allelementary, middle and high schools in South Carolina willmeet the statutory definition of an Excellent, Good,Average, Below Average or Unsatisfactory rating by2022? Please enter only whole numbers without thepercentage sign. Numbers must add to 100.
Respondent skipped this question
Q3 What other information, data, etc. should the EOCconsult to make these determinations? Please be specific.
Respondent skipped this question
Q4 Do you have comments on the accountability framework or any of the indicators?
Not at this time!
#25#25COMPLETECOMPLETE
Collector:Collector: Web Link 1 Web Link 1 (Web Link)(Web Link)Started:Started: Tuesday, August 29, 2017 3:12:59 PMTuesday, August 29, 2017 3:12:59 PMLast Modified:Last Modified: Tuesday, August 29, 2017 3:13:52 PMTuesday, August 29, 2017 3:13:52 PMTime Spent:Time Spent: 00:00:5300:00:53IP Address:IP Address: 64.53.12.5964.53.12.59
Page 1: August 2017 Survey of School Districts - please respond by Friday, Sept. 1
26 / 30
Survey of SC District Superintendents on School Accountability

Q1 Based upon your professional judgment, whatpercentage of all elementary, middle and high schools inSouth Carolina currently meet the statutory definition ofan Excellent, Good, Average, Below Average orUnsatisfactory rating? Please enter only whole numberswithout the percentage sign. Numbers must add to 100.
Respondent skipped this question
Q2 Thinking ahead to five years, what percentage of allelementary, middle and high schools in South Carolina willmeet the statutory definition of an Excellent, Good,Average, Below Average or Unsatisfactory rating by2022? Please enter only whole numbers without thepercentage sign. Numbers must add to 100.
Respondent skipped this question
Q3 What other information, data, etc. should the EOC consult to make these determinations? Please be specific.
I would encourage the EOC to look beyond a standardized test, especially for K-8. While high schools will use multiple measures, elementary/middle schools will be judged primarily by a standardized test score.
Employers are looking for individuals who can collaborate, critically think, problem-solve, and who demonstrate a strong work ethic. None of these are measured by a standardized test.
Additionally, school effectiveness cannot be boiled down to a simple number. To what extent are the parents satisfied with the school? Why are they satisfied? How innovative is the school? How are they measuring risk-taking, perseverance, and grit? Are they active partners in the community? There are many more questions that can be asked to capture a school's effectiveness that a standardized test cannot possibly convey. Multiple measures in K-8 should actually mean multiple measures.
Q4 Do you have comments on the accountability framework or any of the indicators?
Please continue to collaborate with superintendents, principals, teachers, and district instructional leaders regarding measurement. We have a chance to be a national leader and focus on measures that reflect the skills and dispositions our students need to thrive in their futures. Consider grappling with the complexities of this issue vs. following the pack.
#26#26COMPLETECOMPLETE
Collector:Collector: Web Link 1 Web Link 1 (Web Link)(Web Link)Started:Started: Tuesday, August 29, 2017 3:49:13 PMTuesday, August 29, 2017 3:49:13 PMLast Modified:Last Modified: Tuesday, August 29, 2017 4:04:36 PMTuesday, August 29, 2017 4:04:36 PMTime Spent:Time Spent: 00:15:2300:15:23IP Address:IP Address: 207.144.99.7207.144.99.7
Page 1: August 2017 Survey of School Districts - please respond by Friday, Sept. 1
27 / 30
Survey of SC District Superintendents on School Accountability

Q1 Based upon your professional judgment, whatpercentage of all elementary, middle and high schools inSouth Carolina currently meet the statutory definition ofan Excellent, Good, Average, Below Average orUnsatisfactory rating? Please enter only whole numberswithout the percentage sign. Numbers must add to 100.
Respondent skipped this question
Q2 Thinking ahead to five years, what percentage of allelementary, middle and high schools in South Carolina willmeet the statutory definition of an Excellent, Good,Average, Below Average or Unsatisfactory rating by2022? Please enter only whole numbers without thepercentage sign. Numbers must add to 100.
Respondent skipped this question
Q3 What other information, data, etc. should the EOC consult to make these determinations? Please be specific.
I recommend that the EOC speak directly with SCASA and specifically the superintendent's group to obtain meaningful information about this subject. That platform would be more conducive to obtaining meaningful data and could be explained instead of a cookie-cutter question on a survey.
Q4 Do you have comments on the accountabilityframework or any of the indicators?
Respondent skipped this question
#27#27COMPLETECOMPLETE
Collector:Collector: Web Link 1 Web Link 1 (Web Link)(Web Link)Started:Started: Wednesday, August 30, 2017 1:50:29 PMWednesday, August 30, 2017 1:50:29 PMLast Modified:Last Modified: Wednesday, August 30, 2017 1:54:58 PMWednesday, August 30, 2017 1:54:58 PMTime Spent:Time Spent: 00:04:2900:04:29IP Address:IP Address: 204.116.211.125204.116.211.125
Page 1: August 2017 Survey of School Districts - please respond by Friday, Sept. 1
28 / 30
Survey of SC District Superintendents on School Accountability

Q1 Based upon your professional judgment, whatpercentage of all elementary, middle and high schools inSouth Carolina currently meet the statutory definition ofan Excellent, Good, Average, Below Average orUnsatisfactory rating? Please enter only whole numberswithout the percentage sign. Numbers must add to 100.
Excellent 10Good 10Average 20Below Average 40Unsatisfactory 20
Q2 Thinking ahead to five years, what percentage of allelementary, middle and high schools in South Carolina willmeet the statutory definition of an Excellent, Good,Average, Below Average or Unsatisfactory rating by2022? Please enter only whole numbers without thepercentage sign. Numbers must add to 100.
Excellent 15Good 20Average 35Below Average 15Unsatisfactory 15
Q3 What other information, data, etc. should the EOC consult to make these determinations? Please be specific.
School board members; economic development leaders in each county
Q4 Do you have comments on the accountability framework or any of the indicators?
None
#28#28COMPLETECOMPLETE
Collector:Collector: Web Link 1 Web Link 1 (Web Link)(Web Link)Started:Started: Thursday, August 31, 2017 9:25:20 AMThursday, August 31, 2017 9:25:20 AMLast Modified:Last Modified: Thursday, August 31, 2017 9:30:43 AMThursday, August 31, 2017 9:30:43 AMTime Spent:Time Spent: 00:05:2300:05:23IP Address:IP Address: 172.2.182.14172.2.182.14
Page 1: August 2017 Survey of School Districts - please respond by Friday, Sept. 1
29 / 30
Survey of SC District Superintendents on School Accountability

Q1 Based upon your professional judgment, whatpercentage of all elementary, middle and high schools inSouth Carolina currently meet the statutory definition ofan Excellent, Good, Average, Below Average orUnsatisfactory rating? Please enter only whole numberswithout the percentage sign. Numbers must add to 100.
Respondent skipped this question
Q2 Thinking ahead to five years, what percentage of allelementary, middle and high schools in South Carolina willmeet the statutory definition of an Excellent, Good,Average, Below Average or Unsatisfactory rating by2022? Please enter only whole numbers without thepercentage sign. Numbers must add to 100.
Respondent skipped this question
Q3 What other information, data, etc. should the EOC consult to make these determinations? Please be specific.
Poverty must be factored into the equation to get a valid determination. Districts nor students should be penalized because of their zip code.
Q4 Do you have comments on the accountability framework or any of the indicators?
A tiered system based on factors outside the control of the district should be included in the framework.
#29#29COMPLETECOMPLETE
Collector:Collector: Web Link 1 Web Link 1 (Web Link)(Web Link)Started:Started: Thursday, August 31, 2017 10:38:53 AMThursday, August 31, 2017 10:38:53 AMLast Modified:Last Modified: Thursday, August 31, 2017 10:54:53 AMThursday, August 31, 2017 10:54:53 AMTime Spent:Time Spent: 00:16:0000:16:00IP Address:IP Address: 64.53.4.1064.53.4.10
Page 1: August 2017 Survey of School Districts - please respond by Friday, Sept. 1
30 / 30
Survey of SC District Superintendents on School Accountability