after peak oil: who escapes the resource curse?
TRANSCRIPT
After Peak Oil: Who Escapes the Resource Curse?*
Jesica AndrewsThe University of New Mexico
Abstract
Given the discovery of resource wealth, which factors account for future economic success and which factors hinder success? This case study compares two countries which discovered oil wealth in the late 1960s: Ecuador and Norway. The analysis gives the economic and political context and then compares three bodies of resource curse literature that relate to economic success. The study ultimately concludes that resource sale is the largest contributor to economic success. In the past “resource winners” have been praised for policies and economic outcomes only to have those policies deemed ineffective in retrospect. Norway is the current outlier in resource curse literature and is often cited as the most successful example of resource wealth management. However, projections indicate that Norway has started to show symptoms of economic decline now that it has reached peak oil. A final implication from this study suggests that resource curse literature should focus on whether the economic trajectories of resource winners can ever be sustained resource reserves expire.
* I am grateful to Dr. Chris Butler and Dr. Mark Peceny for their enduring guidance.
Introduction
This case study applies resource curse literature to two case studies. By focusing
on two specific cases this study shows that perhaps the division between “resource
winners” and “resource losers” may be far more blurred than scholars suggest. Ecuador
and Norway both discovered oil in the years that lead up to the oil price shocks that were
suppose to have given oil exporting countries enormous economic clout.
In the 1960s Ecuador was a developing nation that discovered small oil reserves.
Conversely, Norway was a highly developed nation that found huge oil reserves.
According to resource curse literature Ecuador was faced with a “bad situation” (in terms
of overcoming the resource curse) and today, it is not considered a “resource winner.”
Norway, however, began production in a “good situation.” Norway developed unique
policies and is frequently considered a “resource winner.” Yet, Ecuador did as well as
Norway for fourteen years (in terms of GDP per capita) until it reached peak oil.
Furthermore, since reaching peak oil Ecuador has maintained steady growth both
economically and in terms of human development. Norway reached its peak oil only this
year (2010). The question then is: will resource curse literature continue to consider
Norway as a “winner” in the decades that follow its peak oil?
Literature Review
Resource curse literature grapples with two broad topics. The first topic is why
resource rich countries frequently perform poorly compared to their resource poor
counterparts. The second topic focuses on why among resource rich countries some
succeed and others do not.
Resource rich countries are both some of the richest and some of the poorest
countries on earth. Terry Karl (1997) summarizes the phenomenon as it relates to
developing countries in her book the Paradox of Plenty. She asks "after benefiting from
the largest transfer of wealth ever to occur without war, why have most oil-exporting
developing countries suffered from economic deterioration and political decay?”(p. xv).
In other words, why have developing countries been unable to use their resources to
improve their economies?
Karl (1997) proposes that Petro-states are unlike other states. Petro-states are
frequently resources losers because institutions favor rent seeking activities, and this is
particularly true in countries where the discovery of oil wealth coincided with modern
state-building. Karl theorizes that dependence on petrodollars produces a distinct
institutional situation. This is because the initial bargaining situations between oil
companies seeking to secure access to crude and local rules who want to consolidate their
support results in centralize political power, strong links between public and private
actors, poor development practices, and the replacement of domestic taxation with
petrodollar influxes.
Other studies, like Mehlum et al. (2006), find that the quality of institutions can
affect growth rates for the country. Mehlum et al. (2006) describe three ways in which
resources interact with institutions. The first way is when the quality of institutions is
hurt by resource wealth. A second way where institutions do not play an important role,
and a third way where resource wealth is appropriated in relation to the quality of the
institution. Additionally, Persson et al. (2008) find that the because presidential regimes
imply less incentives for legislative participation and more separation of powers, a
presidential system endowed with resources will redistribute wealth towards powerful
minorities and invest less in public goods. Conversely, parliamentarian governments
redistribute wealth toward a majority and invest more in public goods. For the purposes
of this study the most important findings on resource wealth and institutions comes from
Michael Ross and his article “Does Oil hinder Democracy?” Ross (2001) shows that oil
does, in fact, impede democracy. Moreover, Ross (2001) finds that oil deteriorates
democracy more in poor countries than in rich ones. Finally, Ross (2001) finds that this
phenomenon is not limited to the Middle East.
Sachs and Warner (1997) suggest that regardless of institutional type or quality,
resource rich states tend to overspend during the onset of the natural resource wealth.
Using a Ramsey growth model, Sachs and Warner display the convergence towards the
natural steady state equilibrium which they conclude accounts for the negative growth
seen in the resource curse literature. Another explanation for why resource rich countries
perform poorly is the Dutch Disease. The Dutch Disease proposes that exporting
resources deteriorates the manufacturing sector. This is because the cash inflow from the
international market makes the exporting country's currency stronger. A stronger currency
makes the products manufactured within the country cost more in the international
market and so decreases the exportability of these manufactured products. This may
explain why resource abundant countries like Nigeria, Zambia, Sierra Leone, Angola,
Saudi Arabia, and Venezuela experienced lower growth rates than resource poor countries
like the Asian tigers: Korea, Taiwan, Hong Kong, and Singapore. However, the Dutch
Disease fails to explain why there is such growth variation between resource rich
countries.
Botswana, Canada, Australia, the United Arab Emirates and Norway are all
examples of resource rich countries that have seen the rapid growth of their economies.
For both the United Arab Emirates and Norway, their growth is linked specifically to
their oil exporting activities. To explain the difference between resource winners and
losers Ding and Field (2004) use World Bank data on national capital stocks to find that
countries with resource endowments have positive economic growth, while countries that
are resource dependent experience negative impacts on growth. This paper links the
above factors of the broader resource curse literature specifically to the economic success
of two petroleum exporting countries which ultimately seem to emphasize the importance
of economics over policy.
Research Design
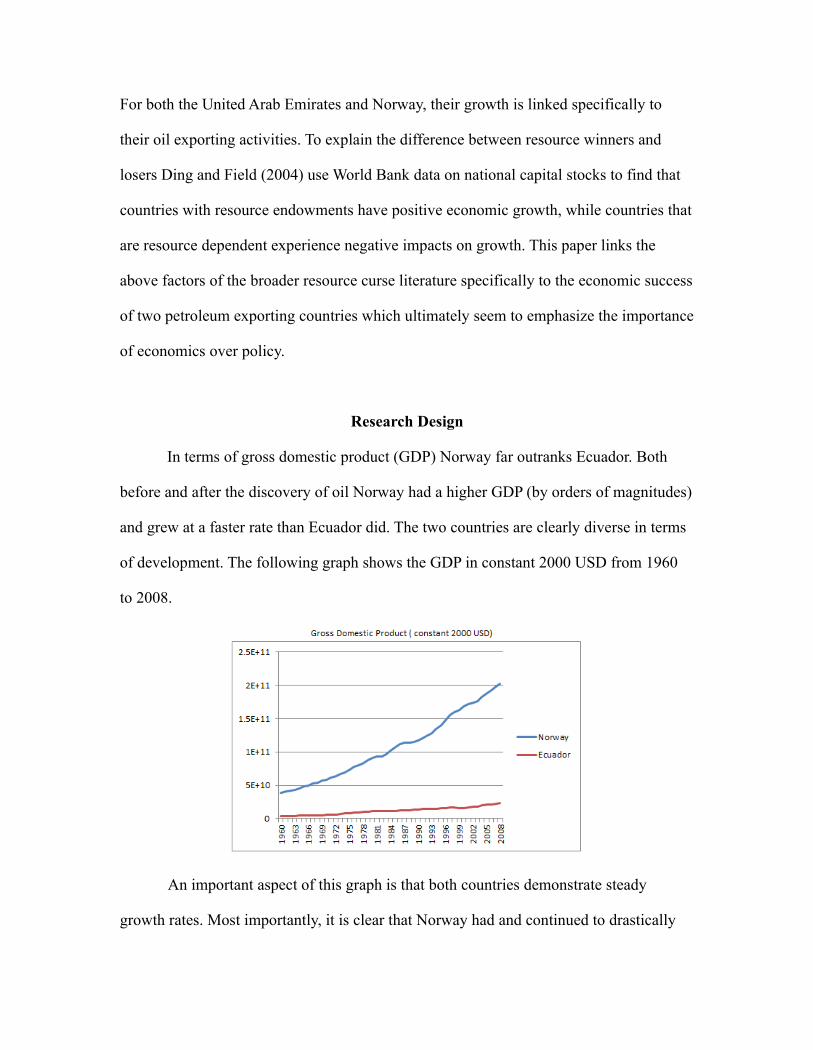
In terms of gross domestic product (GDP) Norway far outranks Ecuador. Both
before and after the discovery of oil Norway had a higher GDP (by orders of magnitudes)
and grew at a faster rate than Ecuador did. The two countries are clearly diverse in terms
of development. The following graph shows the GDP in constant 2000 USD from 1960
to 2008.
An important aspect of this graph is that both countries demonstrate steady
growth rates. Most importantly, it is clear that Norway had and continued to drastically
outperform Ecuador economically. This should not surprise anyone familiar with
international economies. What should surprise the reader is what is found in the
following graph. The following graph attempts to control for prior economic performance
and country size, while displaying the growth trend since the discovery of oil. For these
reasons the dependent variable Gross Domestic Product per capita is used. The World
Bank defines Gross Domestic Product per capita as follows:
“GDP per capita is gross domestic product divided by midyear population. GDP is the sum of gross value added by all resident producers in the economy plus any product taxes and minus any subsidies not included in the value of the products. It is calculated without making deductions for depreciation of fabricated assets or for depletion and degradation of natural resources.”
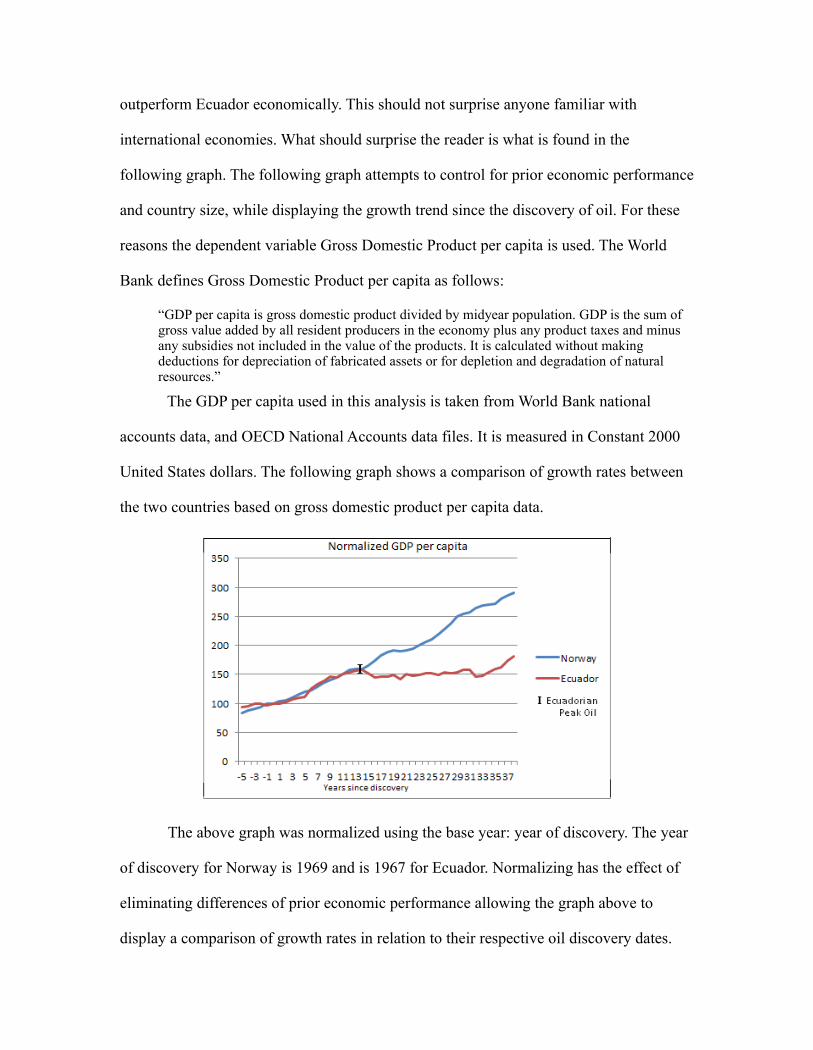
The GDP per capita used in this analysis is taken from World Bank national
accounts data, and OECD National Accounts data files. It is measured in Constant 2000
United States dollars. The following graph shows a comparison of growth rates between
the two countries based on gross domestic product per capita data.
The above graph was normalized using the base year: year of discovery. The year
of discovery for Norway is 1969 and is 1967 for Ecuador. Normalizing has the effect of
eliminating differences of prior economic performance allowing the graph above to
display a comparison of growth rates in relation to their respective oil discovery dates.
What is quite shocking here is that Ecuador actually models the Norwegian growth
trajectory until the 14th year after Ecuador’s oil discovery. This is the year Ecuador
reached its peak oil.
According to Ding and Field (2004) a resource dependent Ecuador should not
have modeled the growth rates for the resource endowed Norway. Ecuador had less oil,
was more resource dependent, and had a low income economy. All these economic
indicators should suggest negative growth or, at least, low growth but instead, we see the
above performances. Why might this be the case? After justifying the case selection, the
remainder of this paper will attempt to determine what produces this similarity among
such dissimilar countries.
Case Selection
This paper uses the method of agreement as prescribed by John Stuart Mill (1843)
to compare the selected cases of oil discovery. The method of agreement looks for a
common factor in all the cases where the effect occurs. For this study the factors are oil
discovery, year of discovery, the international price of oil, economic development prior to
and during oil exporting years, regime type, and production model. The effect is GDP per
capita growth. The subjects of this study are Ecuador and Norway.
Criteria One: Resource Impact and Economic Performance
The cases selected are vastly different, but they have several features in common
that make them comparable. Stevens (2003) identifies 55 countries in which resource
export revenues exceed 30% of merchandise exports. Both Norway and Ecuador make
this list. Stevens identifies Norway as one of seven countries which have beaten the
resource curse; Ecuador is not identified as a winner. Yet, both countries have had more
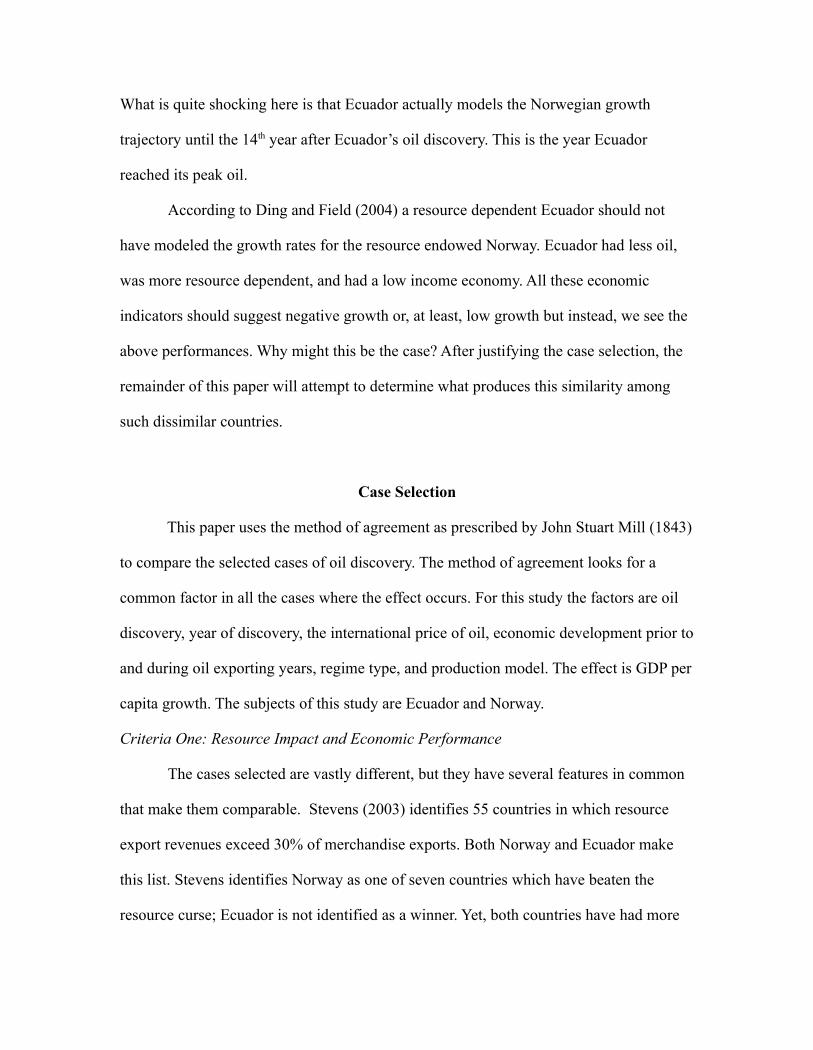
stable growth as compared to other oil exporting countries. In addition, increases in
growth are more notably related to oil. For comparison, the following graph shows the
gross domestic product of four well-known oil exporters.
Oil onset is marked by a short vertical line. For both Venezuela and UAE oil
discovery was made before the data begins. Karl’s theory seems to play out in these two
cases, where long standing traditions of the interaction between oil wealth and
institutions have created precarious economic situations. On the other hand, both stability
and increases in growth as it relates to onset of oil wealth, is visible for Norway and
Ecuador. It is obvious from the above graph that this study investigates the extremities of
the rich and poor among resource impacted countries. The following three criteria do not
relate to rich and poor and offer more evidence that the comparison can and should be
made between Ecuador and Norway.
Criteria Two: Oil Prices
The two countries discovered their oil in the late 1960s just before the first major
spikes in oil prices and began producing and exporting their crude in the early 1970s
during the price increases. The international petroleum market is a very complex market.
Economic policies of countries worldwide affect the international price, different grades
of crude demand different prices, and conflict (both international and domestic) is also a
huge factor in international oil price. It is for these reasons that the same time frame must
be used to analyze the effects of petroleum income on a country.
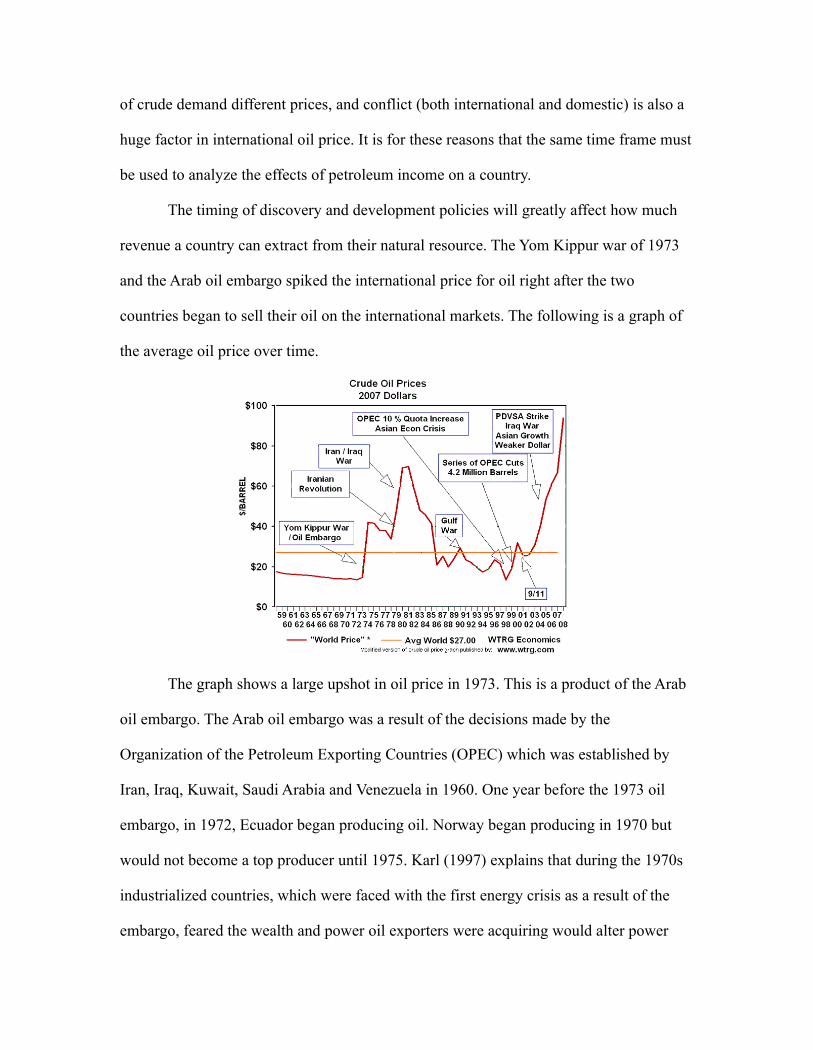
The timing of discovery and development policies will greatly affect how much
revenue a country can extract from their natural resource. The Yom Kippur war of 1973
and the Arab oil embargo spiked the international price for oil right after the two
countries began to sell their oil on the international markets. The following is a graph of
the average oil price over time.
The graph shows a large upshot in oil price in 1973. This is a product of the Arab
oil embargo. The Arab oil embargo was a result of the decisions made by the
Organization of the Petroleum Exporting Countries (OPEC) which was established by
Iran, Iraq, Kuwait, Saudi Arabia and Venezuela in 1960. One year before the 1973 oil
embargo, in 1972, Ecuador began producing oil. Norway began producing in 1970 but
would not become a top producer until 1975. Karl (1997) explains that during the 1970s
industrialized countries, which were faced with the first energy crisis as a result of the
embargo, feared the wealth and power oil exporters were acquiring would alter power

structures and allow the exporters (OPEC in particular) to become the bankers of the
world. The result has not been nearly as dramatic. The Arab oil embargo had ended by
1974 but the embargo left the price at new high which all two countries enjoyed during
their early exporting years.
Embargoes cause artificial price increases for all exporting nations because the
supply shortage increases the price on the international market. From 1970 to 1974
government revenues of OPEC nations on average grew eleven times over (Karl, 1997,
p.2). Norway was not a member of OPEC. Ecuador joined in 1973 only to withdrawal in
1992 over membership dues.1 However, regardless of OPEC membership status the price
shocks provided additional revenue for all oil exporting countries. Unfortunately for
OPEC nations and oil-exporting developing countries alike, dreams of utilizing that
enormous transfer of wealth to significantly alter their economic trajectories had failed
even before the price plunges of 1983 (p.3).
Criteria Three: No domestic experience
Prior to the late 1960s, Ecuador and Norway had no known oil reserves and no oil
exporting experience. The importance of these criteria cannot be understated, at least in
terms of policy decisions. This criteria is used to separate incremental policy
development from deliberate policy planning done at time of discovery. In other words,
countries like the United States, Mexico, Venezuela and Middle Eastern producers who
had discovered oil reserves in the early 1900s have incrementally developed their oil
policies over the past century often unaware of the effects such a resource would
produce. The theory of the paradox of plenty (Karl, 1997) is most applicable in these
cases, where state building and the creation of institutions coincided with incremental
1As of 2007 it has rejoined OPEC. Source: OPEC: Brief History <http://www.opec.org/opec_web/en/about_us/24.htm>
discoveries of oil. Such an early discovery meant that these countries developed
demarcated production models that encourage poor practices like giving too much
autonomy to multinational production companies, faulty investment strategies, or
overspending.
By1970s, the world’s dependence on oil would be well known. Because of this
knowledge Ecuador and Norway were presented with the opportunity to alter course and
deliberately choose a policy more beneficial to the country. They were provided the
opportunity to gather knowledge about oil exportation and its effects from countries that
had produced oil for extended periods of time. Because they had no known oil reserves,
Ecuador and Norway had no exporting experience. Exporting experience means two
things: first, experience with the relationship between government and production
companies and second, national human capital that could be employed to produce the
country's oil. Both countries were faced with immediate deliberate decisions about how
to control oil reserve development and how to incorporate the resource rents into their
national economies. This deliberate decision-making was not available to the countries
which discovered their oil deposits early and incrementally.
Criteria Four: Independence
Finally, at the time of discovery each country was independent. This is important
because many oil exporting countries discovered their oil under colonial rule and
therefore had their initial oil development policies dictated to them. In some cases
countries with early discoveries had their policies decided for them by the great powers
of the early twentieth century. One example is Venezuela.
When oil was discovered in 1922, Venezuela's dictator, General Juan Vicente
Gomez, allowed the oil companies of the United States to dominate the decisions
regarding Venezuelan petroleum laws. Yergin (1991) says General Gomez used
Venezuela’s oil wealth for his own personal enrichment. In1935 when General Gomez
died and the ruling party (which was born out of the “Generation of 1928” activists)
renegotiated the oil policy. Their renegotiations resulted in “fifty-fifty” principal.
Government would take equal percent of the profits the companies made from Venezuela
oil. In effect they were equal partners and the country was able to regain some control. In
1943 it was considered a landmark event, but it took over twenty years for Venezuela to
regain control of its own resource. Mexico which discovered oil in 1901 is another
example of an incremental process of policy development, and Libya, whose oil
exploration was led by British efforts in the 1950s, is yet another example. This paper
will discuss how the independence of the three countries allowed them to choose their
own production models and in the case of Norway: invent a new one.
The Qualitative Analysis: Compare and Contrast
Ecuador
History
Throughout the twentieth century Ecuador became very familiar with the booms
and busts of maintaining a large exporting sector volatile to the international markets. In
the beginning of the century Ecuador was reliant on a powerful cacao exporting sector.
By the 1950s Ecuador had replaced cacao exports with banana exports. As a result of the
export dependent economy the banking system expanded. In 1970s oil dominated the
Ecuadorian economy as the primary export.
Ecuador was a country prone to political instability. Between 1925 and 1947
twenty-three governments cycled through the Ecuadorian capital. In 1970, two years after
the discovery of oil in Ecuador, the ruling president, Velasco Ibarra, declared a
dictatorship. In 1972 Ibarra was removed by a military coup. The military government
was self-described as the “revolutionary nationalist” government and General Guillermo
Rodriguez Lara presided. Ecuador would draft seventeen constitutions by the time the
military would turn the government back over to democratic civilian rule in 1979 - just
two years before Ecuador reached its peak oil.
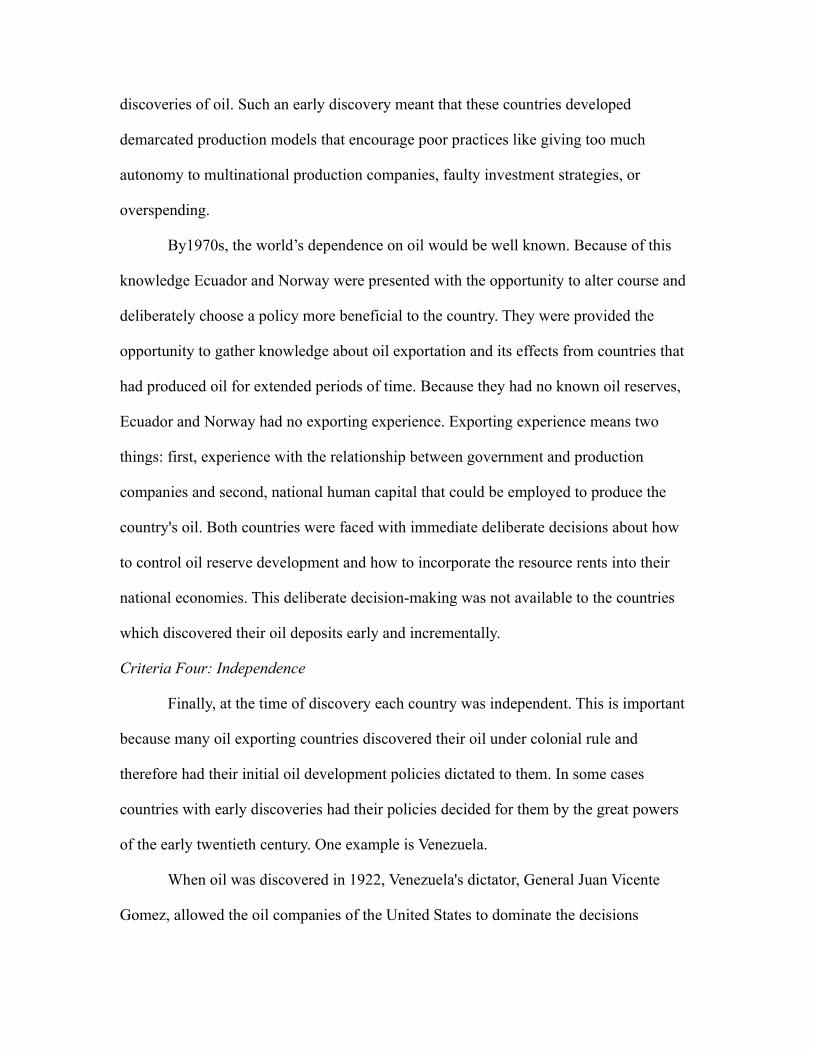
In Latin America, during the 1960s and 1970s, military dictatorships were not
uncommon. Ecuador (with Peru) would eventually be among the earliest of the Latin
American countries to democratize but the Ecuadorian oil boom years were administered
by the military dictatorship. The following graph demonstrated Ecuador’s GDP per capita
as compared to other middle income countries from 1960 to 2008.
Oil Policies
In the mid-1970s Ecuador was “a country in which the petroleum industry
enjoy[ed] hegemony over the economy, both in terms of national development and as the
primary generator of revenue” (Martz, 1987, p.3). During the 1970s petroleum was
responsible for three-fourths of export revenues (Corkill, 1985). General Lara expounded
the idea that because the oil belonged to the state all citizens should benefit from its
profits. The military government wrote extensively on oil for development in the
Philosophy and Action plan of the revolutionary nationalist government of Ecuador.
Additionally, Lara established The Comprehensive plan for transformation and
development 73 – 77 which would use oil revenue to pursue development in three ways:
national integration, improvement of living standards, and more economic output through
more rational use of resource (Martz, 1987). On March 27th 1972 Ecuador established the
Comision Asesora del Despacho Ministerial en Ausntos Relacionados con Politica
Petrolera (Minister’s Advisory Commission on subjects related to Petroleum Policy). It
was the advisory committee to Captain Gustavo Jarrin, the new minister of natural
resources and tourism. Under Jarrin Ecuador established the state oil company
Corporacion Estatal Petrolera Ecuatoriana (CEPE), the National Development Fund, and
the Ecuadorian Development Bank. Similar to the praise that Norway receives today, the
World Bank in 1974 highly praised Ecuador's resource ministry and noted that the
“management of petroleum resource has been remarkable” (Martz, 1987, p.102).
Norway
History
Before the discovery of oil Norway's economy was stable, its GDP per capita was
above the world average and over 95% of its power needs were met by hydroelectric
power. In resource curse literature Norway is frequently cited as the successful example
of escape from the resource curse. This is often after establishing that Norway was
trailing behind its Scandinavian neighbors before the discovery of oil and then grew to
surpass those neighbors shortly thereafter. The following figure from Larsen (2004)
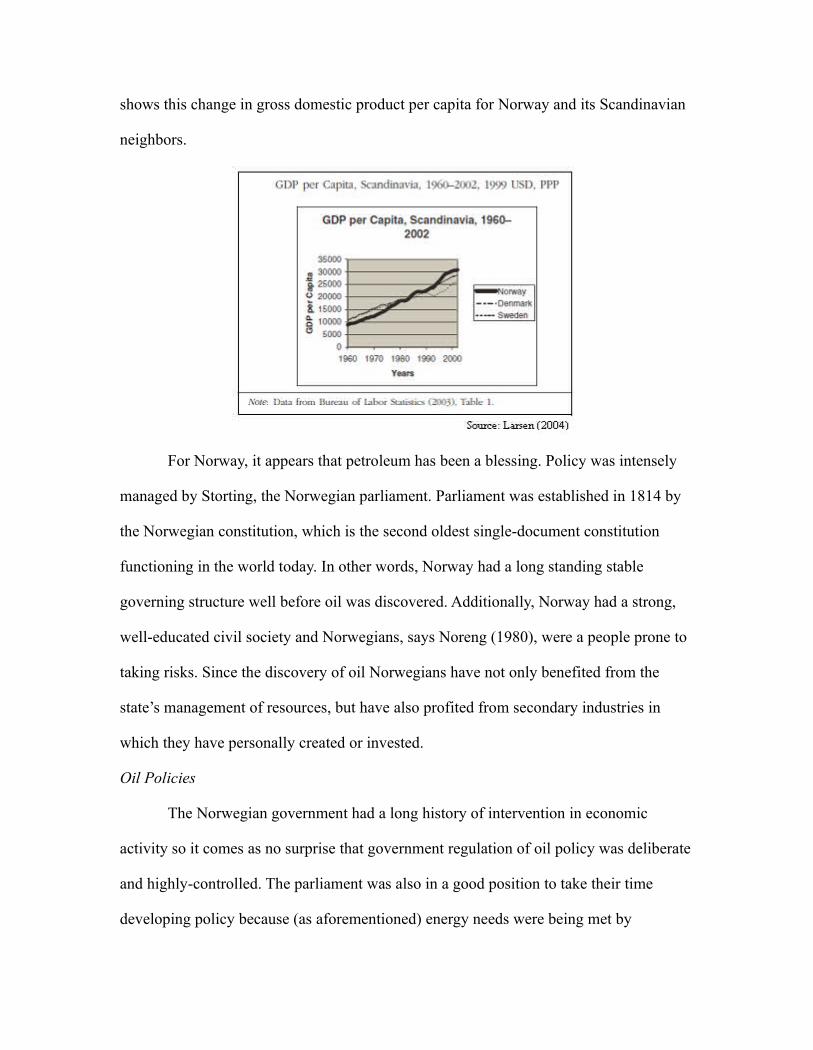
shows this change in gross domestic product per capita for Norway and its Scandinavian
neighbors.
For Norway, it appears that petroleum has been a blessing. Policy was intensely
managed by Storting, the Norwegian parliament. Parliament was established in 1814 by
the Norwegian constitution, which is the second oldest single-document constitution
functioning in the world today. In other words, Norway had a long standing stable
governing structure well before oil was discovered. Additionally, Norway had a strong,
well-educated civil society and Norwegians, says Noreng (1980), were a people prone to
taking risks. Since the discovery of oil Norwegians have not only benefited from the
state’s management of resources, but have also profited from secondary industries in
which they have personally created or invested.
Oil Policies
The Norwegian government had a long history of intervention in economic
activity so it comes as no surprise that government regulation of oil policy was deliberate
and highly-controlled. The parliament was also in a good position to take their time
developing policy because (as aforementioned) energy needs were being met by
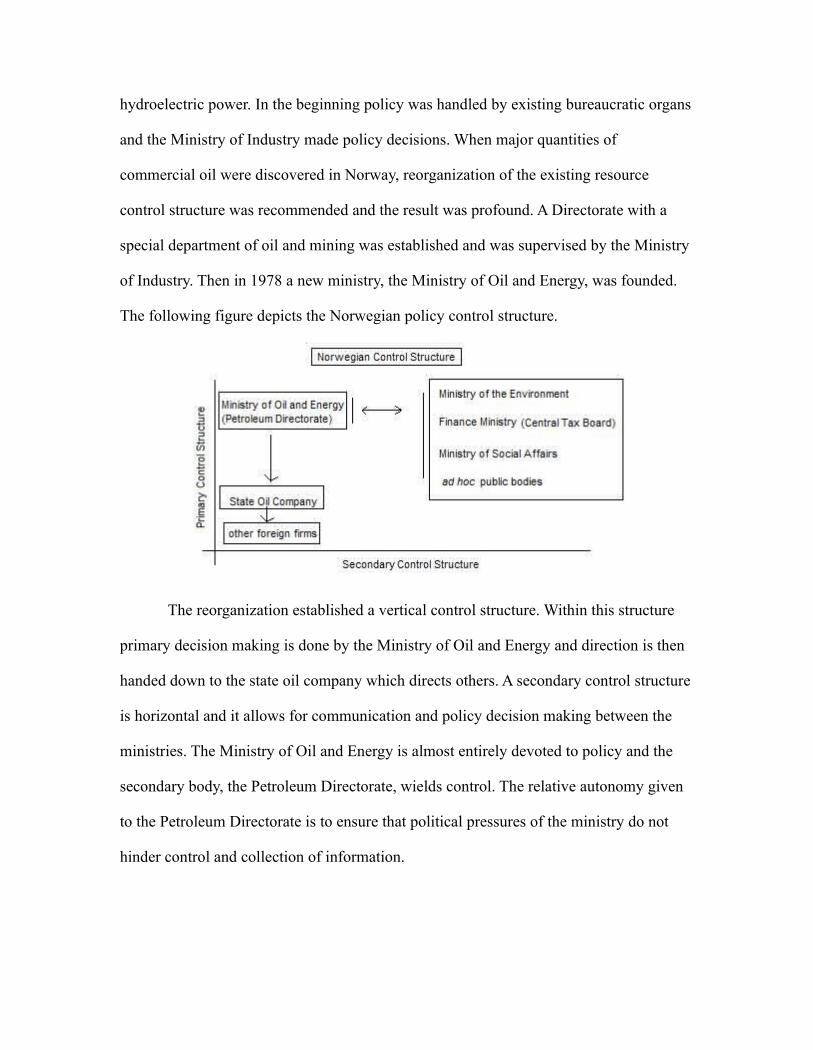
hydroelectric power. In the beginning policy was handled by existing bureaucratic organs
and the Ministry of Industry made policy decisions. When major quantities of
commercial oil were discovered in Norway, reorganization of the existing resource
control structure was recommended and the result was profound. A Directorate with a
special department of oil and mining was established and was supervised by the Ministry
of Industry. Then in 1978 a new ministry, the Ministry of Oil and Energy, was founded.
The following figure depicts the Norwegian policy control structure.
The reorganization established a vertical control structure. Within this structure
primary decision making is done by the Ministry of Oil and Energy and direction is then
handed down to the state oil company which directs others. A secondary control structure
is horizontal and it allows for communication and policy decision making between the
ministries. The Ministry of Oil and Energy is almost entirely devoted to policy and the
secondary body, the Petroleum Directorate, wields control. The relative autonomy given
to the Petroleum Directorate is to ensure that political pressures of the ministry do not
hinder control and collection of information.
Results
Theory of Escape 1: Rich v. Poor countries
In 1967 when oil was discovered in Ecuador, it was hailed as the country's saving
grace. Ecuadorian production began in 1972 and the first barrel of crude was paraded
through the town and set atop a monument. The public was well aware of its presence.
Ecuador quickly sought to use its new wealth to fuel development and lift the country out
of poverty. Since the discovery of petroleum, Ecuador has almost exclusively linked its
development policy to petroleum rents.
Conversely, John Ausland (1979) writes that “Norway stumbled into becoming an
oil nation. The transition went practically unnoticed by a people preoccupied with the
debate over membership in the Common Market” (p.1). In Norway, the government was
aware of the effects the oil wealth could have, but the Norwegian civil society was less
interested than the Ecuadorian public. The discovery of oil in Norway came at a time
when the resource was thoroughly pursued by the international community (particularly
by western industrialized countries which feared the new power of OPEC). The
international interest in Norwegian oil and the economic conditions in Norway, afford the
privilege of deliberate planning and minimized risk for Norway.
Ding and Field (2004) highlight the importance of resource endowment and
resource dependence to economic growth. Ding and Field show that richer, more diverse
economies experience positive growth. These are labeled resource endowed. Poor, single-
resource dependent economies experience poor growth. These are labeled resource
dependent. Norway is clearly an example of a resource endowed country. Hydroelectric
power fueled the country and oil extraction was delayed until proper policy was
established. Ecuador was clearly a resource dependent country. Economic development
was directly linked to oil revenues. However, the theory that rich can escape the resource
curse while the poor cannot (which in this paper is summarized by the Ding and Field
(2004) findings) appears to have a null effect, at least until peak oil.
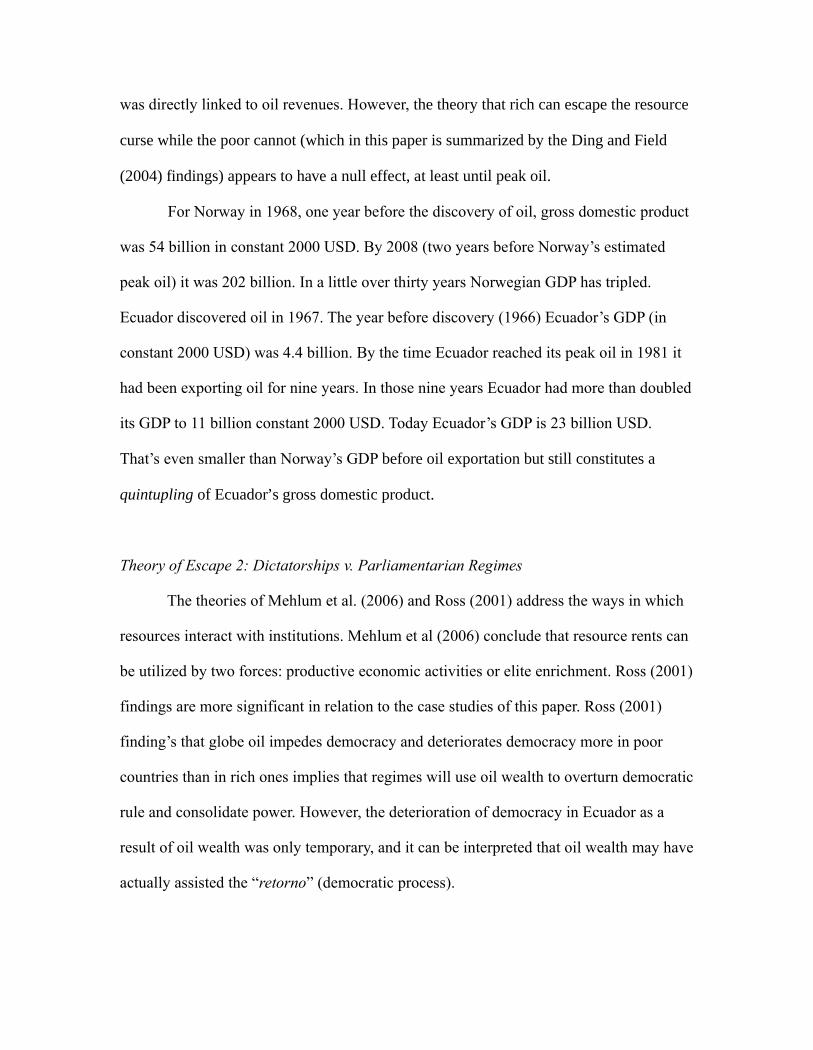
For Norway in 1968, one year before the discovery of oil, gross domestic product
was 54 billion in constant 2000 USD. By 2008 (two years before Norway’s estimated
peak oil) it was 202 billion. In a little over thirty years Norwegian GDP has tripled.
Ecuador discovered oil in 1967. The year before discovery (1966) Ecuador’s GDP (in
constant 2000 USD) was 4.4 billion. By the time Ecuador reached its peak oil in 1981 it
had been exporting oil for nine years. In those nine years Ecuador had more than doubled
its GDP to 11 billion constant 2000 USD. Today Ecuador’s GDP is 23 billion USD.
That’s even smaller than Norway’s GDP before oil exportation but still constitutes a
quintupling of Ecuador’s gross domestic product.
Theory of Escape 2: Dictatorships v. Parliamentarian Regimes
The theories of Mehlum et al. (2006) and Ross (2001) address the ways in which
resources interact with institutions. Mehlum et al (2006) conclude that resource rents can
be utilized by two forces: productive economic activities or elite enrichment. Ross (2001)
findings are more significant in relation to the case studies of this paper. Ross (2001)
finding’s that globe oil impedes democracy and deteriorates democracy more in poor
countries than in rich ones implies that regimes will use oil wealth to overturn democratic
rule and consolidate power. However, the deterioration of democracy in Ecuador as a
result of oil wealth was only temporary, and it can be interpreted that oil wealth may have
actually assisted the “retorno” (democratic process).
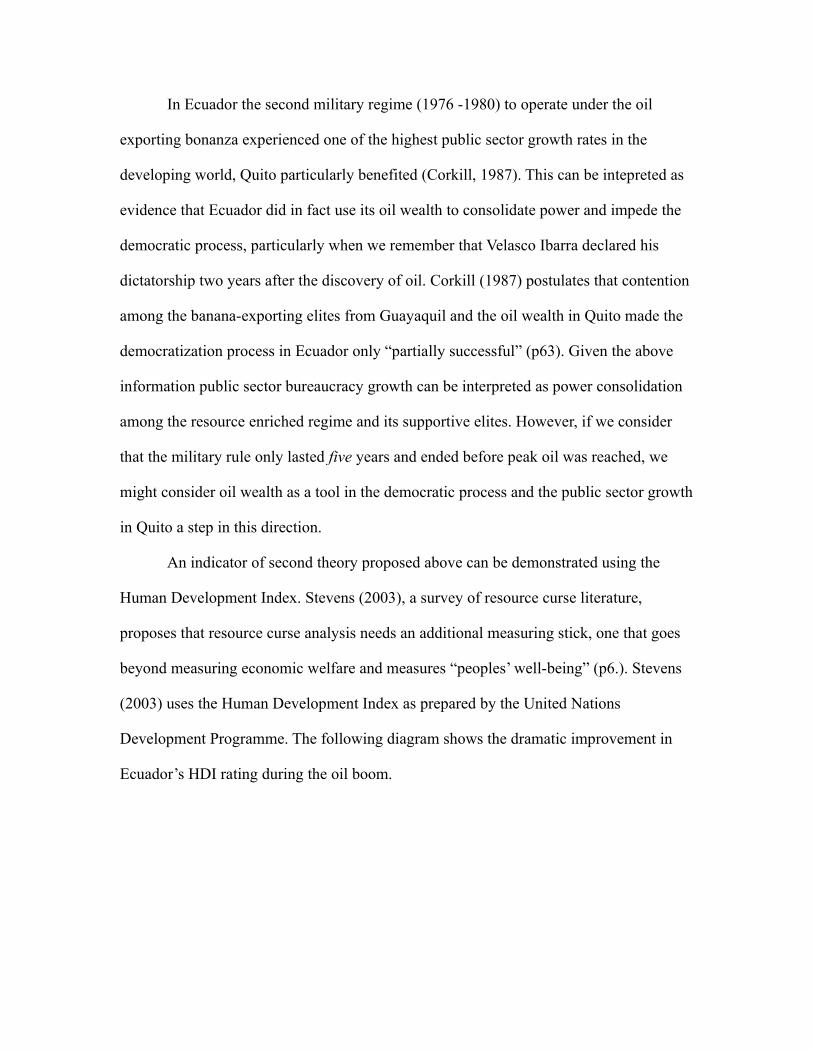
In Ecuador the second military regime (1976 -1980) to operate under the oil
exporting bonanza experienced one of the highest public sector growth rates in the
developing world, Quito particularly benefited (Corkill, 1987). This can be intepreted as
evidence that Ecuador did in fact use its oil wealth to consolidate power and impede the
democratic process, particularly when we remember that Velasco Ibarra declared his
dictatorship two years after the discovery of oil. Corkill (1987) postulates that contention
among the banana-exporting elites from Guayaquil and the oil wealth in Quito made the
democratization process in Ecuador only “partially successful” (p63). Given the above
information public sector bureaucracy growth can be interpreted as power consolidation
among the resource enriched regime and its supportive elites. However, if we consider
that the military rule only lasted five years and ended before peak oil was reached, we
might consider oil wealth as a tool in the democratic process and the public sector growth
in Quito a step in this direction.
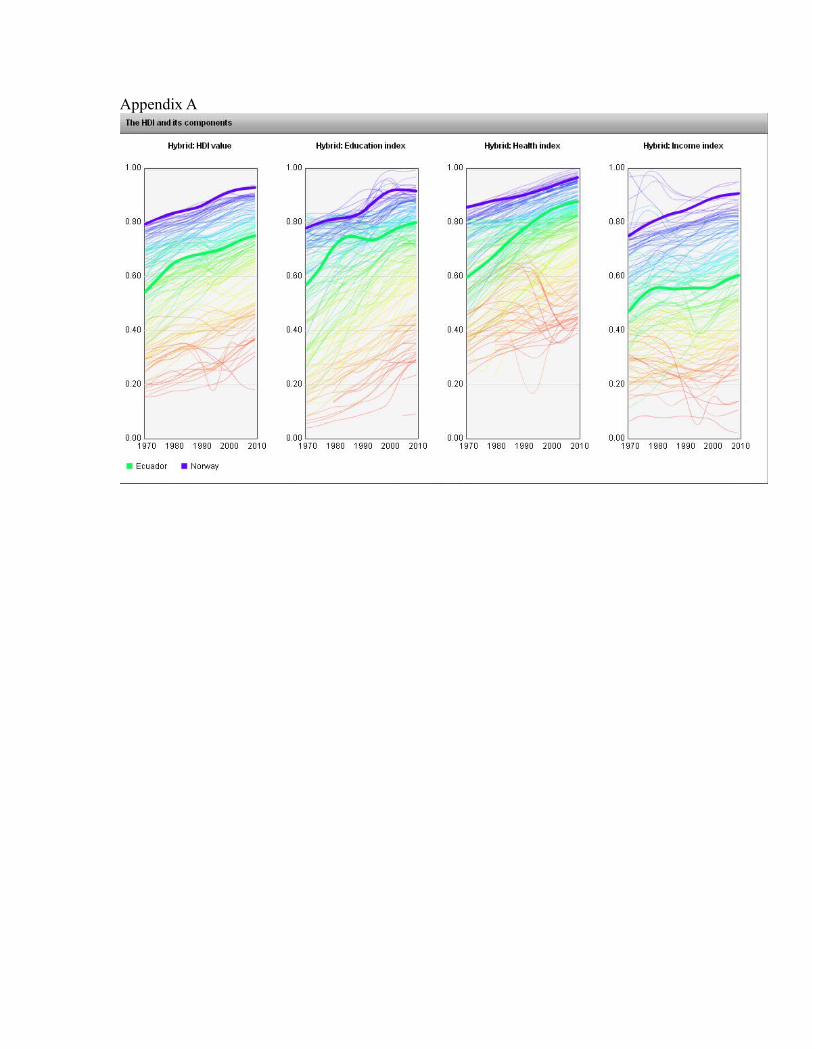
An indicator of second theory proposed above can be demonstrated using the
Human Development Index. Stevens (2003), a survey of resource curse literature,
proposes that resource curse analysis needs an additional measuring stick, one that goes
beyond measuring economic welfare and measures “peoples’ well-being” (p6.). Stevens
(2003) uses the Human Development Index as prepared by the United Nations
Development Programme. The following diagram shows the dramatic improvement in
Ecuador’s HDI rating during the oil boom.
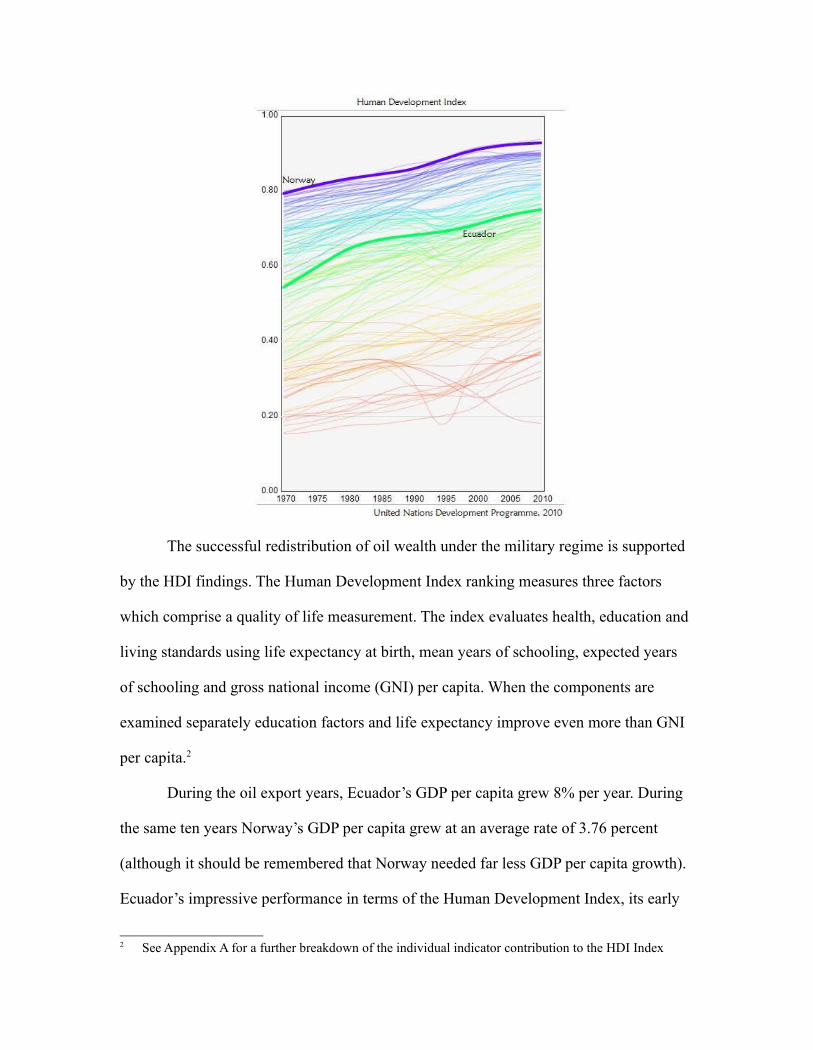
The successful redistribution of oil wealth under the military regime is supported
by the HDI findings. The Human Development Index ranking measures three factors
which comprise a quality of life measurement. The index evaluates health, education and
living standards using life expectancy at birth, mean years of schooling, expected years
of schooling and gross national income (GNI) per capita. When the components are
examined separately education factors and life expectancy improve even more than GNI
per capita.2
During the oil export years, Ecuador’s GDP per capita grew 8% per year. During
the same ten years Norway’s GDP per capita grew at an average rate of 3.76 percent
(although it should be remembered that Norway needed far less GDP per capita growth).
Ecuador’s impressive performance in terms of the Human Development Index, its early
2 See Appendix A for a further breakdown of the individual indicator contribution to the HDI Index
return to democratic rule (as compared to other Latin American countries) and its stable
economic performance since peak oil should demonstrate to any critical observer that the
ruling military regime did, in fact, implement policies contrary to those predicted by Ross
(2001).
Theory of Escape: Good v. Bad Production Models
Karl (1997) proposes that resources shape institutions and often favor elite
enrichment. Decisions, shaped by the rational actors who seek to improve their own
political clout or personal wealth, often result in petrodollar dependent policies. These
policies are often targeted at popular public works and consolidating power among the
incumbency governments. They do not favor secondary industry improvement and state
entrepreneurship. Where states direct resource rents is determined by government policy.
Government policy and development plans depend upon the ability for the
government to plan for revenues. The ability to plan for revenues depends upon the
production model used. Therefore the production model employed is arguably the
greatest factor in determining future economic success. The governments of an oil
producing country and private production companies have an antagonistic
interdependency. The model a government chooses to employ will determine the degree
of control over activity and the ability of either party to plan for the future. For the
industry this is the ability to calculate profit returns on investment. For the government
this ability determines calculations about the future of the national economy and
implementation of sensible resource policy that will not deplete the resource too quickly.
The relationship is governed by two factors: the division of monetary gain and decision-
making control over the activity.
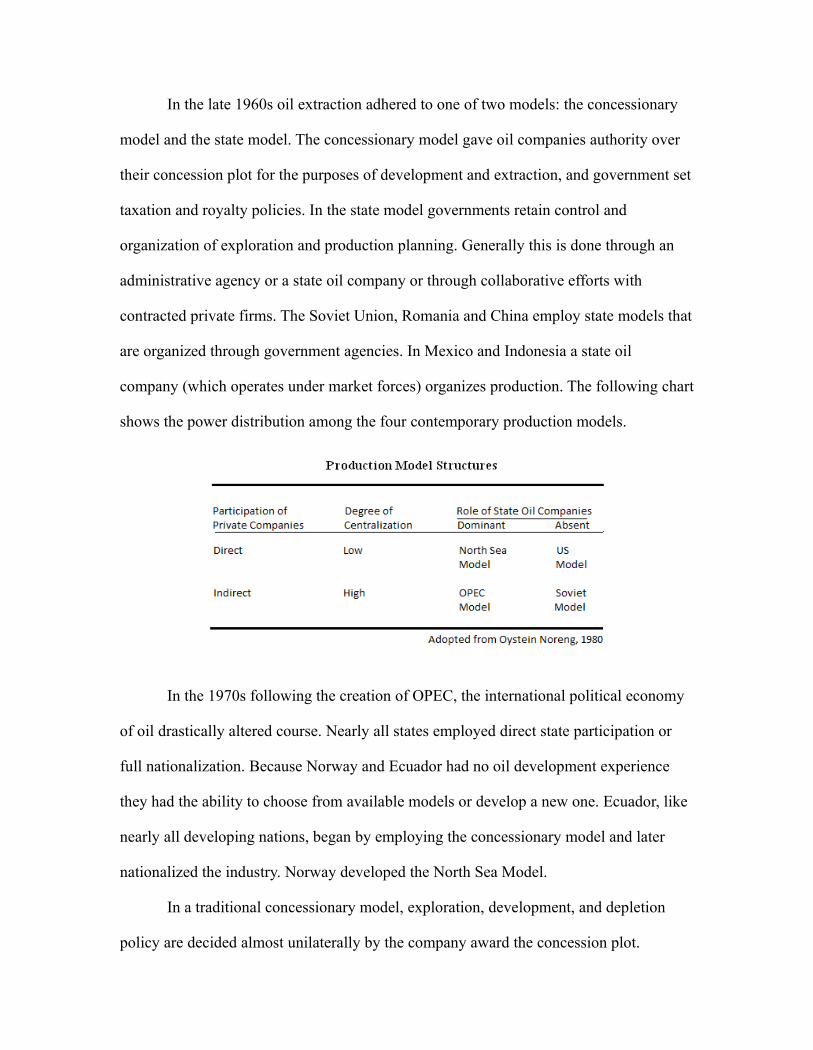
In the late 1960s oil extraction adhered to one of two models: the concessionary
model and the state model. The concessionary model gave oil companies authority over
their concession plot for the purposes of development and extraction, and government set
taxation and royalty policies. In the state model governments retain control and
organization of exploration and production planning. Generally this is done through an
administrative agency or a state oil company or through collaborative efforts with
contracted private firms. The Soviet Union, Romania and China employ state models that
are organized through government agencies. In Mexico and Indonesia a state oil
company (which operates under market forces) organizes production. The following chart
shows the power distribution among the four contemporary production models.
In the 1970s following the creation of OPEC, the international political economy
of oil drastically altered course. Nearly all states employed direct state participation or
full nationalization. Because Norway and Ecuador had no oil development experience
they had the ability to choose from available models or develop a new one. Ecuador, like
nearly all developing nations, began by employing the concessionary model and later
nationalized the industry. Norway developed the North Sea Model.
In a traditional concessionary model, exploration, development, and depletion
policy are decided almost unilaterally by the company award the concession plot.
Governments generally received a small share of rents of the oil based on company profit
margins. This development style manifested because most oil companies' experience was
developed in the United States (under strong laissez-faire tendencies) and later expanded
to developing countries where government's ability to resist multinational influence was
weak. Furthermore, until the oil revolution of the 1970s the control and taxation of an
industry trading in integral networks was out of the reach of governments.
This interdependence between companies and government is always unstable. It
changes based on the international context and government's acquired experience. Within
the framework of the concessionary system, it often breeds its own destruction. This has
been the case with many developing countries throughout history. In Ecuador it was
certainly the case. Jarrin and his team set twelve policy objectives in their pursuit of
sensible resource development. The very first objective set out to revise contracts and
activate hydrocarbon laws; it would be the source of much contention. The Hydrocarbon
law enacted October 1st 1971 by Velasco Ibarra was the first hydrocarbon law since 1937.
It was not retroactive. This meant that 8,434,434 hectares in the hands of concession
holders could not be touched. Some contracts had been negotiated to last until 2010
(Martz, 1987, p.102). However, as previously stated Jarrin's team succeeded in
renegotiating concessions and returning 5,694,153 hectares to Ecuadorian control. This
coincided with the creation of Ecuador's state oil company.
On June 14th 1974 Ecuador signed documents to purchase 25% of the Texaco-
Gulf holdings. After the Ecuadorian government took over Texaco-Gulf holdings CEPE
took on all the responsibilities of producing, transporting, industrializing and
commercializing the crude oil. CEPE was in charge of the country's largest oil reserve
and set policy from the largest oil field. CEPE goals and activities were to expand
substantially while the new five year plan was tied exclusively to petroleum revenue.
It is important to remember that the mere nationalization of a foreign-owned
corporation does not guarantee economic benefit for the state government. The
production policies of the newly formed state company and policies of collecting rents
from the other multinationals in operation are still very important. CEPE struggled with
its own capacities. It needed to borrow technological expertise from the same
multinationals toward which it had recently been so unfriendly (Martz, 1987). In a
system like Ecuador's, where the state oil company worked in cooperation with the
multinationals, the capacity of the leading state company is an essential factor in the
operation of the industry. CEPE limitations, then, were industry limitations. For Norway,
the North Sea model corrected this problem. It provided private capital for exploration
and lent expertise to the Norwegian production companies, all while Norway retained
control over depletion policy.
The North Sea Model
In addition to the international interest in North Sea oil the Norwegian
divergence from historical production models is probably due to the fact that Norway
was a fairly developed democracy and with a history of strong government participation
in economic welfare. Participation in economic decision making in the private sector was
not new to Norway. Moreover, in Norway the government had an additional goal. They
wanted to learn the microeconomic complexities of the industry, rather than solely
manage the macroeconomic implementation of rents. Beyond the government's ambitions
and economic management tendencies Norway presented two additional forces:
organized social interests and a consolidated trade union movement. All these factors
contributed to the creation of the North Sea Model.
In the North Sea the allocation of concessions was not done through the
traditional process of auction because it did not give the government enough control over
the distribution process, and thus the concession system was discarded. The state system
was also discarded because the government lacked industry knowledge and expertise and
so the participation of private firms was a necessity. The North Sea model permits private
companies the ability to directly participate in exploration and production, and gives
them the right to dispose of the oil, but retains the right to assume production as the state
oil company after 10 years of deposit development. Key features of the North Sea model
include the contracting of private firms under state regulation, direct state participation
through a state oil company, and the long-term ability to introduce additional taxes
(Noreng, 1980). It should not be overlooked that the delegation of exploration and
operation to private firms implies a degree of decentralization of the resources not found
in the state model. Norway had to make the operation financially attractive to the
industry.
The advantage of the North Sea model is that the direct participation of foreign
companies lends experience and technology to the state as well as the utilization of
private capital. The disadvantage however is that the state retains the right to manage the
operations yielding cumbersome problems of control. Government creates a system of
direction and regulation through complex legal proceedings to influence the
microeconomic behavior of the foreign companies operating in their territory. This
process has the potential to build inefficiencies and hindrances for the oil companies as a
result of fickle or partisan political pressures. However, this process should not be seen as
entirely unattractive to the companies. In the long run companies should benefit from the
security of a stable government and the predictability of enduring policy.
Unlike the North Sea model, which requires that multinationals lend their
expertise and technology to the state, Ecuador’s concessionary, and later state model,
made Ecuador dependent on foreign expertise and technologies. Ecuador, like Venezuela,
had to fight to regain control over concessions and policy. Furthermore, the North Sea
model lent industry success to Norway because. As we have seen, Norway retains the
right to operations after ten years of production. In addition, Norwegian law stipulates
that Norwegian firms are to be contracted for secondary industry needs should the
national firms be as efficient and cost-effective as outside firms (Noreng, 1980).
Ecuador, it seems, had no such stipulations for capturing externalities. However,
Ecuador did successfully utilize rents for secondary industry assistance. Corkill (1987)
writes that the Ecuadorian “state became a major economic entrepreneur and encouraged
the import of high-level technology to establish a petrochemical industry as well as motor
car assembly plants and other capital goods industries” (p64). According to this evidence
Ecuador did not fall into a trap of relying on oil rents as the only source of income
generation, and it did pursue the expansion of secondary industries. Most importantly,
Ecuador was successful in growing its manufacturing sector. The manufacturing sector
grew at an average rate of 10% and by the end of 1970s comprised 25% of exports
(Corkill, 1987). Ecuador, it seems, did not suffer from the Dutch Disease, rather it
operated contrary to Dutch Disease predictions. Despite model choice and Karl’s
prediction about resource rent usage, Ecuador seems to have made good policies
decisions regarding rent re-investment. In 1974 Ecuador's GNP growth was the highest in
all of Latin America (Martz, 1987) which included several other oil-export dependent
countries. Ecuador, temporarily, was a clear resource winner.
Karl (1997), if related to model choice, would propose that the institutional
incentive structure would not favor secondary industry growth and state
entrepreneurship. These results should be interpreted as evidence against the predictions
of Karl (1997). There is also strong secondary evidence seen in the creation of the
National Development Fund, the Ecuadorian Development Bank, and the Human
Development Index improvement cited above. The creation of these entities also does not
follow from the institutional rent seeking predicted by Karl (1997).
Conclusion
According to resource curse literature, Ecuador is an example of a worst case
scenario. It developed oil under a military regime and later a presidential system. It had a
concessionary production system, and is a developing country. Despite these components
Ecuador was one of Latin America’s fastest growing economies in the 1970s and its GDP
per capita model Norway's GDP per capita growth until Ecuador reached its peak oil.
Moreover, unlike Venezuela and other resource dependent countries, Ecuador has had
steady growth since it reached peak oil.
Norway is the exceptional case, and it is always cited in resource curse literature
as the outlier. Its growth is impressive even at its already elevated level. The well-
developed institutions of Norway coupled with its economic stability resulted in
successful production and rent management. Furthermore, its parliamentarian system and
almost non-existent corruption created a situation in which the government revenues
could be equally distributed throughout the society. The overall capture of oil rents was
estimated in 2010 to amount to 50% which Norway considers a success (from oil and
gas, 2009). However, until analysis is complete on a post-peak oil Norway we can only
estimate that it has performed remarkably well.
As we have seen Ecuador was praised by the World Bank for its oil development
policies, it lead the way in democratization in Latin America, and its drastic improvement
in quality of life (as given by the Human Development Index) is impressive. However, by
the 1980s Ecuador had entered into crisis. The gross domestic product growth decline,
which fell by 3.3% in 1983, is cited by Corkill (1987) as the example of how “in
retrospect oil wealth was mismanaged” (p64). He writes that the mismanagement took
the form of rapid depletion of reserves, growth in domestic consumption (encouraged by
unrealistically low fuel subsidies), an intensified dependence upon imported technology
and foreign capital, vulnerability to multinationals, and corruption in the form of fuel
smuggling to neighboring countries. Yet given Ecuador’s overall steady GDP growth we
can consider these effects to be low. Most importantly, the decline in the 1983 GDP cited
by Corkill is most probably a direct product of oil price plunges of 1983, to which any
oil-export dependent country would be incredibly vulnerable. Given that the case study
results show that neither “rich or poor,” “dictatorship or parliamentarian regimes,” nor
“production model” choice play a significant role in economic success during oil
exporting years. A reader should question if the “winners” and “losers” of the resource
curse should only be evaluated once they have reached peak oil. Peak oil seems to be the
most significant factor contributing to Ecuador’s deceleration in growth rates.
An even more compelling argument for evaluation of performance post-oil is the
evaluation given by Larsen (2005). Larsen (2005) concludes “Norway might have
escaped the curse. However, data suggest a slow-down at the end of the period, opening
the possibility of a late onset of the curse.” Larsen concludes “if so, rich countries are not
immune” (p75). The implications of a Norwegian slow-down after peak oil might suggest
that resource export is almost never advisable.
Norway reached its oil peak in 2010 and time will only tell if it has recaptured
enough of the rents in the international financial market to justify the extraction of its oil.
One benefit that may sustain the Norwegian growth trajectory is that Norway did a
superb job of developing vertical integration of its oil industry and capitalizing on the
positive externalities, such that Norwegian firms in 2009 were contracted to contribute to
the deep sea extraction activities of the Russian oil in the Barents Sea.
I suggest further research in regards to the production model used in Norway,
because if Norway sustains its economic trajectory after peak oil it will most likely be a
as a result of the new model it developed. This is because Ecuador seems to have been
comparatively successful despite every other prediction of resource curse literature
investigated in this study. As we have seen Ecuador was not able to maintain GDP per
capita growth as compared to Middle income countries. However, its convergence to the
middle income trajectory may be explained by Sachs and Warner (1997). More research
is needed to determine if this is feedback from poor model choice.
Given this findings of this study several key questions remain. Was Ecuador truly
implementing “poor policy” or did Ecuador just simply run out of oil earlier? Will
Norway converge to steady state equilibrium or has it 1) controlled the effects of income
booms and 2) recaptured enough of the rents in the international financial market to
justify the current exporting practices? Most importantly, should Norway emerge a
“resource loser,” resource curse literature will be forced to answer the question of
whether resource exportation is ever advisable. If however, the future should prove that

Norway’s practice did in fact enable it to beat the resource curse, then future research
should focus on the possibility of applying the Norwegian production model to
developing countries.
Works Cited
Allingham and Burstein, M. M.L. (1976). Resource allocation and economic policy. London: The MacMillian Press LTD.
Anderson and Aslaksen (2008) Constitutions and the Resource Curse. Journal of Development Economics. 87(2), 227 – 246.
Ausland, John. (1979). Norway, Oil, and Foreign Policy. Boulder: Fredrick A. Praeger.
Corkill, D. (1985). Democratic politics in Ecuador, 1979-1984. Bulletin for Latin American Research, 4(2), 63 - 74.
Kimerling, J. (2006) Indigenous Peoples and the Oil Frontier in Amazonia: The Case of Ecuador, Chevrontexaco, and Aguinda v. Texaco. New York University Journal of International Law and Politics. 38(13:23), 413-664.
Larsen, E. (2004) Escaping the Resource Curse and the Dutch Disease: When and Why Norway Caught Up with and Forged Ahead of its Neighbors. Statistics Norway, Research Department. Discussion Papers No. 377
Martz, John. (1987). Politics and Petroleum in Ecuador. New Brunswick: Transaction Books.
Mehlum, H., Moene, K., Torvik, R. 2006. Cursed by Resources or Institutions? The World Economy. 29(8), 1117-31.
Mill, John Stuart (1843, reprint 2002). A System of Logic, University Press of the Pacific, Honolulu.
Noreng, Øystein . (1980). The oil industry and government strategy in the north sea. Boulder: Croom Helm.
Norges Bank Investment Management (NBIM), Government Pension Fund Global Annual report 2009. From oil and gas to national wealth. (2009).
Karl, Terry. (1997). The Paradox of Plenty. Berkeley: University of California Press.
Ross, Michael. (2001) “Does Oil Hinder Democracy?” World Politics, 53(3), pp. 325-361.
Torvik, R. (2009). Why do some resource-abundant countries succeed while others do not? Oxford Review of Economic Policy, 25(2), 241 - 256.
Yergin, D. (1991). The Prize: The Epic Quest for Oil, Money, and Power. New York: Simon & Schuster.
Appendix A